

Abstract
Sluggish cognitive tempo (SCT) is increasingly conceptualized as a transdiagnostic set of symptoms associated with poorer functional outcomes, although the extent to which SCT is associated with academic functioning remains unclear. This study recruited children based on the presence or absence of clinically elevated SCT symptoms, using a multi-informant and multi-method design to provide a comprehensive examination of academic functioning in children with and without clinically elevated SCT symptoms. Participants were 207 children in 2nd-5th grades (ages 7–11 years; 63.3% male), including 103 with clinically elevated teacher-reported SCT symptoms and 104 without elevated SCT, closely matched on grade and sex. A multi-informant, multi-method design that included standardized achievement testing, curriculum-based measurement (CBM), grades, classroom and laboratory observations, and parent and teacher rating scales was used. Children with elevated SCT symptoms had poorer academic functioning than their peers across most domains examined. Specifically, compared to children without SCT, children with elevated SCT had significantly lower grade point average (d = 0.42) and standardized achievement scores (ds = 0.40–0.77), poorer CBM performance including lower productivity (ds = 0.39–0.51), poorer homework performance and organizational skills (ds = 0.58–0.85), and lower teacher-reported academic skills (ds = 0.63–0.74) and academic enablers (ds = 0.66–0.74). The groups did not significantly differ on percentage of time on task during classroom observations or academic enabler interpersonal skills. Most effects were robust to control of family income, medication use, and attention-deficit/hyperactivity disorder inattentive symptoms, although effects for motivation and study skills academic enablers were reduced. This study demonstrates that children with clinically elevated SCT symptoms have wide-ranging academic difficulties compared to their peers without SCT. Findings point to the potential importance of assessing and treating SCT to improve academic outcomes.
Keywords: achievement, ADHD, cognitive disengagement syndrome, sluggish cognitive tempo
The negative impact that attention problems have on students’ academic functioning is substantial (Hinshaw, 1992; Spira & Fischel, 2005). Although attention-deficit/hyperactivity inattentive (ADHD-IN) symptoms strongly predict poorer academic performance (Willcutt et al., 2012), it has more recently been recognized that some children display a unique pattern of attentional difficulties that are not captured by the ADHD-IN symptom list. This cluster of attentional symptoms is referred to as sluggish cognitive tempo (SCT) and includes excessive daydreaming, confusion, seeming to be in a fog, and slowed behavior and thinking (Becker, Leopold, et al., 2016; Becker, Willcutt, et al., 2022). Although SCT is strongly related to ADHD-IN (meta-analytic weighted r = 0.63 in children), dozens of studies have found SCT symptoms to be distinct from ADHD-IN (for a meta-analysis, see Becker, Leopold, et al., 2016). Studies have also shown SCT to be distinct from other mental health dimensions (e.g., anxiety, depression, oppositionality; Becker, Luebbe, et al., 2014; Lee et al., 2014; Willcutt et al., 2014) and daytime sleepiness (Langberg, Becker, Dvorsky, & Luebbe, 2014). As such, SCT is increasingly conceptualized as a transdiagnostic set of symptoms that may be prevalent and impairing across numerous psychiatric disorders. Consistent with this possibility, emerging studies indicate that SCT is not only prevalent in children with ADHD (Barkley, 2013; Servera et al., 2018), but also in children with autism (Duncan et al., 2019; Mayes et al., 2021), depression (Servera et al., 2018), reading disorder (Hossain et al., 2022), and neuropsychology-referred children with various psychiatric and medical conditions (Jacobson & Mahone, 2019).
Despite being prevalent across numerous conditions, SCT is not routinely assessed or treated in the school context. This is in part because it is first important to understand whether children displaying clinical elevations in SCT have poorer academic performance than their peers, or a specific pattern of academic impairments. Yet even with mounting evidence linking SCT to mental health and social difficulties, it remains unclear the extent to which SCT is associated with poorer academic functioning (for a review, see Fredrick & Becker, 2022). Although a meta-analysis found a moderate association between SCT and academic impairment (weighted r = 0.44) (Becker, Leopold, et al., 2016), several factors limited the conclusions that could be drawn. First, many studies relied on global parent and teacher ratings of academic impairment, often with the same informant rating both SCT and academic impairment. Second, many earlier studies examining SCT and academic functioning, particularly in relation to standardized achievement scores, used very brief, ad-hoc measures of SCT. Third, given initial interest in SCT as a potential qualifier within ADHD, studies often examined the dimensional association of SCT with academic functioning in samples initially recruited for ADHD. As noted by Barkley (2013), examining SCT in individuals initially recruited for ADHD “creates an automatic confound of the SCT symptoms with the ADHD-IN symptoms making it difficult to identify distinctive features that may be associated with SCT” (p. 162). Accordingly, the present study used an SCT measure with strong psychometric properties to recruit children based on the presence or absence of SCT, using a multi-informant and multi-method design to provide a comprehensive examination of academic functioning in children with and without clinically elevated SCT symptoms.
Academic Achievement and Grades
In studies examining the dimensional relations between SCT and standardized academic achievement scores in children, mixed findings have been reported. Two studies using very brief measures of SCT did not find an association between SCT symptom scores and reading, spelling, or math achievement (Becker & Langberg, 2013; Marshall et al., 2014). In contrast, two studies using measures specifically designed to assess SCT found SCT symptom scores to be significantly associated with poorer math, word reading, and reading comprehension achievement, even after controlling for IQ and ADHD symptom severity (Tamm et al., 2016; Willcutt et al., 2014). Willcutt et al. also found SCT symptom scores to be most strongly linked to poorer written language achievement. Other studies found SCT symptoms to be negatively associated with math but not reading achievement (Bauermeister et al., 2012) or, conversely, reading but not math achievement (Becker et al., 2018). Studies are needed to determine if children with elevated SCT have a distinct profile in terms of academic achievement difficulties.
Three studies have examined SCT in relation to grade point average (GPA) as an ecologically valid measure of academic performance. First, in a sample of college students, SCT but not ADHD-IN symptoms were uniquely associated with lower self-reported GPA (Becker, Langberg, et al., 2014). Second, in children with and without ADHD, both SCT and ADHD-IN symptoms were uniquely associated with lower parent-reported grades (Willcutt et al., 2014). Third, in a sample of 52 adolescents with ADHD, parent-reported SCT symptom scores were unassociated with GPA obtained from school report cards, whereas teacher-reported SCT symptoms specific to low initiation/persistence were uniquely associated with lower GPA (Langberg et al., 2014). However, the low initiation/persistence items utilized in the latter study do not load separately from ADHD-IN items (Jacobson et al., 2012; Penny et al., 2009) and are thus not considered optimal items for assessing SCT (Becker, 2021). It therefore remains unclear whether SCT is associated with lower GPA as derived from school records.
Curriculum-Based Measurement and Observed Time on Task
It has been suggested that children with SCT may have more difficulty with academic productivity (e.g., number of problems completed) as opposed to academic accuracy (e.g., percent of problems completed correctly; Becker, Ciesielski, et al., 2016), although no study has directly tested this hypothesis. Furthermore, parent- and teacher-report measures are likely inadequate for assessing the distinction between accuracy and productivity whereas curriculum-based measurement (CBM) is particularly well-suited to disentangling these different aspects of academic performance. We are unaware of any study that has used direct observation to assess the association between SCT and time on task behavior.
Organization and Homework
Few studies have examined whether SCT is associated with more fine-grained measures of behaviors relevant for academic performance, including organization and homework problems. In two samples of youth with ADHD, SCT symptoms were significantly associated with both parent- and teacher-rated organization problems above and beyond ADHD symptom severity (Langberg, Becker, & Dvorsky, 2014; McBurnett et al., 2014). These studies reported conflicting findings for whether SCT symptoms were (Langberg, Becker, & Dvorsky, 2014) or were not (McBurnett et al., 2014) uniquely associated with parent-reported homework problems, although once again the significant finding linking SCT with homework problems was driven by a low initiation/persistence factor that does not assess SCT as distinct from ADHD-IN. Another study of youth with ADHD found those with ADHD predominantly inattentive type and high SCT symptoms had the highest level of parent-reported homework problems (Marshall et al., 2014).
Academic Skills and Academic Enablers
Very few studies have examined SCT and teacher-report of children’s academic skills, which include broad aspects of achievement compared to grade-level expectations in addition to component skills such as punctuation and grammar (reading/language arts skills), mental math and pattern analysis (mathematics skills), and identifying patterns, developing a solution to a problem, and categorization and generalization (critical thinking skills). A study of school-aged children found teacher-reported ADHD-IN, but neither teacher- nor child-reported SCT, to be uniquely associated with teacher ratings of academic skills (Becker et al., 2015). Studies have yet to consider SCT in relation to specific domains of academic skills such as reading/language arts, math, and critical thinking.
Academic enablers are behaviors that facilitate learning, including interpersonal skills (e.g., working effectively in small and large groups), engagement (e.g., participating in class discussions), motivation (e.g., being goal-oriented and looking for ways to academically challenge self), and study skills (e.g., preparing for tests and taking notes in class). Studies with college students have found SCT to be uniquely associated with poorer study skills (Flannery et al., 2017) and deficits in self-regulation learning strategies (i.e., using strategies including planning, monitoring, and maintaining effort when bored or confused; Shelton et al., 2019). However, ADHD-IN, but not SCT, symptoms were uniquely associated with expectancy learning strategies (i.e., beliefs that academic outcomes are a result of internal efforts) and value learning strategies (i.e., perceived importance and usefulness of accomplishing academic tasks; Shelton et al., 2019). A study conducted in adolescents with ADHD found one SCT factor (i.e., Slow) to be uniquely associated with lower homework motivation (Smith et al., 2019), although it was the same SCT factor described above that is comprised of items that fail to show discriminant validity from ADHD-IN. A study of children with ADHD found SCT to be uniquely negatively associated with a composite teacher-report measure of academic enablers, above and beyond ADHD symptom severity (McBurnett et al., 2014). We are unaware of any studies that have examined academic-specific interpersonal skills, though two studies found SCT to be uniquely associated with lower teacher-reported but not parent-reported social skills (Bauermeister et al., 2012; McBurnett et al., 2014). Numerous studies have found children with SCT to be socially withdrawn and less socially engaged (Becker et al., 2019; Carlson & Mann, 2002; Marshall et al., 2014; Willcutt et al., 2014). It is thus likely that engagement is an academic enabler that may be particularly lacking in children with elevated SCT symptoms as compared to their peers without SCT.
Present Study
This study aims to add to the limited literature examining SCT and academic performance by using an SCT measure with strong psychometric properties to compare children with and without clinically elevated SCT symptoms on a range of academic measures. Specifically, a multi-informant, multi-method design was used that included standardized achievement testing, CBM, school records, classroom and laboratory observations, and parent and teacher rating scales. Regarding observations, we used two methods to code time on task. First, as in previous work conducted in children with ADHD (Froehlich et al., 2014), we used a math analogue task completed during a laboratory visit to examine math productivity and accuracy in addition to coding time on task while children performed the math task. Second, we conducted classroom observations and used a standardized coding system to assess academic engaged time. We expected children with SCT to have poorer academic performance than children without SCT across the domains examined, with largest effects in measures capturing fluency and productivity given evidence linking SCT to slower performance on timed tasks (Jacobson & Mahone, 2019).
Method
Participants
Children were recruited from 24 elementary schools in three school districts in the Midwestern United States during the 2016–19 academic years. For all schools, the same general procedure was followed. After obtaining school district and principal permissions, all teachers of 2nd to 5th grade classrooms were invited to participate in the project. Teachers were given the option to opt out and those who opted out (n = 56) were not enrolled in the study. If teachers agreed to participate (n = 398), parents of all children in their classroom (n = 10,275) were sent an opt-out letter which indicated that their school was participating in a study to learn more about how children’s concentration at school impacts academic and behavioral functioning, and that as a first step teachers would be completing a rating form regarding the concentration of each child in their classroom. Parents were informed that a subset of children would be invited to participate in a larger study and that more information would be provided at that time. For children whose parents did not opt out, teachers completed the SCT scale of the Child and Adolescent Behavior Inventory (CABI; described below) via Research Electronic Data Capture (REDCap), a secure, web-based application designed to support data capture for research studies (Harris et al., 2009). Teachers only completed the survey for students who (a) did not have significant uncorrected visual, hearing, or speech impairments; (b) were not known to be on the autism spectrum; and (c) did not spend the majority of the day outside of the general classroom.
CABI data were collected for 7,613 participants (Becker et al., 2020; see Figure 1 for a flow diagram). To establish the two groups, the CABI SCT data from the six cohorts were combined and an SCT T-score was generated. Children with a T-score > 70 were considered to be clinically elevated on the SCT scale (n = 471) and children with a T-score in the 47–53 range were considered as potential comparison participants (n = 1,425). For the comparison group, T-scores surrounding the mean were selected (rather than very low T-scores) to avoid having a “supernormal” comparison group (Hinshaw, 2002; Kendler, 1990). After identifying potential participants in both the SCT and comparison groups based on the teacher screening survey, a school liaison at each school (e.g., school counselor) was provided with a list of those students and served as the contact between the school and the research team. Specifically, the school liaison attempted to contact caregivers of students in the SCT and comparison groups to obtain permission to share contact information with the study team so the family could learn more about the study if interested. After the school liaison contacted and identified families willing to be contacted by the research team, participants in the clinically elevated SCT group were invited by the research team to participate on a first-come, first-serve basis. Once a parent of a child with a clinically elevated SCT score agreed to participate, the research staff then attempted to match the child with a comparison child of the same sex and in the same grade (96.6% of the sample was matched on sex and grade).1 Inclusion criteria for both groups were being in Grades 2–5, receiving education in a general education classroom for the majority of the day, and a standardized score > 75 for overall intelligence on the KBIT-2. In addition, children were excluded if the parent reported a previous diagnosis of autism spectrum disorder or the child met threshold for an autism symptom on the K-SADS autism module screener given that students with autism have distinct educational challenges and needs. Other mental health disorders (i.e., ADHD, oppositional defiant disorder/conduct disorder, anxiety, and depression) were not exclusionary in either group to promote generalizability and to avoid concerns with recruiting a “supernormal” comparison group (Hinshaw, 2002; Kendler, 1990).
Figure 1.
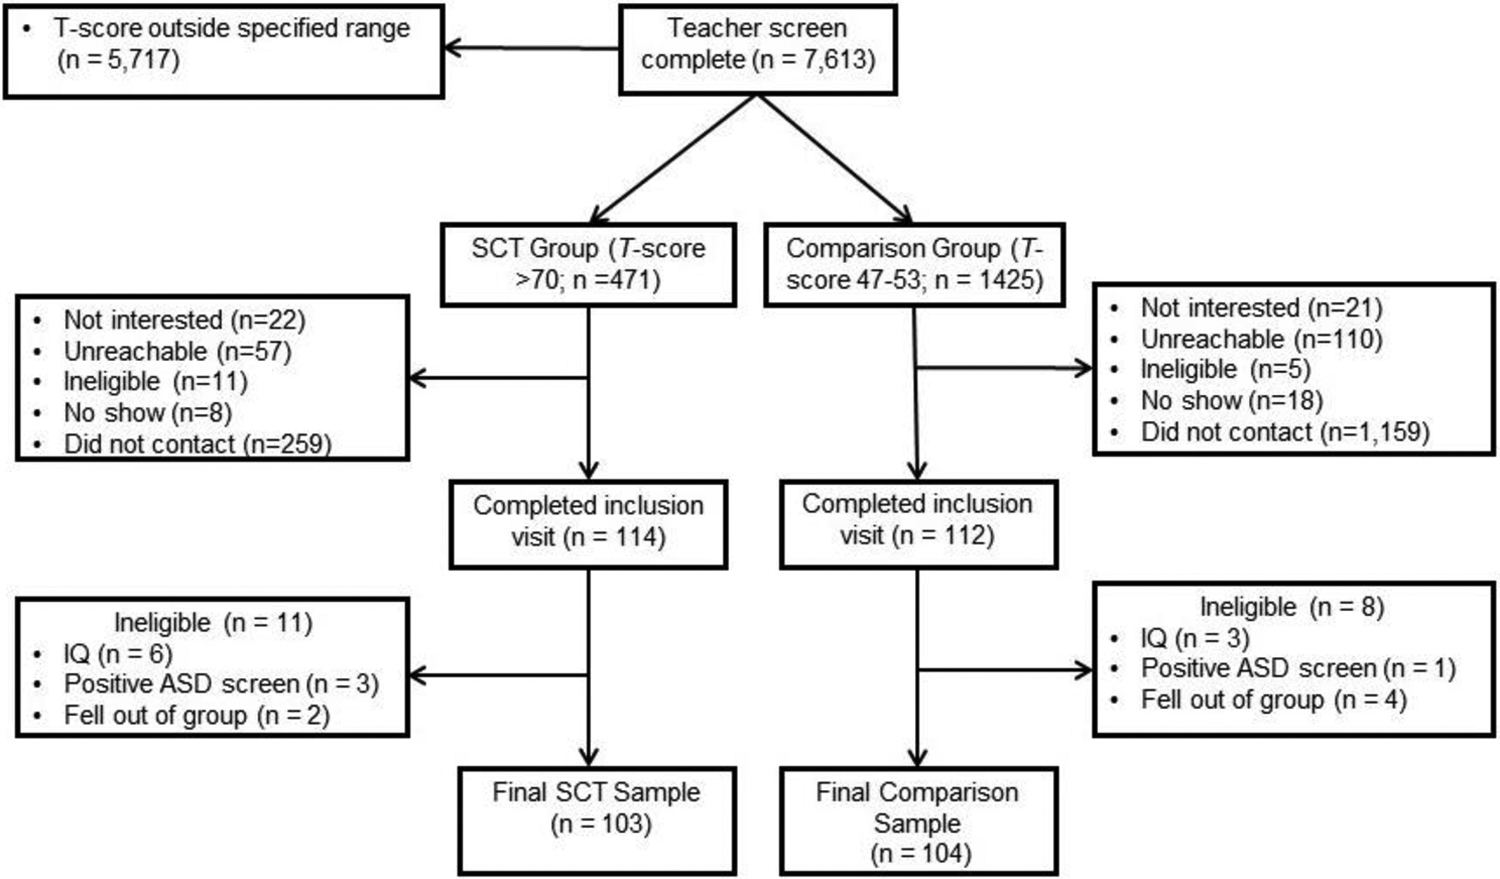
Study Flow Diagram
In all, 114 individuals with clinically elevated SCT consented to participate and 103 participants met inclusion criteria, and 112 comparison families consented and 104 met inclusion criteria. Participants were 207 children in Grades 2–5 (ages 7–11 years). Further description of the sample and comparisons between the SCT and comparison groups can be found in Table 1. As expected, given the design of the study, the groups did not differ on sex, grade, or age. The groups also did not differ on IQ, race, or ethnicity. The SCT group had lower family income, higher rate of ADHD diagnosis, and higher current medication use than the comparison group.
Table 1.
Sample Characteristics
| Total Sample (N = 207) | SCT Group (n = 103) | Comparison Group (n = 104) | Difference between SCT and Comparison | ||
|---|---|---|---|---|---|
| M (SD) | M (SD) | M (SD) | t | p | |
| Age | 8.85 (1.22) | 8.85 (1.29) | 8.85 (1.15) | t(205) = 0.05 | .961 |
| IQ | 105.01 (14.08) | 103.11 (14.81) | 106.88 (13.11) | t(205) = 1.92 | .056 |
| N (%) | N (%) | N (%) | χ 2 | p | |
| Sex | χ2(1) = 0.06 | .814 | |||
| Female | 76 (36.7%) | 37 (35.9%) | 39 (37.5%) | ||
| Male | 131 (63.3%) | 66 (64.1%) | 65 (63.1%) | ||
| Race | χ2(2) = 3.11 | .211 | |||
| White | 182 (87.9%) | 89 (86.4%) | 93 (89.4%) | ||
| Black | 9 (4.3%) | 7 (6.8%) | 2 (1.9%) | ||
| Multiracial | 16 (7.7%) | 7 (6.8%) | 9 (8.7%) | ||
| Hispanic/Latinx | 9 (4.3%) | 4 (3.9%) | 5 (4.8%) | χ2(1) = 0.11 | .744 |
| Family Income | χ2(6) = 16.58 | .011 | |||
| Up to $20,000 | 20 (9.7%) | 17 (16.5%) | 3 (2.9%) | ||
| $20,001 – $40,000 | 29 (14.0%) | 14 (13.6%) | 15 (14.6%) | ||
| $40,001 – $60,000 | 31 (15.0%) | 16 (15.5%) | 16 (15.4%) | ||
| $60,001 – $80,000 | 26 (12.6%) | 16 (15.5%) | 10 (9.6%) | ||
| $80,001 – $100,000 | 34 (16.4%) | 16 (15.5%) | 18 (17.3%) | ||
| $100,001 – $120,000 | 32 (15.5%) | 10 (9.7%) | 22 (21.2%) | ||
| Over $120,000 | 35 (16.9%) | 15 (14.6%) | 20 (19.2%) | ||
| Grade | χ2(3) = 0.24 | .971 | |||
| 2nd | 60 (29.0%) | 31 (30.1%) | 29 (27.9%) | ||
| 3rd | 48 (23.2%) | 24 (23.3%) | 24 (23.1%) | ||
| 4th | 51 (24.6%) | 24 (23.3%) | 27 (26.0%) | ||
| 5th | 48 (23.2%) | 24 (23.3%) | 24 (23.1%) | ||
| Psychiatric diagnoses | |||||
| ADHD | 124 (59.9%) | 81 (78.6%) | 43 (41.3%) | χ2(1) = 29.97 | <.001 |
| ODD/CD | 29 (14.0%) | 17 (16.5%) | 12 (11.5%) | χ2(1) = 106 | .303 |
| Anxiety | 27 (13.0%) | 16 (15.5%) | 11 (10.6%) | χ2(1)) = 112 | .290 |
| Depression | 3 (1.4%) | 2 (1.9%) | 1 (1.0%) | χ2(1) = 0.35 | .555 |
| Medication use (any) | 67 (32.4%) | 46 (44.7%) | 21 (20.2%) | χ2(1) = 14.15 | <.001 |
| ADHD methylphenidate | 37 (17.9%) | 27 (26.2%) | 10 (9.6%) | χ2(1) = 9.71 | .002 |
| ADHD amphetaminea | 17 (8.2%) | 12 (11.7%) | 5 (4.8%) | χ2(1) = 3.21 | .073 |
| ADHD nonstimulantb | 19 (9.2%) | 15 (14.6%) | 4 (3.8%) | χ2(1) = 7.13 | .008 |
| Anti-depressant/anxiety | 7 (3.4%) | 5 (4.9%) | 2 (1.9%) | χ2(1) = 136 | .279c |
| Antipsychotic | 7 (3.4%) | 3 (2.9%) | 4 (3.8%) | χ2(1) = 0.14 | 1.00c |
| Melatonin | 12 (5.8%) | 9 (8.7%) | 3 (2.9%) | χ2(1) = 3.25 | .072 |
Note. ADHD=attention-deficit/hyperactivity disorder. ODD/CD=oppositional defiant disorder/conduct disorder. For anxiety=presence of generalized anxiety disorder, social phobia, specific phobia, and/or posttraumatic stress disorder (PTSD). For depression=presence of major depression, dysthymia, and/or disruptive mood dysregulation disorder.
Includes amphetamine and mixed amphetamine salts.
Includes guanfacine, atomoxetine, and clonidine.
Significance based on Fisher’s exact test since at least one cell had an expected count less than 5.
Procedures
All procedures were approved by the Cincinnati Children’s Hospital Medical Center Institutional Review Board. Study participants completed an in-person visit with the parent and child and two subsequent classroom observations. The in-person visit included informed consent and assent, administration of intelligence, psychiatric functioning, academic achievement, CBM, and organizational skills and homework performance rating scales (see Measures). Participants taking psychiatric medication were not instructed to withhold medication on the day of their research visit. Following completion of the in-person visit, trained observers, who were masked to the child’s group assignment and unfamiliar to the child, went to the child’s school on two separate occasions and conducted a 15-min observation of the child during a core class (e.g., math, language arts). Teachers of children who met inclusion criteria were emailed a REDCap survey of rating scales.
Measures
Demographic Characteristics and Medication Use
Parents completed a demographic form to gather the information reported in Table 1 regarding their child’s sex, age, race, ethnicity, and family income. A clinician administered an adaptation of the Services Use in Children and Adolescents–Parent Interview (SCA-PI; Hoagwood et al., 2004) to assess any current medication use.
SCT
Child and Adolescent Behavior Inventory (CABI).
The SCT and comparison groups were created based on the teacher screening data on the 15-item SCT module of the CABI–Teacher Version (Burns et al., 2015). Using mother, father, and teacher ratings, the 15 CABI SCT items (e.g., “gets lost in own thoughts,” “easily confused,” “daydreams”, “low level of activity”) showed strong structural validity (including discriminant validity from ADHD and other psychopathology symptoms including depression, anxiety, and oppositionality), excellent reliability (internal consistency, test-retest, interrater), invariance (across a 1-month interval, sex of rater, community/clinical samples), and independent correlates relative to ADHD symptoms (for a review, see Becker, 2021). Cronbach’s alpha for the 7,613 screened participants was .97 on the SCT module. In addition, teachers of students participating in the larger study were asked to complete a set of rating scales that included the CABI ADHD-IN module which includes the 9 DSM-5 items for assessing ADHD-IN. Items were rated on a 6-point scale for the past month (almost never, seldom, sometimes, often, very often, and almost always). In the present study, ADHD-IN Cronbach’s α = .95.
Intelligence
Kaufman Brief Intelligence Test–Second Edition (KBIT-2).
The KBIT-2 is a culturally-sensitive standardized assessment that estimates verbal and non-verbal and overall intelligence (A. S. Kaufman & Kaufman, 2004). According to the KBIT-2 manual, the mean internal consistency reliability coefficient for children (ages 4–18 years) is .90 for the Verbal composite, .86 for the Nonverbal composite, and .92 for the IQ composite score. Mean test-retest reliability coefficients are .91 for verbal, .83 for nonverbal, and .90 for the IQ composite scores (A. S. Kaufman & Kaufman, 2004). Ample evidence of convergent validity has been reported, including correlations with other brief and full-scale tests of intelligence, as well as tests of academic achievement, at various age levels (Bain & Jaspers, 2010).
Psychiatric Functioning
Kiddie Schedule for Affective Disorders and Schizophrenia for School-Age Children (K-SADS).
The K-SADS (J. Kaufman et al., 2013) is a semi-structured diagnostic interview based on the DSM-5 with good reliability and validity (Jarbin et al., 2017). The disruptive behavior disorder, mood disorder, and anxiety disorder modules were administered by trained graduate students, postdoctoral fellows, or clinical psychologists. Additionally, the screening items for the autism spectrum disorder module were administered, and children were excluded if autism symptoms were endorsed and were not better accounted for by another disorder. Rating scale data support the concurrent validity of screens and K-SADS diagnoses (J. Kaufman et al., 1997). Interrater agreement in scoring screens and diagnoses was reported as high (range = 93%–100%; J. Kaufman et al., 1997). Test-retest reliability kappa coefficients were to be reported in the excellent range (.77–1.00) for present and/or lifetime diagnoses of major depression, bipolar disorder, generalized anxiety disorder, conduct disorder, and oppositional defiant disorder, and in the good range (.63–.67) for present diagnoses of posttraumatic stress disorder and attention-deficit hyperactivity disorder (J. Kaufman et al., 1997).
Academic Achievement and GPA
Wechsler Individual Achievement Test (WIAT-III).
The WIAT-III is a standardized achievement battery. The WIAT-III has strong psychometric properties in terms of both reliability (internal consistency ranges from .77 to .98, test-retest reliability ranging from .74 to .95) and validity (moderate to good correspondence with other tests of similar constructs; i.e., rs = .65–.80; Wechsler, 2009). Age-based norms were used to derive Standard Scores for Reading Comprehension, Basic Reading, Spelling, Numerical Operations, and Math Fluency subtests.
Woodcock-Johnson III Tests of Achievement (WJ-III).
The WJ-III (Woodcock et al., 2007) is a standardized measure of academic achievement. The Writing Fluency subtest assesses a students’ ability to formulate and write sentences quickly. Participants are provided three prompt words for each item and must construct as many grammatically correct sentences as possible in 7 min. The Writing Fluency subtest has good test-retest reliability (.75) and high inter-rater reliability (.98; Woodcock et al., 2007). Age-based norms were used to derive a Standard Score.
GPA.
Children’s school records were obtained at the end of academic year. Each child’s grades in core classes (i.e., math, reading/language arts, science, and social studies) were translated into a 4.0 scale. Specifically, a standardized system was used to convert any non-numeric grades to a 0 to 4 numeric scale. This was the case for letter grades (i.e., A = 4.0, B = 3.0, C = 2.0, D = 1.0, and F = 0.0) and descriptive grades (i.e., area of strength = 4.0, satisfactory progress = 3.0, progressing with help = 2.0, area of concern = 1.0). An overall GPA was calculated.
Curriculum-Based Measurement and Observed Time on Task
AIMSweb.
AIMSweb (AIMSweb, 2012) is a compendium of CBM used to assess basic academic skills and monitor student progress. CBM has been found to have high validity and reliability for measurement of student progress, including high concurrent validity with standardized measures. The Reading subtest involves students reading a grade-appropriate passage out loud for 1 min. Alternate-form reliability coefficients during field testing of passages in 2nd to 5th graders ranged from .83 to .88 (Howe & Shinn, 2002). Number of words read as well as percent accuracy are computed. The Maze Reading subtest is a multiple-choice task that students complete while reading silently for 3 min. Students select the best option from three words inside parentheses to make the sentence meaningful (e.g., for the sentence, “The dog [apple, broke, ran] after the cat,” the student would mark “ran”). The Maze Reading subtest has satisfactory evidence for alternate form reliability across 1-to-3-month intervals (r = .80; Shin et al., 2000) as well as criterion-related validity with the Reading subtest (r = .77–.86 for Grades 2–5; Fuchs & Fuchs, 1992) and standardized group achievement tests of reading (Jenkins & Jewell, 1993). The Maze Reading score was computed by dividing total task time (180 s) by the number of correct responses to get a rate of average time per correct response; higher scores indicate taking longer on average for each correct response.
Math Analogue Task.
The analogue math task is a naturalistic task modeled after math work undertaken in a typical classroom setting (e.g., self-directed classroom work or homework). Each participant first underwent an assessment to determine their math level (i.e., single digit addition, multiple digit addition, single digit multiplication, and multiple digit multiplication) using CBM methodology (Wright, 1992), then completed math worksheets at their own appropriate level for 20 min while being video recorded. Measures of math performance included math productivity (total number of problems completed) and math accuracy (number of math problems completed correctly divided by total number completed).
To assess time spent on-task, trained personnel coded video-recordings of each participant during the math analogue task. The coders used BORIS v4.1.1 (Friard & Gamba, 2016) to record the onset and offset of each participant’s attention toward the task. A participant’s attention was coded as “off-task” when their visual gaze left the paper for 2 or more s. However, visual gazes away from the worksheet while counting aloud or counting on one’s fingers were not coded as “off-task.” Percentage of time on-task was calculated by summing the time on-task and dividing by the total length of the recording from the start of the task until time elapsed or all worksheets were completed. Coding training included teaching coders the code definitions and having them code multiple “gold standard” videos. Coders discussed any discrepancies with the master coders and continued practicing. Coders were able to code independently after they achieved at least 90% reliability with master coders on two sequential gold standard videos. Interrater reliability was assessed by having 10% of videos double-coded by a master coder and assessed by intraclass correlation coefficients (ICC; ICC range across coders: 0.95 – 0.98, M = 0.97).
Classroom Observations.
The Systematic Screening of Behavior Disorders (SSBD; Walker & Sevenson, 1990; Walker et al., 2014) was used to conduct classroom observations of participants within 1 month of their initial research visit. The SSBD is one of the most frequently used and well-validated coding systems used in the school setting. The Academic Engaged Time (AET) measures the amount of time the student is engaged in academic material during independent seatwork. Trained, masked observers coded whether a child was on-task or off-task during two continuous 15-min observations, conducted at least 4 days apart. Specifically, children were coded as off-task if they looked away from work or their teacher for more than 3 s, or the child was very clearly off-task (e.g., gets out of chair and goes under desk). AET was computed by dividing time on-task in seconds by the total observation time (900 s) and multiplied by 100. Inter-rater reliability was coded for 20% of the observations during each semester. If raters differed by more than 5%, retraining and coaching was required prior to conducting additional observations. On average the difference between the raters and the master coder was less than 1% (M = 0.5, SD = 3.6).
Organizational Skills and Homework Performance
Children’s Organizational Skills Scale (COSS).
The COSS is a rating scale completed by parents in the current study. The parent version of the COSS includes 66 items rated on a 4-point scale that yields a total score (i.e., general deficits in organizational skills; 32 items) and three factors measuring Memory and Materials Management (i.e., skills of tracking assignments, recalling due dates, and managing papers and other supplies; 10 items), Organized Actions (i.e., use of aids such as calendars and routines such as lists; 10 items), and Task Planning (i.e., ability to meet deadlines and spell out steps needed to compete tasks; 6 items; Abikoff & Gallagher, 2009). The subscale items do not overlap with items comprising the total score. Internal consistency coefficients range from .70 to .98, and 2- to 4-week test-retest reliability range from .88 to .99 (Abikoff & Gallagher, 2009). T-scores were generated for the total score and each COSS subscale.
Homework Performance Questionnaire (HPQ).
The HPQ (Power et al., 2015) is a parent-report (HPQ-P; 27 items) and teacher-report (HPQ-T; 22 items) scale developed to allow multi-informant assessment of students’ homework performance. In addition to assessing descriptive information (e.g., amount of time spent on homework), the HPQ-P and HPQ-T generate separate factors of student homework self-regulation and student competence, and the HPQ-P also has a teacher support factor. HPQ factors are derived from factor analysis and scores correlate with measures of homework behavior and academic skills, as well as academic achievement (Power et al., 2015).
Academic Skills and Academic Enablers
Academic Competence Evaluation Scales (ACES).
The ACES is a norm-referenced teacher-report measure assessing a wide range of academic behaviors (DiPerna & Elliott, 2000). The 73-item ACES has two scales: Academic Skills (33 items) and Academic Enablers (40 items). The Academic Skills scale includes three subscales: Reading/Language Arts (e.g., processing of written text, quality of oral communication), Mathematics (e.g., use and application of numbers and mathematical concepts), and Critical Thinking (e.g., higher-order thinking skills reflecting analysis, synthesis, and investigation). The Academic Enablers scale includes four subscales: Interpersonal Skills (e.g., communicative and cooperative behaviors necessary to interact with other students or adults in the classroom, such as working effectively in small and large groups and being responsive to teacher suggestions), Engagement (e.g., student’s level of active participation in classroom instruction such as asking questions, volunteering answers, and leading in groups), Motivation (e.g., student’s initiative and persistence regarding academic subjects, such as preference for challenging tasks and goal-directed behavior), and Study Skills (e.g., behaviors and skills that facilitate the processing of new information, including work preparation, work completion, and work review). Internal consistency (ranging from .92 to .98) and test-retest stability (ranging from .70 to .92) were high for the ACES, and correlational analyses with measures of academic (rs ranging from .71 to .82) and social skills (rs ranging from .49 to .74) indicated that scores from the ACES are valid indicators of student academic competence (DiPerna & Elliott, 1999, 2000).
Analyses
The analyses used STATA statistical software (version 16). For the first set of analyses, each academic measure was regressed on group membership (SCT group = 0 and comparison group = 1) to determine whether students with and without SCT (matched on sex and grade) differed across academic domains. Cohen’s d was calculated as a measure of effect size, with .20, .50, and .80 considered small, medium, and large effects, respectively (Cohen, 1988). The point biserial correlation was also reported as a measure of effect size, with .10, .20, and .37 considered small, medium, and large effects (Cohen, 1988). The inclusion of the point biserial correlation as a measure of effect size for group membership (SCT group vs. comparison) for these analyses allowed for a comparison to the semi-partial correlation as measure of effect size for group membership (SCT group vs. comparison group) with various covariates in the regression model (see next paragraph).
Next, to determine whether group differences identified in the first set of analyses were robust to covariate adjustment, particularly ADHD-IN symptom severity, a second set of analyses were conducted with teacher-reported ADHD-IN symptoms, family income, and medication use (i.e., a dichotomous variable of whether the child was taking any medication as detailed in Table 1) as control variables. Family income and medication use were used as control variables given that the groups differed on these variables (see Table 1), and teacher-rated ADHD-IN was also a control variable given the established, strong association between ADHD-IN symptoms and academic functioning (Willcutt et al., 2012). As noted earlier, these multiple regression analyses also reported the semi-partial correlation (spr) as a measure of effect size for group membership (SCT group vs. comparison) to determine the extent the effect size for group membership was reduced by the covariates (i.e., a semi-partial correlation smaller than the point biserial correlation indicates the extent the three covariates reduced the effect size for group membership).
In addition, to control for multiple testing in each set of analyses, we used a false discovery rate (FDR) correction (Bejamini & Hochberg, 1995). All significant findings remained significant (p < .05) when the FDR correction was applied; as such, uncorrected p-values are presented in the Results section and tables. All analyses used the cluster robust standard error (i.e., children nested within 139 teachers where each teacher rated one to five children, M = 1.49, SD = 0.81). There were little missing data across the academic outcome variables (< 1% across all academic outcome variables). Specifically, six measures had no missing data across participants, 11 measures had missing data for 1 out of 207 participants, six measures had missing data for 2 out of 207 participants, three measures had missing data for 3 out of 207 participants, two measures had missing data for 4 out of 207 participants, and one measure had missing data for 5 out of 207 participants. Participants with missing data for a measure were not included in the analysis for that academic outcome variable. This study was not preregistered. Data are available from the corresponding author upon reasonable request and execution of a data use agreement.
A priori grant submission Monte Carlo simulation power analyses showed statistical power ≥ 0.80 for any two-group mean difference effect size of d ≥ 0.37 that explained (R2 = 0.20) 20% of response variable variance with a sample size of N = 190.
Results
Differences in Academic Functioning in Children with and without SCT
Table 2 shows the group difference results across measures of academic functioning. As summarized next, the SCT group was significantly associated with poorer academic functioning across all domains examined with only two exceptions (i.e., accuracy on the math analogue task and percent time on task during the classroom observations).
Table 2.
Differences in Academic Functioning between Children with and without Clinically Elevated Sluggish Cognitive Tempo
| Comparison | SCT | Group Difference | ||||||
|---|---|---|---|---|---|---|---|---|
| M | SD | M | SD | Estimate | SE | d (95% CI) | r | |
| WIAT-III | ||||||||
| Reading Comprehension | 103.92 | 12.41 | 95.82 | 12.50 | 8.11*** | 1.84 | 0.65 (.37, .93) | .31 |
| Basic Reading | 100.71 | 13.32 | 93.54 | 14.41 | 7.17*** | 1.93 | 0.52 (.24, .79) | .25 |
| Spelling | 99.48 | 12.82 | 92.91 | 13.59 | 6.57** | 1.86 | 0.50 (.22, .77) | .24 |
| Numerical Operations | 102.60 | 12.30 | 95.84 | 12.71 | 6.75*** | 1.66 | 0.54 (.26, .82) | .26 |
| Math Fluency | 99.76 | 12.96 | 89.63 | 11.53 | 10.13*** | 1.52 | 0.83 (.54, 1.11) | .38 |
| WJ-III | ||||||||
| Writing Fluency | 100.46 | 13.60 | 94.70 | 14.32 | 5.76** | 1.83 | 0.41 (.14, .69) | .20 |
| School Report Card | ||||||||
| GPA | 3.05 | 0.48 | 2.83 | 0.51 | 0.21** | 0.07 | 0.43 (.15, .70) | .21 |
| AIMSWeb | ||||||||
| Word Reading – Words Read | 105.27 | 34.72 | 86.38 | 41.99 | 18.90*** | 5.06 | 0.49 (.21, .77) | .24 |
| Word Reading – % Accuracy | 95.20 | 4.52 | 90.18 | 12.68 | 5.02*** | 1.31 | 0.53 (.25, .80) | .26 |
| Reading Maze – Time Per Correct | 13.45 | 9.14 | 25.93 | 33.78 | −12.47** | 3.55 | −0.51 (−.23, −.78) | −.25 |
| Math Analogue Task | ||||||||
| Productivity | 163.57 | 85.87 | 129.84 | 67.81 | 33.73** | 11.47 | 0.43 (.16, .71) | .21 |
| Math Accuracy | 88.51 | 26.05 | 88.98 | 23.13 | −0.47ns | 3.74 | −0.02 (−.25, .29) | −.01 |
| Percent Time on Task | 90.10 | 13.10 | 84.24 | 16.75 | 5.86** | 1.99 | 0.39 (.11, .39) | .19 |
| Classroom Observation | ||||||||
| Percent Time on Task | 81.13 | 12.84 | 79.63 | 15.06 | 1.51ns | 1.99 | 0.11 (−.38, .17) | .05 |
| HPQ Homework Performance | ||||||||
| Parent Report | 2.08 | 0.51 | 1.65 | 0.42 | 0.44*** | .06 | 0.94 (.65, 1.22) | .43 |
| Teacher Report | 4.46 | 1.02 | 3.48 | 1.22 | 0.98*** | .16 | 0.87 (.58, 1.16) | .40 |
| COSS Organization Problems | ||||||||
| Planning | 50.76 | 9.80 | 57.31 | 11.59 | −6.55*** | 1.50 | −0.61 (−.33, −.89) | −.29 |
| Organized Actions | 54.67 | 8.25 | 59.70 | 6.46 | −5.02*** | 1.05 | −0.68 (−.40, −.96) | −.32 |
| Memory Materials Management | 51.23 | 10.58 | 57.73 | 10.92 | −6.49*** | 1.46 | −0.60 (−.32, −.88) | −.29 |
| Total Score | 53.75 | 10.53 | 60.49 | 9.65 | −6.74*** | 1.41 | −0.67 (−.39, −.95) | −.32 |
| ACES Academic Skills | ||||||||
| Total | 2.83 | 0.67 | 2.30 | 0.70 | 0.53*** | .10 | 0.77 (.48, 1.05) | .36 |
| Reading/Language Arts | 2.84 | 0.71 | 2.24 | 0.80 | 0.60*** | .10 | 0.80 (.51, 1.09) | .37 |
| Math | 2.90 | 0.85 | 2.34 | 0.84 | 0.56*** | .12 | 0.67 (.38, .95) | .32 |
| Critical Thinking | 2.79 | 0.65 | 2.33 | 0.72 | 0.45*** | .10 | 0.66 (.38, .94) | .32 |
| ACES Academic Enablers | ||||||||
| Total | 3.32 | 0.72 | 2.78 | 0.65 | 0.54*** | .10 | 0.79 (.50, 1.07) | .37 |
| Interpersonal Skills | 3.75 | 0.81 | 3.49 | 0.78 | 0.27* | .12 | 0.33 (.06, .61) | .17 |
| Engagement | 3.26 | 0.89 | 2.64 | 0.91 | 0.62*** | .14 | 0.70 (.41, .98) | .33 |
| Motivation | 2.79 | 0.91 | 2.14 | 0.76 | 0.65*** | .12 | 0.77 (.49, 1.06) | .36 |
| Study Skills | 3.50 | 0.86 | 2.86 | 0.78 | 0.64*** | .11 | 0.78 (.50, 1.07) | .37 |
Note. The estimate is the unstandardized regression coefficient. For SCT group, 0 = SCT group, 1 = comparison group. A positive unstandardized regression coefficient, positive Cohen’s d value, and positive point-biserial correlation (r) signify the comparison group mean was higher than the SCT group mean (negative values for the regression coefficient, d, and point-biserial correlation signify the comparison group mean was lower than the SCT group mean). ACES = Academic Competence Evaluation Scales. COSS = Children’s Organizational Skills Scale. GPA = grade point average. HPQ = Homework Performance Questionnaire. SCT = sluggish cognitive tempo. WIAT-III = Wechsler Individual Achievement Test Third Edition. WJ-III = Woodcock-Johnson III Tests of Achievement.
p < .05;
p < .01;
p < .001.
Academic Achievement and GPA
The SCT group had significantly lower scores than the comparison group on Reading Comprehension (d = .65), Word Reading (d = .52), Spelling (d = .50), Numerical Operations (d = .54), Math Fluency (d = .83), Writing Fluency (d = .41), and GPA (d = .43); all ps were < .004.
Curriculum Based Measurement and Observed Time on Task
For AIMSweb Words Read and Percent Accuracy, the SCT group had significantly (ps < .001) lower scores than the comparison group (ds = .49 and .53, respectively). For AIMSweb Maze Reading Time Per Correct, the SCT group had significantly higher scores (indicating taking longer to complete their work) than the comparison group (d = −.51, p < .001). For the three Math Analogue Task measures, the SCT group had significantly (ps < .01) lower scores than the comparison group on the Productivity (d = .43) and Percent Time on Task measures (d = .39). The groups did not differ significantly on the task Math Accuracy (d = −.02) or the classroom observation measure of percent time on task (d = .11).
Homework Performance and Organization Skills
The SCT group had significantly (ps < .001) lower scores than the comparison group on both the parent and teacher HPQ (ds = .94 and .87, respectively). The SCT group had significantly (ps < .001) higher (more problematic) scores than the comparison group on the Planning (d = −.69), Organized Actions (d = −.68), Memory Materials Management (d = −.60), and total score (d = −.67) scales of the COSS.
Academic Skills and Academic Enablers
The SCT group had significantly (ps < .001) lower scores than the comparison group for the ACES Academic Skills total score (d = .77) as well as the Reading/Language Arts (d = .80), Math (d = .67) and Critical Thinking (d = .66) subtests. The SCT group also had significantly (ps < .001) lower scores than the comparison group for the ACES Academic Enablers total score (d = .79), Engagement (d = .70), Motivation (d = .77), and Study Skills subtests (d = .78). The SCT group was also rated lower on Interpersonal Skills (d = .33; p = .03).
Examining Group Differences Robust to Covariate Adjustment
In analyses including family income, medication use, and teacher ratings of ADHD-IN symptom severity as control variables, 21 of the 27 significant group differences remained significant (Table 3). A comparison of the semi-partial correlations in Table 3 to point biserial correlations in Table 2 show the amount the effects sizes for group membership (SCT group vs. comparison) were reduced by the inclusion of the three covariates.
Table 3.
Examining Group Differences Robust to Covariate Adjustment
| Outcome Measure | Income | Medication | ADHD-IN | SCT Group | |||||
|---|---|---|---|---|---|---|---|---|---|
| b | SE | b | SE | b | SE | b | SE | spr | |
| Standardized Achievement Tests & GPA Measures (higher scores higher skills) | |||||||||
| Reading Comprehension | 0.71 | 0.43 | −2.14 | 2.10 | −0.28 | 0.67 | 6.76** | 2.13 | .23 |
| Basic Reading | 0.30 | 0.57 | −2.50 | 2.18 | 0.54 | 0.81 | 6.85** | 2.29 | .21 |
| Spelling | 0.35 | 0.50 | −2.91 | 1.99 | 0.06 | 0.66 | 5.65** | 1.95 | .19 |
| Numerical Operations | 1.10 | 0.47 | 0.42 | 1.84 | −0.66 | 0.69 | 5.37** | 1.72 | .18 |
| Math Fluency | 0.67 | 0.47 | −2.12 | 1.69 | −1.29 | 0.67 | 7.80*** | 1.65 | .26 |
| Writing Fluency | 1.31* | 0.53 | −4.08 | 2.22 | −0.70 | 0.87 | 3.10 | 2.30 | .10 |
| GPA | 0.02 | 0.02 | 0.03 | 0.08 | −0.02 | 0.03 | 0.18* | 0.09 | .16 |
| Curriculum Based Measurement and Observed Classroom Time on Tasks Measures | |||||||||
| Word Reading-Words Read | 1.13 | 1.55 | 2.25 | 7.11 | −0.85 | 2.28 | 17.77** | 5.91 | .20 |
| Word Reading % Accuracy | 0.48 | 0.33 | −1.27 | 1.80 | −0.05 | 0.55 | 4.28** | 1.54 | .19 |
| Reading Maze-Time Per Correct | −1.33 | 0.83 | 4.53 | 4.41 | −0.85 | 1.37 | −11.09** | 3.34 | −.19 |
| Math Analogue-Productivity | −0.11 | 2.92 | 12.98 | 12.68 | −1.83 | 3.93 | 35.31** | 12.94 | .20 |
| Math Analogue-Accuracy | 0.17 | 0.91 | −3.62 | 3.54 | 1.44 | 1.15 | −0.11 | 3.71 | .00 |
| Math Analogue-% Time on Task | 0.01 | 0.01 | −0.04 | 0.03 | 0.00 | 0.01 | 0.04 | 0.03 | .12 |
| % Time on Classroom Tasks | −0.18 | 0.61 | 1.96 | 2.38 | −1.37 | 0.75 | 0.79 | 2.52 | .03 |
| Homework Performance (higher scores equal better performance) | |||||||||
| Parent Report | 0.03 | 0.02 | −0.12 | 0.07 | −0.07* | 0.03 | 0.32*** | 0.08 | .27 |
| Teacher Report | 0.06 | 0.04 | 0.05 | 0.16 | −0.46*** | 0.06 | 0.48** | 0.15 | .17 |
| Organization Skills (higher scores equal lower skills) | |||||||||
| Planning | −0.43 | 0.38 | 2.68 | 1.61 | 0.73 | 0.58 | −4.84* | 1.85 | −.19 |
| Organized Actions | −0.39 | 0.26 | 1.54 | 1.14 | 0.68 | 0.39 | −3.67** | 1.16 | −.21 |
| Memory Materials Management | −0.59 | 0.37 | 3.77* | 1.57 | 1.20* | 0.57 | −3.92* | 1.56 | −.16 |
| Total Score | −0.37 | 0.35 | 3.86* | 1.52 | 1.24* | 0.58 | −4.26** | 1.61 | −.18 |
| Academic Skills (higher scores equal higher skills) | |||||||||
| Total | 0.01 | 0.03 | −0.02 | 0.10 | −0.16*** | 0.04 | 0.36** | 0.11 | .22 |
| Reading/Language Arts | 0.02 | 0.03 | −0.02 | 0.11 | −0.14** | 0.04 | 0.45*** | 0.12 | .25 |
| Math | 0.02 | 0.03 | −0.06 | 0.13 | −0.19*** | 0.05 | 0.36** | 0.14 | .18 |
| Critical Thinking | 0.01 | 0.03 | 0.01 | 0.10 | −0.15*** | 0.04 | 0.30** | 0.11 | .19 |
| Academic Enablers (higher scores equal higher skills) | |||||||||
| Total | 0.01 | 0.02 | −0.03 | 0.07 | −0.37*** | 0.02 | 0.17+ | 0.09 | .10 |
| Interpersonal Skills | −0.01 | 0.02 | −0.11 | 0.10 | −0.35*** | 0.03 | −0.10 | 0.11 | −.05 |
| Engagement | −0.01 | 0.03 | 0.09 | 0.12 | −0.23*** | 0.05 | 0.43** | 0.14 | .20 |
| Motivation | 0.03 | 0.02 | −0.02 | 0.09 | −0.41*** | 0.03 | 0.21+ | 0.11 | .11 |
| Study Skills | 0.03 | 0.02 | −0.02 | 0.09 | −0.44** | 0.03 | 0.19+ | 0.10 | .09 |
Note. The b is the partial unstandardized regression coefficient. A positive (negative) sign for the partial unstandardized regression coefficient for SCT Group indicates that the mean for the SCT group was lower (higher) than the mean of the comparison group controlling for income, medication, and ADHD-IN symptom severity. The spr is the semi-partial correlation for SCT group (i.e., effect size for SCT controlling for income, medication, and ADHD-IN symptom severity). For SCT group, 0 = SCT group, 1 = comparison group. For medication, 0 = no prescribed medication, 1 = taking a prescribed medication. ADHD-IN = severity of attention-deficit/hyperactivity disorder inattention symptoms. SCT = sluggish cognitive tempo.
p < .060;
p < .05;
p < .01;
p < .001.
Academic Achievement and GPA
Controlling for ADHD inattention symptom severity, family income, and medication use, the SCT group remained significantly associated with Reading Comprehension (spr = .23), Word Reading (spr = .21), Spelling (spr = .19), Numerical Operations (spr = .18), Math Fluency (spr = .26), and GPA (spr = .16), all ps < .05. SCT group status was not uniquely associated with Writing Fluency (spr = .10, p > .10).
3.2.2. Curriculum Based Measurement and Observed Time on Task
Controlling for ADHD inattention symptom severity, family income, and medication use, the SCT group remained significantly associated with fewer AIMSweb Words Read (spr = .20), lower Words Read Percent Accuracy (spr = .19), and longer AIMSweb Reading Time Per Correct (spr = −.19), all ps < .01. SCT group also remained significantly associated with lower Math Analogue Task Productivity (spr = .20, p < .01), but was no longer significantly associated with Math Analogue Percent Percent Time on Task (spr = .12, p = .11).
3.2.3. Homework Performance and Organization Skills
Controlling for ADHD inattention symptom severity, family income, and medication use, the SCT group remained significantly associated with poorer parent- and teacher-reported homework performance (sprs = .27 and .17, respectively, both ps < .01). The SCT group also remained significantly associated with poorer organization, including poorer Planning (spr = −.19), Organized Actions (spr = −.21), Memory Materials Management (spr = −.16), and total score (spr = −.18) scales of the COSS.
3.2.4. Academic Skills and Academic Enablers
Controlling for ADHD inattention symptom severity, family income, and medication use, the SCT group remained significantly associated with lower scores for the ACES Academic Skills total score (spr = .22) as well as the Reading/Language Arts (spr = .25), Math (spr = .18), and Critical Thinking (spr = .19) subtests, all ps < .01. The SCT group also remained significantly associated with lower ACES Engagement (spr = .20). However, with covariates included, the SCT group was no longer significantly associated with the ACES Academic Enablers total score (spr = .10, p = .055), Interpersonal Skills (spr = −.05, p > .10), Motivation (spr = .11, p = .052), or Study Skills (spr = .09, p = .059) subscales. The SCT group comparisons remained significant (ps < .001) for Motivation and Study Skills, and Academic Enablers total score, if only income and medication use were covariates, indicating that the reduced effects were attributable to the inclusion of ADHD-IN symptoms.
Discussion
The current study provides a comprehensive examination of academic functioning in children with and without clinically elevated SCT symptoms. By using an SCT measure with strong psychometric properties and identifying students from schoolwide screening, we were able for the first time to directly test differences in academic functioning in children with and without clinically elevated SCT symptoms. Furthermore, we used a multi-method, multi-informant design that included standardized achievement testing, curriculum-based measurement, school report cards, classroom and laboratory observations, and parent and teacher rating scales. In children with elevated SCT symptoms, poorer academic functioning was found across the majority of these domains, and most effects survived controlling for family income, medication use, and ADHD-IN symptom severity. A comparison of effect sizes for models with and without covariates indicated that the addition of covariates including ADHD-IN symptom severity generally reduced the magnitude of the association of SCT with academic functioning by r < .15, with slightly larger reductions for homework performance and academic enablers (see Tables 2 and 3). Together, findings provide the clearest evidence to date that children with elevated SCT symptoms experience significant, substantial, and wide-ranging academic difficulties.
Previous studies have reported mixed findings as to whether SCT symptoms were (Jacobson & Mahone, 2019; Tamm et al., 2016; Willcutt et al., 2014) or were not (Becker & Langberg, 2013; Marshall et al., 2014) uniquely associated with standardized achievement measures. Other studies have reported more nuanced findings, finding SCT to be specifically linked to achievement in either math but not reading (Bauermeister et al., 2012) or reading but not math (Becker et al., 2018). Of note, each of these studies used nonoptimal measures of SCT. In the present study, we found children with elevated SCT symptoms to have lower academic achievement across academic domains compared to their peers without elevated SCT symptoms as assessed using standardized achievement tests, CBM, and GPA obtained from school report cards. The largest achievement test effects were found for reading comprehension and math fluency, with moderate effects for basic reading, spelling, numerical operations, and writing fluency. The SCT group’s deficits remained across each of these achievement domains except writing fluency when controlling for family income, medication status, and ADHD-IN symptom severity.
In addition, findings with CBM were mixed as to whether children with SCT have more difficulty with academic productivity than accuracy. Specifically, as compared to their peers without SCT, children with SCT read fewer words in a minute, took longer to generate correct responses during a silent reading task, and completed fewer problems during a math task. Although children with SCT also had lower accuracy on the word reading task, they did not have lower accuracy on the math task. They were also not observed to spend less time on task, either during a laboratory math task (when covariates were included) or during classroom observations conducted at the school (with or without covariates included). It thus seems to be the case that children with SCT may not obviously appear off-task but can nonetheless have reduced productivity. Of note, although children with SCT had lower achievement on WIAT-III numerical operations, the problems on this subtest increase in difficulty as participants progress through it, whereas the problems on the laboratory math analogue task stay at the same difficulty level for the duration of the task. This likely explains why SCT group status was uniquely associated with lower numerical operations scores even though the SCT group was not associated with accuracy during the laboratory math task. Finally, our finding that children with elevated SCT symptoms had lower GPA obtained from school report cards than children without elevated SCT symptoms provides important evidence of poorer academic achievement on an ecologically-valid indicator.
Findings further indicate that children with clinically elevated SCT symptoms have more difficulties with academic-related behaviors that support academic achievement, including organization and homework skills and academic enablers. SCT behaviors such as excessive daydreaming may interfere with homework completion; the reduced productivity and length of time to complete a problem correctly discussed above may contribute to homework taking a longer time which may cause homework to be especially difficult and frustrating for students as well as their parents and teachers. In considering academic enablers, when covariates were included in the model, SCT group status remained significantly associated with only lower engagement. Studies examining SCT and social functioning have found SCT symptoms to be associated with more social withdrawal, isolation, and shyness, as well as lower leadership (Becker et al., 2019; Carlson & Mann, 2002; Marshall et al., 2014; Sáez et al., 2019; Willcutt et al., 2014). Our results extend these findings by documenting that children with clinically elevated SCT also have lower levels of classroom engagement involving speaking or participating in class discussions, asking questions, or volunteering to answer questions or read aloud.
It will be important to examine the mechanisms underlying poorer academic functioning in children with SCT. One possibility is that children with elevated SCT symptoms have slower processing speed, although the literature examining SCT in relation to processing speed has found mixed and generally small effects (for a review, see Barkley et al., 2022). It is also possible that children with SCT experience high rates of mind wandering that impact learning and productivity, as well as specific domains of achievement such as reading comprehension (Becker & Barkley, 2021; Smallwood & Schooler, 2015). In addition to mind wandering and daydreaming, children with SCT also report zoning or spacing out during school and when completing academic tasks (Becker, Fredrick, et al., 2022). As articulated by an adolescent with clinically elevated SCT: “In class for school sometimes, I just zone out, and then I like come back to reality and I don’t remember anything. Like when my teacher’s giving lectures or something like that” (Becker, Fredrick, et al., 2022, p. 921). This also raises the importance of using assessment measures that are sensitive to the specific nature of SCT. For instance, in discussions with our coding team it became apparent that some children were not coded as off-task based on the coding system we were using (i.e., did not look away from their task or teacher for more than 3 s) even though to observers they were clearly not cognitively engaged with what was happening in the classroom (e.g., looking at worksheets without eyes scanning; reading a book and not turning a page for multiple minutes; appearing to be staring blankly at the teacher). Future research may employ content check questions following an observation or intersperse thought probes during a task (Smallwood & Schooler, 2015) as a way to assess states of attention and mind wandering.
Assessment and Intervention Implications
SCT is not routinely assessed in school-based evaluations; however, the pattern of results from the present study suggests that students’ SCT symptoms may be important to assess and monitor. It is currently unknown what percentage of students with clinically elevated SCT are identified with an educational disability under the Individuals with Disabilities Education Act (IDEA), or the distribution of SCT across disability categories (e.g., specific learning disability, other health impaired). Routine assessment of SCT in the school setting would be highly informative for understanding the prevalence and distribution of SCT among students who do and do not receive special education services. In addition, school psychologists and other school-based practitioners may have an important role in educating teachers about SCT, including its characteristics, how it differs from ADHD, and how it is associated with academic functioning. Our findings indicate that children with clinically elevated SCT have lower grades, and it will be especially important for longitudinal research to confirm that children with elevated SCT symptoms go on to have poorer long-term academic outcomes.
Students with clinical elevations in SCT may benefit from existing, modified, or new interventions to improve academic outcomes. The few studies that have examined SCT symptoms in the context of school-based interventions have reported mixed findings. A home-school behavioral intervention for children with ADHD predominantly inattentive presentation reduced SCT symptoms (Pfiffner et al., 2007), although another trial of the same intervention found lower SCT symptoms to predict a favorable treatment response (Owens et al., 2018). Although the effect was small, this finding suggests that children with higher SCT symptoms may have a poorer response to existing behavioral interventions for children with ADHD. Another study examined SCT response among young adolescents who received a school-based organizational skills or homework completion intervention (Smith & Langberg, 2020). The authors found a significant decrease in parent-reported, but not adolescent self-reported, SCT symptoms. Studies have yet to evaluate whether intervention-related changes in SCT mediate improvements in academic functioning. Given the pattern of findings in the present study, assertiveness/social skills training (to improve engagement) and extended time (to minimize slower pace and reduced productivity) may be worthwhile for children with clinically elevated SCT, even though these strategies are not well-supported for children with ADHD (Lovett & Nelson, 2021; Mikami et al., 2014). However, research is needed before implementing these strategies for children with elevated SCT symptoms, particularly as it is also possible that extended time can lead to students slowing their work and having lower productivity (Lovett & Nelson, 2021). Nevertheless, our findings clearly point to the need for studies to rigorously evaluate the extent to which children with clinical SCT symptoms respond to existing interventions, or would benefit from optimized interventions, to improve their academic outcomes.
Strengths, Limitations, and Future Directions
This study had several strengths, including use of a well-validated measure of SCT to identify children based on the presence or absence of clinically elevated SCT symptoms, irrespective of ADHD or other psychopathologies, and a multi-method, multi-informant approach to assess academic functioning. Still, limitations should be noted and point to important future directions for additional work in this area. First, this study used a cross-sectional design and neither directionality nor causality can be inferred. Very few studies have examined whether SCT predicts later academic functioning and none have prospectively followed children with elevated SCT symptoms to chart their academic trajectories. Second and relatedly, we assessed a broad range of academic functioning domains but were unable to examine or identify mechanisms of academic difficulties. For instance, we found children with SCT to have poorer organizational skills, lower homework performance, and reduced classroom engagement compared to their peers without SCT. We do not know whether any of these domains are mechanisms linking SCT to lower academic achievement and this is a critical area for future research, ideally in longitudinal studies. Third, although the SCT and comparison groups were closely matched on age and sex, the groups differed on family income and the full sample came from families with higher incomes. Studies show SCT to be associated with lower family income and socioeconomic indicators (Barkley, 2013; Dvorsky et al., 2021), and so our findings may be even more robust in more disadvantaged samples. In addition, our sample was comprised of predominantly non-Hispanic White participants. Although most studies have not found a significant association between race and SCT (Becker, Leopold, et al., 2016), a recent study found African American race to be associated with higher teacher-rated ADHD-IN symptoms but lower SCT symptoms (Dvorsky et al., 2021). There is a need to examine SCT in diverse and representative samples, including consideration of explanatory variables (e.g., school climate, neighborhood context, racial bias) that may impact how SCT manifests in the school context (Dvorsky et al., 2021).
Finally, to promote generalizability and to avoid concerns with recruiting a “supernormal” comparison group (Hinshaw, 2002; Kendler, 1990), most psychiatric disorders were not exclusionary in either group. This resulted in approximately 60% of the sample meeting criteria for ADHD, including 41% of the comparison group. In some ways, this bolsters confidence in our findings given that a sizeable minority of children in the comparison group had high levels of inattention (per the K-SADS interview administered to the child’s parent). However, this rate of ADHD is far higher than national prevalence rates and should be taken into consideration. It is possible that families were interested in the study if they had concerns about their child’s attention or were more likely to express interest since the study was conducted within a well-established ADHD specialty clinic in the metropolitan area where the study was conducted. It would be informative for future studies to examine the impact of SCT on academic functioning in more representative samples. Finally, although most psychiatric disorders were not exclusionary, students with autism spectrum disorder were excluded. Studies have recently begun to examine SCT in the context of autism (e.g., Mayes et al., 2020, 2022; McFayden et al., 2020; Reinvall et al., 2017), and this remains an important area for investigation.
Conclusions
The current study provides the clearest evidence to date that children with clinically elevated SCT symptoms have poorer academic functioning than their peers without SCT. Findings were pronounced and largely consistent across a range of methods and measures, including lower standardized achievement and academic skills scores, lower productivity during timed tasks, poorer organizational skills, more homework problems, and lower grade point average obtained from school report cards, in addition to fewer academic enabler behaviors that facilitate learning, particularly engagement. This study highlights the wide-ranging academic difficulties experienced by children with elevated SCT symptoms and the potential importance of assessing and treating SCT to improve academic outcomes.
Funding:
This research was supported by award number R305A160064 (PI: Becker) from the Institute of Education Sciences (IES), U.S. Department of Education. When data reported in this study were collected, Stephen Becker was supported by award number K23MH108603 from the National Institute of Mental Health (NIMH). The use of REDCap in this project was supported by the National Center for Advancing Translational Sciences of the National Institutes of Health (NIH), under Award Number 5UL1TR001425-04. The content is solely the responsibility of the authors and does not necessarily represent the official views of the IES or the NIH.
Footnotes
Publisher's Disclaimer: This is a PDF file of an unedited manuscript that has been accepted for publication. As a service to our customers we are providing this early version of the manuscript. The manuscript will undergo copyediting, typesetting, and review of the resulting proof before it is published in its final form. Please note that during the production process errors may be discovered which could affect the content, and all legal disclaimers that apply to the journal pertain.
Conflict of interests: The authors declare no potential conflicts of interest with respect to the research, authorship, or publication of this article.
Students with teacher screening T-scores > 70 who participated in the study did not differ on their SCT T-score from those who did not participate (p = .818). Likewise, students with a screening T-score in the 47–53 range who participated in the study did not differ on their SCT T-score from those who did not (p = .523).
This study was not preregistered. Data are available from the corresponding author upon reasonable request and execution of a data use agreement.
References
- Abikoff H, & Gallagher R (2009). Children’s Organizational Skills Scales (COSS): Technical manual. Multi-Health Systems. [Google Scholar]
- AIMSweb. (2012). National high school norms technical report. Pearson. [Google Scholar]
- Bain SK, & Jaspers KE (2010). Review of Kaufman Brief Intelligence Test, Second Edition. Journal of Psychoeducational Assessment, 28, 167–174. [Google Scholar]
- Barkley RA (2013). Distinguishing sluggish cognitive tempo from ADHD in children and adolescents: Executive functioning, impairment, and comorbidity. Journal of Clinical Child & Adolescent Psychology, 42(2), 161–173. doi: 10.1080/15374416.2012.734259 [DOI] [PubMed] [Google Scholar]
- Barkley RA, Willcutt E, & Jacobson LA (2022). What is the cognitive deficit in sluggish cognitive tempo (SCT)? A review of neuropsychological research. The ADHD Report, 30(2), 1–10. doi: 10.1521/adhd.2022.30.2.1 [DOI] [Google Scholar]
- Bauermeister JJ, Barkley RA, Bauermeister JA, Martinez JV, & McBurnett K (2012). Validity of the sluggish cognitive tempo, inattention, and hyperactivity symptom dimensions: neuropsychological and psychosocial correlates. Journal of Abnormal Child Psychology, 40(5), 683–697. doi: 10.1007/s10802-011-9602-7 [DOI] [PubMed] [Google Scholar]
- Becker SP (2021). Systematic review: Assessment of sluggish cognitive tempo over the past decade. Journal of the American Academy of Child & Adolescent Psychiatry, 60(6), 690–709. doi: 10.1016/j.jaac.2020.10.016 [DOI] [PMC free article] [PubMed] [Google Scholar]
- Becker SP, & Barkley RA (2018). Sluggish cognitive tempo. In Banaschewski T, Coghill D, & Zuddas A (Eds.), Oxford textbook of attention deficit hyperactivity disorder (pp. 147–153). Oxford University Press. [Google Scholar]
- Becker SP, & Barkley RA (2021). Field of daydreams? Integrating mind wandering in the study of sluggish cognitive tempo and ADHD. JCPP Advances, 1(1), e12002. [DOI] [PMC free article] [PubMed] [Google Scholar]
- Becker SP, Burns GL, Leopold DR, Olson RK, & Willcutt EG (2018). Differential impact of trait sluggish cognitive tempo and ADHD inattention in early childhood on adolescent functioning. Journal of Child Psychology and Psychiatry, 59(10), 1094–1104. doi: 10.1111/jcpp.12946 [DOI] [PMC free article] [PubMed] [Google Scholar]
- Becker SP, Ciesielski HA, Rood JE, Froehlich TE, Garner AA, Tamm L, & Epstein JN (2016). Uncovering a clinical portrait of sluggish cognitive tempo within an evaluation for attention-deficit/hyperactivity disorder: A case study. Clinical Child Psychology and Psychiatry, 21(1), 81–94. doi: 10.1177/1359104514554312 [DOI] [PMC free article] [PubMed] [Google Scholar]
- Becker SP, Fredrick JW, Foster JA, Yeaman KM, Epstein JN, Froehlich TE, & Mitchell JT (2022). “My mom calls it Annaland”: A qualitative study of phenomenology, daily life impacts, and treatment considerations of sluggish cognitive tempo. Journal of Attention Disorders, 26(6), 915–931. doi: 10.1177/10870547211050946 [DOI] [PMC free article] [PubMed] [Google Scholar]
- Becker SP, Garner AA, Tamm L, Antonini TN, & Epstein JN (2019). Honing in on the social difficulties associated with sluggish cognitive tempo in children: Withdrawal, peer ignoring, and low engagement. Journal of Clinical Child & Adolescent Psychology, 48(2), 228–237. doi: 10.1080/15374416.2017.1286595 [DOI] [PMC free article] [PubMed] [Google Scholar]
- Becker SP, & Langberg JM (2013). Sluggish cognitive tempo among young adolescents with ADHD: relations to mental health, academic, and social functioning. Journal of Attention Disorders, 17(8), 681–689. doi: 10.1177/1087054711435411 [DOI] [PubMed] [Google Scholar]
- Becker SP, Langberg JM, Luebbe AM, Dvorsky MR, & Flannery AJ (2014). Sluggish cognitive tempo is associated with academic functioning and internalizing symptoms in college students with and without attention-deficit/hyperactivity disorder. Journal of Clinical Psychology, 70(4), 388–403. doi: 10.1002/jclp.22046 [DOI] [PubMed] [Google Scholar]
- Becker SP, Leopold DR, Burns GL, Jarrett MA, Langberg JM, Marshall SA, … Willcutt EG (2016). The internal, external, and diagnostic validity of sluggish cognitive tempo: A meta-analysis and critical review. Journal of the American Academy of Child & Adolescent Psychiatry, 55(3), 163–178. doi: 10.1016/j.jaac.2015.12.006 [DOI] [PMC free article] [PubMed] [Google Scholar]
- Becker SP, Luebbe AM, Fite PJ, Stoppelbein L, & Greening L (2014). Sluggish cognitive tempo in psychiatrically hospitalized children: Factor structure and relations to internalizing symptoms, social problems, and observed behavioral dysregulation. Journal of Abnormal Child Psychology, 42(1), 49–62. doi: 10.1007/s10802-013-9719-y [DOI] [PubMed] [Google Scholar]
- Becker SP, Luebbe AM, & Joyce AM (2015). The Child Concentration Inventory (CCI): Initial validation of a child self-report measure of sluggish cognitive tempo. Psychological Assessment, 27(3), 1037–1052. doi: 10.1037/pas0000083 [DOI] [PubMed] [Google Scholar]
- Becker SP, Mossing KW, Zoromski AK, Vaughn AJ, Epstein JN, Tamm L, & Burns GL (2020). Assessing sluggish cognitive tempo and ADHD inattention in elementary students: Empirical differentiation, invariance across sex and grade, and measurement precision. Psychological Assessment, 32(11), 1047–1056. doi: 10.1037/pas0000946 [DOI] [PMC free article] [PubMed] [Google Scholar]
- Becker SP, Willcutt EG, Leopold DR, Fredrick JW, Smith ZR, Jacobson LA, … Barkley RA (2022). Report of a work group on sluggish cognitive tempo: Key research directions and a consensus change in terminology to cognitive disengagement syndrome (CDS). Journal of the American Academy of Child & Adolescent Psychiatry. Advance online publication. doi: 10.1016/j.jaac.2022.07.821 [DOI] [PMC free article] [PubMed] [Google Scholar]
- Bejamini Y, & Hochberg Y (1995). Controlling for false discovery rate: A practical and powerful approach to multiple testing. Journal of the Royal Statistical Society, 55(1), 289–300. doi: 10.1111/j.2517-6161.1995.tb02031.x [DOI] [Google Scholar]
- Burns GL, Lee S, Servera M, McBurnett K, & Becker SP (2015). Child and Adolescent Behavior Inventory - Teacher Version 1.0. Author. [Google Scholar]
- Carlson CL, & Mann M (2002). Sluggish cognitive tempo predicts a different pattern of impairment in the attention deficit hyperactivity disorder, predominantly inattentive type. Journal of Clinical Child & Adolescent Psychology, 31(1), 123–129. doi: 10.1207/S15374424JCCP3101_14 [DOI] [PubMed] [Google Scholar]
- Cohen J (1988). Statistical power analysis for the behavioral sciences (2nd ed.). L. Erlbaum Associates. [Google Scholar]
- DiPerna JC, & Elliott SN (1999). Development and validation of the academic competence evaluation scales. Journal of Psychoeducational Assessment, 17(3), 207–225. doi: 10.1177/073428299901700302 [DOI] [Google Scholar]
- DiPerna JC, & Elliott SN (2000). Academic competence evaluation scales. Harcourt Assessment. [Google Scholar]
- Duncan A, Tamm L, Birnschein AM, & Becker SP (2019). Clinical correlates of sluggish cognitive tempo in adolescents with autism spectrum disorder. Autism, 23(6), 1354–1362. doi: 10.1177/1362361318811329 [DOI] [PMC free article] [PubMed] [Google Scholar]
- Dvorsky MR, Becker SP, Tamm L, & Willoughby MT (2021). Testing the longitudinal structure and change in sluggish cognitive tempo and inattentive behaviors from early through middle childhood. Assessment, 28(2), 380–394. doi: 10.1177/1073191119872247 [DOI] [PMC free article] [PubMed] [Google Scholar]
- Flannery AJ, Luebbe AM, & Becker SP (2017). Sluggish cognitive tempo is associated with poorer study skills, more executive functioning deficits, and greater impairment in college students. Journal of Clinical Psychology, 73(9), 1091–1113. doi: 10.1002/jclp.22406 [DOI] [PMC free article] [PubMed] [Google Scholar]
- Fredrick JW, & Becker SP (2022). Sluggish cognitive tempo (cognitive disengagemnet syndrome) and academic functioning: A systematic review and agenda for future research. Clinical Child & Family Psychology Review. Advance online publication. doi: 10.1007/s10567-022-00411-6 [DOI] [PubMed] [Google Scholar]
- Friard O, & Gamba M (2016). BORIS: A free, versatile open-source event-logging software for video/audio coding and live observations. Methods in Ecology and Evolution, 7(11), 1325–1330. doi: 10.1111/2041-210X.12584 [DOI] [Google Scholar]
- Froehlich TE, Antonini TN, Brinkman WB, Langberg JM, Simon JO, Adams R, … Epstein JN (2014). Mediators of methylphenidate effects on math performance in children with attention-deficit hyperactivity disorder. Journal of Developmental & Behavioral Pediatrics, 35(2), 100–107. doi: 10.1097/DBP.0000000000000025 [DOI] [PMC free article] [PubMed] [Google Scholar]
- Fuchs LS, & Fuchs D (1992). Identifying a measure for monitoring student reading progress. School Psychology Review, 21(1), 45–58. [Google Scholar]
- Harris PA, Taylor R, Thielke R, Payne J, Gonzalez N, & Conde JG (2009). Research electronic data capture (REDCap) - A metadata-driven methodology and workflow process for providing translational research informatics support. Journal of Biomedical Informatics, 42(2), 377–381. doi: 10.1016/j.jbi.2008.08.010 [DOI] [PMC free article] [PubMed] [Google Scholar]
- Hinshaw SP (1992). Academic underachievement, attention deficits, and aggression: Comorbidity and implications for intervention. Journal of Consulting and Clinical Psychology, 60(6), 893–903. [DOI] [PubMed] [Google Scholar]
- Hinshaw SP (2002). Preadolescent girls with attention-deficit/hyperactivity disorder: I. Background characteristics, comorbidity, cognitive and social functioning, and parenting practices. Journal of Consulting and Clinical Psychology, 70(5), 1086–1098. [DOI] [PubMed] [Google Scholar]
- Hoagwood K, Jensen PS, Arnold LE, Roper M, Severe J, Odbert C, … Group M.T.A.C. (2004). Reliability of the services for children and adolescents-parent interview. Journal of the American Academy of Child & Adolescent Psychiatry, 43(11), 1345–1354. doi: 10.1097/01.chi.0000139558.54948.1f [DOI] [PubMed] [Google Scholar]
- Hossain B, Bent S, Parenteau C, Widjaja F, Davis M, & Hendren RL (2022). The associations between sluggish cognitive tempo, internalizing symptoms, and academic performance in children with reading disorder: A longitudinal cohort study. Journal of Attention Disorders, 10870547221085493. [DOI] [PMC free article] [PubMed] [Google Scholar]
- Howe KB, & Shinn MM (2002). Standard reading assessment passages (RAPs) for use in general outcome measurement: A manual describing development and technical features. Edformation. [Google Scholar]
- Jacobson LA, & Mahone EM (2019). Sluggish cognitive tempo predicts academic fluency, beyond contributions of core academic skills, attention, and motor speed. Journal of Attention Disorders, 23(14), 1703–1710. doi: 10.1177/1087054718776468 [DOI] [PMC free article] [PubMed] [Google Scholar]
- Jacobson LA, Murphy-Bowman SC, Pritchard AE, Tart-Zelvin A, Zabel TA, & Mahone EM (2012). Factor structure of a sluggish cognitive tempo scale in clinically-referred children. Journal of Abnormal Child Psychology, 40(8), 1327–1337. doi: 10.1007/s10802-012-9643-6 [DOI] [PubMed] [Google Scholar]
- Jarbin H, Andersson M, Rastam M, & Ivarsson T (2017). Predictive validity of the K-SADS-PL 2009 version in school-aged and adolescent outpatients. Nordic Journal of Psychiatry, 71(4), 270–276. doi: 10.1080/08039488.2016.1276622 [DOI] [PubMed] [Google Scholar]
- Jenkins JR, & Jewell M (1993). Examining the validity of two measures for formative teaching: Reading aloud and maze. Exceptional Children, 59(5), 421–432. [Google Scholar]
- Kaufman AS, & Kaufman NL (2004). Kaufman Brief Intelligence Test, Second Edition (KBIT-2). Pearson. [Google Scholar]
- Kaufman J, Birmaher B, Axelson D, Perepletchikova F, Brent D, & Ryan N (2013). Schedule for Affective Disorders and Schizophrenia for School-Age Children-Present and Lifetime Version (K-SADS-PL 2013, DSM-5). Western Psychiatric Institute and Yale University. [Google Scholar]
- Kaufman J, Birmaher B, Brent D, Rao U, Flynn C, Moreci P, … Ryan N (1997). Schedule for Affective Disorders and Schizophrenia for School-Age Children-Present and Lifetime Version (K-SADS-PL): initial reliability and validity data. Journal of the American Academy of Child & Adolescent Psychiatry, 36(7), 980–988. doi: 10.1097/00004583-199707000-00021 [DOI] [PubMed] [Google Scholar]
- Kendler KS (1990). The super-normal control group in psychiatric genetics: Possible artifactual evidence for coaggregation. Psychiatric Genetics, 1, 45–53. doi: 10.1097/00041444-199001020-00005 [DOI] [Google Scholar]
- Langberg JM, Becker SP, & Dvorsky MR (2014). The association between sluggish cognitive tempo and academic functioning in youth with attention-deficit/hyperactivity disorder (ADHD). Journal of Abnormal Child Psychology, 42(1), 91–103. doi: 10.1007/s10802-013-9722-3 [DOI] [PubMed] [Google Scholar]
- Langberg JM, Becker SP, Dvorsky MR, & Luebbe AM (2014). Are sluggish cognitive tempo and daytime sleepiness distinct constructs? Psychological Assessment, 26(2), 586–597. doi: 10.1037/a0036276 [DOI] [PubMed] [Google Scholar]
- Lee S, Burns GL, Snell J, & McBurnett K (2014). Validity of the sluggish cognitive tempo symptom dimension in children: Sluggish cognitive tempo and ADHD-inattention as distinct symptom dimensions. Journal of Abnormal Child Psychology, 42(1), 7–19. doi: 10.1007/s10802-013-9714-3 [DOI] [PubMed] [Google Scholar]
- Lovett BJ, & Nelson JM (2021). Systematic review: Educational accommodations for children and adolescents with attention-deficit/hyperactivity disorder. Journal of the American Academy of Child & Adolescent Psychiatry, 60(4), 448–457. doi: 10.1016/j.jaac.2020.07.891 [DOI] [PubMed] [Google Scholar]
- Marshall SA, Evans SW, Eiraldi RB, Becker SP, & Power TJ (2014). Social and academic impairment in youth with ADHD, predominately inattentive type and sluggish cognitive tempo. Journal of Abnormal Child Psychology, 42(1), 77–90. doi: 10.1007/s10802-013-9758-4 [DOI] [PMC free article] [PubMed] [Google Scholar]
- Mayes SD, Becker SP, Calhoun SL, & Waschbusch DA (2022). Comparison of the cognitive disengagement and hypoactivity components of sluggish cognitive tempo in autism, ADHD, and population-based samples of children. Research on Child and Adolescent Psychopathology. Advance online publication. doi: 10.1007/s10802-022-00969-3 [DOI] [PubMed] [Google Scholar]
- Mayes SD, Calhoun SL, & Waschbusch DA (2020). Sluggish cognitive tempo in autism, ADHD, neurotypical child samples. Research in Autism Spectrum Disorders, 79, 101678. doi: 10.1016/j.rasd.2020.101678 [DOI] [Google Scholar]
- Mayes SD, Calhoun SL, & Waschbusch DA (2021). Relationship between sluggish cognitive tempo and sleep, psychological, somatic, and cognitive problems and impairment in children with autism and children with ADHD. Clinical Child Psychology and Psychiatry, 26(2), 518–530. doi: 10.1177/1359104520978459 [DOI] [PubMed] [Google Scholar]
- McBurnett K, Villodas M, Burns GL, Hinshaw SP, Beaulieu A, & Pfiffner LJ (2014). Structure and validity of sluggish cognitive tempo using an expanded item pool in children with attention-deficit/hyperactivity disorder. Journal of Abnormal Child Psychology, 42(1), 37–48. doi: 10.1007/s10802-013-9801-5 [DOI] [PubMed] [Google Scholar]
- McFayden T, Jarrett MA, White SW, Scarpa A, Dahiya A, & Ollendick TH (2022). Sluggish cognitive tempo in autism spectrum disorder, ADHD, and their comorbidity: Implications for impairment. Journal of Clinical Child & Adolescent Psychology, 51(2), 195–202. doi: 10.1080/15374416.2020.1716365 [DOI] [PubMed] [Google Scholar]
- Mikami AY, Jia M, & Na JJ (2014). Social skills training. Child and Adolescent Psychiatric Clinics of North America, 23(4), 775–788. doi: 10.1016/j.chc.2014.05.007 [DOI] [PubMed] [Google Scholar]
- Owens EB, Hinshaw SP, McBurnett K, & Pfiffner L (2018). Predictors of response to behavioral treatments among children with ADHD-inattentive type. Journal of Clinical Child & Adolescent Psychology, 47(sup1), S219–S232. doi: 10.1080/15374416.2016.1228461 [DOI] [PMC free article] [PubMed] [Google Scholar]
- Penny AM, Waschbusch DA, Klein RM, Corkum P, & Eskes G (2009). Developing a measure of sluggish cognitive tempo for children: content validity, factor structure, and reliability. Psychological Assessment, 21(3), 380–389. doi: 10.1037/a0016600 [DOI] [PubMed] [Google Scholar]
- Pfiffner LJ, Yee Mikami A, Huang-Pollock C, Easterlin B, Zalecki C, & McBurnett K (2007). A randomized, controlled trial of integrated home-school behavioral treatment for ADHD, predominantly inattentive type. Journal of the American Academy of Child & Adolescent Psychiatry, 46(8), 1041–1050. doi: 10.1097/chi.0b013e318064675f [DOI] [PubMed] [Google Scholar]
- Power TJ, Watkins MW, Mautone JA, Walcott CM, Coutts MJ, & Sheridan SM (2015). Examining the validity of the Homework Performance Questionnaire: Multi-informant assessment in elementary and middle school. School Psychology Quarterly, 30(2), 260–275. doi: 10.1037/spq0000081 [DOI] [PubMed] [Google Scholar]
- Reinvall O, Kujala T, Voutilainen A, Moisio A, Lahti-Nuuttila P, & Laasonen. (2017). Sluggish cognitive tempo in children and adolescents with higher functioning autism spectrum disorders: Social impairments and internalizing symptoms. Scandinavian Journal of Psychology, 58(5), 389–399. doi: 10.1111/sjop.12379 [DOI] [PubMed] [Google Scholar]
- Sáez B, Servera M, Becker SP, & Burns GL (2019). Optimal items for assessing sluggish cognitive tempo in children across mother, father, and teacher ratings. Journal of Clinical Child & Adolescent Psychology, 48(6), 825–839. doi: 10.1080/15374416.2017.1416619 [DOI] [PMC free article] [PubMed] [Google Scholar]
- Servera M, Sáez B, Burns GL, & Becker SP (2018). Clinical differentiation of sluggish cognitive tempo and attention-deficit/hyperactivity disorder in children. Journal of Abnormal Psychology, 127(8), 818–829. doi: 10.1037/abn0000375 [DOI] [PMC free article] [PubMed] [Google Scholar]
- Shelton CR, Addison WE, & Hartung CM (2019). ADHD and SCT symptomatology in relation to college students’ use of self-regulated learning strategies. Journal of Attention Disorders, 23(14), 1719–1728. doi: 10.1177/1087054717691134 [DOI] [PubMed] [Google Scholar]
- Shin J, Deno SL, & Espin C (2000). Technical adequacy of the maze task for curriculum-based measurement of reading growth. The Journal of Special Education, 34(3), 164–172. [Google Scholar]
- Smallwood J, & Schooler JW (2015). The science of mind wandering: empirically navigating the stream of consciousness. Annual Review of Psychology, 66, 487–518. doi: 10.1146/annurev-psych-010814-015331 [DOI] [PubMed] [Google Scholar]
- Smith ZR, Breaux RP, Green CD, & Langberg JM (2019). Evaluation of the interplay between homework motivation and sluggish cognitive tempo in youth With ADHD: Associations with homework performance. Journal of Attention Disorders, 23(11), 1262–1273. doi: 10.1177/1087054718763722 [DOI] [PubMed] [Google Scholar]
- Smith ZR, & Langberg JM (2020). Do sluggish cognitive tempo symptoms improve with school-based ADHD interventions? Outcomes and predictors of change. Journal of Child Psychology and Psychiatry, 61(5), 575–583. doi: 10.1111/jcpp.13149 [DOI] [PubMed] [Google Scholar]
- Spira EG, & Fischel JE (2005). The impact of preschool inattention, hyperactivity, and impulsivity on social and academic development: a review. Journal of Child Psychology and Psychiatry, 46(7), 755–773. doi: 10.1111/j.1469-7610.2005.01466.x [DOI] [PubMed] [Google Scholar]
- Tamm L, Garner AA, Loren RE, Epstein JN, Vaughn AJ, Ciesielski HA, & Becker SP (2016). Slow sluggish cognitive tempo symptoms are associated with poorer academic performance in children with ADHD. Psychiatry Research, 242, 251–259. doi: 10.1016/j.psychres.2016.05.054 [DOI] [PMC free article] [PubMed] [Google Scholar]
- Walker HM, & Sevenson HH (1990). Systematic Screening for Behavior Disorders: Users guide and administration manual. Sopris West. [Google Scholar]
- Walker HM, Severson HH, & Feil EG (2014). Systematic Screening for Behavior Disorders (SSBD): Technical manual (2nd Ed.). Pacific Northwest Publishing. [Google Scholar]
- Wechsler D (2009). Wechsler Individual Achievement Test - Third Edition (WIAT-III) (3rd ed.). Pearson. [Google Scholar]
- Willcutt EG, Chhabildas N, Kinnear M, DeFries JC, Olson RK, Leopold DR, … Pennington BF (2014). The internal and external validity of sluggish cognitive tempo and its relation with DSM-IV ADHD. Journal of Abnormal Child Psychology, 42(1), 21–35. doi: 10.1007/s10802-013-9800-6 [DOI] [PMC free article] [PubMed] [Google Scholar]
- Willcutt EG, Nigg JT, Pennington BF, Solanto MV, Rohde LA, Tannock R, … Lahey BB (2012). Validity of DSM-IV attention deficit/hyperactivity disorder symptom dimensions and subtypes. Journal of Abnormal Child Psychology, 121(4), 991–1010. doi: 10.1037/a0027347 [DOI] [PMC free article] [PubMed] [Google Scholar]
- Woodcock RW, Schrank FA, Mather N, & McGrew KS (2007). Woodcock-Johnson III Tests of Achievement, Form C/Brief Battery. Riverside Publishing. [Google Scholar]
- Wright J (1992). Curriculum-based measurement: a manual for teachers. Retrieved from www.interventioncentral.org/download.php