


Abstract
Streptomyces are prolific producers of specialized metabolites with applications in medicine and agriculture. These bacteria possess a large linear chromosome genetically compartmentalized: core genes are grouped in the central part, while terminal regions are populated by poorly conserved genes. In exponentially growing cells, chromosome conformation capture unveiled sharp boundaries formed by ribosomal RNA (rrn) operons that segment the chromosome into multiple domains. Here we further explore the link between the genetic distribution of rrn operons and Streptomyces genetic compartmentalization. A large panel of genomes of species representative of the genus diversity revealed that rrn operons and core genes form a central skeleton, the former being identifiable from their core gene environment. We implemented a new nomenclature for Streptomyces genomes and trace their rrn-based evolutionary history. Remarkably, rrn operons are close to pericentric inversions. Moreover, the central compartment delimited by rrn operons has a very dense, nearly invariant core gene content. Finally, this compartment harbors genes with the highest expression levels, regardless of gene persistence and distance to the origin of replication. Our results highlight that rrn operons are structural boundaries of a central functional compartment prone to transcription in Streptomyces.
Graphical Abstract
Graphical Abstract.
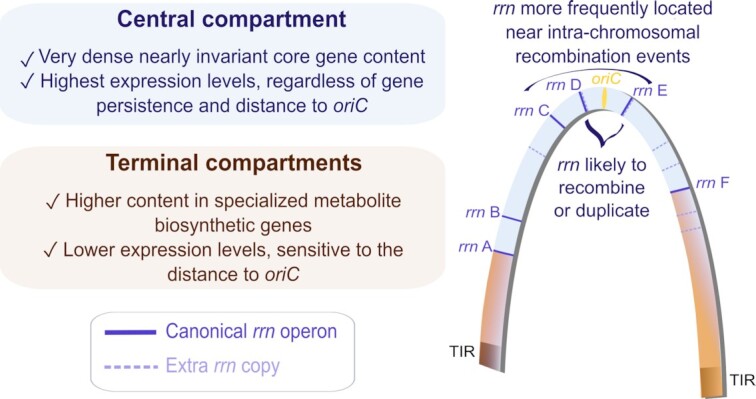
Main properties of the central and terminal compartments defined by rrn operons in the Streptomyces chromosome.
INTRODUCTION
Streptomyces are bacteria of great biotechnological interest due to the production of antibiotics and many other bioactive compounds (1). Remarkably for a bacterium, they have a linear chromosome and terminal inverted repeats (TIRs) capped by telomere-like sequences. Their genome is amongst the largest in bacteria (6–15 Mb), with an extreme GC content (circa 72%). In addition, the Streptomyces chromosome presents a partition, termed ‘genetic compartmentalization’, into a core region harboring genes shared by all Streptomyces and more variable extremities or ‘arms’ enriched in specialized metabolite biosynthetic gene clusters (2–9). Consistently, DNA rearrangements and recombination events are more frequently fixed in the terminal arms than in the central region (6,10–14). It has been proposed that strong evolutionary constraints shaped the distribution of genes along the chromosome owing to their potential benefit at the individual or population level (8): genes encoding ‘private goods’ essential for vegetative growth are maintained in the central part of the genome, whereas social genes encoding ‘public goods’ of strong adaptive value for the colony (e.g. antibiotics) are located in the variable part of the genome, which may favor their rapid diversification. The mechanisms that govern the structure and function of these compartmentalized genomes remain mostly unknown.
We recently demonstrated that the genetic compartmentalization of Streptomyces ambofaciens ATCC 23877 correlates with chromosome architecture and gene expression in exponential phase (9). During vegetative growth, the distal ribosomal RNA (rrn) operons delimit a highly structured and expressed region termed ‘central compartment’, presenting structural features distinct from those of the terminal compartments which are almost transcriptionally quiescent (9). This led us to propose that these distal rrn operons may constitute some kind of barrier contributing to the evolution of Streptomyces genomes towards a compartmentalized organization (9).
The number of rrn copies is thought to be a determinant of bacterial fitness, with the optimal number depending on the environmental and biological context in which the species evolve (15–18). Indeed an increase in the number of rrn genes is associated with a higher maximal growth rate but a lower carbon use efficiency (16). Therefore the number of rrn operons may be a proxy for bacterial adaptation to resource availability (16). Although 16S RNA sequences are the classical ‘chronometer’ for phylogenetic classification, their impact on genome evolution per se has rarely been considered (17). Interestingly, the rrn operons, including 16S, 23S, 5S and internal transcribed spacer regions, coincide with sharp boundaries in the chromosome 3D-organization of bacteria with linear (9) as well as circular (20–24) genomes. The formation of these boundaries correlates with a very high level of transcription, but does not require translation (21). Moreover, RNA polymerase is spatially organized into dense clusters engaged in ribosomal RNA synthesis when bacteria are grown in rich medium (25–28). It has been proposed that rrn operons might form a bacterial equivalent of the nucleolus (29), although these results remain controversial (27). Altogether, these observations open the possibility that the rrn operons could play a role in genome evolution by coupling transcription and genome spatial conformation.
Guided by this hypothesis, we took advantage of the large number of sequenced Streptomyces genomes to explore the correlation between rrn operon dynamics (number, position) and chromosome organization in a panel of species representative of Streptomyces diversity. We notably observed that rrn operons coevolved with the core region and can be identified from their core gene environment. We set-up an rrn-based nomenclature for Streptomyces genome organization that we used to trace its evolutionary history. Pericentric recombination frequently occurred at the vicinity of rrn operons located close to the origin of replication. Moreover, we observed that the most external rrn operons, designated ‘distal rrn operons’, delimit the central compartment, whose size and content are highly correlated with the core genome dynamics. Genes within this central compartment are expressed at a higher level than in the terminal compartments, regardless of gene persistence and the distance to the origin of replication. Altogether, our results highlight that distal rrn operons may be considered as ‘structural limits’ that delineate a functional compartment in the linear genome of Streptomyces.
MATERIALS AND METHODS
Genome annotation and orthology assignment
The set of genomes used in this study consists of 125 genomes whose selection was previously described (8), to which we added two genomes of model strains (S. venezuelae ATCC 10712 and S. albidoflavus J1074) for which genomic data are available. For all genomes, the completeness of the assembly was assessed using BUSCO (30). All genomes (Supplementary Table S1) were automatically annotated on the rast server (31,32) using the rast Classic pipeline (FIGfam version: release 70) to standardize annotation protocols, a key step for the subsequent assignment of orthology relationships. For each pair of genomes, orthologs were identified by blastp reciprocal best hits (BBH) (33–35) with at least 40% identity, 70% coverage (based on the shortest sequence) and an E-value of <10−10. Each orthologous group was identified by a number using a graph approach based on a simple linkage method. The resulting annotation of the whole genomes is available in Supplementary Table S2. The core-genome corresponds to the set of orthologs (1017) present in all the genomes of our dataset and forming a clique. The specialized metabolite biosynthetic gene clusters (SMBGCs) and prophages were predicted using AntiSMASH (36,37) and PHASTER (38), respectively. The position of the origin of replication was predicted using Ori-Finder 2022 (39,40) (Supplementary Table S1). Since it was always located between dnaA and dnaN genes in all the genomes of our panel, we further used dnaA both as a proxy of the origin of replication, and a key gene for genome orientation according to the nomenclature proposed in this study (see below).
Phylogenetic analysis
For each strain, the protein sequences of the 1017 genes of the core-genome were retrieved. The sequences were concatenated and aligned with MAFFT (41,42) (v7.490). The multiple alignment (441 390 positions) was then subjected to RAxML-NG (43) with the LG substitution model for maximum-likelihood-based tree inference. Fifty bootstrap replications were performed. The phylogenetic tree was represented using MEGA X software (44).
Average nucleotide identity computation
The average nucleotide identity between query and reference genomes was calculated by using the blastn algorithm (ANIb) (45). First, the query genome was fragmented into 1000 nucl. consecutive parts, which were then each aligned to the reference genome sequence using blastn (v2.11.0+) (46). The ANIb score is the average value of the percentages of nucleotide identity of the query fragments with a positive match to the reference genome (alignment greater than 70% with at least 30% of nucleotide identity) (45). Because the ANIb score is not reciprocal (i.e. the ANIb score of genome A versus genome B may be slightly different from the ANIb score of genome B versus genome A), we used the average of the two reciprocal values as the final score. The ANIb score calculated between all species of the panel is presented in Supplementary Table S3.
Core gene consensus order building
The consensus order of core genes was determined from the analysis of the 52 Streptomyces strains that harbor the most frequent rrn configuration, termed canonical (‘rrn ABCDEF dnaA+’). A rank (from 1 to 1017) was assigned to each gene within each strain. The most frequent rank was attributed to each core gene. An ambiguity between ranks 498 and 499 required a dedicated analysis of the most frequent gene order on the corresponding area. The scripts used to conduct this analysis are available in Supplemental File 1.
The rrn nomenclature rules
The core gene neighborhood of each rrn operon (nearest core gene and its previous and next core genes) was determined for all genomes in the panel (detailed in Supplementary Figure S1). The order of the consensus core genes was used to determine the rrn neighborhood order described as ‘sense’. If the order of the genes was in the other orientation, an asterisk was added to represent the ‘antisense’ orientation. The six most frequent rrn core gene environments were designated from ‘A’ to ‘F’, whereas the other rrn core gene environments were named from ‘g’ through ‘k’ in lower case with a number, to indicate their non-canonical nature. The same letter is kept when at least one core gene is in common between two rrn environments. Finally, the dnaA gene orientation was included in the nomenclature, as a proxy for the orientation of the replication origin. The ‘+’ direction means that the genome sequence (reference strand from 5' to 3' when oriented from A to F rrn operons) carries the dnaA gene sequence in the sense orientation (the start codon located before the stop codon). In contrast, the ‘−’ direction means that the genomic sequence oriented according to the proposed nomenclature carries an inverted complementary sequence of the dnaA gene (the stop codon located before the start codon). Some sequences released from the databases were oriented in an inverted manner with respect to the consensus core order determined in this study. We conserved the orientation provided by the databases for the analyses presented in this paper, but considered the genome configuration in the appropriate orientation (e.g. ‘rrn F*E*D*C*B*A* dnaA−’, considered as equivalent to ‘rrn ABCDEF dnaA+’). To decide whether a sequence from the database is in the same orientation as the reference consensus used in this study (Streptomyces viridosporus T7A ATCC 39115), it is necessary to consider the results of pairwise comparison presented in Supplementary Figure S2: when the diagonal starts at the bottom left and ends at the top right, it means that the genome sequence available in the databases is oriented as in the consensus, and that the rrn configuration shown below each graph can be directly transposed onto the graph. If not, the sequence is in the opposite direction. In this case, the consensus should be reversed when transposed on the graph (e.g. ‘rrn ABCDEF dnaA+’ becomes ‘rrn F*E*D*C*B*A* dnaA−’).
Core gene-based identification of large genome rearrangements within the central compartment
The S. viridosporus T7A ATCC 39115 core genome was used as a reference in this analysis. The difference (‘delta_VIRO’, in bp) between the position of the core genes in the central compartment of each strain and the reference strain was calculated, and then the difference between the ‘delta_VIRO’ values of successive genes (‘delta_VIRO_delta’) within each strain. Positions for which the ‘delta_VIRO_delta’ values were >200 kb were selected. Manual curation was performed based on pairwise comparisons of core genomes (Supplementary Figure S2 and S3). Rearrangements identified in multiple strains sharing a common ancestor were considered only once, taking the average values of size and distance to the nearest rrn operons. In some cases, the exact position of the rearrangement was determined by comparison with a more closely related species (e.g. S.koyangensisversusS. albidoflavus). In order to include only rearrangements whose identification was not ambiguous, three strains with too complex evolutionary scenario (S.sp. 11 1 2, S. autolyticus CGMCC0516 and S. bingchenggensis BCW 1) were excluded from this analysis. Thus, there were probably more rearrangements than proposed in the scenario (especially in the group ‘O’). All data are available in Supplementary Table S4.
Modeling
We fit linear regression models using the ‘lm’ function of R software (47) to explore the predictability of the core region size (n = 127) using as explanatory variables the number of rrn genes and loci, the phylogenetic origin of the strains (clade 1, clade 2 or group O for ‘Other’) as well as various sizes (sizes of the central compartment, the tDNA region, the terminal compartments and the whole chromosome) and distances (minimal and maximal distance of distal rrn to the oriC). We conducted both forward and backward regression approaches to select the best predictors. The script associated with this approach is detailed in the Supplemental File 1. The best fitting model according to Akaike Information Criterion (AIC) included as explanatory variables: the sizes of the central compartment and of the chromosome, the maximal distance between the distal rrn operons and the origin of replication as well as the number of rrn genes. The model was checked visually using diagnostic plots (residuals versus fitted values, and QQ plots to check normality).
GO enrichment analysis
The GO enrichment analysis was performed on the central compartment core (CCC) and terminal compartment core (TCC) genes of S. coelicolor A3(2), which is the most studied and therefore annotated Streptomyces genome. The SCO and GO annotations of its core genome are detailed in the Supplementary Table S5. The g:Profiler g:GOst software (https://biit.cs.ut.ee/gprofiler/gost, version e105_eg52_p16_e84549f) was used on line after uploading a GMT file corresponding to the S. coelicolor A3(2) complete GO annotation (provided in Supplementary file 2).
Transcriptome analyses
RNA-seq data were retrieved from the NCBI Gene Expression Omnibus (GEO, https://www.ncbi.nlm.nih.gov/geo/) under the following accession codes: GSE162865 (S. ambofaciens ATCC 23877) (9), GSE118597 (S. avermitilis MA 4680) (48), GSE147644 (S. bingchenggensis BCW1/BC-101-4) (49), GSE69350 [S. coelicolor A3(2)] (50), GSE128216 (S. clavuligerus ATCC 27064 2 3) (48), GSE97637 (S. tsukubensis NRRL 18488) (48), GSE115439 (S. venezuelae ATCC 10712) (51). STAR software (52) (v2.5.4) was used for mapping RNA-seq to the reference genome containing only one terminal inverted repeat (TIR). This avoids any biases with multiple mapping within the duplicated extremities of the genome (since the two TIR sequences are indistinguishable). We used the featureCounts program (53) (v2.0.1) to quantify reads in the sense-orientation. SARTools (Statistical Analysis of RNA-Seq data Tools, v1.6.3) DESeq2-based R pipeline (54,55) was used with default parameters for systematic quality controls, normalization and detection of differentially expressed genes in each strain considered independently. The first time point was used as the reference condition. The DESeq2 counts were normalized on gene size (DESeq2 reads per kb) in each growth condition (Supplementary Table S6). The trophophase time points correspond to 24, 13, 18, 26, 14, 15, 8 h for S. ambofaciens ATCC 23877, S. avermitilis MA 4680, S. bingchenggensis BCW 1/BC-101-4, S. clavuligerus ATCC 27064 2 3, S. coelicolor A3(2), S. tsukubensis NRRL 18488 and S. venezuelae ATCC 10712, respectively. The idiophase time points correspond to 48, 33.5, 48, 125, 36, 48, 18 h for S. ambofaciens ATCC 23877, S. avermitilis MA 4680, S. bingchenggensis BCW 1/BC-101-4, S. clavuligerus ATCC 27064 2 3, S. coelicolor A3(2), S. tsukubensis NRRL 18488 and S. venezuelae ATCC 10712, respectively. Only protein-coding genes were considered to generate the data presented in Figure 6 and Supplementary Figure S8.
Figure 6.

Gene expression level depending on the location inside or outside the central compartment. (A) Correlation between gene expression and gene persistence in the central (left) and terminal (right) compartments. Gene transcription (in sense orientation) during the trophophase corresponds to the log 2 of the number of DESeq2 normalized reads per kb. The correlations were analyzed by a Spearman's rank correlation test, performed on the whole transcriptomes (values indicated on the graph) or for each species individually (values indicated below the graph). (B) Correlation between gene expression and the distance to the origin of replication in the central (left) and terminal (right) compartments. Core (top) and non-core (bottom) gene transcription (in sense orientation) were measured during the trophophase and expressed as the log 2 of the number of DESeq2 normalized reads per kb. The correlations were analyzed by a Spearman's rank correlation test, performed on the whole transcriptomes (values indicated on the graph) or for each species individually (values indicated below the graph). Statistically significant P-values are written in bold. Abbreviations: CCC (central compartment core genes); CCNC (central compartment non-core genes); TCC (terminal compartment core genes); TCNC (terminal compartment non-core genes).
RESULTS
New nomenclature of Streptomyces genomes based on rrn operons and dnaA gene orientation
We first characterized the organization of rrn operons in 127 Streptomyces genomes from a previously characterized panel of Streptomyces species representative of the genus diversity (8,9) (Supplementary Table S1). In this panel, most genomes (>85%) share an average nucleotide identity based on blast+ (ANIb) lower than 95%, a threshold used to distinguish species (56) (Supplementary Table S3). We included several strains for eight species (e.g. S. ambofaciens, Streptomyces venezuelae) to access intra-species evolution and include strains for which –omics data were available for further analyses. We re-annotated all genomes and detected orthologous genes, as previously described (8). This allowed the identification of 1017 ortholog genes associated with best reciprocal matches between coding sequences present in all 127 genomes, further defined as the ‘core genome’. Interestingly, 943 of these genes (92.7%) are included in the soft-core recently identified on a partially overlapping panel of Streptomyces genomes by Caicedo-Montoya et al. (Roary method) (57). We used the position of the most external genes of the core genome as limits between the ‘arms’ and the ‘core region’ (that therefore includes all the core genes, together with the non-core genes located in between - Figure 1A).
Figure 1.

Streptomyces rrn operon genetic distribution and link with the core genome. (A) Schematic representation of the location of rrn operons in the Streptomyces genome. The schematic representation of the chromosome is shown to scale using S. ambofaciens ATCC 23877 as reference. The origin of replication (oriC) was defined regarding the position of the dnaA gene, the yellow arrow representing the orientation of this gene. The detailed nomenclature describing each rrn environment is available in Supplementary Figure S1. Abbreviation: ‘Term. comp.’ = Terminal compartment. (B) Number of rrn genes in the panel of 127 genomes. The bars are filled according to the number of rrn loci (corresponding to complete or unlinked operons) in each genome. The values above each box correspond to the number of genomes. (C) Frequency of the different rrn core gene environments in the panel of 127 genomes. (D) Distribution of the distances between each rrn operon and the origin of replication (oriC) in the panel of 127 genomes. The distance is expressed in Mb (top) or as the percentage of the size of the ‘central compartment’ (bottom). The results are presented separately for each rrn category as defined in Supplementary Figure S1. (E) Scatter plots presenting the correlation between the core region size and the size of the central compartment or the chromosome. The rho coefficients (R) and P values of Spearman's rank correlations were calculated with the whole set of genomes (n = 127) as well as within each clade and group (nClade 1= 67, nClade 2= 43, nGroup O= 17).
Most Streptomyces genomes from our panel (70.1 %) harbor six rrn operons encoding all three 16S, 23S, 5S ribosomal RNAs (Figure 1B). About a quarter of genomes (24.4 %) contain seven complete rrn operons, eight complete operons being quite exceptional (only Streptomyces hundungensis BH38). These results are in accordance with the number of 16S rrn genes per strain reported in the rrnDB database (16) in a panel of 265 Streptomyces genomes (74.0 % and 22.3 % with six and seven 16S rrn genes, respectively - https://rrndb.umms.med.umich.edu/, version 5.7). Thus, sampling biases seem negligible when comparing data from our panel and an independent set of genomes.
Pairwise comparison of core genomes revealed that synteny of core genes is strong between all strains, highlighting a ‘core skeleton’ with a rather stable core gene order in Streptomyces (Supplementary Figure S2). In the middle of the genome, we confirmed the existence of a region at the origin of replication in which core gene synteny is perfectly conserved between all strains, as previously described for a smaller set of strains (58). We then determined a consensus order of core genes by assigning them their most frequent rank in a panel of genomes representative of the most frequent global core skeleton organization. Interestingly, five core genomes of the panel (e.g. S. viridosporus T7A ATCC 39115) present exactly this consensus organization, and twelve (e.g. both S. ambofaciens strains in the clade 1, Streptomyces ficellus NRRL 8067 in the clade 2) differ only by the order of 2 genes of the core genome owing to a local inversion (Supplementary Table S7).
In accordance with the existence of a core skeleton, we noticed that six rrn operons almost always have the same core gene environment in all the strains (Figure 1A). These six rrn core gene neighborhoods, hereinafter referred to as ‘canonical’ and designated from ‘A’ to ‘F’ in capital letters (Supplementary Figure S1), are exactly conserved in 87.4–99.2% of the genomes (Figure 1C). In this nomenclature, the same letter is kept when at least one core gene is in common between two rrn genetic environments. An asterisk (Supplementary Figure S2, Supplementary Table S1) has been added to indicate an identical environment but in reverse orientation to that shown in the Supplementary Figure S1. We also identified recombination between ‘D’ and ‘E’ rrn operons, leading to [d/e] hybrid core gene environments in some strains (Figure 1C). On the contrary, the seventh and eighth rrn operons (when present) can be located in various core gene environments, named ‘g’ through ‘k’ in lower case with a number, to indicate their non-canonical nature (Figure 1A). Based on these observations, we proposed that the ancestor of all Streptomyces had 6 rrn operons, the seventh and eighth rrn operons emerging from rrn operon duplication/acquisition in the vicinity of a canonical rrn operon (e.g. ‘e2’ rrn operon in S. venezuelae ATCC 10712) or at an ectopic position (e.g. ‘k1’ rrn operon in Streptomyces albidoflavus strains and S. hundungensis BH38). Accordingly, the presence of only five rrn loci [Streptomyces asterosporus (synonym: calvus) DSM 41452] likely corresponds to the loss of an rrn operon.
Each genome was thus classified according to the orientation of the rrn genetic environments and the dnaA gene (as a proxy of the origin of replication orientation) (Supplementary Table S1).
In the panel, 40.9% of the genomes harbor the rrn operons in the same order along the core genome, the major shared configuration being ‘rrn ABCDEF dnaA+’ (e.g. S. ambofaciens ATCC 23877), which was subsequently considered canonical (Supplementary Table S1). The second most frequent configuration represents 10.2% of cases and corresponds to genomes harboring a pericentric inversion [‘rrn ABCE*D*F dnaA−’, e.g. Streptomyces coelicolor A3(2)] (Supplementary Table S1). Not taking into account extra copies of rrn or small local variations of the rrn environments, 50.4% and 18.1% of the strains have these two configurations: ‘rrn Aa Bb Cc Dd Ee Ff, dnaA+ (± extra rrn)’, and ‘rrn Aa Bb Cc (Ee)* (Dd)* Ff, dnaA− (± extra rrn)’, respectively (Supplementary Table S1; Figure 2). These results confirm that the proposed nomenclature allows a fairly general description of the organization of Streptomyces genomes, and that the ancestor of this genus probably had an ‘rrn ABCDEF dnaA+’-type genome.
Figure 2.

Core genome phylogenetic tree and proposed model of Streptomyces chromosome evolution regarding rrn operons and pericentric inversions. The core genome phylogenetic tree was constructed using the 1017 core genes. The bootstrap values inferior to 95% are indicated. Branch colors represent the two clades (1 and 2) and other lineages (group ‘O’) of Streptomyces previously reported (8,57,59). The number and completeness of rrn loci as well as rrn configuration and main intra-chromosomal rearrangements are indicated for each strain as detailed in the legend panel. Some specific events are indicated next to the relevant strains/species. The most parsimonious scenario is proposed, but in some cases (indicated by a sun), complex rearrangements in the central compartment make it difficult to develop robust evolutionary scenarios. The Supplementary Figures S2 and S3 present pairwise comparisons of the core genomes that support this model. Interestingly, the pairwise comparison of the core genome order of the strains Streptomycessp. 11 1 2, S. autolyticus CGMCC0516 and S. bingchenggensis BCW 1 suggests that they probably have a common ancestor (S.sp. 11 1 2 and S. autolyticus CGMCC0516 having almost the same core gene order), which the core-based phylogenetic tree fails to resolve clearly (Supplementary Figure S3.I). The rrn configuration of each strain/species is detailed in Supplementary Table S1. The relative position of the events described (inversion, loss/acquisition of rrn, complex rearrangements) is arbitrary and does not predict the order in which the events occurred. The sign ‘x ?’ indicates that there have been several pericentric inversions, their exact number being difficult to determine due to the highly rearranged organization of the genomes.
Consistent with this conservation of the rrn genomic core environment, the distribution of the rrn operons along the chromosome seems rather conserved for each rrn category (except for the atypical rrn operons) and evenly spaced from the origin of replication (oriC) (Figure 1D). This phenomenon is particularly visible if considering the distance between the rrn operons and oriC relative to the total size of the central compartment (rather than in bp) (Figure 1D, bottom), suggesting that the central compartment appears to be an entity within which the distances of rrn operons to the origin co-evolve. Moreover, the distribution of rrn operons on either side of the origin of replication is asymmetric (2/3 on one side and 1/3 on the other) as are the distances of the A and F rrn operons from the origin (Figure 1A and D), leading to an imbalance in terminal compartment sizes.
Finally, we observed a strong correlation between the size of this core region and the size of the central compartment (Figure 1E). Remarkably, these correlations are stronger than between the sizes of the core region and the whole chromosome, this latter correlation showing a much lower R value in clade 2 (Figure 1E).
Altogether, these observations give rise to a vision of the Streptomyces chromosome organized around a conserved skeleton constituted by both the core and the rrn genes.
Evolutionary history of the Streptomyces genome in relation to rrn dynamics
The core genome was used to reconstruct a phylogenetic tree which recapitulates the previously described (8,57,59) division of the Streptomyces genus into two main monophyletic clades (clades ‘1’ and ‘2’) and other lineages further referred to as group ‘O’ (for ‘others’) (Figure 2). By crossing this tree with genome nomenclature based on rrn categories and dnaA orientation, we propose a parsimonious scenario explaining the diversity observed in the panel of 127 analyzed genomes. According to this model, recombination between ‘D’ and ‘E’ rrn operons, and duplication/acquisition of rrn operons occurred at least 4 and 13 times, respectively (Figure 2). Notably, rrn duplications/acquisition occurred or were fixed more frequently in clade 2 and the group ‘O’ than in clade 1 (odds ratio respectively of 5.5 and 14.9, p values respectively of 6.7 × 10⁻⁴ and 1.2 × 10⁻⁵, Fisher's Exact Test for Count Data) (Figure 2, Supplementary Table S1). The two strains harboring 8 rrn operons both belong to clade 2. Remarkably, none of the genomes in the group ‘O’ show any of the most frequent rrn configurations, highlighting the complex evolutionary history of these species (Supplementary Table S1, Figure 2).
We also identify two events of complete rrn operon loss by analyzing the phylogeny of S. asterosporus DSM 41452, Streptomyces lydicus A02 and Streptomyces gilvosporeus F607 strains (Figure 2). Moreover, a few strains harbor incomplete rrn loci, also referred as unlinked rrn genes (60), devoid of 16S (Streptomyces katrae S3) or canonical 5S (S. ambofaciens ATCC 23877) rrn genes, or in most cases, composed of a single 5S rrn (Streptomycessp. Sirex AA-E, Streptomyces leeuwenhoekii C34, Streptomyces tirandamycinicus HNM0039, S. asterosporus DSM 41452). To note, in the unlinked rrn operon of S. ambofaciens ATCC 23877, the sequence encoding the 5S rrn gene is present but has accumulated mutations (Supplementary Figure S1B). Remarkably, S. asterosporus DSM 41452 harbors only three complete rrn operons, its two other rrn loci corresponding to single 5S rrn genes whose sequences differ from those present within the complete operons. Theoretically, single 5S rrn loci may result either from the loss of the 23S and 16S rrn genes or from a partial duplication/acquisition of an rrn operon, the distinction between these scenarios not always being possible (Figure 2). Interestingly, unlinked rrn loci are widespread in the genomes from environmental metagenomic data, especially in taxa predicted to have slow growth rates (60). This suggests that certain environmental conditions could be associated with a positive selection of partial or complete rrn loss events (60). In Streptomyces genus, these cases remain however a minority (frequency <7% of the 127 strains analyzed).
The vast majority of the rrn operons (99.6%) is oriented in the direction of the continuous replication, with very few cases of lagging strand orientation (Streptomyces lincolnensis LC G, Streptomyces bingchenggensis BCW1) (Supplementary Table S8). This could either illustrate (i) a strong bias introduced by rrn expression on chromosome organization (to avoid polymerase collisions (61)), as previously proposed (62,63) or (ii) a positive selection of the genomic organization that limits large genomic deletions in case of recombination between rrn operons.
Altogether these observations indicated that rrn duplication/acquisition is more frequently fixed than rrn loss or mutation. Taking into account evolutionary events involving rrn operons (gain, loss, mutation) enriches the overall picture of Streptomyces chromosome evolution.
Large pericentric inversions located in the vicinity of rrn operons
Driven by the observation of recombinant ‘[d/e]’ rrn operons (Figure 1D, Supplementary Figure S1A), we examined the possible link between rrn operons and large genome rearrangements. We identified large rearrangements in the Streptomyces chromosome by comparing the order of genes from the core genome of each strain to that of S. viridosporus T7A ATCC 39115 (exactly ordered as the consensus). Most of them correspond to pericentric inversions, with only a few other cases (e.g. S. lincolnensis LC G, Streptomyces ongiicola HNM0071, S. tirandamycinicus HNM0039, Streptomyces fungicidicus TXX3120, Streptomycessp. 11 1 2, Streptomyces autolyticus CGMCC0516 and S. bingchenggensis BCW 1) highlighting complex evolutionary scenarios (Figure 2). Indeed, the group ‘O’ contains the species with the largest number of rearrangement events (Supplemental Figure S3). These lineages do not form a clade, but a group of species that do not belong to clades 1 or 2. Thus, we lack isolates to trace the evolutionary history of this group more reliably. Thus, the exact size, number and limits of the rearrangements are difficult to establish unambiguously for some strains. Therefore, three strains of this group (Streptomycessp. 11 1 2, S. autolyticus CGMCC0516 and S. bingchenggensis BCW 1) have been excluded from the analysis presented below.
Core genome pairwise comparisons allowed the identification of 48 large rearrangements (> 200 kb) within the central compartment of 60 genomes, some of which likely occurred in the common ancestor of certain strains (Figures 2 and 3, Supplementary Table S4, Supplementary Figures S2 and S3). We thereafter calculated the distances of each rearrangement end to the closest rrn operon (Figure 3, Supplementary Table S4). Although this method has a resolution limit related to the distance of core genes to rrn and rearrangement ends, 6 of these large rearrangements (12.5%) occurred less than 10 kb from an rrn locus, four of them corresponding to independent events of recombination between D and E rrn operons (Supplementary Figure S1). Indeed, the distal core genes of these large rearrangements are located (at least on one side) at a median of less than 93 kb from an rrn operon (mainly belonging to Cc, Dd, Ee or [d/e] rrn categories, table of Figure 3B), a distance which represents 1.1% of the mean genome size. Taken together, these results suggest that rrn operons, and especially those located around the origin of replication, constitute and/or are frequently close to recombination sites. This observation raises the question of mechanisms (other than homologous recombination between D and E rrn operons) by which rrn environments could favor the occurrence and/or fixation of pericentric inversions (see Discussion).
Figure 3.

Distance from rrn loci of large rearrangements occurring in the central compartment. (A) Pairwise comparison of the core genomes of S. coelicolor A3(2) and S. viridosporus T7A ATCC 39115, used as a reference for the consensus core genome order in Streptomyces. The identity of each rrn locus is specified using the nomenclature proposed in this study. The origin of replication (oriC) was defined regarding the position of the dnaA gene, the red arrow representing the orientation of this gene. The regions colored yellow and blue indicate the position of the closest and farthest ends from an rrn operon, respectively. These were subsequently used to calculate the minimum and maximum distances of the rearrangement ends to an rrn operon, with the resolution limit of the distance of these elements to the core genes. (B) Boxplot of minimal and maximal distance of the intra-chromosomal rearrangements to rrn loci. When the same event was shared by several strains, the mean values (distances of both ends to the nearest rrn loci) were calculated so that each event (n = 48) is considered only once. For each rearrangement, the closest (‘minimal’) and farthest (‘maximal’) distance of each boundary to an rrn operon was determined. The table shows the frequencies of each category of rrn found closest to these boundaries. The boxplots of both panels represent the first quartile, median and third quartile. The upper whisker extends from the hinge to the largest value no further than 1.5 × the inter-quartile range (IQR, i.e. distance between the first and third quartiles) from the hinge. The lower whisker extends from the hinge to the smallest value at most 1.5 × IQR of the hinge.
Link between rrn operons and density in core genes
Driven by the observation that the sizes of the central compartment and the core region are highly correlated (Figure 1E), we fit general linear models to model the interplay between core and rrn gene dynamics. We explored the predictability of the core region size depending notably on the location and number of rrn genes. Other possible explanatory variables were evaluated such as the distance to the origin of replication, the size of the chromosome and of the region encompassing all tRNA encoding genes (‘tDNA region’, Supplementary Figure S4A), as well as the phylogenetic origin. We conducted both forward and backward regression approaches to select the best predictors. The best fitting model includes as explanatory variables: the sizes of the central compartment and of the chromosome, the maximal distance between the distal rrn operons and the origin of replication (‘d_max_rrn_ori’, Figure 4A), as well as the number of rrn genes (Supplementary Figure S4). This overall model is statistically significant (P < 2.2 × 10⁻¹⁶) and suggests that the four explanatory variables included in the model explain approximatively 86% of the core region variability (Supplementary Figure S4B). Accordingly the correlation between the observed size of the core region and the value predicted by this ANOVA model is very strong (R = 0.92, P < 2.2 × 10⁻¹⁶, Pearson correlation, Figure 4A), supporting the existence of an evolutionary relationship between the position of distal rrn genes and the core region.
Figure 4.

Interplay between rrn operons and core region dynamics. (A) Correlation between the predicted and observed core region sizes in the panel of 127 genomes of interest. The explanatory variables are represented in the left panel. The R coefficient and P value of Pearson's correlation tests were calculated with the whole set of genomes (n = 127). The names of the species are indicated for the genomes that present an unusual pattern in the diagnostic tests (Supplementary Figure S4). In fact, these genomes belong to the ‘O’ group, except for Streptomycessp. P3 genome, which has the most asymmetric organization (Supplementary Table S1). This suggests that the prediction model has limitations in the case of rather complex evolutionary scenarios or atypical genomic organizations and/or could help to identify them. (B) Boxplots presenting the size of the core region depending on the number of rrn genes. The boxplots represent the first quartile, median and third quartile. The upper whisker extends from the hinge to the largest value no further than 1.5 × the inter-quartile range (IQR, i.e. distance between the first and third quartiles) from the hinge. The lower whisker extends from the hinge to the smallest value at most 1.5 × IQR of the hinge. Outliers are represented (dots). The P values of two-sided Wilcoxon rank sum tests with continuity correction comparing the values observed in genomes harboring up to 18 rrn genes (red) in genomes harboring at least 19 rrn genes (green) are indicated. The number of genomes in each category (‘#’) is indicated below the graphs. (C) Boxplot presenting the core gene density depending on the number of rrn genes and the location inside or outside the central compartment. The boxplot represents the same parameters as in panel (B). The core gene density expressed as the number of core genes per 10 kb was calculated in the central compartment and in the core region located outside the central compartment (‘delta_core_rrn’ in the Supplementary Figure S4A). The P values of two-sided Wilcoxon rank sum tests with continuity correction are presented.
The size of the tDNA region was not among the best predictors of the size of the core region (Supplementary Figure S4A), emphasizing the importance of rrn-defined limits per se, independently of their role in the translation process. Moreover, this analysis supports the fact that the evolution of the core region size is determined by the number of rrn genes rather than their phylogenetic origin.
Remarkably, the increase in the number of rrn operons is correlated with a decrease in the core region size. This result highlights some kind of core region ‘densification’ correlated to the increase in the number of rrn operons (Figure 4B). This effect is in fact limited to the central compartment which harbors slightly more core genes per kb in genomes containing at least 19 rrn genes than in those containing up to 18 rrn genes (Figure 4C). The central compartment per se is 2.7-fold more dense in core genes (per size unit) than the core region located between the distal rrn and the last core genes (‘delta_core_rrn’ in the Supplementary Figure S4A), as illustrated for S. coelicolor in Figure 5A. Overall, these results indicate that rrn operons define a central compartment characterized by a high density of core genes, a feature that tends to be more pronounced as the number of rrn genes increases.
Figure 5.

Gene persistence and core gene content within the central compartment. (A) Gene persistence along the chromosome of S. coelicolor A3(2). The level of persistence along the chromosome is represented using a sliding window (81 coding sequences (CDSs), with 1 CDS steps). The positions of distal core genes (‘core’) and of all rrn operons are indicated by dashed lines. The density of the core genes is indicated below the graph. The identity of each rrn operon is specified using the nomenclature as proposed in this study (Supplementary Figure S1). The origin of replication (oriC) was defined regarding the position of the dnaA gene, the red arrow representing the orientation of this gene. (B) Mean gene persistence in the regions surrounding the origin of replication, the distal rrn and core genes. The mean persistence was calculated within a window of 81 CDS centered on the genomic feature of interest. The boxplot is built as in Figure 4B. The P values of a two-sided Wilcoxon rank sum test with continuity correction comparing the mean persistence index at the vicinity of the origin of replication (n = 127), and of the distal rrn (n = 254) or core (n = 254) genes, are indicated. (C) Distribution of the core genes within and outside the central compartment.
The gene content within the central compartment is remarkably stable
We then explored the qualitative gene content in the central compartment. We previously reported the interest of using the gene persistence index to evaluate the level of gene conservation along the S. ambofaciens ATCC 23877 chromosome (9). This index corresponds to the frequency of a given gene in a set of complete genomes of interest. In the present study, we enlarged this analysis to all the genomes of our panel (Supplementary Figure S5). As illustrated by the representative example of the S. coelicolor A3(2) chromosome (Figure 5A), beyond the distal rrn operons, there are generally a few core genes and then gene persistence decreases sharply. More precisely, the gene persistence index fluctuates along the genome, reaching the highest levels within the central compartment, especially near the origin of replication. The rrn operons, especially the ones located in a canonical core gene environment, usually localize with a persistence peak superior to 0.8, except for the ‘D’ rrn category (Supplementary Figure S6, Supplementary Table S9). Another notable exception involves the rrn operons in the lagging orientation in S. bingchenggensis BCW1 (Supplementary Figure S5, Supplementary Table S9).
Importantly, gene persistence around the distal rrn operons is in general higher than at the limits of the core region (Figure 5B). This result is in accordance with the lower core gene density observed in the core region outside the central compartment (Figure 4C).
We previously reported (9) that whereas the size of the central compartment represents a little more than half of the entire chromosome (updated values: 57.7 ± 5.7%, standard deviation, n = 127), the percentage of core genes within the central compartment is remarkably high and stable (updated values: 88.5 ± 3.0%, standard deviation, n = 127). In this study, we have extended this observation by analyzing the qualitative composition of the central compartment in core genes. Interestingly, a set of 901 core genes is almost always located in the central compartment of the Streptomyces genomes we analyzed (Figure 5C). This set of genes, further named CCC genes for ‘central compartment core’ genes, are enriched in genes encoding key cellular processes (‘private goods’) related, for instance, to central metabolism and translation (Supplementary Figure S7A). The genes of the core genome that are generally located in the terminal domains, further termed TCC genes for ‘terminal compartment core’ genes, are enriched in only a few functional categories, related mostly to lipid metabolism (Supplementary Figure S7B).
Finally, we predicted all SMBGCs in the panel of 127 Streptomyces genomes using AntiSMASH software (Supplementary Table S2). The specialized metabolite biosynthetic genes (SMBGs) were enriched in the terminal compartments compared to the central compartment (odds ratio 4.6, P value < 2.2 × 10⁻¹⁶, Fisher's exact test for count data). Moreover the median persistence index of these genes is 1.8-fold lower than the one of non-SMBGs (P value < 2.2 × 10⁻¹⁶, two-sided Wilcoxon rank sum test with continuity correction). According to previous studies (2–14), these results indicate that terminal compartments are faster-evolving regions compared to the central compartment.
Altogether, these results indicate that the central compartment constitutes a specific evolutionary entity and suggest that the distal rrn operons constitute pertinent limits to describe a functional central compartment in the Streptomyces genome.
High levels of transcription in the central compartment of Streptomyces genomes
To examine the central compartment from a functional point of view, we compared gene expression inside and outside this region over growth. We thus analyzed the available transcriptome data during metabolic differentiation of seven Streptomyces species form the clade 1 [S. ambofaciens ATCC 23877(9), S. avermitilis MA 4680 (48), S. coelicolor A3(2) (50)], clade 2 [S. clavuligerus ATCC 27064 2 3 (48), S. tsukubensis NRRL 18488 (48), S. venezuelae ATCC 10712 (51)], and group ‘O’ [S. bingchenggensis BCW 1/BC-101-4 (49)].
For all species, we observed a positive correlation between gene persistence and expression (Figure 6A, Supplementary Figure S8), as previously reported in S. ambofaciens ATCC 23877 (9) and other bacteria (64). As expected, this positive correlation is the highest during the trophophase, i.e. during vegetative growth, which is associated with the lowest expression of variable regions belonging to the specialized metabolite biosynthetic gene clusters (SMBGCs) (9) (Supplementary Figure S9). We then compared the strength of this correlation as a function of whether the genes were located inside or outside the central compartment. Interestingly, for all strains, the positive correlation between gene persistence and transcription, measured by the rho Spearman coefficient, is higher (≈+30%) in the central compartment than in the terminal compartments (Figure 6A). Moreover, during the trophophase, genes are more expressed in the central compartment, regardless of their category (core, non-core or SMBGC genes), in most strains (Supplementary Figure S9). Remarkably, this higher expression in the central compartment is conserved in all strains for non-core genes and SMBGCs during the idiophase (i.e. after the metabolic differentiation leading to specialized metabolite/idiolyte production) (Supplementary Figure S9). Altogether these results indicate that the central compartment delimitates a region associated with increased transcription (and/or RNA stability) compared to the rest of the genome.
We therefore consider the possibility that this effect could be related to a dose effect, gene copy number being higher close to the origin of replication in actively replicated chromosomes. We thus calculated the correlation between the level of expression and the distance to the origin, according to the localization of the genes inside or outside the central compartment (Figure 6B). Remarkably, this dose effect is negligible in the central compartment, whereas the distance from the origin of replication is associated with a decrease in the quantity of transcripts produced from the terminal compartments, especially from non-core genes (Figure 6B).
These results indicate that the central compartment is associated with a higher level of gene expression, regardless of either gene persistence or distance to the origin of replication in the seven strains we analyzed, even in S. bingchenggensis BCW 1/BC-101-4, which presents an atypical central compartment core gene content as a result of extensive chromosomal rearrangement (‘rrn a2 F* c2 d3 E b1* dnaA+’ configuration, Supplementary Figure S2). Indeed, 85 core genes usually located in the terminal compartments are present within the central compartment of S. bingchenggensis BCW 1, 46 core genes being relocated from the central to the terminal compartments in this strain. The pattern of correlations between gene expression and distance to the origin is globally the same in S. bingchenggensis BCW 1 as in the other strains examined (Figure 6B). These data thus strongly suggest that the physical location of genes in the central compartment per se is a major determinant of their higher expression.
DISCUSSION
This study reports for the first time the in-depth analysis of rrn operon dynamics in a panel of 127 Streptomyces species. We gather a series of observations supporting that rrn operons are part of a core skeleton and can be distinguished based on their core gene environment. This allows us to propose a new genome nomenclature based on rrn operons and dnaA orientation. On this basis, we defined a canonical organization (‘rrn ABCDEF dnaA+’) carried by 42% of species, and a consensus order of genes from the core genome, perfectly conserved in some contemporary strains such as S. viridosporus T7A ATCC 39115. The pairwise comparison of the genes of the core genome and rrn organization of this species to other strains/species of our panel (Supplementary Figures S2 and S3) allow us to propose an evolutionary history of the central compartment of the Streptomyces chromosome (Figure 2).
Interestingly, rrn operons, especially centrally located (rrn C, D and E, Figure 7), tend to be close to rearrangement borders (Figure 3), some being directly involved in homologous recombination (Figure 2). This suggests that recombination events in the vicinity of the pericentric rrn operons are more fixed and/or more frequent. We recently published S. ambofaciens’ chromosome conformation during metabolic differentiation, and we showed that, in exponential phase, these rrn operons form sharp boundaries (9), reflecting their high transcription. Moreover, they are localized in a central region that appears to be enriched in contacts around the origin (9) (Figure 7). Inter-arm contacts are favored by the SMC machineries in the S. venezuelae ATCC 10712 chromosome (19). Thus we speculate that the intra-chromosomal recombination observed in these regions could perhaps result from the spatial proximity of these regions and/or the occurrence of DNA breaks related to the strong structural tensions exerted in this genomic region (boundaries related to strong transcription, loop exclusion by SMC near the origin, and/or DNA replication progression in actively replicating cells). Interestingly, Fleurier et al. (18) recently demonstrated that transcription-dependent DNA replication blockages at overexpressed rrn operons can result in DNA breakage and cell death. Consequently, double strand breaks may be more frequent at the vicinity of rrn operons and stimulate pericentric inversions. This raises the question of whether this process is widespread in bacteria since recombination between rrn operons (65–69) or domain boundaries at the rrn operons (20–24) have also been reported in other bacteria.
Figure 7.
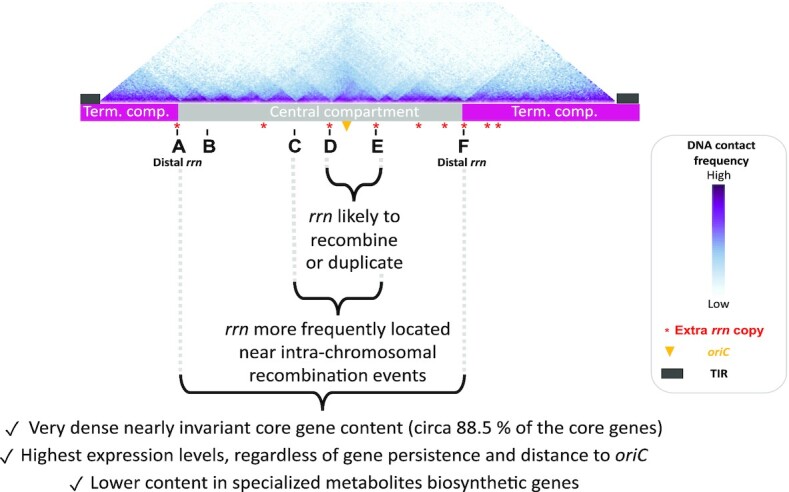
Main properties of the Streptomyces chromosome in relation to rrn operons. The schematic representation of the chromosome is shown to scale using S. ambofaciens ATCC 23877 as reference. The DNA contacts along its chromosome in exponential phase have been previously reported (9). The relative positions of extra rrn copies in other Streptomyces genomes are indicated in red. Abbreviations: ‘term. comp.’ = terminal compartment; TIR = terminal inverted repeats (represented by dark grey rectangles).
Overall, our study provides a model of the core genome size based on predictors that can be easily collected from the knowledge of the genome sequence (chromosome size, position and number of rrn genes, position of the origin of replication – Figure 4A, Supplementary Figure S4). Moreover, the location of the distal rrn operons can be easily implemented in dedicated software as an additional criterion for predicting regions of interest in the search for antibiotic-encoding SMBGCs, which tend to be acquired by horizontal gene transfer and enriched in the terminal and variable regions.
Our results confirm that rrn operons co-evolve closely with the core genome, their number being an important determinant to explain its dynamics (Figure 4). The ancestor of the Streptomyces genus probably had six rrn operons, the acquisition of additional rrn being fixed at least 13 times independently during genus evolution (Figure 2). Interestingly, the acquisition of an extra copy of rrn leads to a decreased propensity of the core region to contain non-core genes (Figure 4). This could reflect less acquisition of foreign DNA and/or the displacement of poorly conserved genes towards the ends. Overall, these results are consistent with the observation that the central region of the Streptomyces chromosome is more constrained than the arms, gene flux and shuffling operating more intensively in the latter (8).
In parallel, we show that the rrn are close to highly persistent gene environments and constitute approximate limits beyond which the persistence of genes tends to decrease rapidly (Figure 5, Supplementary Figure S5). In fact, while the concept of genetic compartmentalization of the Streptomyces chromosome is not new, defining the exact barriers has remained a challenge. Here, we propose to consider distal rrn as structural limits since they delimitate a highly conserved and expressed region, harboring 88.5% of the core genome, almost always composed of the same set of core genes.
This central compartment has functional consequences. Indeed, the correlation between gene persistence and expression is stronger within than outside this region. Higher transcription propensity at the vicinity of rrn operons has also been reported in Escherichia coli (70). Moreover, the expression of the genes located within the compartment is independent of a dose effect, i.e. it is not correlated with the distance to the origin of replication. These observations suggest that the central compartment may constitute a specific molecular environment.
HiC experiments performed in eukaryotes and some archaea revealed the existence of two compartments, namely A/B type associated to high and low transcription, respectively (71,72). Remarkably, a hub-like structure with colocalized genes involved in ribosome biogenesis has been identified in the genome of some archaea (71). At present, bacteria with circular genomes are considered to lack such compartments. The present study supports the existence of a bacterial nucleolus-like environment, constituting a molecular environment/compartment prone to transcription.
Collectively, these results indicate a link between evolutionary processes, including genetic compartmentalization and rrn operon dynamics in Streptomyces. Our study raises the question of whether rrn operons are directly involved in genetic compartmentalization, for example by protecting the core from terminal recombination, or whether they are just proxies for the evolution of a core skeleton. The existence of compartments associated with distinct expression properties opens up the possibility that gene acquisition and/or movement can be positively selected for location within a particular compartment to promote bacterial fitness. We believe this study brings new insights into the rules governing chromosome spatial organization, expression, recombination and evolution.
DATA AVAILABILITY
The Supplementary Table S1 contains a precise description of all the genomes (including accession numbers, rrn configuration, as well as values for distances or numbers of genes of interest used in this study). The complete (core and non-core) CDS annotation of all genomes is detailed in the Supplementary Table S2. The ANIb scores are available in the Supplementary Table S3. The Supplementary Table S4 lists the large rearrangements identified in the central compartment in 60 genomes. The Supplementary Table S5 contains the core genome SCO and GO annotations. The RNA-seq data normalized by DESeq2 are available in the Supplementary Table S6. The species closest to the consensus/ancestor in terms of core gene order are listed in the Supplementary Table S7. The Supplementary Tables S8 and S9 contain data on rrn genes and operons, useful for easily reproducing some of the analyses described in this study. The RNA-seq raw data used in this study are available on the NCBI Gene Expression Omnibus (GEO, https://www.ncbi.nlm.nih.gov/geo/) under the following accession codes: GSE162865 (S. ambofaciens ATCC 23877) (9), GSE118597 (S. avermitilis MA 4680) (48), GSE147644 (S. bingchenggensis BCW1/BC-101-4) (49), GSE69350 [S. coelicolor A3(2)] (50), GSE128216 (S. clavuligerus ATCC 27064 2 3) (48), GSE97637 (S. tsukubensis NRRL 18488) (48), GSE115439 (S. venezuelae ATCC 10712) (51). The 3C-seq data presented in Figure 7 is available under the GSE162865 accesion code.
CODE AVAILABILITY
The scripts used to annotate the genome (orthologous groups, core genome, etc.) and to calculate gene persistence and the ANIb are available on Github (https://github.com/jnlorenzi/rRNA_Evolution_2022) and on ZENEDO (jnlorenzi/rRNA_Evolution_2022: v1.1.1. 10.5281/ZENODO.6417495.). The scripts used to conduct the data analyses are detailed in the Supplemental File 1.
Supplementary Material
ACKNOWLEDGEMENTS
We acknowledge Hoda Jaffal for fruitful discussions and advice. SBM acknowledges G. Lelandais, P. Poulain and B. Cosson for their valuable teaching and advice during the DUO training. SBM also thanks C. Dillmann, T Mary-Huard and other teachers of the modeling course of the doctoral school ABIES. We thank Miss Meijing Dong from Prof. Feng Gao's laboratory at Tianjin University for her precious help to determine the position of the origin of replication using Ori-Finder 2022.
Notes
Present address: Jean-Noël Lorenzi, CNRS UMR7592, Institut Jacques Monod, Université Paris Diderot, Paris, France; Collège de France, CNRS, INSERM, PSL Research University, Paris, France.
Contributor Information
Jean-Noël Lorenzi, Université Paris-Saclay, CEA, CNRS, Institute for Integrative Biology of the Cell (I2BC), F-91198 Gif-sur-Yvette, France.
Annabelle Thibessard, Université de Lorraine, INRAE, DynAMic, F-54000 Nancy, France.
Virginia S Lioy, Université Paris-Saclay, CEA, CNRS, Institute for Integrative Biology of the Cell (I2BC), F-91198 Gif-sur-Yvette, France.
Frédéric Boccard, Université Paris-Saclay, CEA, CNRS, Institute for Integrative Biology of the Cell (I2BC), F-91198 Gif-sur-Yvette, France.
Pierre Leblond, Université de Lorraine, INRAE, DynAMic, F-54000 Nancy, France.
Jean-Luc Pernodet, Université Paris-Saclay, CEA, CNRS, Institute for Integrative Biology of the Cell (I2BC), F-91198 Gif-sur-Yvette, France.
Stéphanie Bury-Moné, Université Paris-Saclay, CEA, CNRS, Institute for Integrative Biology of the Cell (I2BC), F-91198 Gif-sur-Yvette, France.
SUPPLEMENTARY DATA
Supplementary Data are available at NAR Online.
FUNDING
Agence Nationale pour la Recherche [ANR-21-CE12-0044-01/STREPTOMICS]. Funding for open access charge: ANR [ANR-21-CE12-0044-01].
Conflict of interest statement. None declared.
REFERENCES
- 1. Berdy J. Thoughts and facts about antibiotics: where we are now and where we are heading. J. Antibiot. (Tokyo). 2012; 65:441. [DOI] [PubMed] [Google Scholar]
- 2. Redenbach M., Kieser H.M., Denapaite D., Eichner A., Cullum J., Kinashi H., Hopwood D.A.. A set of ordered cosmids and a detailed genetic and physical map for the 8 Mb Streptomycescoelicolor A3(2) chromosome. Mol. Microbiol. 1996; 21:77–96. [DOI] [PubMed] [Google Scholar]
- 3. Omura S., Ikeda H., Ishikawa J., Hanamoto A., Takahashi C., Shinose M., Takahashi Y., Horikawa H., Nakazawa H., Osonoe T.et al.. Genome sequence of an industrial microorganism Streptomycesavermitilis: deducing the ability of producing secondary metabolites. Proc. Natl. Acad. Sci. U.S.A. 2001; 98:12215–12220. [DOI] [PMC free article] [PubMed] [Google Scholar]
- 4. Karoonuthaisiri N., Weaver D., Huang J., Cohen S.N., Kao C.M.. Regional organization of gene expression in Streptomycescoelicolor. Gene. 2005; 353:53–66. [DOI] [PubMed] [Google Scholar]
- 5. Ikeda H., Ishikawa J., Hanamoto A., Shinose M., Kikuchi H., Shiba T., Sakaki Y., Hattori M., Omura S.. Complete genome sequence and comparative analysis of the industrial microorganism Streptomycesavermitilis. Nat. Biotechnol. 2003; 21:526–531. [DOI] [PubMed] [Google Scholar]
- 6. Choulet F., Aigle B., Gallois A., Mangenot S., Gerbaud C., Truong C., Francou F.X., Fourrier C., Guerineau M., Decaris B.et al.. Evolution of the terminal regions of the Streptomyces linear chromosome. Mol. Biol. Evol. 2006; 23:2361–2369. [DOI] [PubMed] [Google Scholar]
- 7. Bentley S.D., Chater K.F., Cerdeno-Tarraga A.M., Challis G.L., Thomson N.R., James K.D., Harris D.E., Quail M.A., Kieser H., Harper D.et al.. Complete genome sequence of the model actinomycete Streptomycescoelicolor A3(2). Nature. 2002; 417:141–147. [DOI] [PubMed] [Google Scholar]
- 8. Lorenzi J.-N., Lespinet O., Leblond P., Thibessard A.. Subtelomeres are fast-evolving regions of the Streptomyces linear chromosome. Microb. Genom. 2019; 7:000525. [DOI] [PMC free article] [PubMed] [Google Scholar]
- 9. Lioy V.S., Lorenzi J.-N., Najah S., Poinsignon T., Leh H., Saulnier C., Aigle B., Lautru S., Thibessard A., Lespinet O.et al.. Dynamics of the compartmentalized Streptomyces chromosome during metabolic differentiation. Nat. Commun. 2021; 12:5221. [DOI] [PMC free article] [PubMed] [Google Scholar]
- 10. Fischer G., Wenner T., Decaris B., Leblond P.. Chromosomal arm replacement generates a high level of intraspecific polymorphism in the terminal inverted repeats of the linear chromosomal DNA of Streptomycesambofaciens. Proc. Natl. Acad. Sci. U.S.A. 1998; 95:14296–14301. [DOI] [PMC free article] [PubMed] [Google Scholar]
- 11. Hoff G., Bertrand C., Piotrowski E., Thibessard A., Leblond P.. Genome plasticity is governed by double strand break DNA repair in Streptomyces. Sci. Rep. 2018; 8:5272. [DOI] [PMC free article] [PubMed] [Google Scholar]
- 12. Tidjani A.R., Lorenzi J.N., Toussaint M., van Dijk E., Naquin D., Lespinet O., Bontemps C., Leblond P.. Massive gene flux drives genome diversity between sympatric Streptomyces conspecifics. mBio. 2019; 10:e01533-19. [DOI] [PMC free article] [PubMed] [Google Scholar]
- 13. Hopwood D.A. Soil to genomics: the Streptomyces chromosome. Annu. Rev. Genet. 2006; 40:1–23. [DOI] [PubMed] [Google Scholar]
- 14. Zhang Z., Du C., de Barsy F., Liem M., Liakopoulos A., van Wezel G.P., Choi Y.H., Claessen D., Rozen D.E.. Antibiotic production in Streptomyces is organized by a division of labor through terminal genomic differentiation. Sci. Adv. 2020; 6:eaay5781. [DOI] [PMC free article] [PubMed] [Google Scholar]
- 15. Stevenson B.S., Schmidt T.M.. Life history implications of rRNA gene copy number in Escherichiacoli. Appl. Environ. Microbiol. 2004; 70:6670–6677. [DOI] [PMC free article] [PubMed] [Google Scholar]
- 16. Roller B.R.K., Stoddard S.F., Schmidt T.M.. Exploiting rRNA operon copy number to investigate bacterial reproductive strategies. Nat Microbiol. 2016; 1:16160. [DOI] [PMC free article] [PubMed] [Google Scholar]
- 17. Espejo R.T., Plaza N.. Multiple ribosomal RNA operons in bacteria; their concerted evolution and potential consequences on the rate of evolution of their 16S rRNA. Front. Microbiol. 2018; 9:1232. [DOI] [PMC free article] [PubMed] [Google Scholar]
- 18. Fleurier S., Dapa T., Tenaillon O., Condon C., Matic I.. rRNA operon multiplicity as a bacterial genome stability insurance policy. Nucleic Acids Res. 2022; gkac332. [DOI] [PMC free article] [PubMed] [Google Scholar]
- 19. Szafran M.J., Małecki T., Strzałka A., Pawlikiewicz K., Duława J., Zarek A., Kois-Ostrowska A., Findlay K.C., Le T.B.K., Jakimowicz D.. Spatial rearrangement of the Streptomycesvenezuelae linear chromosome during sporogenic development. Nat. Commun. 2021; 12:5222. [DOI] [PMC free article] [PubMed] [Google Scholar]
- 20. Lioy V.S., Cournac A., Marbouty M., Duigou S., Mozziconacci J., Espeli O., Boccard F., Koszul R.. Multiscale structuring of the E. coli chromosome by nucleoid-associated and condensin proteins. Cell. 2018; 172:771–783. [DOI] [PubMed] [Google Scholar]
- 21. Le T.B., Laub M.T.. Transcription rate and transcript length drive formation of chromosomal interaction domain boundaries. EMBO J. 2016; 35:1582–1595. [DOI] [PMC free article] [PubMed] [Google Scholar]
- 22. Böhm K., Giacomelli G., Schmidt A., Imhof A., Koszul R., Marbouty M., Bramkamp M.. Chromosome organization by a conserved condensin-ParB system in the actinobacterium Corynebacteriumglutamicum. Nat. Commun. 2020; 11:1485. [DOI] [PMC free article] [PubMed] [Google Scholar]
- 23. Marbouty M., Le Gall A., Cattoni D.I., Cournac A., Koh A., Fiche J.B., Mozziconacci J., Murray H., Koszul R., Nollmann M.. Condensin- and Replication-Mediated bacterial chromosome folding and origin condensation revealed by Hi-C and Super-resolution imaging. Mol. Cell. 2015; 59:588–602. [DOI] [PubMed] [Google Scholar]
- 24. Wang X., Le T.B.K., Lajoie B.R., Dekker J., Laub M.T., Rudner D.Z.. Condensin promotes the juxtaposition of DNA flanking its loading site in Bacillussubtilis. Genes Dev. 2015; 29:1661–1675. [DOI] [PMC free article] [PubMed] [Google Scholar]
- 25. Jin D.J., Cabrera J.E.. Coupling the distribution of RNA polymerase to global gene regulation and the dynamic structure of the bacterial nucleoid in Escherichiacoli. J. Struct. Biol. 2006; 156:284–291. [DOI] [PubMed] [Google Scholar]
- 26. Cabrera J.E., Jin D.J.. Active transcription of rRNA operons is a driving force for the distribution of RNA polymerase in bacteria: effect of extrachromosomal copies of rrnB on the in vivo localization of RNA polymerase. J. Bacteriol. 2006; 188:4007–4014. [DOI] [PMC free article] [PubMed] [Google Scholar]
- 27. Mata Martin C., Sun Z., Zhou Y.N., Jin D.J.. Extrachromosomal nucleolus-like compartmentalization by a plasmid-borne ribosomal RNA operon and its role in nucleoid compaction. Front. Microbiol. 2018; 9:1115. [DOI] [PMC free article] [PubMed] [Google Scholar]
- 28. Weng X., Bohrer C.H., Bettridge K., Lagda A.C., Cagliero C., Jin D.J., Xiao J.. Spatial organization of RNA polymerase and its relationship with transcription in Escherichiacoli. Proc. Natl. Acad. Sci. U.S.A. 2019; 116:20115–20123. [DOI] [PMC free article] [PubMed] [Google Scholar]
- 29. Gaal T., Bratton B.P., Sanchez-Vazquez P., Sliwicki A., Sliwicki K., Vegel A., Pannu R., Gourse R.L.. Colocalization of distant chromosomal loci in space in E. coli: a bacterial nucleolus. Genes Dev. 2016; 30:2272–2285. [DOI] [PMC free article] [PubMed] [Google Scholar]
- 30. Simão F.A., Waterhouse R.M., Ioannidis P., Kriventseva E.V., Zdobnov E.M.. BUSCO: assessing genome assembly and annotation completeness with single-copy orthologs. Bioinformatics. 2015; 31:3210–3212. [DOI] [PubMed] [Google Scholar]
- 31. Aziz R.K., Bartels D., Best A.A., DeJongh M., Disz T., Edwards R.A., Formsma K., Gerdes S., Glass E.M., Kubal M.et al.. The RAST server: rapid annotations using subsystems technology. BMC Genomics. 2008; 9:75. [DOI] [PMC free article] [PubMed] [Google Scholar]
- 32. Overbeek R., Olson R., Pusch G.D., Olsen G.J., Davis J.J., Disz T., Edwards R.A., Gerdes S., Parrello B., Shukla M.et al.. The SEED and the rapid annotation of microbial genomes using subsystems technology (RAST). Nucl. Acids Res. 2014; 42:D206–D214. [DOI] [PMC free article] [PubMed] [Google Scholar]
- 33. Fang G., Bhardwaj N., Robilotto R., Gerstein M.B.. Getting started in gene orthology and functional analysis. PLoS Comput. Biol. 2010; 6:e1000703. [DOI] [PMC free article] [PubMed] [Google Scholar]
- 34. Tatusov R.L., Koonin E.V., Lipman D.J.. A genomic perspective on protein families. Science. 1997; 278:631–637. [DOI] [PubMed] [Google Scholar]
- 35. Overbeek R., Fonstein M., D’Souza M., Pusch G.D., Maltsev N. The use of gene clusters to infer functional coupling. Proc. Natl. Acad. Sci. U.S.A. 1999; 96:2896–2901. [DOI] [PMC free article] [PubMed] [Google Scholar]
- 36. Blin K., Shaw S., Steinke K., Villebro R., Ziemert N., Lee S.Y., Medema M.H., Weber T.. 2019) antiSMASH 5.0: updates to the secondary metabolite genome mining pipeline. Nucleic Acids Res. 47:W81–W87. [DOI] [PMC free article] [PubMed] [Google Scholar]
- 37. Blin K., Shaw S., Kloosterman A.M., Charlop-Powers Z., van Wezel G.P., Medema M.H., Weber T.. 2021) antiSMASH 6.0: improving cluster detection and comparison capabilities. Nucleic Acids Res. 49:W29–W35. [DOI] [PMC free article] [PubMed] [Google Scholar]
- 38. Arndt D., Grant J.R., Marcu A., Sajed T., Pon A., Liang Y., Wishart D.S.. PHASTER: a better, faster version of the PHAST phage search tool. Nucleic Acids Res. 2016; 44:W16–W21. [DOI] [PMC free article] [PubMed] [Google Scholar]
- 39. Gao F., Zhang C.-T.. Ori-Finder: a web-based system for finding oriCs in unannotated bacterial genomes. BMC Bioinf. 2008; 9:79. [DOI] [PMC free article] [PubMed] [Google Scholar]
- 40. Luo H., Quan C.-L., Peng C., Gao F.. Recent development of ori-finder system and DoriC database for microbial replication origins. Briefings Bioinf. 2019; 20:1114–1124. [DOI] [PubMed] [Google Scholar]
- 41. Katoh K., Misawa K., Kuma K., Miyata T.. MAFFT: a novel method for rapid multiple sequence alignment based on fast Fourier transform. Nucleic Acids Res. 2002; 30:3059–3066. [DOI] [PMC free article] [PubMed] [Google Scholar]
- 42. Katoh K., Standley D.M.. MAFFT multiple sequence alignment software version 7: improvements in performance and usability. Mol. Biol. Evol. 2013; 30:772–780. [DOI] [PMC free article] [PubMed] [Google Scholar]
- 43. Kozlov A.M., Darriba D., Flouri T., Morel B., Stamatakis A.. RAxML-NG: a fast, scalable and user-friendly tool for maximum likelihood phylogenetic inference. Bioinformatics. 2019; 35:4453–4455. [DOI] [PMC free article] [PubMed] [Google Scholar]
- 44. Kumar S., Stecher G., Li M., Knyaz C., Tamura K.. MEGA X: molecular evolutionary genetics analysis across computing platforms. Mol. Biol. Evol. 2018; 35:1547–1549. [DOI] [PMC free article] [PubMed] [Google Scholar]
- 45. Goris J., Konstantinidis K.T., Klappenbach J.A., Coenye T., Vandamme P., Tiedje J.M.. DNA–DNA hybridization values and their relationship to whole-genome sequence similarities. Int. J. Syst. Evol. Microbiol. 2007; 57:81–91. [DOI] [PubMed] [Google Scholar]
- 46. Altschul S. Gapped BLAST and PSI-BLAST: a new generation of protein database search programs. Nucleic Acids Res. 1997; 25:3389–3402. [DOI] [PMC free article] [PubMed] [Google Scholar]
- 47. R Core Team R: a language and environment for statistical computing. 2021; https://www.R-project.org/.
- 48. Kim W., Hwang S., Lee N., Lee Y., Cho S., Palsson B., Cho B.-K.. Transcriptome and translatome profiles of Streptomyces species in different growth phases. Sci Data. 2020; 7:138. [DOI] [PMC free article] [PubMed] [Google Scholar]
- 49. Jin P., Li S., Zhang Y., Chu L., He H., Dong Z., Xiang W.. Mining and fine-tuning sugar uptake system for titer improvement of milbemycins in Streptomycesbingchenggensis. Synth. Syst. Biotechnol. 2020; 5:214–221. [DOI] [PMC free article] [PubMed] [Google Scholar]
- 50. Jeong Y., Kim J.N., Kim M.W., Bucca G., Cho S., Yoon Y.J., Kim B.G., Roe J.H., Kim S.C., Smith C.P.et al.. The dynamic transcriptional and translational landscape of the model antibiotic producer Streptomycescoelicolor A3(2). Nat. Commun. 2016; 7:11605. [DOI] [PMC free article] [PubMed] [Google Scholar]
- 51. Gehrke E.J., Zhang X., Pimentel-Elardo S.M., Johnson A.R., Rees C.A., Jones S.E., Hindra Gehrke, S.S., Turvey S., Boursalie S.et al.. Silencing cryptic specialized metabolism in Streptomyces by the nucleoid-associated protein Lsr2. Elife. 2019; 8:e47691. [DOI] [PMC free article] [PubMed] [Google Scholar]
- 52. Dobin A., Davis C.A., Schlesinger F., Drenkow J., Zaleski C., Jha S., Batut P., Chaisson M., Gingeras T.R.. STAR: ultrafast universal RNA-seq aligner. Bioinformatics. 2013; 29:15–21. [DOI] [PMC free article] [PubMed] [Google Scholar]
- 53. Liao Y., Smyth G.K., Shi W.. featureCounts: an efficient general purpose program for assigning sequence reads to genomic features. Bioinformatics. 2014; 30:923–930. [DOI] [PubMed] [Google Scholar]
- 54. Love M.I., Huber W., Anders S.. Moderated estimation of fold change and dispersion for RNA-seq data with DESeq2. Genome Biol. 2014; 15:550. [DOI] [PMC free article] [PubMed] [Google Scholar]
- 55. Varet H., Brillet-Gueguen L., Coppee J.Y., Dillies M.A.. SARTools: a DESeq2- and EdgeR-Based R pipeline for comprehensive differential analysis of RNA-Seq data. PLoS One. 2016; 11:e0157022. [DOI] [PMC free article] [PubMed] [Google Scholar]
- 56. Richter M., Rosselló-Móra R.. Shifting the genomic gold standard for the prokaryotic species definition. Proc. Natl. Acad. Sci. U.S.A. 2009; 106:19126–19131. [DOI] [PMC free article] [PubMed] [Google Scholar]
- 57. Caicedo-Montoya C., Manzo-Ruiz M., Ríos-Estepa R.. Pan-Genome of the genus Streptomyces and prioritization of biosynthetic gene clusters with potential to produce antibiotic compounds. Front. Microbiol. 2021; 12:677558. [DOI] [PMC free article] [PubMed] [Google Scholar]
- 58. Algora-Gallardo L., Schniete J.K., Mark D.R., Hunter I.S., Herron P.R.. Bilateral symmetry of linear Streptomycete chromosomes. Microb. Genom. 2021; 7:000692. [DOI] [PMC free article] [PubMed] [Google Scholar]
- 59. McDonald B.R., Currie C.R.. Lateral gene transfer dynamics in the ancient bacterial genus Streptomyces. mBio. 2017; 8:e00644-17. [DOI] [PMC free article] [PubMed] [Google Scholar]
- 60. Brewer T.E., Albertsen M., Edwards A., Kirkegaard R.H., Rocha E.P.C., Fierer N.. Unlinked rRNA genes are widespread among bacteria and archaea. ISME J. 2020; 14:597–608. [DOI] [PMC free article] [PubMed] [Google Scholar]
- 61. Sinha A.K., Durand A., Desfontaines J.-M., Iurchenko I., Auger H., Leach D.R.F., Barre F.-X., Michel B.. Division-induced DNA double strand breaks in the chromosome terminus region of Escherichiacoli lacking RecBCD DNA repair enzyme. PLos Genet. 2017; 13:e1006895. [DOI] [PMC free article] [PubMed] [Google Scholar]
- 62. Lim K., Furuta Y., Kobayashi I.. Large variations in bacterial ribosomal RNA genes. Mol. Biol. Evol. 2012; 29:2937–2948. [DOI] [PMC free article] [PubMed] [Google Scholar]
- 63. Lang K.S., Merrikh H.. The clash of macromolecular titans: replication-transcription conflicts in bacteria. Annu. Rev. Microbiol. 2018; 72:71–88. [DOI] [PMC free article] [PubMed] [Google Scholar]
- 64. Acevedo-Rocha C.G., Fang G., Schmidt M., Ussery D.W., Danchin A.. From essential to persistent genes: a functional approach to constructing synthetic life. Trends Genet. 2013; 29:273–279. [DOI] [PMC free article] [PubMed] [Google Scholar]
- 65. Jumas-Bilak E., Michaux-Charachon S., Bourg G., O’Callaghan D., Ramuz M.. Differences in chromosome number and genome rearrangements in the genus Brucella. Mol. Microbiol. 1998; 27:99–106. [DOI] [PubMed] [Google Scholar]
- 66. Klockgether J., Munder A., Neugebauer J., Davenport C.F., Stanke F., Larbig K.D., Heeb S., Schöck U., Pohl T.M., Wiehlmann L.et al.. Genome diversity of Pseudomonasaeruginosa PAO1 laboratory strains. J. Bacteriol. 2010; 192:1113–1121. [DOI] [PMC free article] [PubMed] [Google Scholar]
- 67. Sato M., Miyazaki K.. Phylogenetic network analysis revealed the occurrence of horizontal gene transfer of 16S rRNA in the genus Enterobacter. Front. Microbiol. 2017; 8:2225. [DOI] [PMC free article] [PubMed] [Google Scholar]
- 68. Irvine S., Bunk B., Bayes H.K., Spröer C., Connolly J.P.R., Six A., Evans T.J., Roe A.J., Overmann J., Walker D.. Genomic and transcriptomic characterization of Pseudomonasaeruginosa small colony variants derived from a chronic infection model. Microb. Genomics. 2019; 5:e000262. [DOI] [PMC free article] [PubMed] [Google Scholar]
- 69. Gifford I., Dasgupta A., Barrick J.E.. Rates of gene conversions between Escherichiacoli ribosomal operons. G3. 2021; 11:jkaa002. [DOI] [PMC free article] [PubMed] [Google Scholar]
- 70. Scholz S.A., Diao R., Wolfe M.B., Fivenson E.M., Lin X.N., Freddolino P.L.. High-Resolution mapping of the Escherichiacoli chromosome reveals positions of high and low transcription. Cell Syst. 2019; 8:212–225. [DOI] [PMC free article] [PubMed] [Google Scholar]
- 71. Takemata N., Bell S.D.. Multi-scale architecture of archaeal chromosomes. Mol. Cell. 2021; 81:473–487. [DOI] [PMC free article] [PubMed] [Google Scholar]
- 72. Lieberman-Aiden E., van Berkum N.L., Williams L., Imakaev M., Ragoczy T., Telling A., Amit I., Lajoie B.R., Sabo P.J., Dorschner M.O.et al.. Comprehensive mapping of long-range interactions reveals folding principles of the human genome. Science. 2009; 326:289–293. [DOI] [PMC free article] [PubMed] [Google Scholar]
Associated Data
This section collects any data citations, data availability statements, or supplementary materials included in this article.
Supplementary Materials
Data Availability Statement
The Supplementary Table S1 contains a precise description of all the genomes (including accession numbers, rrn configuration, as well as values for distances or numbers of genes of interest used in this study). The complete (core and non-core) CDS annotation of all genomes is detailed in the Supplementary Table S2. The ANIb scores are available in the Supplementary Table S3. The Supplementary Table S4 lists the large rearrangements identified in the central compartment in 60 genomes. The Supplementary Table S5 contains the core genome SCO and GO annotations. The RNA-seq data normalized by DESeq2 are available in the Supplementary Table S6. The species closest to the consensus/ancestor in terms of core gene order are listed in the Supplementary Table S7. The Supplementary Tables S8 and S9 contain data on rrn genes and operons, useful for easily reproducing some of the analyses described in this study. The RNA-seq raw data used in this study are available on the NCBI Gene Expression Omnibus (GEO, https://www.ncbi.nlm.nih.gov/geo/) under the following accession codes: GSE162865 (S. ambofaciens ATCC 23877) (9), GSE118597 (S. avermitilis MA 4680) (48), GSE147644 (S. bingchenggensis BCW1/BC-101-4) (49), GSE69350 [S. coelicolor A3(2)] (50), GSE128216 (S. clavuligerus ATCC 27064 2 3) (48), GSE97637 (S. tsukubensis NRRL 18488) (48), GSE115439 (S. venezuelae ATCC 10712) (51). The 3C-seq data presented in Figure 7 is available under the GSE162865 accesion code.