

Abstract
Numerous growth factors are involved in the natural bone healing process, which is precisely controlled in a time‐ and concentration‐dependent manner. Mimicking the secretion pattern of growth factors could be an effective means to maximize the bone regeneration effect. However, achieving the sequential delivery of various growth factors without the use of multiple materials or complex scaffold designs is challenging. Herein, an injectable poly(organophosphazene) hydrogel scaffold (IPS) encapsulating bone morphogenetic protein (BMP)‐2 and TGFβ‐1 (IPS_BT) is studied to mimic the sequential secretion of growth factors involved in natural bone healing. The IPS_BT system is designed to release TGFβ‐1 slowly while retaining BMP‐2 for a longer period of time. When IPS_BT is injected in vivo, the hydrogel is replaced by bone tissue. In addition, angiogenic (CD31 and alpha‐smooth muscle actin (α‐SMA)) and stemness (Nanog and SOX2) markers are highly upregulated in the early stages of bone regeneration. The IPS system developed here has promising applications in tissue engineering because 1) various amounts of the growth factors can be loaded in one step, 2) the release pattern of each growth factor can be controlled via differences in their molecular interactions, and 3) the injected IPS can be degraded and replaced with regenerated bone tissue.
Keywords: angiogenesis, bone healing, growth factors, injectable hydrogels, stem cells
One‐step preparation of injectable hydrogels for sequential release of transforming growth factor 1 and bone morphogenetic protein 2 is studied. Body temperature activates the injectable hydrogel to crosslink without crosslinking agents. Hydrogel induces angiogenesis, stem cell recruitment, and osteogenesis in vivo. Injected hydrogel promotes long‐term biological activity and is replaced by new bone tissue.

1. Introduction
Natural bone healing process involves a sequential occurrence of hematoma, inflammation, and soft and hard callus formation, which are precisely controlled by various cytokines and growth factors.[ 1 ] In the hematoma/inflammation stage, the transforming growth factor beta (TGFβ) and platelet‐derived growth factor (PDGF) are mainly involved in proinflammation and mesenchymal stromal cell (MSC) chemotaxis, whereby they recruit MSCs and fibroblasts.[ 1 , 2 ] The recruited MSCs proliferate, condensate, and differentiate to form a callus in the damaged bone tissue. In the soft callus formation stage, PDGF, fibroblast growth factor (FGF), TGFβs, and hepatocyte growth factor (HGF) are expressed for MSC proliferation and differentiation. In addition, PDGF, FGF, vascular endothelial growth factor (VEGF), and HGF promote angiogenesis, which is critical for bone defect healing.[ 1b ] Bone morphogenetic proteins (BMPs) are mainly expressed to enable osteoprogenitor cells to differentiate into osteoblasts and form mineralized bone matrix.[ 1 , 3 ] Thus, various cytokines and growth factors precisely regulate the process of bone tissue regeneration. In particular, MSC recruitment and angiogenesis are especially important in the early stages of bone regeneration.
Among the various growth factors involved in bone regeneration, TGFβ and BMP play the most critical roles because both growth factors affect various events, including angiogenesis, stem cell recruitment, and osteogenesis. TGFβ exerts multiple influences on angiogenesis, stem cell recruitment, and osteogenesis. In the early stages of bone tissue regeneration, TGFβ is mainly secreted to achieve cell recruitment and angiogenesis.[ 1 , 4 ] TGFβ also promotes osteogenic differentiation in a dose‐dependent manner, and an optimal dose of TGFβ for bone tissue regeneration has been reported.[ 5 ] In addition, TGFβ signaling induces the early differentiation of osteoprogenitors through the Smad pathway, but decreases maturation, mineralization, and differentiation to osteocytes. The BMP‐Smad signaling pathway promotes every step of osteogenic differentiation and maturation.[ 3 ]
A suitable scaffold design featuring not only sufficient mechanical support but also good biological activity is needed to effectively induce bone tissue regeneration using scaffolds. Several recent studies on growth factor‐incorporated scaffolds for bone regeneration effect have been reported.[ 6 ] Given the importance of angiogenesis and stem cell recruitment in bone tissue engineering, dual‐growth factor delivery has been used to achieve synergistic effects during bone regeneration.[ 1c ] VEGF is widely used with BMPs in scaffolds for enhanced angiogenesis and osteogenesis induction.[ 7 ] Biocomposite scaffolds containing BMP‐2 and VEGF promote MSC homing and induce angiogenesis, as well as osteogenesis.[ 8 ] In studies on stem cells for bone tissue engineering, the stem cell recruitment strategy was found to be more beneficial compared to the exogenous cell delivery method for bone tissue regeneration because the in vitro expansion of stem cells is time consuming and expensive[ 9 ] In addition, a poor survival rate of transplanted stem cells and unwanted differentiation could negatively affect bone regeneration.[ 10 ] Stem cell recruitment in bone tissue engineering has been studied as an alternative method to these approaches.[ 9 ] For example, supramolecular hydrogels containing stromal cell‐derived factor‐1 (SDF‐1) and BMP‐2 have been developed to accelerate osteogenesis by promoting stem cell recruitment.[ 11 ] Angiogenesis and stem cell recruitment are well known to be critical in bone tissue engineering, but comprehensive studies on these processes during bone regeneration are lacking.
In addition to dual‐growth factor systems, sequential delivery systems have been studied to mimic complicated physiological processes in tissue engineering. A double cryogel system composed of gelatin/chitosan cryogel covered by gelatin/heparin cryogel was previously developed for the sequential delivery of VEGF and BMP‐4, which induce angiogenesis, followed by osteogenesis.[ 12 ] Micropattern‐incorporated fibrous scaffolds have also been designed. The micropatterning of polycaprolactone/gelatin fibers and poly(ethylene glycol) hydrogels could enable the sequential release of basic FGF and BMP‐2.[ 13 ] Core–shell microcapsules containing poly(l‐lactic‐co‐glycolic acid) and alginate have also been developed; therein, PDGF and VEGF were respectively incorporated into the core and shell regions of these microcapsules, thereby enabling the sequential release of both growth factors.[ 14 ] Such studies indicate that the sequential delivery of multiple growth factors is an alternative strategy for enhanced bone regeneration. However, this technology requires the fabrication of a sequential growth factor‐releasing scaffold, which entails the use of multiple materials and complicated scaffold structures. Hence, the development of a simple hydrogel method that can contain multiple growth factors and control the release of each growth factor is needed.
Hydrogel‐based injectable scaffolds have been studied in tissue engineering because of their clinical merits. Injectable hydrogel scaffolds can easily be implanted into the target site and provide an appropriate microenvironment for tissue engineering owing to their high water content and extracellular matrix (ECM)‐mimicking structure. Injectable scaffolds can also avoid potential tissue damage from an invasive surgery[ 15 ] and may easily and homogeneously incorporate biological molecules with high loading efficacy for drug delivery.[ 15 , 16 ] However, in general, injectable hydrogels present weak mechanical properties with shear‐thinning characteristics; thus, although they can be easily injected into the target region, they undergo rapid degradation.[ 17 ] Ideally, injectable hydrogel scaffolds should remain in the target region to promote tissue regeneration through various biological activities.[ 18 ] The mechanical properties of injectable hydrogels can be reinforced using various strategies, including the manipulation of their concentration/functional groups and provision of an additional interpenetrating network.[ 19 ] Hence, injectable hydrogels that could maintain a stable network and support continuous biological activities in the target region without additional mechanical property‐enhancing agents or post‐crosslinking procedures, should be studied.
In this paper, we developed an injectable poly(organophosphazene) hydrogel scaffold (IPS) encapsulating BMP‐2 and TGFβ‐1 (IPS_BT) that could achieve a sequential release profile resembling the cytokine release process during natural bone tissue healing (Figure 1 ). We designed the IPS_BT system to release TGFβ‐1 slowly over 30 d and retain nearly all of the loaded BMP‐2. Differences in the interaction strength between the loaded growth factors and IPS enabled the controlled release of each growth factor without additional materials or a complicated scaffold design. Various amounts of BMP‐2 and TGFβ‐1 were easily loaded into IPS at 4 °C by simple stirring, and the growth factor‐loaded system formed a gel state at 37 °C through hydrophobic interactions (Table 1 ). IPS_BT injection successfully induced angiogenesis and stem cell recruitment in the early stages of bone development, thereby accelerating its later stages. When IPS_BT was injected into the ectopic and orthotopic regions, bone regeneration was induced within the hydrogel. Therefore, the optimal growth factor dose and sequential release profile of IPS_BT promoted bone tissue regeneration. The injected IPS_BT was biodegraded and replaced with regenerated bone tissue in vivo at the injection site.
Figure 1.

Schematic of the preparation of injectable poly(organophosphazene) hydrogel scaffolds encapsulating BMP‐2 and TGFβ‐1 and the sequential release of each growth factor.
Table 1.
BMP‐2 and TGFβ‐1 contents of the IPS hydrogels used in the present study
| Sample | BMP‐2 content [µg/200 µL] | TGFβ‐1 content [µg/200 µL] | Injection region | Analytical methods |
|---|---|---|---|---|
| IPS | 0 | 0 | Ectopic, orthotopic | Micro‐CT, histology, RT‐PCR, western blot, immunofluorescence |
| IPS_B20 (IPS_B) | 20 | 0 | Ectopic, orthotopic | Micro‐CT, histology, RT‐PCR, western blot, immunofluorescence |
| IPS_T1 (IPS_T) | 0 | 1 | Ectopic, orthotopic | Micro‐CT, histology, RT‐PCR, western blot, immunofluorescence |
| IPS_B20T1 (IPS_BT) | 20 | 1 | Ectopic, orthotopic | Micro‐CT, histology, RT‐PCR, western blot, immunofluorescence |
| IPS_B15T1 | 15 | 1 | Ectopic | Micro‐CT, histology |
| IPS_B10T1 | 10 | 1 | Ectopic | Micro‐CT, histology |
| IPS_B5T1 | 5 | 1 | Ectopic | Micro‐CT, histology |
| IPS_B20T0.1 | 20 | 0.1 | Ectopic | Micro‐CT, histology |
| IPS_B20_T0.5 | 20 | 0.5 | Ectopic | Micro‐CT, histology |
| IPS_B20T2 | 20 | 2 | Ectopic | Micro‐CT, histology |
2. Results and Discussion
2.1. Characterization of IPS
The synthesized IPS polymer was analyzed via 1H‐NMR and gel permeation chromatography (GPC, Figure S1, Supporting Information). 1H‐NMR analysis of the side‐chain ratio of the IPS polymer revealed IleOEt, α‐amino‐ω‐methoxy‐poly(ethylene glycol) (AMPEG), and glutaric acid contents of 74%, 12.5%, and 11.5% respectively. The IPS hydrogel was mainly composed of hydrophobic IleOEt and hydrophilic AMPEG, which endowed it with thermosensitive gelation properties. Specifically, IPS could achieve thermosensitive physical crosslinking through hydrophobic interactions between the IleOEt groups. Hydrophobic groups also interact with the hydrophobic regions of BMP‐2 and TGFβ‐1. The presence of glutaric acid supported ionic interactions between positively charged BMP‐2 and TGFβ‐1. The M w and polydispersity index (PDI) of the hydrogel were measured via GPC to be 35.819 kDa and 2.87, respectively.
The time‐dependent mechanical properties of the hydrogel were measured (Figure 2 ). The storage modulus of the IPS significantly increased at temperatures above 30 °C and peaked at 42.6 °C (Figure 2a). The frequency sweep data obtained at 37 °C indicated the formation of a stable network at body temperature, which means that the injectable hydrogel scaffold could maintain a stable gel state in the target region (Figure S2a, Supporting Information). Additionally, the compressive modulus of the crosslinked hydrogel scaffold was measured to be 7.57 ± 0.67 kPa (Figure S2b, Supporting Information). The temperature‐dependent mechanical properties of IPS_B, IPS_T, and IPS_BT were also investigated (Figure 2b–d). After BMP‐2 and TGFβ‐1 encapsulation, the overall mechanical properties of the hydrogels did not show significant changes, and all hydrogels maintained their gel stage at body temperature.
Figure 2.
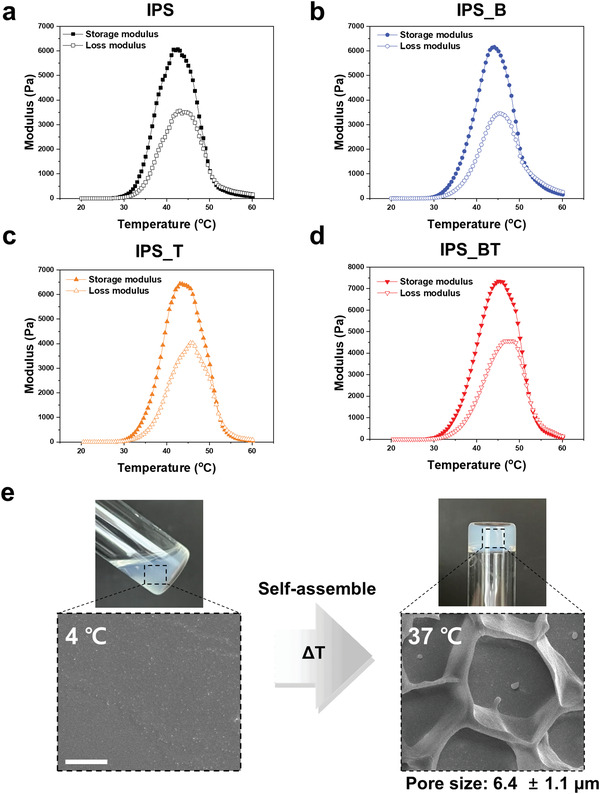
Temperature‐dependent mechanical properties of IPS encapsulating various BMP‐2 and TGFβ‐1 contents. Storage and loss moduli of a) IPS, b) IPS with BMP2 (20 µg/200 µL), c) IPS with TGFβ‐1 (1 µg/200 µL), and d) IPS with BMP2 (20 µg/200 µL) and TGFβ‐1 (1 µg/200 µL). e) Cryo‐SEM image of IPS before and after thermal crosslinking (Scale bar = 5 µm).
Surface morphology of the IPS was also evaluated at 4 and 37 °C using cryoscanning electron microscopy (SEM) (Figure 2e). Hydrogel structure was not detected at 4 °C but porous structure was observed at 37 °C. This means that when the temperature increased, polymer chains were physically crosslinked and formed a porous hydrogel scaffold structure. In addition, after the incorporation of growth factors in the IPS, the porous morphology did not significantly change and protein aggregation was not observed (Figure S3, Supporting Information), indicating a homogeneous interaction between the IPS and growth factors. Thus, BMP‐2 and TGFβ‐1 could easily be loaded into the IPS without adversely affecting the hydrogel network. In summary, the IPS was homogeneously loaded with the growth factors in the sol state and directly gelated at body temperature, which clearly indicates its potential use as a scaffold.
The cytotoxicity of the hydrogel was evaluated to assess the possibility of adverse side effects, such as inflammation and necrosis (Figure S4, Supporting Information). The 3‐(4,5‐dimethylthiazol‐2‐yl)‐2,5 diphenyltetrazolium bromide (MTT) assay data obtained after 24 h revealed almost 100% viability even in the 10 000 µg mL−1 polymer solution. This result indicates that the IPS hydrogels could be used as a scaffold without negative side effects. As poly(organophosphazene)‐based materials degrade via hydrolysis into nontoxic materials,[ 20 ] the IPS hydrogels present long‐term safety.
2.2. Ionic and Hydrophobic Interactions between IPS and Growth Factors
Owing to the amphiphilic properties of IPS, at low concentration (1 wt%), its polymer structure self‐assembles and forms polymeric micelle particles through single‐chain folding;[ 21 ] specifically, IPS self‐assembles and forms a hydrophilic polyethylene glycol (PEG) layer at the exterior of the micellar structure and a hydrophobic IleOEt layer at the core. Our previous studies indicated that the particle size and PDI of the polymeric nanoparticles significantly decreased after BMP‐2 encapsulation because of ionic and hydrophobic interactions.[ 16 , 22 ] The interaction between IPS and the growth factors affects the particle size and zeta potential of the hydrogel, and BMP‐2 and TGFβ‐1 present hydrophobic regions, which can bind to hydrophobic molecules.[ 23 ] Moreover, at pH 7, TGFβ‐1 (pI: 8.83) and BMP‐2 (pI: 9.15) are positively charged but have different molecular structures and ionic strengths.[ 24 ] Thus, the particle size and zeta potential of the hydrogels before and after BMP‐2 and TGFβ‐1 loading were measured using dynamic light scattering (DLS) to evaluate their interactions (Figure 3a,b).
Figure 3.

Physical interactions between IPS and the growth factors and the in vitro release of BMP‐2 and TGFβ‐1 from IPS_BT immersed in PBS at 37 °C. a) Particle size of IPS, IPS_B, IPS_T, and IPS_BT with the corresponding PDI values (n = 5). b) Zeta potentials of IPS, IPS_B, IPS_T, and IPS_BT (n = 4). c) Cumulative release profiles of BMP‐2 and TGFβ‐1 over 50 d (n = 3). d) Released, remaining, and undetected amounts of BMP‐2 and TGFβ‐1 determined using ELISA kits (n = 3). Error bars indicate mean ± standard deviation. * p < 0.5, ** p < 0.01, and *** p < 0.001(one‐way analysis of variance with post hoc Tukey's multiple comparison test).
The particle size of IPS was 199 nm and decreased significantly after the incorporation of BMP‐2, TGFβ‐1, or both. We previously reported that physical interactions between polymeric and biological molecules, including charged siRNA and growth factors, decreased the particle size and PDI of a polyplex.[ 16 , 25 ] Thus, interactions between the growth factors and IPS could be evaluated by measuring the particle sizes of IPS, IPS_B, IPS_T, and IPS_BT. The particle sizes of IPS_B, IPS_T, and IPS_BT sharply decreased to 149, 174, and 177 nm, respectively, indicating the occurrence of interactions between the hydrogel and both growth factors with different interaction strengths. Among the hydrogels, IPS_B presented the smallest particle size, which means the interaction between IPS and BMP‐2 is stronger than that between IPS and TGFβ‐1. The PDI values obtained indicated that IPS_B has a more homogeneous particle size than IPS, IPS_T, and IPS_BT. Moreover, the particle size of IPS_BT was similar to that of IPS_T. Thus, differences in the PDI values of IPS_T and IPS_B could be attributed to differences in the interaction strength and stability of BMP‐2 and TGFβ‐1. These results reveal that BMP‐2 and TGFβ‐1 could be encapsulated in IPS through hydrophobic and ionic interactions.
The zeta potentials of the samples were measured to evaluate the ionic interaction between IPS and the growth factors. Owing to the acidic moiety of IPS, its zeta potential was measured to be −6.3 mV before growth factor encapsulation. IPS_B, IPS_T, and IPS_BT showed zeta potentials of −1.5, −4.9, and −1.2 mV respectively, which indicates that IPS could interact with both growth factors through ionic interactions. The zeta potential of IPS_B was lower than that of IPS_T owing to the higher positive charge of BMP‐2 compared with that of TGFβ‐1. Among the samples, IPS_BT showed the lowest zeta potential because it contained the highest amount of positively charged proteins. These results confirm that BMP‐2 and TGFβ‐1 could successfully be encapsulated into the IPS hydrogel through hydrophobic and ionic interactions. IPS_B showed more stable hydrophobic and ionic interactions than IPS_T. We therefore conclude that the differences in the hydrophobicity and charge of BMP‐2 and TGFβ‐1 lead to differences in their interactions with IPS and, in turn, differences in their release from IPS_BT.
The release profiles of BMP‐2 and TGFβ‐1 are related to the interactions of IPS with these growth factors. The release of the growth factors from IPS_BT was measured at predetermined time points to verify whether the hydrogel could achieve their controlled release (Figure 3c,d). The cumulative release data showed that the BMP‐2 release rate is much lower than the TGFβ‐1 release rate, which is highly correlated with differences in the molecular interactions of these growth factors with IPS (Figure 3c). The release rates of TGFβ‐1 after 10 and 50 d were 33% and 48%, respectively. Approximately 21% of the loaded TGFβ‐1 remained in IPS_BT after 50 d. In comparison, 4% of the encapsulated BMP‐2 was detected after 10 d. After 50 d, 26% of the loaded BMP‐2 was released, and 69% remained encapsulated in IPS_BT (Figure 3d). Therefore, IPS_BT could achieve the slow release of TGFβ‐1 and long‐term maintenance of BMP‐2. These results collectively demonstrate that the IPS system could achieve the sequential delivery of dual growth factors owing to the differences in the molecular interactions between the hydrogel and encapsulated growth factors without additional materials or a complicated scaffold design.
2.3. Ectopic Bone Formation of IPS Hydrogels with Various BMP‐2 and TGFβ‐1 Contents
The ectopic bone regeneration model is extremely useful for evaluating bone‐forming biomaterials and growth factors; however, owing to the lack of appropriate signaling molecules, the biomaterials must have sufficient biological activity for osteogenic induction.[ 26 ] Thus, the bone‐forming ability of the IPS system was evaluated using the ectopic model (Figures 4 and 5 ). Given its injectability, the effect of the IPS system on bone regeneration could be analyzed without surgical procedures. We anticipate that the ectopic bone regeneration results will indicate that the IPS system could promote bone regeneration in various bone defect areas.
Figure 4.

Bone tissue regeneration 4 weeks after the subcutaneous injection of IPS with various BMP‐2 doses (n = 4). a) Micro‐CT images and b) bone volume measurements. Scale bar = 1 mm c) Regenerated tissue in the ectopic region. d) H&E and e) MT staining results of bone tissue regeneration (NB: new bone). Scale bar = 200 µm. Error bars indicate mean ± standard deviation. * p < 0.5, ** p < 0.01, and *** p < 0.001 (one‐way analysis of variance with post hoc Tukey's multiple comparison test).
Figure 5.

Bone tissue regeneration 4 weeks after the subcutaneous injection of IPS with various TGFβ‐1 doses (n = 4). a) Micro‐CT images and b) bone volume measurements. Scale bar = 1 mm. c) Regenerated tissue in the ectopic region. d) H&E and e) MT staining results of bone tissue regeneration (NB: new bone). Scale bar = 200 µm. Error bars indicate mean ± standard deviation. * p < 0.5, ** p < 0.01, and *** p < 0.001 (one‐way analysis of variance with post hoc Tukey's multiple comparison test).
IPS can encapsulate various amounts of the growth factors and provide an optimal environment for their functions in vivo (Table 1). IPS_T1, IPS_B5T1, IPS_B10T1, IPS_B15T1, and IPS_B20T1 were designed and subcutaneously injected into the ectopic region of mice to determine the optimal dose of BMP‐2 for bone regeneration (Figure 4). The microcomputed tomography (micro‐CT) data obtained 4 weeks after injection revealed that new bone was formed by all dual‐growth factor‐encapsulating groups (Figure 4a). The regenerated bone volumes of IPS_B5T1, IPS_B10T1, IPS_B15T1, and IPS_B20T1 were found to be 0.98, 8.17, 18.7, and 30.12 mm3, respectively (Figure 4b). The bone volumes significantly increased with the BMP‐2 dose in IPS hydrogels containing 1 µg of TGFβ‐1. The results also confirmed that the injected scaffolds were replaced with regenerated tissue. Obvious vascularization, especially in IPS_B20T1, was observed (Figure 4c). The hematoxylin and eosin (H&E) and Masson's trichrome (MT) staining images showed that injection with IPS_T1 did not lead to new bone formation owing to the lack of the osteogenic differentiation signals of BMP‐2; instead, only cell recruitment was observed in this group. By contrast, new bone formation was observed in all dual‐growth factor‐loaded groups. In particular, thick and compact bone was regenerated from the surface of the hydrogels when the BMP‐2 dose exceeded 10 µg (Figure 4d,e). Therefore, at a fixed TGFβ‐1 dose, bone regeneration from the IPS_BT hydrogels was affected by the BMP‐2 dose, and bone regeneration occurred from the surface of the injected hydrogel to its inner region. Previous reports have indicated that high doses of BMP‐2 may induce negative side effects.[ 27 ] However, in the present IPS system, obvious side effects due to the growth factors were not observed in the in vivo ectopic model. This result indicates that the sustained release of the growth factors prevents adverse side effects and provides an appropriate biological environment for tissue regeneration.
The bone regeneration effect of different TGFβ‐1 dosages was also investigated. Previous research revealed that the sustained release of BMP‐2 can successfully induce bone regeneration; however, slow BMP‐2 release can mitigate its bone regeneration effects.[ 22 ] Given this context, IPS_B20 could not induce bone regeneration in the ectopic region because of the slow release profile of BMP‐2 (Figures 3a and 6 ). However, with TGFβ‐1 incorporation, new bone was successfully regenerated in the ectopic region (Figure 5a). The bone volumes obtained after IPS_B20T0.1, IPS_B20T0.5, IPS_B20T1, and IPS_B20T2 injection were 12.2, 15.6, 37.2, and 16.6 mm3, respectively. The micro‐CT data showed that the bone regeneration increased with increasing TGFβ‐1 dose until 1 µg (Figure 5b). However, the bone regeneration effect decreased in the IPS_B20T2 group, indicating that the optimal TGFβ‐1 dose for osteogenesis had exceeded. Previous studies indicate that TGFβ‐1 can have positive or negative effects on the bone tissue regeneration because TGFβ‐1 is closely associated with various biological mechanisms involved in osteogenesis.[ 3 , 28 ] Xu et al. reported that a low dose of TGFβ‐1 activates smad3 and upregulates the BMP‐2 expression by promoting smad3 binding to BMP‐2 promoter in MSCs. In contrast, a high concentration of TGFβ‐1 changes the smad3 binding sites on the promoter, which in turn, inhibits BMP‐2 transcription.[ 29 ] Xu et al. implanted β‐tricalcium phosphate ceramic particles containing stem cells in a test mouse, then administered a selected dose of TGFβ1 and covered the implant by using hydrogel to evaluate the effect of TGFβ1 dose in bone regeneration. 100–500 ng doses of TGFβ1 resulted in high bone volume regeneration in vivo.[ 29 ] However, for IPS_BT, 1000 ng of TGFβ1 exhibited higher bone regeneration results than groups where 500 ng was administered. This was because, in the early stage (up to 14 d) after the procedure, angiogenesis and cell recruitment primarily occurred rather than bone regeneration, during this time, approximately half of the total TGFβ1 dose (Figure 3c) was released. After 14 d, the remaining TGFβ1 maintained the optimal dose for osteogenesis, indicating the IPS_BT could invoke different biological activities at different stages, which could maximize bone regeneration.
Figure 6.

Angiogenesis in the IPS system. The angiogenic markers CD31 and αSMA were analyzed after IPS injection. a) Scheme of the in vivo study. Angiogenesis was analyzed 7 d after injection. b) Gene expression levels of CD31 and αSMA at all time points considered (n = 3). c) Western blot results of CD31 and αSMA. d) Quantitative data of the Western blot bands (n = 3). e) Immunofluorescence analysis of the angiogenic markers (green: αSMA, red: CD31, blue: DAPI, yellow arrow: blood vessel). Scale bar = 100 µm. Error bars indicate mean ± standard deviation. * p < 0.5, ** p < 0.01, and *** p < 0.001 (one‐way analysis of variance with post hoc Tukey's multiple comparison test).
Therefore, IPS_B20T1 (IPS_BT) was selected as the optimal growth factor composition for bone tissue regeneration. Obvious vascularization and tissue formation were also observed (Figure 5c). The H&E and MT staining results revealed new bone formation, as well as thick and compact bones, in all dual‐growth factor delivery groups. In the IPS_B20 group, the cells were successfully recruited; however, newly formed bone tissue was not observed (Figure 5d,e). Thus, the IPS encapsulating BMP‐2 and TGFβ‐1 could maximize the bone regeneration effect of these growth factors when they were present in the IPS hydrogel at the optimal dosage.
TGFβ‐1 mainly promotes the differentiation and expansion of osteoprogenitor cells but inhibits osteocyte differentiation and mineralization.[ 3 ] Furthermore, TGFβ‐1 must be applied at the optimal dosage to induce successful bone regeneration effect.[ 5c ] Therefore, maintaining the appropriate dose of TGFβ‐1 in IPS in the early and late stages of bone regeneration is critical. The results indicate that the sequential release of TGFβ‐1 and BMP‐2 from IPS_BT could be advantageous for bone tissue regeneration.
2.4. Angiogenesis and Stem Cell Recruitment in the Early Stages of Ectopic Bone Regeneration
Angiogenesis and stem cell recruitment are critical to the initiation and promotion of bone regeneration.[ 30 ] Blood vessels are highly related to the recruitment of inflammatory and bone precursor cells, which positively affect bone regeneration.[ 30 , 31 ] The chemotaxis of TGFβ‐1 and BMP‐2 can promote angiogenesis and stem cell recruitment.[ 32 ] We hypothesized that the optimal dose and sequential release of TGFβ‐1 and BMP‐2 can promote early stage angiogenesis and stem cell recruitment, which would further enhance their osteogenic effect. IPS, IPS_B, IPS_T, and IPS_BT were subcutaneously injected into mice, and their effects on angiogenesis and stemness were investigated at specific time points (Figures 6 and 7 ).
Figure 7.

Stem cell recruitment in the IPS system. Stemness markers (Nanog, SOX2) were analyzed after IPS injection. a) Scheme of the in vivo study. Stemness was analyzed 14 d after injection. b) Gene expression levels of Nanog and SOX2 at all time points considered (n = 3). c) Western blots of Nanog and SOX2. d) Quantitative data of the Western blot bands (n = 3). e) Immunofluorescence analysis of the stemness markers (green: SOX2, red: Nanog, blue: DAPI). Scale bar = 50 µm. Error bars indicate mean ± standard deviation. * p < 0.5, ** p < 0.01, and *** p < 0.001(one‐way analysis of variance with post hoc Tukey's multiple comparison test).
Angiogenesis was analyzed 7 d after the injection of the hydrogels (Figure 6a). The real‐time polymerase chain reaction (RT‐PCR) data revealed that the gene expression levels of CD31 and α‐SMA were highly upregulated in the growth factor‐loaded groups after 7 d (Figure 6b). The expression of alpha‐smooth muscle actin (α‐SMA) was 107.8‐fold higher in the IPS_B20T1 group compared with that in the IPS group. The expression of CD31 was also 60.2‐fold higher in the IPS_BT group compared with that in the IPS group. The protein expression levels of α‐SMA and CD31 were significantly higher in the IPS_BT group compared with that in the other groups, which agrees with the RNA expression data (Figure 6c,d). The expression levels of CD31 and α‐SMA in the IPS_BT group were upregulated by 4.56‐ and 12.58‐fold compared with those in the IPS group. However, the expression of the stemness markers Nanog and SOX2 in the IPS_BT group was not significant at 7 d (Figure S5, Supporting Information). This finding reveals that IPS_BT facilitates angiogenesis in the early stages of tissue regeneration. Immunofluorescence staining was performed 7 d after injection to further confirm the angiogenesis enhancement effect of IPS_BT (Figure 6e). A large number of blood vessels extending from the surroundings to the inner regions of the IPS_BT hydrogels were observed. By contrast, only a few blood vessels were observed in the IPS, IPS_B, and IPS_T1 groups, and these vessels were concentrated in their periphery.
The stemness markers Nanog and SOX2 were investigated (Figure 7a). SOX2 and Nanog affect the proliferation and differentiation of stem cells.[ 33 ] The expression of these stemness markers was analyzed 14 d after the ectopic injection of IPS, IPS_B, IPS_T, and IPS_BT. The expression of Nanog and SOX2 14 d after the injection of IPS_B20T1 was upregulated by 234.5‐ and 87.8‐fold, respectively, relative to the control (Figure 7b). The Western blot data agreed well with the RT‐PCR data (Figure 7c,d). The expression levels of Nanog and SOX2 in the IPS_BT were 1.69‐ and 3.88‐fold higher compared with those in the IPS group (Figure 7d). Staining for Nanog and SOX2 was also performed at the 14 d time point (Figure 7e). Whereas the IPS, IPS_B, and IPS_T1 groups did not show positive results for Nanog and SOX2, the IPS_BT group showed a large number of positively stained cells. Overall, injection with IPS_BT led to significantly higher stemness levels compared with injections with the single‐growth factor groups, indicating the synergistic effect of the stemness markers within IPS_BT. In addition, the initial acceleration of angiogenesis may induce increased stem cell recruitment. The expression of CD31 and αSMA in IPS_BT was higher than that in the other groups after 14 d (Figure S6, Supporting Information), indicating a maintenance of high vascularization with an increase in stemness.
The gene expression of the osteogenic markers collagen I and osteocalcin was also investigated (Figure S7, Supporting Information). Both markers were highly upregulated in IPS_BT, especially at 4 weeks, indicating that angiogenesis and stem cell recruitment, followed by effective osteogenic differentiation, occurred.
IPS_BT showed synergistic effects on angiogenesis and stemness in vivo, which means both growth factors remained active in the hydrogel. Analysis of the angiogenesis and stemness data, as well as the bone regeneration data, indicated that IPS_BT, which showed high vascularization and stemness in the early stages of bone regeneration, exerted greater bone regeneration effects than the other hydrogels. This finding confirms the correlation between vascularization/stem cell recruitment and bone regeneration. During natural bone healing, angiogenesis and stem cell recruitment occur in the early stages of bone tissue regeneration. Therefore, the data indicate that angiogenesis, stemness, and osteogenesis are sequentially promoted by the sequential delivery and optimal dose of BMP‐2 and TGFβ‐1 in IPS_BT, similar to the natural bone healing process. In addition, the injected IPS_BT was replaced with newly formed tissue, indicating that cell recruitment and differentiation remodeled the scaffold while producing natural ECM.
2.5. Orthotopic Bone Formation
To evaluate the bone tissue regeneration effect of the hydrogels around the host bone, we administered IPS, IPS_B, IPS_T, and IPS_BT over the calvarial bone (Figure 8 ). The bone regeneration effect of IPS, IPS_B, IPS_T, and IPS_BT may be expected to be higher in the orthotopic region than in the ectopic region owing to the effect of cytokines and osteoprecursor cells present in natural bone tissue.[ 26 , 34 ] The micro‐CT images indicated that the volumes of the new bone formed in the IPS_B and IPS_BT hydrogels were 3 and 53.4 mm3, respectively (Figure 8a,b). Unlike the ectopic bone formation results, new bone was observed in the periphery or near the natural bone following injection with IPS_B. This result reveals that the cytokines and osteogenic cells around natural bone tissue assist in the osteogenesis effect of the hydrogel. Injection with IPS_BT led to obvious bone regeneration. Moreover, the regenerated bone volume of IPS_BT was significantly higher than that of the other groups, thereby implying that the synergistic effect of BMP‐2 and TGFβ‐1 in the hydrogel positively affects bone regeneration. The IPS_BT group showed obvious vascularization with extensive bone regeneration (Figure 8c). H&E and MT staining further confirmed the bone regeneration effect of IPS_BT (Figure 8d,e). Following injection with IPS_B, a thin layer of new bone was observed in the periphery of the hydrogel. IPS_BT injection led to new bone formation from the periphery to the inner region of the hydrogel scaffold.
Figure 8.
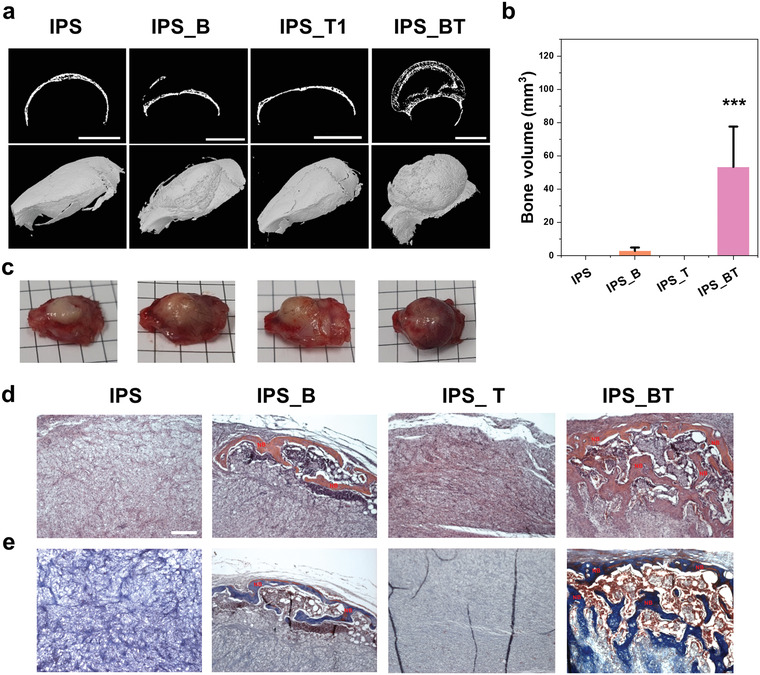
Orthotopic bone regeneration by IPS encapsulating growth factors. a) Micro‐CT images of calcified bone. Scale bar = 5 mm. b) Regenerated bone volume quantitation (n = 3). c) Photographs of extracted calvarial tissue collected 4 weeks after IPS injection. d) H&E and e) MT staining results indicating new bone regeneration. Scale bar = 200 µm. Error bars indicate mean ± standard deviation. * p < 0.5, ** p < 0.01, and *** p < 0.001(one‐way analysis of variance with post hoc Tukey's multiple comparison test).
3. Conclusions
An IPS capable of dual growth factor encapsulation and sequential release control was developed in this work. The injectable scaffold was prepared by mixing the growth factors with IPS in one step at 4 °C, which formed a hydrogel after injection into the body. IPS_BT was designed by considering the differences in the molecular properties of BMP‐2 and TGFβ‐1 so that TGFβ‐1 is slowly released while BMP‐2 is encapsulated in the hydrogel for a longer period of time; this release pattern resembles the sequence of growth factor secretion during natural bone healing. After injection of IPS_BT in vivo, angiogenesis, stem cell recruitment, and osteogenesis sequentially occurred, similar to the natural bone healing process. Moreover, in the in vivo ectopic and orthotopic environments, IPS_BT successfully promoted bone regeneration effects in the hydrogel‐injected region with minimal invasiveness. Stem cell infiltration and bone formation within the IPS hydrogels were observed in vivo, which means that IPS provides an environment that can mimic the natural bone healing process. Thus, the IPS system encapsulating dual growth factors effectively promoted tissue regeneration and was replaced with the infiltrated cells and natural tissue, showing potential benefits for clinical use. The results collectively suggest that our IPS system can be applied to the sequential delivery of multiple growth factors to maximize the tissue regeneration effect.
4. Experimental Section
Materials
Hexachlorocyclotriphosphazene (Sigma‐Aldrich, USA) was purified by recrystallization under vacuum at 70 °C. l‐isoleucine ethyl ester hydrochloride (IleOEt, HangZhou, China), methoxy poly(ethylene glycol) (MW, 750 Da; Sigma‐Aldrich, USA), aminoethanol (Sigma‐Aldrich) glutaric anhydride (Alfa Aesar, England), 4‐(dimethylamino) pyridine (DMAP, Daejung, Korea), and aluminum chloride (AlCl3, Sigma‐Aldrich) were also used in the experiments. Methoxy poly(ethylene glycol) was converted into AMPEG. Tetrahydrofuran (THF, Daejung) and triethylamine (TEA, Daejung) were distilled in a N2 atmosphere. Sodium metal (Sigma‐Aldrich) and benzophenone (Daejung) were added to the THF distillation reactor for drying. Barium oxide (Daejung) was used in the TEA distillation reactor. BMP‐2 (Cowellmedi, Korea) and TGFβ‐1 (R&D Systems, USA) were purchased and diluted according to the manufacturer's protocol.
Synthesis of IPS
IleOEt, AMPEG, and glutaric anhydride were dried under vacuum at 60 °C 3 d prior to the synthesis proper. Hexachlorocyclotriphosphazene (10 g) and AlCl3 (0.5 g) were mixed in a glove box filled with dried Ar gas. The mixture was sealed in a glass ampule and then baked at 250 °C with shaking to synthesize poly(dichlorophosphazene). The synthesized poly(dichlorophosphazene) was placed in a flask in the glove box and sealed with a septum (Sigma‐Aldrich). All reactions were performed under a dry N2 atmosphere using a standard Schlenk line and all reagents were added using a cannula cable to minimize moisture. The dried IleOEt (24.99 g, 127.7 mmol) was dissolved in distilled THF and added with 50 mL of TEA. The reactor was placed in a dry ice bath and filled with poly(dichlorophosphazene) (10 g) dissolved in the distilled THF. After 1 d of reaction at room temperature, ethanolamine (1 g, 17.26 mmol) and PEG750 (22.71 g, 27.61 mmol) were sequentially added to the reactor, and the mixture was reacted for 1 d at 45 °C. The synthesized polymer was filtered through a glass filter to eliminate side products, and the THF was evaporated using a rotary evaporator. Hexane precipitation was performed for purification. n‐Hexane was poured into the synthesized polymer and changed once a day while stirring for 2 d. The polymer was dialyzed against methanol for 4 d and distilled water for 4 d. The purified polymer was filtered through a syringe filter (pore size, 0.45 µm) and then freeze‐dried. The synthesized aminoethanol‐linked poly(organophosphazene) (15 g) was dissolved in dry THF and glutaric anhydride (3.84 g, 33.69 mmol) and added with DMAP (4.12 g, 33.69 mmol). The mixture was stirred at room temperature overnight and the THF was evaporated using a rotary evaporator. Hexane precipitation and dialysis were performed for purification as described above. Finally, the synthesized sample was freeze‐dried. The synthesized IPS polymer (10 wt%) was dissolved in phosphate buffer saline (PBS) by stirring at 4 °C to obtain the IPS hydrogel.
Characterization of IPS
The chemical structure of IPS was analyzed using a 1H‐NMR spectrometer (Varian Gemini 300) operated at 300 MHz in Fourier transform mode with CDCl3. The weight average molecular weight (M w) of IPS was measured using a GPC system (Agilent, 1260 Infinity II) with a refractive index detector and gel column (Agilent, PLgel 5 µm MIXED‐C). THF containing 0.1 wt% tetrabutylammonium bromide was used as the mobile phase, with a flow rate of 0.35 mL min−1 at 40 °C. Polystyrene of different molecular weights (6 570 000, 3 152 000, 885 000, 479 200, 194 500, 75 050, 22 290, 10 330, 4880, 1210, 580, and 162 g mol−1) was used as the standard sample.
Growth Factor Loading of IPS
Various amounts of BMP‐2 and TGFβ‐1 (Table 1) were loaded into the IPS hydrogels by simple stirring at 4 °C for 1 h.
Rheological Analysis of IPS
An IPS hydrogel (10 wt%) was prepared as described above. A modular compact rheometer (MCR102, Anton Paar) equipped with a 25.0 mm parallel plate was used for rheological measurements, which were conducted with a zero‐gap length of 0.5 mm. The modulus of the IPS hydrogel was measured under different temperatures (5–60 °C) at an oscillating frequency of 1 Hz and 5% strain. A new IPS hydrogel was prepared and subjected to the same measurements by varying the oscillating frequency from 1 to 100 Hz with 5% shear strain at 37 °C.
Compressive Modulus
The compressive modulus of crosslinked IPS was measured using an Instron 5900 universal testing machine (Instron Corporation, USA). The IPS hydrogel was compressed to 20% of its height to obtain the stress–strain curve that was used to calculate the compressive modulus.
Zeta Potential and Particle Size Measurements of IPS
IPS, IPS_B20, IPS_T1, and IPS_B20T1 samples (1 wt%) were prepared in PBS. Zeta potential and particle size measurements were performed using a DLS instrument (Malvern Instruments Ltd., Malvern, UK) at 25 °C.
Cryofocused Ion Beam (FIB)/SEM Imaging
Quanta 3D field emission gun (FEG) microscope (Field Electron and Ion Company, Netherlands) with an Alto 2500 cryotransfer system (Gatan, UK) was equipped to perform cryo‐FIB/SEM. The IPS and IPS‐BT were prepared and stored 4 or 37 °C. The samples were immersed in a liquid nitrogen slush. After 1 s, the freezing chamber was evacuated and the samples were transferred to a preparation chamber that was pre‐evacuated to a pressure of 10−5 mbar at −190 °C. Pt was coated on the samples by plasma sputtering with a 3 mA current for 60 s. The metal coated samples were placed in a microscope chamber (pressure 10−5 mbar and temperature −190 °C). Cryo‐SEM images were obtained using a 5 keV electron beam with an electron current of 11.8 pA. FIB milling was performed using a 30 keV gallium ion beam at an ion current of 1 nA.
In Vitro BMP‐2 and TGFβ‐1 Release
The IPS hydrogel (10 wt%) was dissolved in PBS at 4 °C. BMP‐2 and TGFβ‐1 were added to the IPS hydrogel to fabricate IPS_B20T1. Next, 200 µL of IPS_B20T1 was placed in millicells (diameter: 12 mm, Millipore) and incubated for 5 min at 37 °C for gelation. IPS_B20T1 was soaked in 4 mL of PBS in a 15 mL conical tube (SPL Life Sciences, Korea), after which the tube was incubated in a 37 °C water bath (KMC‐1205SW1, Vision, Korea). The PBS was replaced at determined time points and the released BMP‐2 and TGFβ‐1 were quantified using enzyme‐linked immunosorbent assay (ELISA) kits (Human BMP‐2 “Super‐X” ELISA kit, Antigenix, USA; Human TGFβ‐1 ELISA kit, RayBiotech, USA) according to the manufacturers’ protocols.
In Vivo Bone Regeneration
All animal studies were performed in compliance with the relevant laws and institutional guidelines of the Institutional Animal Care and Use Committee (IACUC) of Korea Institute of Science and Technology (KIST). The experimental protocol was approved by the IACUC (2021–032). IPS hydrogels (10 wt%) were dissolved in PBS by stirring at 4 °C. Various ratios of BMP‐2 and TGFβ‐1 were then added to the IPS hydrogels, which were subsequently incubated at 4 °C with stirring to obtain the IPS_BT samples. The BMP‐2 and TGFβ‐1 contents of the hydrogels are listed in Table 1. Next, 200 µL of the hydrogels was subcutaneously injected into the dorsal back skin of mice (5‐week‐old C57BL/6NTac, Daehan Biolink, Korea). The mice were then sacrificed at predetermined time points. The implanted hydrogels with regenerated tissue were collected and soaked in 4% paraformaldehyde (Biosesang, Korea) for 1 d. Micro‐CT (Skyscan 1172, Skyscan, Aartselaar, Belgium) analysis was performed at a voltage of 70 kV and current of 142 µA with an aluminum filter to evaluate the newly formed bone. The acquired images were reconstructed using NRecon software (version 1.10.0.5, Skyscan, Aartselaar) and the regenerated bone volume was calculated using CTAn software (version 1.10.0.5, Skyscan, Aartselaar). The reconstructed images were visualized as a 3D model using CTVol software (version 2.2.3.0, Skyscan, Aartselaar).
The osteoinductive properties of IPS_BT in the orthotopic region were assessed by fabricating IPS, IPS_B, IPS_T, and IPS_BT samples and injecting them into mice (5‐week‐old C57BL/6NTac, DBL). The mice were anesthetized using 3% isoflurane with balanced O2 and N2. The hydrogels were injected into the calvarial region of the mice. After 4 weeks, the mice were sacrificed and the calvarial bone was obtained. The bone volume and images were investigated using micro‐CT analysis.
RT‐PCR
After injection of IPS, IPS_B, IPS_T, and IPS_BT into the subcutaneous region, the hydrogels were collected after 7 and 14 d and directly frozen in liquid N2. Trizol (Invitrogen, Carlsbad, CA, USA) and isopropanol were used for RNA isolation. cDNA was synthesized using Reverse Transcription 5X Master Premix (Elpis Biotech, Korea). RT‐PCR was conducted on a 7500 Real‐Time PCR System (Applied Biosystems, CA). The gene expression of angiogenesis (i.e., CD31 and αSMA), stemness (i.e., Nanog, SOX2), and osteogenesis (i.e., collagen I and osteocalcin) markers was then investigated. The sequences of these gene markers are listed in Table S1 in the Supporting Information.
Western Blot
The extracted hydrogels were stored in liquid N2 and homogenized with radioimmunoprecipitation assay (RIPA) buffer (Thermo Scientific, USA) containing protease inhibitor cocktail (78440, Thermo Scientific) for protein purification. The protein samples were then collected and denatured with sodium dodecyl sulfate (SDS)‐loaded buffer (Biosensing, Korea). The proteins (20 µg) were separated on 4–10% Mini‐PROTEAN TGX gels (Bio‐Rad, USA) via electrophoresis and then transferred onto polyvinylidene fluoride (PVDF) Immobilon‐P membranes (Millipore) at 350 mA for 90 min. After blocking with 5% skim milk in tris buffered saline tween 20 (TBST) (Biosensing) for 1 h, the proteins were treated with primary antibodies and incubated at 4 °C overnight. The primary antibodies were anti‐β actin (1: 1000, sc‐8432, Santa Cruz) anti‐CD31 (1:1000, ab28364, Abcam), anti‐αSMA (1:1000, ab7817, Abcam), anti‐Nanog (1:1000, ab214549, Abcam), and anti‐SOX2 (1 µg mL−1, MAB2018, R&D Systems). Next, the membranes were washed with TBST and treated with secondary antibodies at room temperature for 1 h. The secondary antibodies were goat antimouse IgG (31430, Invitrogen) and goat antirabbit IgG (A16110, Invitrogen). The membranes were washed, and the substrate solution (West Femto Maximum Sensitivity Substrate, Thermo Scientific) was treated. The protein bands were visualized using iBright 1500 (Invitrogen) and quantified using Image J software.
Histological Analysis
The obtained tissues were fixed with 4% paraformaldehyde, embedded in paraffin, and then sectioned into 5 µm thick slices using a microtome. Next, the slices were rehydrated by sequential immersion in xylene (Daejung), 100%, 90%, 80%, and 70% ethanol, and distilled water. Finally, the sliced tissues were treated with H&E and MT stains.
Immunofluorescence Analysis
The tissues were obtained at specific time points and fixed with 4% paraformaldehyde overnight. The fixed hydrogels were embedded in paraffin blocks and cut into 5 µm thick slices. The sectioned tissues were deparaffinized, rehydrated, immersed in 3% hydrogen peroxidase for 30 min, and washed three times with PBS. Citrate buffer (0.01 m, pH 6) was poured over the slices, which were then microwaved for antigen retrieval. Next, the slices were washed three times with PBS, blocked with 1% bovine serum albumin (BSA) solution for 1 h, and incubated with primary antibodies overnight at 4 °C. The primary antibodies were anti‐CD31 (1:100, ab28364, Abcam), anti‐αSMA (1:100, ab7817, Abcam), anti‐Nanog (1:100, ab214549, Abcam), and anti‐SOX2 (10 µg mL−1, MAB2018, R&D Systems). The slices were washed three times with PBS and then treated with secondary antibodies for 1 h. The secondary antibodies were Alexa Fluor488‐conjugated goat antimouse IgG (1:500, A11001, Invitrogen) and Alexa Fluor594‐conjugated donkey antirabbit IgG (1:500, A21207, Invitrogen). The tissues were washed three times with PBS and mounted in mounting medium with DAPI (4',6‐diamidino‐2‐phenylindole) (H‐1200, Vector Laboratories, Inc., CA, USA).
Statistical Analysis
All graphs were plotted using Origin 2020 software, and all data are presented as mean ± standard deviation. Significant differences were determined using one‐way analysis of variance with post hoc Tukey's multiple comparison test and marked as * (p < 0.5), ** (p < 0.01), or *** (p < 0.001).
Conflict of Interest
The authors declare no conflict of interest.
Supporting information
Supporting Information
Acknowledgements
This research was supported by the Korea Institute of Science and Technology (2E31603) and the National Research Foundation of Korea (2018M3A9H1024549 and 2021M3E5D9021367). After initial online publication, this article was corrected on February 6, 2023. Originally, there were seven instances of “Tukey's multiple comparison test” being accidentally written as “Turkey's multiple comparison test”. The editorial office apologizes for any confusion caused.
Kim J., Kim Y.‐M., Song S.‐C., One‐Step Preparation of an Injectable Hydrogel Scaffold System Capable of Sequential Dual‐Growth Factor Release to Maximize Bone Regeneration. Adv. Healthcare Mater. 2023, 12, 2202401. 10.1002/adhm.202202401
Data Availability Statement
The data that support the findings of this study are available from the corresponding author upon reasonable request.
References
- 1.a) Lienemann P. S., Lutolf M. P., Ehrbar M., Adv. Drug Del. Rev. 2012, 64, 1078; [DOI] [PubMed] [Google Scholar]; b) Oryan A., Alidadi S., Moshiri A., Expert Opin. Biol. Ther. 2016, 16, 213; [DOI] [PubMed] [Google Scholar]; c) Xue P.‐P., Yuan J.‐d., Yao Q., Zhao Y.‐Z., Xu H.‐L., BIO Integr. 2020, 1, 37. [Google Scholar]
- 2. Mishima Y., Lotz M., J. Orthop. Res. 2008, 26, 1407. [DOI] [PubMed] [Google Scholar]
- 3. Wu M., Chen G., Li Y.‐P., Bone Res. 2016, 4, 16009. [DOI] [PMC free article] [PubMed] [Google Scholar]
- 4. Xu X., Zheng L., Yuan Q., Zhen G., Crane J. L., Zhou X., Cao X., Bone Res. 2018, 6, 2. [DOI] [PMC free article] [PubMed] [Google Scholar]
- 5.a) Karst M., Gorny G., Galvin R. J., Oursler M. J., J. Cell. Physiol. 2004, 200, 99; [DOI] [PMC free article] [PubMed] [Google Scholar]; b) Crane J. L., Xian L., Cao X., Methods Mol. Biol. 2016, 1344, 287; [DOI] [PubMed] [Google Scholar]; c) Jansen J. A., Vehof J. W. M., Ruhé P. Q., Kroeze‐Deutman H., Kuboki Y., Takita H., Hedberg E. L., Mikos A. G., J. Controlled Release 2005, 101, 127. [DOI] [PubMed] [Google Scholar]
- 6. De Witte T.‐M., Fratila‐Apachitei L. E., Zadpoor A. A., Peppas N. A., Regener. Biomater. 2018, 5, 197. [DOI] [PMC free article] [PubMed] [Google Scholar]
- 7.a) Wang Q., Zhang Y., Li B., Chen L., J. Mater. Chem. B 2017, 5, 6963; [DOI] [PubMed] [Google Scholar]; b) Geng Y., Duan H., Xu L., Witman N., Yan B., Yu Z., Wang H., Tan Y., Lin L., Li D., Bai S., Fritsche‐Danielson R., Yuan J., Chien K., Wei M., Fu W., Commun. Biol. 2021, 4, 82. [DOI] [PMC free article] [PubMed] [Google Scholar]
- 8. Rady A. A. M., Hamdy S. M., Abdel‐Hamid M. A., Hegazy M. G. A., Fathy S. A., Mostafa A. A., Bull. Natl. Res. Cent. 2020, 44, 131. [Google Scholar]
- 9. Xia B., Deng Y., Lv Y., Chen G., Biomater. Sci. 2021, 9, 1189. [DOI] [PubMed] [Google Scholar]
- 10.a) Lane S. W., Williams D. A., Watt F. M., Nat. Biotechnol. 2014, 32, 795; [DOI] [PMC free article] [PubMed] [Google Scholar]; b) Iaquinta M. R., Mazzoni E., Bononi I., Rotondo J. C., Mazziotta C., Montesi M., Sprio S., Tampieri A., Tognon M., Martini F., Front. Cell. Dev. Biol. 2019, 7, 268. [DOI] [PMC free article] [PubMed] [Google Scholar]
- 11. Tan J., Zhang M., Hai Z., Wu C., Lin J., Kuang W., Tang H., Huang Y., Chen X., Liang G., ACS Nano 2019, 13, 5616. [DOI] [PubMed] [Google Scholar]
- 12. Lee S. S., Kim J. H., Jeong J., Kim S. H. L., Koh R. H., Kim I., Bae S., Lee H., Hwang N. S., Biomaterials 2020, 257, 120223. [DOI] [PubMed] [Google Scholar]
- 13. Lee H. J., Koh W.‐G., ACS Appl. Mater. Interfaces 2014, 6, 9338. [DOI] [PubMed] [Google Scholar]
- 14. Choi D. H., Subbiah R., Kim I. H., Han D. K., Park K., Small 2013, 9, 3468. [DOI] [PubMed] [Google Scholar]
- 15.a) Chang B., Ahuja N., Ma C., Liu X., Mater. Sci. Eng., R 2017, 111, 1; [DOI] [PMC free article] [PubMed] [Google Scholar]; b) Packhaeuser C., Schnieders J., Oster C., Kissel T., Eur. J. Pharm. Biopharm. 2004, 58, 445; [DOI] [PubMed] [Google Scholar]; c) Hou Q., Paul A., Shakesheff K. M., J. Mater. Chem. 2004, 14, 1915. [Google Scholar]
- 16. Seo B.‐B., Choi H., Koh J.‐T., Song S.‐C., J. Controlled Release 2015, 209, 67. [DOI] [PubMed] [Google Scholar]
- 17. Overstreet D. J., Dutta D., Stabenfeldt S. E., Vernon B. L., J. Polym. Sci., Part B: Polym. Phys. 2012, 50, 881. [Google Scholar]
- 18.a) Mathew A. P., Uthaman S., Cho K.‐H., Cho C.‐S., Park I.‐K., Int. J. Biol. Macromol. 2018, 110, 17; [DOI] [PubMed] [Google Scholar]; b) Yang J.‐A., Yeom J., Hwang B. W., Hoffman A. S., Hahn S. K., Prog. Polym. Sci. 2014, 39, 1973. [Google Scholar]
- 19. De France K. J., Cranston E. D., Hoare T., ACS Appl. Polym. Mater. 2020, 2, 1016. [Google Scholar]
- 20. Song S.‐C., Lee S. B., Jin J.‐I., Sohn Y. S., Macromolecules 1999, 32, 2188. [Google Scholar]
- 21. Terashima T., Sugita T., Fukae K., Sawamoto M., Macromolecules 2014, 47, 589. [Google Scholar]
- 22. Seo B.‐B., Koh J.‐T., Song S.‐C., Biomaterials 2017, 122, 91. [DOI] [PubMed] [Google Scholar]
- 23.a) Sundermann J., Zagst H., Kuntsche J., Wätzig H., Bunjes H., Pharmaceutics 2020, 12, 1143; [DOI] [PMC free article] [PubMed] [Google Scholar]; b) Moeinzadeh S., Barati D., Sarvestani S. K., Karimi T., Jabbari E., Tissue Eng., Part A 2015, 21, 134; [DOI] [PMC free article] [PubMed] [Google Scholar]; c) Robertson I. B., Rifkin D. B., Cold Spring Harbor Perspect. Biol. 2016, 8, a021907. [DOI] [PMC free article] [PubMed] [Google Scholar]
- 24.a) Scheufler C., Sebald W., Hülsmeyer M., J. Mol. Biol. 1999, 287, 103; [DOI] [PubMed] [Google Scholar]; b) Marquetti I., Desai S., Chem. Phys. Lett. 2018, 706, 285; [Google Scholar]; c) Utesch T., Daminelli G., Mroginski M. A., Langmuir 2011, 27, 13144; [DOI] [PubMed] [Google Scholar]; d) Grier W. K., Tiffany A. S., Ramsey M. D., Harley B. A., Acta Biomater. 2018, 76, 116; [DOI] [PMC free article] [PubMed] [Google Scholar]; e) Shi M., Zhu J., Wang R., Chen X., Mi L., Walz T., Springer T. A., Nature 2011, 474, 343. [DOI] [PMC free article] [PubMed] [Google Scholar]
- 25. Kim Y.‐M., Park M.‐R., Song S.‐C., ACS Nano 2012, 6, 5757. [DOI] [PubMed] [Google Scholar]
- 26. Scott M. A., Levi B., Askarinam A., Nguyen A., Rackohn T., Ting K., Soo C., James A. W., Stem Cells Dev. 2012, 21, 655. [DOI] [PMC free article] [PubMed] [Google Scholar]
- 27.a) Jarrar H., Çetin Altındal D., Gümüşderelioğlu M., J. Mater. Sci.: Mater. Med. 2021, 32, 32; [DOI] [PMC free article] [PubMed] [Google Scholar]; b) Krishnan L., Priddy L. B., Esancy C., Klosterhoff B. S., Stevens H. Y., Tran L., Guldberg R. E., Acta Biomater. 2017, 49, 101. [DOI] [PMC free article] [PubMed] [Google Scholar]
- 28. Janssens K., ten Dijke P., Janssens S., Van Hul W., Endocr. Rev. 2005, 26, 743. [DOI] [PubMed] [Google Scholar]
- 29. Xu J., Liu J., Gan Y., Dai K., Zhao J., Huang M., Huang Y., Zhuang Y., Zhang X., J. Bone Miner. Res. 2020, 35, 167. [DOI] [PubMed] [Google Scholar]
- 30.a) Hankenson K. D., Dishowitz M., Gray C., Schenker M., Injury 2011, 42, 556; [DOI] [PMC free article] [PubMed] [Google Scholar]; b) Li Z., Liao W., Zhao Q., Liu M., Xia W., Yang Y., Shao N., J. Surg. Res. 2013, 183, 193; [DOI] [PubMed] [Google Scholar]; c) Liu H., Li D., Zhang Y., Li M., Histochem. Cell Biol. 2018, 149, 393. [DOI] [PubMed] [Google Scholar]
- 31. Maes C., Kobayashi T., Selig M. K., Torrekens S., Roth S. I., Mackem S., Carmeliet G., Kronenberg H. M., Dev. Cell 2010, 19, 329. [DOI] [PMC free article] [PubMed] [Google Scholar]
- 32.a) Si X. Y., Li J. J., Yao T., Wu X. Y., Mol. Med. Rep. 2014, 9, 1794; [DOI] [PubMed] [Google Scholar]; b) Zhang W., Zhu C., Wu Y., Ye D., Wang S., Zou D., Zhang X., Kaplan D. L., Jiang X., Eur. Cells Mater. 2014, 27, 1; [DOI] [PubMed] [Google Scholar]; c) Liu S., Liu Y., Jiang L., Li Z., Lee S., Liu C., Wang J., Zhang J., Biomater. Sci. 2019, 7, 362; [DOI] [PubMed] [Google Scholar]; d) Chen W.‐C., Chung C.‐H., Lu Y.‐C., Wu M.‐H., Chou P.‐H., Yen J.‐Y., Lai Y.‐W., Wang G.‐S., Liu S.‐C., Cheng J.‐K., Wu Y.‐J., Yeh H.‐I., Wang L.‐Y., Wang S.‐W., Biochem. Pharmacol. 2018, 150, 256; [DOI] [PubMed] [Google Scholar]; e) Yang E. Y., Moses H. L., J. Cell Biol. 1990, 111, 731; [DOI] [PMC free article] [PubMed] [Google Scholar]; f) Fajardo L. F., Prionas S. D., Kwan H. H., Kowalski J., Allison A. C., Lab Invest 1996, 74, 600. [PubMed] [Google Scholar]
- 33.a) Go M. J., Takenaka C., Ohgushi H., Exp. Cell Res. 2008, 314, 1147; [DOI] [PubMed] [Google Scholar]; b) Han S.‐M., Han S.‐H., Coh Y.‐R., Jang G., Ra J. C., Kang S.‐K., Lee H.‐W., Youn H.‐Y., Exp. Mol. Med. 2014, 46, e101. [DOI] [PMC free article] [PubMed] [Google Scholar]
- 34. Sheikh Z., Sima C., Glogauer M., Materials 2015, 8, 2953. [Google Scholar]
Associated Data
This section collects any data citations, data availability statements, or supplementary materials included in this article.
Supplementary Materials
Supporting Information
Data Availability Statement
The data that support the findings of this study are available from the corresponding author upon reasonable request.