

Abstract
Purpose
The goal of this study is to develop an approach for estimating nationally representative quality-adjusted life-year (QALY) loss from injury and poisoning conditions using data collected in the Medical Expenditure Panel Survey (MEPS) and the National Health Interview Survey (NHIS).
Methods
This study uses data from the 2002–2015 NHIS and MEPS surveys. Injuries were identified in the MEPS medical events file and through self-reporting of medical conditions. We restricted our model to 163,731 adults, for which we predict a total of 294,977 EQ-5D scores using responses to the self-administered questionnaire. EQ-5D scores were modeled using age, sex, comorbidities, and binary indicators of the presence and duration of injury at the time of the health status questionnaire. These models consider nonlinearity over time during the first 3 y following the injury event.
Results
Injuries are identified in MEPS using medical events that provide a reasonable proxy for the date of injury occurrence. Health-related quality of life (HRQL) decrements can be estimated using binary indicators of injury during different time periods. When grouped into 29 injury categories, most categories were statistically significant predictors of HRQL scores in the first year after injury. For these groups of injuries, mean first-year QALY loss estimates range from 0.005 (sprains and strains of joints and adjacent muscles, n = 7067) to 0.109 (injury to nerves and spinal cord, n = 71). Fewer estimates are significant in the second and third years after injury, which may reflect a return to baseline HRQL.
Conclusion
This research presents both a framework for estimating QALY loss for short-lived medical conditions and nationally representative, community-based HRQL scores associated with a wide variety of injury and poisoning conditions.
Highlights
This research provides a catalog of nationally representative, preference-based EQ-5D score decrements associated with surviving a large set of injuries, based on patient-reported health status.
Mean first-year QALY loss estimates range from 0.005 (sprains and strains of joints and adjacent muscles, n = 7067) to 0.109 (injury to nerves and spinal cord, n = 71).
This article presents a novel methodology for assessing quality-of-life impacts for acute conditions by calculating the time elapsed between injury and health status elicitation. Researchers may explore adapting these methods to study other short-lived conditions and health states, such as COVID-19 or chemotherapy.
Keywords: EQ-5D, health measurement, injury, HRQoL, MEPS, NHIS, QALY, RQL, SF-6D, SF-12
Background
In 1996, the Panel on Cost-Effectiveness in Health and Medicine (PCEHM) provided recommendations to advance the field of cost-effectiveness analysis.1 Among their recommendations was a call for catalogs of nationally representative, community-based preference scores for health states, illnesses, and conditions. In the decades following PCEHM’s report, researchers have advanced the methodologies of cost-effectiveness analysis and provided these catalogs for select medical conditions. Most notably, Sullivan and Ghushchyan developed preference-based EQ-5D scores for hundreds of chronic conditions in the United States using survey data from the Medical Expenditure Panel Survey (MEPS).2 Despite the breadth of conditions captured by Sullivan and Ghushchyan, the authors restricted their analysis to chronic conditions due to difficulties in measuring the impacts of short-lived conditions on health-related quality of life (HRQL).
For health states not described in nationally representative catalogs of health condition impact, such as condition subtypes or short-lived conditions, researchers have typically referenced studies of patients who have completed a health utility measure or collected direct valuations of health states from patients, experts, or the general public. The direct valuation of short-lived health states such as influenza or respiratory infections has a number of methodological challenges that have been reviewed elsewhere.3–5 To date, we know of no “off-the-shelf” catalog of nationally representative estimates for short-term conditions. In this article, we seek to explore the feasibility of creating such a catalog that can be used to make quality-adjusted life-year (QALY) estimates for a comprehensive set of injuries and poisoning episodes in the United States.
In addition to their use in medical decision making, injury QALY values are used by federal regulatory agencies in the United States as a means of quantifying and valuing the benefits of policies designed to reduce the incidence of injury.6 For example, the US Department of Transportation values reductions in nonfatal injury incidence using QALYs constructed from the Injury Impairment Index (III).7 Constructed in the early 1980s, the III is multidimensional preference-based instrument designed to characterize the typical impairments experienced by injured patients.8 Despite covering a wide range of injuries, III-derived QALY values rely on the judgments of a small number of clinicians rather than patient descriptions of their experiences. In addition, because no preference scores exist for the III, analysts must map preference scores to the III using a variety of sources, which in many cases are neither nationally representative nor based on US populations.9
We focus on injuries and poisoning events due to their wide prevalence and often serious effects on health. The Centers for Disease Control and Prevention estimated that more than 27 million nonfatal emergency department visits in 2019 resulted from unintentional and violence-related injuries in the United States.10 Using 2013 data from the Healthcare Cost and Utilization Project, Zonfrillo et al. find US injuries result in more than $2 trillion in health care expenditures, $0.2 trillion in productivity losses, and $1.5 trillion in quality-of-life losses annually.11 Despite the significant economic burden associated with injuries, limited research is available on the impacts of many injuries. Available research often focuses on the most severe cases of injury, such as burns that are treated in burn units.12,13 In this study, we adhere to recommendations by the Institute of Medicine (IOM, 2006) and Second PCEHM, including the use of patients’ self-reported health status and nationally representative, community-based preference scores for a generic, widely used health status instrument to create an off-the-shelf catalog of QALY losses associated with injury and poisoning events.14,15
Methods
Figure 1 provides an overview of our methods for estimating the impact of injuries on HRQL over time. Injury and health status information was derived from MEPS and the National Health Interview Survey (NHIS). After calculating the time elapsed between injury and health status elicitation, we estimated HRQL scores using variables indicating the presence of injury in different time periods. These data sources and statistical methods are described below.
Figure 1.

Conceptual diagram of health-related quality-of-life estimation methods.
Data Sources
MEPS
MEPS is a nationally representative survey of the US noninstitutionalized civilian population. The sampling frame for the MEPS Household Component is drawn from the previous year’s NHIS and features oversampling of Black and Hispanic populations. The longitudinal survey includes detailed information on individuals’ demographic characteristics, self-reported health status, and medical conditions. For the current study, MEPS person-level, medical conditions, and medical events files were pooled for 2002 to 2015 to generate an individual-level file with information on injuries suffered by respondents.
NHIS
The NHIS is a nationally representative annual in-person household health survey in the United States. The survey obtains complete responses from approximately 87,500 persons each year. We linked the subset of NHIS respondents who subsequently were sampled and surveyed in MEPS using individual-level linkage files from the Agency for Healthcare Research and Quality (AHRQ). The linkage files provide a crosswalk between MEPS IDs for each respondent to their NHIS IDs. The NHIS Injury File provides additional information on the injuries suffered by respondents in the 91 d preceding the survey. By linking MEPS and NHIS, we increased the time period over which we observe respondents, their health status, and any injuries they suffered by roughly 1 y.
Health status
MEPS administered several generic, multiattribute health status questionnaires since 2000 for all sampled adults. From 2000 to 2002, MEPS included the 12-Item Short Form Survey version 1 (SF-12v1) as part of its self-administered questionnaire (SAQ). Since 2003, the SF-12 version 2 (SF-12v2) has been administered as part of the SAQ. Finally, from 2000 to 2003, the EuroQol-5D-3L (EQ-5D) was administered alongside the SF-12 instruments. To derive EQ-5D scores from the EQ-5D instrument, we applied US preference weights from Shaw et al.16 We also predicted EQ-5D scores from post-2003 SF-12v2 responses. In our preferred specification, we opted for US preference weights over valuations of the SF-12 (e.g., the SF-6D) to ensure the resulting QALY estimates are applicable in US regulatory analyses. Consistent with other MEPS-based SF-12 to EQ-5D mappings, we predicted EQ-5D scores by regressing EQ-5D scores using ordinary least squares (OLS) with stepwise selection of Mental and Physical Component Scores (MCS, PCS) using 2003 MEPS data, which include both SF-12 and EQ-5D questionnaires.17 This transformation is Eq. (1).
| (1) |
This specification was found to better predict (i.e., lower root mean squared error) EQ-5D scores relative to OLS and Tobit specifications with stepwise selection of all SF-12 items. Finally, we bounded all predictions to be no greater than 1. The number of predicted EQ-5D scores is presented in Table 1. In total, we captured 294,977 usable EQ-5D scores from 163,731 unique MEPS respondents.
Table 1.
Sample Size Based on Predicted EQ-5D Scores, by Medical Expenditure Panel Survey (MEPS) Panel
| MEPS Panel Number | Year(s) | Predicted EQ-5D Scores |
|---|---|---|
| 6 | 2002 | 13,524 |
| 7 | 2002–2003 | 19,785 |
| 8 | 2003–2004 | 20,361 |
| 9 | 2004–2005 | 20,121 |
| 10 | 2005–2006 | 19,585 |
| 11 | 2006–2007 | 20,832 |
| 12 | 2007–2008 | 16,053 |
| 13 | 2008–2009 | 23,385 |
| 14 | 2009–2010 | 21,274 |
| 15 | 2010–2011 | 19,040 |
| 16 | 2011–2012 | 24,559 |
| 17 | 2012–2013 | 23,867 |
| 18 | 2013–2014 | 21,274 |
| 19 | 2014–2015 | 19,960 |
| 20 | 2015 | 11,357 |
| Total | 2002–2015 | 294,977 |
We present adjusted mean EQ-5D scores by age and sex in Table A2 of the Supplemental Materials. These values are largely consistent with other nationally representative summaries.18,19 For both women and men, EQ-5D scores decline with age, a pattern driven primarily by diminishing physical health. In each age category, we observe lower HRQL scores among women than men. The Supplemental Materials include alternative scorings, including application of SF-6D valuation and an alternative EQ-5D mapping.
Injury and Poisoning Conditions
Medical conditions in MEPS are elicited using a combination of open-ended questioning, yes/no responses to designated “priority” conditions, and follow-up questioning when respondents report medical events or days of missed school or work. MEPS surveys are supplemented by the medical provider component, which collects information from a sample of medical providers on information related to treatment, diagnosis and procedure codes, charges, and payments. Combined, these data elements represent injury information from both medical providers and respondents, spanning both severe injuries requiring medical treatment and less severe injuries reported by respondents but not treated. In NHIS, injuries are summarized in the NHIS Injury File, which includes self-reported information on injury episodes—events (e.g., a car crash) resulting in 1 or more injuries in the 91 d preceding the survey. Conditions in both data sets are summarized by 3-digit ICD-9 codes mapped by professional coders. We included all codes between 800 and 999, which represent most conditions related to injury and poisoning, as well as select codes that may also indicate injury. To address potential statistical power limitations of using ICD-level injury definitions, we also developed 29 groups of like injuries based on recommendations from 4 clinical experts. Each group is composed of 1 or more ICD-9 codes. The full list of ICD-9 codes, by injury group, is included in Table A1 of the Supplemental Materials.
To ensure that each injury observed in MEPS and NHIS was experienced prior to completion of the SAQ, we generated date variables for injury occurrence and SAQ administration. For roughly half of all injuries, respondents reported the date of injury occurrence. We imputed this date for the remaining injuries, where possible, using the date of the first reported medical event (e.g., hospitalization, doctor visit) associated with each injury. Thus, for observations without self-reported occurrence dates, we assumed that injuries are treated immediately, an assumption that appears to hold among respondents with available data for both self-reported injury occurrence dates and associated medical events. In instances in which injury dates are not reported and injury treatment occurs within the first 3 mo of MEPS, we dropped these injuries from our sample to avoid including injuries that occurred prior to our study period but that still required medical treatment. We used the resulting dates to estimate time elapsed since injury occurrence at the time of SAQ completion (e.g., 45 d between injury and health status elicitation). Figure 2 presents the distribution of injuries by time elapsed between injury and the SAQ. Injuries are stratified by those observed in the MEPS data set and the NHIS data set. To ensure we estimated the incremental effect of each injury, we dropped respondents from our sample if they experienced multiple injuries in the same injury group. For example, we dropped an individual with both a tibia and metatarsal fracture to estimate the effect of 1 lower extremity fracture. Table 2 presents the counts of each injury in relation to time elapsed since the health status questionnaire.
Figure 2.
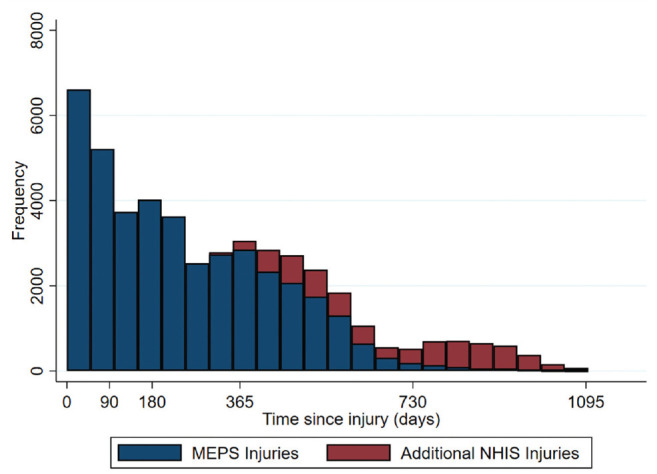
Histogram of time elapsed between injury occurrence and self-administered questionnaire.
Table 2.
Number of Injured Respondents by Injury Groupa
| Injury Group | Year 1 | Year 2 | Year 3 | Total |
|---|---|---|---|---|
| Eye injury | 1,435 | 488 | 71 | 1,994 |
| Ear, nose, and throat foreign body | 22 | 10 | 0 | 32 |
| Pulmonary/GI/GU foreign body | 56 | 21 | 6 | 83 |
| Dental injury | 329 | 91 | 3 | 423 |
| Skin—not burn | 1,558 | 445 | 5 | 2,008 |
| Concussion | 286 | 127 | 32 | 445 |
| Head trauma concerning for brain injury | 230 | 95 | 11 | 336 |
| Head wounds less concerning for brain injury | 1,124 | 502 | 125 | 1,751 |
| Facial injury | 171 | 95 | 31 | 297 |
| Polytrauma | 296 | 118 | 25 | 439 |
| Injury to spine | 318 | 149 | 38 | 505 |
| Lower-extremity fracture | 1,803 | 980 | 283 | 3,066 |
| Chest/thorax trauma | 455 | 210 | 57 | 722 |
| Upper-extremity fracture | 524 | 268 | 74 | 866 |
| Hand fracture | 894 | 482 | 155 | 1,531 |
| Nonspecific | 5,096 | 2,131 | 346 | 7,573 |
| Dislocation of joint—upper body | 270 | 155 | 39 | 464 |
| Dislocation of joint—lower body | 517 | 217 | 36 | 770 |
| Uncomplicated strain/sprain | 6,954 | 3,620 | 1,207 | 11,781 |
| GI/GU injury | 23 | 16 | 7 | 46 |
| Soft-tissue wound | 2,391 | 1,195 | 366 | 3,952 |
| Amputation—upper | 42 | 14 | 4 | 60 |
| Amputation—lower | 6 | 2 | 1 | 9 |
| Vascular injury | 24 | 7 | 1 | 32 |
| Superficial injury—laceration/contusion | 2,708 | 1,406 | 456 | 4,570 |
| Burn | 477 | 217 | 38 | 732 |
| Peripheral nerve | 36 | 29 | 14 | 79 |
| Poisoning and toxic effects | 768 | 297 | 72 | 1,137 |
| Exposure | 76 | 29 | 0 | 105 |
| Total | 28,889 | 13,416 | 3,503 | 45,808 |
GI, gastrointestinal; GU, genitourinary.
Counts include injuries observed in both Medical Expenditure Panel Survey and National Health Interview Survey data.
Estimating QALY Losses
To identify the effect of injuries on HRQL, we used the following model for MEPS respondent i completing the health status elicitation at time t:
| (2) |
where is proxied using the EQ-5D scores predicted in Eq. (1). The primary explanatory variables of interest are represented by the array , which identifies the unique injury types (indexed by j) experienced by respondents at different time periods (indexed by c). We jointly estimated their effects using an additive regression framework that includes 5 distinct time periods (c) within the first 3 y following injury: 0 to 3 mo, 4 to 6 mo, 7 to 12 mo, 13 to 24 mo, and 25 to 36 mo. This approach resulted in 145 independent binary variables related to injury and therefore 145 unique coefficient estimates. describes time-varying and time-invariant demographic and health-related controls (including age, sex, race, educational attainment, income, health insurance coverage, and the presence of 174 chronic conditions), represents the constant term, and describes the error term. Under this additive approach, each health condition has a constant impact on HRQL regardless of other covariates.20,21 Separately considering the impacts across 5 time periods allowed us to control for the uneven distribution of time elapsed between injury and health status questionnaire and assess any injury-specific recovery trajectories.
Our preferred model is estimated in Stata using OLS. OLS is the best linear unbiased estimator under standard assumptions, including that is normally distributed with mean zero. Mean regression is appropriate for this case because we are interested in understanding the effect of the average injury on HRQL. In Stata, estimating our model using OLS also ensures the ability to account for the complex sampling design of NHIS and MEPS. To ensure that each estimator generates nationally representative estimates of HRQL loss from injury, we accounted for the complex MEPS sample design using Stata’s “svy” command. This command allowed us to include sample strata, primary sampling units, and SAQ survey weights as additional parameters. This command produces standard errors that are robust to heteroskedasticity.
We also evaluated the Tobit estimator and the censored least absolute deviations (CLAD) estimator.2 Although these estimators make different assumptions about the error term and are not necessarily appropriate for use with health utility data, they offer some insight into the sensitivity of our model to our choice of estimator.22 Importantly, the interpretation of the results for these 2 models is not comparable with the interpretation of results from our preferred OLS specification, as these models are linear with respect to a latent variable, not predicted EQ-5D scores. The user-written CLAD command in Stata has an additional complication in that it is not compatible with the “svy” command. Instead, we employed a quantile regression (at the 50th percentile) paired with Stata’s “bootstrap” command with 100 replications. Due to time and computational constraints, we were unable to fit the CLAD estimator on the linked MEPS-NHIS data set hosted on AHRQ’s Amazon Web Services server. We estimated our model using CLAD on the MEPS sample only, as presented in the Supplemental Material. Panel specifications failed to produce meaningful results, in part due to the unbalanced nature of our panel in which only 1 HRQL score was available for one-third of respondents.
Results
Table 3 presents weighted mean values and sample proportions for EQ-5D scores, age, sex, race, ethnicity, insurance status, income level, educational attainment, and chronic comorbidities. These values are displayed for the entire sample (N = 294,977 EQ-5D scores) and stratified by EQ-5D scores with and without an associated injury. Overall, 12% of the sample includes 1 or more injuries that preceded the health status elicitation during the study period. The remaining sample (88%) is composed of respondents who did not experience an injury prior to the SAQ during the study period. The injured population skews slightly younger and more male; however, the 2 samples are largely comparable across all covariates.
Table 3.
Adjusted Mean Sample Characteristicsa
| Variable | Full Sample (N = 294,977) | Without Injury (n = 260,820) | With Injury (n = 34,157) | |||
|---|---|---|---|---|---|---|
| s | s | s | ||||
| EQ-5D | 0.86 | 0.13 | 0.86 | 0.13 | 0.85 | 0.14 |
| Age | 47.84 | 17.80 | 48.06 | 17.76 | 46.57 | 17.98 |
| Female | 0.54 | 0.50 | 0.55 | 0.50 | 0.52 | 0.50 |
| Race | ||||||
| White | 0.84 | 0.37 | 0.83 | 0.38 | 0.87 | 0.33 |
| Black | 0.11 | 0.32 | 0.12 | 0.32 | 0.09 | 0.29 |
| Asian | 0.05 | 0.21 | 0.05 | 0.22 | 0.03 | 0.17 |
| Ethnicity | ||||||
| Hispanic | 0.12 | 0.32 | 0.12 | 0.33 | 0.08 | 0.28 |
| Not Hispanic | 0.88 | 0.32 | 0.88 | 0.33 | 0.92 | 0.28 |
| Insurance type | ||||||
| Private insurance | 0.71 | 0.45 | 0.71 | 0.45 | 0.74 | 0.44 |
| Public insurance | 0.18 | 0.38 | 0.18 | 0.38 | 0.16 | 0.36 |
| Uninsured | 0.11 | 0.31 | 0.11 | 0.31 | 0.11 | 0.31 |
| Income level | ||||||
| Poor | 0.11 | 0.31 | 0.11 | 0.31 | 0.11 | 0.31 |
| Near poor | 0.04 | 0.20 | 0.04 | 0.20 | 0.04 | 0.19 |
| Low income | 0.13 | 0.33 | 0.13 | 0.34 | 0.13 | 0.33 |
| Middle income | 0.30 | 0.46 | 0.30 | 0.46 | 0.30 | 0.46 |
| High income | 0.42 | 0.49 | 0.42 | 0.49 | 0.43 | 0.49 |
| Educational attainment | ||||||
| Less than high school | 0.29 | 0.45 | 0.29 | 0.46 | 0.26 | 0.44 |
| High school degree | 0.26 | 0.44 | 0.26 | 0.44 | 0.26 | 0.44 |
| Bachelor’s degree | 0.15 | 0.36 | 0.15 | 0.36 | 0.15 | 0.36 |
| Graduate degree | 0.10 | 0.30 | 0.10 | 0.29 | 0.10 | 0.30 |
| Other education | 0.21 | 0.41 | 0.21 | 0.40 | 0.23 | 0.42 |
| Chronic conditions | ||||||
| Chronic conditions present | 0.69 | 0.46 | 0.70 | 0.46 | 0.67 | 0.47 |
| No. of chronic conditions | 1.95 | 2.19 | 1.93 | 2.16 | 2.05 | 2.40 |
With and without injury summary statistics are for injuries observed in the Medical Expenditure Panel Survey data only (i.e., excludes injuries identified in the National Health Interview Survey).
OLS regression results incorporating MEPS and NHIS data are displayed in Table 4. First-year estimates reflect a pooled value from the 3 underlying periods (0–3, 4–6, and 7–12 mo). We estimated 16 statistically significant estimates in the first year following injury (95% confidence interval [CI]), 11 in the second year, and 6 in the third year. With few exceptions concentrated in the third year, these estimates are negative, suggesting an adverse impact of injury on HRQL. Full regression outputs, including coefficient estimates for covariates, are presented in Table A3 of the Supplemental Materials. Indicators of sex, age, race, ethnicity, income, education, and insurance type were statistically significant in explaining the variation in EQ-5D scores.
Table 4.
Injury Group Coefficient Estimates of the OLS Multivariate EQ-5D Regressiona
| Injury Group | Year 1 | Year 2 | Year 3 | |||
|---|---|---|---|---|---|---|
| Coefficient | SE | Coefficient | SE | Coefficient | SE | |
| Eye injury | 0.0048 | 0.0034 | 0.0015 | 0.0051 | 0.0135 | 0.0095 |
| ENT foreign body | −0.0253 | 0.0256 | −0.0334 | 0.0306 | 0.0000 | |
| Pulmonary/GI/GU foreign body | 0.0165 | 0.0178 | −0.0537 | 0.0406 | 0.1182*** | 0.0308 |
| Dental injury | −0.0173** | 0.0080 | −0.0250* | 0.0146 | −0.0021 | 0.0306 |
| Skin—not burn | 0.0102*** | 0.0030 | 0.0112** | 0.0051 | 0.0565*** | 0.0199 |
| Concussion | −0.0142* | 0.0086 | −0.0021 | 0.0090 | 0.0027 | 0.0198 |
| Head trauma concerning for brain injury | −0.0320*** | 0.0098 | −0.0280* | 0.0161 | −0.0007 | 0.0452 |
| Head wounds less concerning for brain injury | −0.0022 | 0.0039 | −0.0077 | 0.0062 | −0.0199* | 0.0104 |
| Facial injury | −0.0188** | 0.0091 | 0.0086 | 0.0106 | −0.0041 | 0.0142 |
| Polytrauma | −0.0025 | 0.0061 | −0.0031 | 0.0117 | −0.0458 | 0.0446 |
| Injury to spine | −0.0487*** | 0.0085 | −0.0570*** | 0.0110 | 0.0071 | 0.0240 |
| Lower-extremity fracture | −0.0356*** | 0.0033 | −0.0198*** | 0.0046 | −0.0182* | 0.0094 |
| Chest/thorax trauma | −0.0219*** | 0.0065 | −0.0256*** | 0.0090 | −0.0046 | 0.0179 |
| Upper-extremity fracture | −0.0411*** | 0.0067 | −0.0226*** | 0.0085 | −0.0085 | 0.0143 |
| Hand fracture | −0.0070* | 0.0040 | −0.0101** | 0.0050 | 0.0043 | 0.0081 |
| Nonspecific | −0.0258*** | 0.0019 | −0.0219*** | 0.0028 | −0.0244*** | 0.0066 |
| Dislocation of joint—upper body | −0.0238*** | 0.0072 | −0.0068 | 0.0102 | −0.0370* | 0.0207 |
| Dislocation of joint—lower body | −0.0292*** | 0.0057 | 0.0085 | 0.0098 | 0.0149 | 0.0160 |
| Uncomplicated strain/sprain | −0.0145*** | 0.0015 | −0.0062*** | 0.0020 | −0.0069* | 0.0037 |
| GI/GU injury | −0.0857*** | 0.0190 | −0.0230 | 0.0230 | −0.0334 | 0.0414 |
| Soft-tissue wound | −0.0032 | 0.0025 | 0.0010 | 0.0036 | 0.0126** | 0.0060 |
| Amputation—upper | −0.0091 | 0.0161 | 0.0150 | 0.0336 | −0.1260 | 0.0907 |
| Amputation—lower | −0.1264*** | 0.0075 | −0.1288*** | 0.0497 | −0.0812*** | 0.0102 |
| Vascular injury | 0.0253 | 0.0295 | −0.0036 | 0.0253 | 0.0919*** | 0.0106 |
| Superficial injury—laceration/contusion | −0.0070*** | 0.0026 | −0.0063* | 0.0033 | 0.0006 | 0.0064 |
| Burn | −0.0100 | 0.0068 | −0.0203** | 0.0068 | −0.0178 | 0.0169 |
| Peripheral nerve | −0.0973*** | 0.0201 | −0.0512*** | 0.0220 | −0.0179 | 0.0242 |
| Poisoning and toxic effects | −0.0080 | 0.0059 | 0.0000 | 0.0068 | −0.0181 | 0.0162 |
| Exposure | −0.0101 | 0.0127 | −0.0169 | 0.0162 | 0.0000 | |
GI, gastrointestinal; GU, genitourinary; MEPS, Medical Expenditure Panel Survey; NHIS, National Health Interview Survey; OLS, ordinary least squares.
Results were drawn from injuries observed in both the MEPS and NHIS samples. Number of observations = 294,125, R2 = 0.4029. Full regression results, including estimates by time period within the first year, are presented in Table A3 in the Supplemental Materials.
Statistical significance with P < 0.10 (2-tailed t test).
Statistical significance with P < 0.05.
Statistical significance with P < 0.01.
The Supplemental Materials also includes regression results using OLS, Tobit, and CLAD estimators for the MEPS sample only (Table A4) as well as estimates stratified by ICD-9 code (Table A5). Estimates appear stable across estimators, with limited variation in estimated coefficients and levels of significance. Relative to OLS and Tobit, we observe 1 additional statistically significant effect using the CLAD estimator (soft-tissue wounds, 95%). Estimates at the ICD-9 level exhibit more variability than the aggregated coefficients in our primary specifications. Finally, we note generally robust estimates across scoring approaches (Table A6), with higher magnitudes of impacts when using an alternative EQ-5D mapping based on Franks et al.23
Discussion
This research provides a catalog of nationally representative, preference-based EQ-5D score decrements associated with surviving a large set of injuries and poisonings in the first 1 to 3 y following the event. Our work provides an alternative and update to lifetime estimates presented by Blincoe et al. and adheres to second PCEHM recommendations by relying on patients’ self-reported health status and nationally representative, community-based preference scores for generic, widely used health status instruments (EQ-5D, SF-12).7,15 The face validity of the resulting estimates appears encouraging. For instance, we observe the largest decrements for severe injuries (e.g., amputations, spinal cord injuries) and smaller decrements for minor injuries (e.g., superficial abrasions and contusions). Moreover, effects are most pronounced in the first year after injury.
The current research represents a novel methodology for assessing quality-of-life impacts for acute conditions. Related research using MEPS has focused on chronic conditions due to difficulties in assessing the timing of medical conditions. To assess acute conditions, researchers typically sample from treatment centers and administer health status instruments to a patient cohort at various points during recovery. These approaches are more financially and administratively burdensome and often result in samples of more severe injuries, such as those treated in burn or trauma centers. In contrast, the MEPS and NHIS samples are geographically representative, include a range of injuries (minor and severe), and collect information annually. While the injuries observed in MEPS are largely comparable with those observed in administrative data sets, the survey also includes some self-reported and untreated conditions (e.g., minor bruises) that would not appear in medical claims data. Although this article examines a broad set of injuries, researchers may explore adapting these methods to study other short-lived conditions and health states, such as COVID-19 or chemotherapy.
Limitations
As noted in Sullivan and Ghushchyan,2 identifying the exact timing of reported conditions in MEPS is difficult. For acute conditions such as minor abrasions or contusions, reliable HRQL estimation necessitates accurate information on the timing of both injury occurrence and health status elicitation. While roughly half of all injuries in MEPS have a self-reported injury occurrence date, we observe item nonresponse for the remaining injuries and rely on imputation using either a midmonth estimate—when month and year are reported—or the date of first medical treatment. In addition, it is possible that some injuries occurred prior to the MEPS and NHIS surveys but appear in our sample due to health care utilization during our study window. Future research examining the subset of injuries with reliable information on timing is needed.
Unfortunately, MEPS discontinued elicitation of the EQ-5D instrument after 2003. We relied on mapping EQ-5D scores from SF-12 instrument responses for respondents after 2003. This approach adds potential variability and bias to our estimates compared with applying the EQ-5D or SF-6D tariff functions directly to the EQ-5D or SF-12 instrument responses. We demonstrate in the Supplemental Materials that the significance levels are largely unaffected by the choice of scoring function; however, an alternative EQ-5D mapping produced larger QALY losses in some instances.
Our efforts are also limited by small samples for some injuries. Rare injuries in the general population, such as upper-limb amputations or spinal cord injuries, are observed infrequently in MEPS and NHIS. We relied on input from 4 practicing clinicians to group similar ICD-9 injuries to improve model power. These groups resulted in a greater share of statistically significant results. However, we caution that quality-of-life affects may vary substantially within some injury groups. For example, we expect patients with fibula fractures to heal more quickly and experience fewer mobility and pain impairments than patients with femur fractures. As such, our estimates reflect an average effect by injury group, weighted by the relative prevalence of underlying ICD-9 codes and severities. As such, practitioners should use their professional judgment on how their injury or injuries of interest compare with these broad injury groups. Follow-on research for specific health conditions may face similar challenges in instances in which sample sizes are limited.
In contrast, we did not detect statistically significant effects for some prevalent but minor conditions in our OLS model, such as soft-tissue wounds. We hypothesize that the EQ-5D and SF-12 health status instruments are not sensitive to minor conditions. In addition, minor injuries are more likely to occur and heal fully prior to the administration of a health status instrument. For example, a contusion resulting in pain for 2 wk would need to occur in the 2 wk prior to the SAQ for the impact to be registered. While we were unable to estimate our CLAD specification using the pooled MEPS and NHIS data, results from the MEPS data set alone suggest the CLAD estimator detects more statistically significant effects for these less severe injuries (see Table A4 in the Supplemental Materials).
We also estimated positive coefficients for 6 of 87 injury-year combinations: skin—not burn (years 1–3), pulmonary/gastrointestinal/genitourinary foreign body (year 3), soft-tissue wound (year 3), and vascular injury (year 3). Positive disutility for injuries is inconsistent with clinical expectations. We caution practitioners against using the positive disutility estimates. Despite controlling for a number of demographic and health-related covariates, unobserved variables may be positively correlated with EQ-5D scores and these injuries. Despites these limitations, this catalog provides a set of consistently estimated health utility changes for a wide variety of conditions that will improve comparability across studies that use such estimates.
This report uses the EQ-5D-3L with US scoring as its health utility outcome of interest because a preference-based measure with US scoring will allow this catalog to be used for US regulatory analyses. There are a handful of preference-based measures with US scoring, of which the EQ-5D is one of the most widely used. The EQ-5D-3L was included in several years of MEPS and coadministered in 1 y with the SF-12v2 (which was subsequently collected in all years without the EQ-5D). This allowed construction of a mapping algorithm from the SF-12v2 to the EQ-5D-3L with US scoring, a widely accepted method to estimate health utility values from other HRQoL measures (following Wailoo et al.24). Mapping algorithms have known limitations including regression to the mean, which may have made the estimates in the catalog smaller than they would be with direct collection of the EQ-5D. Other researchers could use these same data and techniques to map to other health utility score or use the SF-6D, which was created for the SF-12.
Conclusions
Medical decision makers and federal regulatory analysts require information about the QALY losses associated with sustaining nonfatal injuries and poisonings. This analysis presents an approach to using publicly available and national representative survey questionnaires to statistically estimate HRQL losses associated with groups of injuries that could be used to estimate QALY losses. The results represent an improvement over current estimates in that they are community based and nationally representative. Additional research is required to corroborate these findings and fill the gaps where statistically significant estimates could not be estimated.
Supplemental Material
Supplemental material, sj-docx-1-mdm-10.1177_0272989X221141454 for Estimates of Quality-Adjusted Life-Year Loss for Injuries in the United States by William Raich, Jennifer Baxter, Megan Sheahan, Jeremy Goldhaber-Fiebert, Patrick Sullivan and Janel Hanmer in Medical Decision Making
Acknowledgments
We thank Lisa Robinson for recommending the novel idea to use MEPS to estimate HRQL impacts of injury. Jeffrey Hannan and Andrew Berg provided analytic support processing the MEPS and NHIS data sets and regression outputs. Drs. Christopher Standaert, Joel Tsevat, and Jennifer White provided clinical guidance and recommendations on aggregating injuries into the 29 groups presented in this article. This research was enabled in part by support provided by the US Consumer Product Safety Commission and US Coast Guard. In particular, we thank William Zamula, Mark Bailey, Jill Jenkins, and staff at the US Coast Guard’s Standards Evaluation & Analysis Division for their thoughtful comments during the development of this methodology.
Footnotes
The authors declared no potential conflicts of interest with respect to the research, authorship, and/or publication of this article. The authors disclosed receipt of the following financial support for the research, authorship, and/or publication of this article: Financial support for this study was provided in part by contracts with the United States Consumer Product Safety Commission and United States Coast Guard. The funding agreement ensured the authors’ independence in designing the study, interpreting the data, writing, and publishing the findings.
Authors’ Note: This work was conducted primarily at Industrial Economics, Incorporated. Parts of these analyses were presented at the 41st annual meeting of the Society for Medical Decision Making and at the 11th annual meeting of the Society for Benefit-Cost Analysis.
Supplemental Material: Supplementary material for this article is available on the Medical Decision Making website at http://journals.sagepub.com/home/mdm.
ORCID iDs: William Raich  https://orcid.org/0000-0001-6228-0739
Janel Hanmer https://orcid.org/0000-0001-6159-2482
Contributor Information
William Raich, Industrial Economics, Inc., Cambridge, MA, USA.
Jennifer Baxter, Industrial Economics, Inc., Cambridge, MA, USA.
Megan Sheahan, Industrial Economics, Inc., Cambridge, MA, USA.
Jeremy Goldhaber-Fiebert, Stanford University School of Medicine. Stanford, CA, USA.
Patrick Sullivan, PRECISIONheor, New York, NY, USA.
Janel Hanmer, University of Pittsburgh Medical Center, Pittsburgh, PA, USA.
References
- 1. Gold MR, Siegel JE, Russell LB, Weinstein MC, eds. Cost-Effectiveness in Health and Medicine. New York: Oxford University Press; 1996. [Google Scholar]
- 2. Sullivan PW, Ghushchyan V. Preference-based EQ-5D index scores for chronic conditions in the United States. Med Decis Making. 2006;26(4):410–20. [DOI] [PMC free article] [PubMed] [Google Scholar]
- 3. Ogwulu CB, Jackson LJ, Kinghorn P, Roberts TE. A systematic review of the techniques used to value temporary health states. Value Health. 2017;20(8):1180–97. [DOI] [PubMed] [Google Scholar]
- 4. Stoniute J, Mott DJ, Shen J. Challenges in valuing temporary health states for economic evaluation: a review of empirical applications of the chained time trade-off method. Value Health. 2018;21(5):605–11. [DOI] [PubMed] [Google Scholar]
- 5. Wright DR, Wittenberg E, Swan JS, Miksad RA, Prosser LA. Methods for measuring temporary health states for cost-utility analyses. Pharmacoeconomics 2009;27(9):713–23. [DOI] [PubMed] [Google Scholar]
- 6. Robinson LA, Hammitt JK. Skills of the trade: valuing health risk reductions in benefit-cost analysis. J Benefit-Cost Anal. 2013;4(1):107–30. [Google Scholar]
- 7. Blincoe LJ, Seay AG, Zaloshnja E, et al. The Economic Impact of Motor Vehicle Crashes, 2000. Washington (DC): National Highway Traffic Safety Administration; 2002. [Google Scholar]
- 8. Hirsch A, Eppinger R, Shame T, et al. Impairment Scaling from the Abbreviated Injury Scale. Washington (DC): National Highway Traffic Safety Administration; 1983. [Google Scholar]
- 9. Spicer RS, Miller TR, Hendrie D, Blincoe LJ. Quality-adjusted life years lost to road crash injury: updating the injury impairment index. Ann Adv Automot Med. 2011;55:365–77. [PMC free article] [PubMed] [Google Scholar]
- 10. Peterson C, Miller GF, Barnett SBL, Florence C. Economic cost of injury—United States, 2019. CDC Morb Mortal Wkly Rep. 2021;70(48):1655–9. [DOI] [PMC free article] [PubMed] [Google Scholar]
- 11. Zonfrillo MR, Spicer RS, Lawrence BA, Miller TR. Incidence and costs of injuries to children and adults in the United States. Inj Epidemiol. 2018;5(1):37. [DOI] [PMC free article] [PubMed] [Google Scholar]
- 12. Koljonen V, Laitila M, Sintonen H, Roine RP. Health-related quality of life of hospitalized patients with burns—comparison with general population and a 2-year follow-up. Burns. 2013;39(3):451–7. [DOI] [PubMed] [Google Scholar]
- 13. Miller T, Bhattacharya S, Zamula W, et al. Quality-of-life loss of people admitted to burns centers, United States. Qual Life Res. 2013;22:2293–305. [DOI] [PubMed] [Google Scholar]
- 14. Institute of Medicine. Valuing Health for Regulatory Cost-Effectiveness Analysis. Miller W, Robinson LA, Lawrence R, eds. Washington (DC): National Academies Press; 2006. [Google Scholar]
- 15. Neumann PJ, Ganiats TG, Russell LB, Sanders GD, Siegel JE. Cost-Effectiveness in Health and Medicine. Oxford University Press; 2016. [Google Scholar]
- 16. Shaw JW, Johnson JA, Coons SJ. U.S. valuation of the EQ-5D Health States: development and testing of the D1 valuation model. Med Care. 2005;43(3):203–20. [DOI] [PubMed] [Google Scholar]
- 17. Sullivan PW, Ghushchyan V. Mapping the EQ-5D index from the SF-12. Med Decis Making. 2006;26(4):401–409. [DOI] [PMC free article] [PubMed] [Google Scholar]
- 18. Hanmer J, Lawrence WF, Anderson JP, Kaplan RM, Fryback DG. Report of nationally representative values for the noninstitutionalized US adult population for 7 health-related quality-of-life scores. Med Decis Making. 2006;26(4):391–400. [DOI] [PubMed] [Google Scholar]
- 19. Hanmer J, Kaplan RM. Update to the report of nationally representative values for noninstitutionalized US adult population for five health-related quality-of-life scores. Value Health. 2016;19:1059–62. [DOI] [PMC free article] [PubMed] [Google Scholar]
- 20. Dale W, Basu A, Elstein A, Meltzer D. Predicting utility ratings for joint health states from single health states in prostate cancer: empirical testing of 3 alternative theories. Med Decis Making. 2008;28:102–12. [DOI] [PubMed] [Google Scholar]
- 21. Hanmer J, Vanness D, Gangnon R, Palta M, Fryback DG. Three methods tested to model SF-6D health utilities for health states involving co-morbidities/co-occurring conditions. J Clin Epidemiol. 2010;63(3):331–41. [DOI] [PMC free article] [PubMed] [Google Scholar]
- 22. Pullenayegum EM, Tarride JE, Xie F, Goeree R, Gerstein HC, O’Reilly D. Analysis of health utility data when some subjects attain the upper bound of 1: are Tobit and CLAD models appropriate? Value Health. 2010;13(4):487–94. [DOI] [PubMed] [Google Scholar]
- 23. Franks P, Lubetkin EI, Gold MR, Tancredi DJ, Jia H. Mapping the SF-12 to the EuroQol EQ-5D index in a national US sample. Med Decis Making. 2004;24(3):247–54. [DOI] [PubMed] [Google Scholar]
- 24. Wailoo AJ, Hernandez-Alava M, Manca A, et al. Mapping to estimate health-state utility from non–preference-based outcome measures: an ISPOR Good Practices for Outcomes Research Task Force report. Value Health. 2017;20(1):18–27. [DOI] [PubMed] [Google Scholar]
Associated Data
This section collects any data citations, data availability statements, or supplementary materials included in this article.
Supplementary Materials
Supplemental material, sj-docx-1-mdm-10.1177_0272989X221141454 for Estimates of Quality-Adjusted Life-Year Loss for Injuries in the United States by William Raich, Jennifer Baxter, Megan Sheahan, Jeremy Goldhaber-Fiebert, Patrick Sullivan and Janel Hanmer in Medical Decision Making