

ABSTRACT
Regulation of the immune response to Salmonella enterica serovar Typhimurium (S. Typhimurium) infection is a complex process, influenced by the interaction between genetic and environmental factors. Different inbred strains of mice exhibit distinct levels of resistance to S. Typhimurium infection, ranging from susceptible (e.g., C57BL/6J) to resistant (e.g., DBA/2J) strains. However, the underlying molecular mechanisms contributing to the host response remain elusive. In this study, we present a comprehensive proteomics profiling of spleen tissue from C57BL/6J and DBA/2J strains with different doses of S. Typhimurium infection by tandem mass tag labeling coupled with two-dimensional liquid chromatography-tandem mass spectrometry (TMT-LC/LC-MS/MS). We identified and quantified 3,986 proteins, resulting in 475 differentially expressed proteins (DEPs) between C57BL/6J and DBA/2J strains. Functional enrichment analysis unveiled that the mechanisms of innate immune responses to S. Typhimurium infection could be associated with several signaling pathways, including the interferon (IFN) signaling pathway. We experimentally validated the roles of the IFN signaling pathway in the innate immune response to S. Typhimurium infection using an IFN-γ neutralization assay. We further illustrated the importance of macrophage and proinflammatory cytokines in the mechanisms underlying the resistance to S. Typhimurium using quantitative reverse transcription-PCR (qRT-PCR). Taken together, our results provided new insights into the genetic regulation of the immune response to S. Typhimurium infection in mice and might lead to the discovery of potential protein targets for controlling salmonellosis.
KEYWORDS: proteome, proteomics, mass spectrometry, immune response, genetic regulation, Salmonella, S. Typhimurium, mouse
INTRODUCTION
Salmonella enterica is a Gram-negative bacterium that comprises more than 2,600 antigenically different serovars (1). Some serovars (e.g., Salmonella enterica serovar Typhimurium [S. Typhimurium]) can invade a broad range of hosts (2). Clinical manifestations of disease caused by Salmonella infection can range from self-limiting gastroenteritis to systemic enteric fever (3). According to the Centers for Disease Control and Prevention (CDC) (4), Salmonella causes about 1.35 million infections, 26,500 hospitalizations, and 420 deaths in the United States each year. In addition, cross-infection between humans and farmed animals (including chickens, pigs, and cattle) is an important cause of human salmonellosis, especially as the infection may sometimes be asymptomatic (2). Therefore, understanding the underlying immune mechanisms of the infection and pathogenesis is fundamental to effective surveillance and control of the disease.
Innate immunity to S. Typhimurium infection is a complex process that has been proven to be genetically controlled, involving the genomes of the host and pathogen, as well as the environment (5). S. Typhimurium adopts type III secretion systems (T3SSs) to bypass innate immune receptors and limit the inflammatory responses (6). It is well known that different inbred mouse strains show distinct levels of resistance to S. Typhimurium infection, ranging from susceptible (e.g., C57BL/6J, BALB/cJ, and C3H/HeJ strains) to resistant (e.g., DBA/2J and A/J strains) (7). BXD recombinant inbred (RI) mice from a cross of C57BL/6J (B6) and DBA/2J (D2) inbred strains have traditionally been used to study complex traits, such as host-pathogen interactions (8). Previous studies have shown that BXD RI mice exhibit substantial variations in the level of virulence of S. Typhimurium infection (9). The two parental strains, B6 and D2, display high susceptibility and resistance, respectively (7). However, the molecular mechanisms contributing to the different immune responses to S. Typhimurium infection between B6 and D2 strains remain elusive.
Liquid chromatography coupled with tandem mass spectrometry (LC-MS/MS) is a technique for identification of peptides and quantification of protein abundance. A combination of multiplexed tandem mass tag (TMT) labeling and two-dimensional LC-MS/MS (TMT-LC/LC-MS/MS) emerges as a power platform for large-scale quantitative proteomic experiments. Although transcriptome sequencing (RNA-seq) profiling of transcriptomes in mice after S. Typhimurium infection has been conducted (10, 11), transcript abundance might not be proportionally correlated with the level of proteins due to various posttranscriptional and posttranslational processes (12). Proteomics is a useful complementary technology to transcriptomics as proteins are direct coordinators of biological processes, allowing us to comprehensively characterize protein expression profile at a genome-wide scale and systematically elucidate molecular mechanisms contributing to the immune responses to S. Typhimurium infection.
To understand the underlying molecular mechanisms of the immune responses to S. Typhimurium infection, we first profiled a comprehensive set of proteomic data from spleen tissue from D2 and B6 strains after S. Typhimurium infection by TMT-LC/LC-MS/MS. We then performed an integrative analysis to reveal signaling pathways involved in the immune responses to S. Typhimurium infection. We validated key proteins involved in the interferon (IFN) signaling pathway by an IFN-γ neutralization experiment. We further validated the critical roles of macrophages in the responses to S. Typhimurium infection in mice by a macrophage phagocytosis assay and proinflammatory cytokine quantification using quantitative reverse transcription-PCR (qRT-PCR).
RESULTS
Proteome profiling of mouse spleen after S. Typhimurium infection.
To systematically characterize changes in protein expression in mice in response to S. Typhimurium infection, we profiled the spleen proteome in B6 and D2 mice after S. Typhimurium infection by TMT-LC/LC-MS/MS. Spleen tissue was harvested from B6 and D2 mice 14 days after a high-dosage (5 × 10⁸ CFU) and low-dosage (5 × 10⁶ CFU) S. Typhimurium inoculation, as well as B6 and D2 mice without infection as controls. Spleen tissue samples were lysed, digested, and labeled with different TMT tags and then analyzed by LC/LC-MS/MS (Fig. 1A). A total of 3,986 proteins derived from 20,270 peptides were identified and quantified at a protein false-discovery rate (FDR) of 1% (see Table S1 in the supplemental material). Principal-component analysis (PCA) showed high reproducibility between the two biological replicates (i.e., male and female) but a clear separation between treatment groups (control versus infection) and between mouse strains (B6 versus D2) (Fig. 1B). Correlation analysis of protein expression between intraclass groups (i.e., two biological replicates) and interclass groups (i.e., strains) confirmed the high quality of our proteomic data. The two biological replicates in the intraclass groups displayed a high correlation (left two panels in Fig. 1C), whereas the two different mouse strains exhibited considerable variations in protein expression after S. Typhimurium infection (right two panels in Fig. 1C).
FIG 1.

Proteomic profiling of spleens from C57BL/6J (B6) and DBA/2J (D2) mice after Salmonella enterica serovar Typhimurium (S. Typhimurium) infection. (A) Schematic diagram of proteomics experiments. B6 and D2 mice were infected with S. Typhimurium strain 14028GFP by oral administration at two dosages (5 × 10⁶ and 5 × 10⁸ CFU) for 14 days for individual males and females of each mouse strain. Whole-proteome analysis was performed by two-dimensional liquid chromatography-tandem mass spectrometry (TMT-LC/LC-MS/MS). (B) Principal-component analysis (PCA) showing high correlation between biological replicates and clear separation between groups; (C) scatter density plot showing correlation of proteins within groups and between groups. Point density from low to high is indicated by the color gradient from yellow to violet.
Previous studies showed that the Ity (immunity to Typhimurium) locus is the most prominent regulator of the susceptibility to Salmonella infection (13–15). This Ity locus-mediated innate resistance immediately prior to the exponential growth phase is modulated by a localized response in the spleen, more specifically the macrophages (16, 17). Consistent with previous findings (16), we also observed that the ITY protein (also known as SLC11A1 or NRAMP1) displayed significantly elevated expression in the D2 strain compared to the B6 strain after both high- and low-dose Salmonella infection (Fig. S1).
Differentially expressed proteins between B6 and D2 strains and between control mice and mice infected with different doses of Salmonella.
To reveal genetic control of innate resistance to S. Typhimurium infection, we performed differential protein expression analysis to identify proteins that contribute to different responses to S. Typhimurium infection between B6 and D2 strains, as well as between S. Typhimurium-infected and control mice. We identified 475 differentially expressed proteins (DEPs) (5% FDR with a fold change cutoff of 1.5) (Fig. 2A and Table S3A) between B6 and D2 mice in the high-dose infection group using the limma R package (18). We also detected a total of 118 DEPs from the interaction effects of strain and dosage at less than 5% FDR (Fig. 2B and Table S2). Enrichment analysis showed that these 475 DEPs between B6 and D2 strains were involved in various pathways related to innate immune responses, including lysosome and phagosome pathways (Fig. 2C), which were highlighted by protein-protein interactions (PPIs) (Fig. 2D). We next sought to characterize alterations in protein expression in response to different dosages of infection. In B6 mice, we identified 189 DEPs between the high-dose and control groups and 178 DEPs between the high-dose and low-dose groups (Fig. S2 and Table S3B and C), whereas, in D2 mice, no DEPs were detected between control, low-dose, and high-dose groups.
FIG 2.

Differential protein expression and pathway analyses. (A) Volcano plot showing 475 DEPs between C57BL/6J (B6) and DBA/2J (D2) mice after infection with high-dose S. Typhimurium; (B) heat map of differentially expressed proteins (DEPs). A total of 118 DEPs were detected from the interaction effects of strain and dosage by two-way analysis of variance (ANOVA) (<5% FDR). (C) Bubble plot showing Kyoto Encyclopedia of Genes and Genomes (KEGG) pathways enriched by DEPs in spleen between B6 and D2 mice infected by high-dose S. Typhimurium; (D) protein-protein interaction (PPI) network in lysosome and phagosome pathways. The color of the dot represents the value of the −log2 fold change of DEPs in spleens between B6 and D2 mice infected by high-dose S. Typhimurium. The color of the line is related to the combined score. (E) Bar plot showing expression patterns of two representative DEPs, GBP4 (guanylate-binding protein 4) and GLO1 (glyoxalase I). The two proteins displayed distinctive expression patterns among infection and control groups from the B6 and D2 strains.
A notable example of DEPs between control and S. Typhimurium-infected mice is guanylate-binding protein 4 (GBP4) (Fig. 2E), an IFN-γ-inducible GTPase protein (19). GBP4 is a protein indispensable for inflammasome activation and S. Typhimurium clearance. Our quantification data showed that high-dose S. Typhimurium infection suppressed GBP4 expression significantly in the B6 strain, although low-dose infection did not change GBP4 expression substantially. In contrast, the expression level of GBP4 was elevated in both low- and high-dose infection groups in D2 mice. This contrasting pattern in Salmonella-susceptible and -resistant mouse strains implied that GBP4 could be an imperative factor to which the differences in natural resistance to Salmonella might be attributed.
Another example of DEPs between B6 and D2 strains is glyoxalase I (GLO1), a ubiquitously expressed enzyme involved in methylglyoxal detoxification (20). Our results revealed that the GLO1 protein expression level in B6 was significantly lower than that in D2 mice (Fig. 2E). Moreover, the expression patterns of GLO1 expression among control, low-dose, and high-dose infections in B6 and D2 strains changed in opposite directions, being downregulated in B6 mice but upregulated in D2 mice. GLO1, expressed in both host and pathogen, is a critical enzyme in the process of methylglyoxal detoxification (21). Methylglyoxal is a highly reactive compound derived from glycolysis, which is present in and toxic to both the host and pathogen (22). Methylglyoxal plays a double-edged role in the host-pathogen interaction. On the one hand, bacteria use methylglyoxal as a virulence factor to attack the host, and therefore a methylglyoxal detoxification metabolism is essential for the survival of S. Typhimurium in the mammalian host (21); on the other hand, methylglyoxal is an active antibacterial compound as well (23). S. Typhimurium not only produces toxic methylglyoxal as a mechanism of virulence but also produces GLO1 to protect the pathogen itself. Thus, S. Typhimurium is not affected by the toxic methylglyoxal generated by itself. An interesting study showed that STM3117 (glyoxalase I) was observed by LC-MS only in the S. Typhimurium isolated from Nramp1-negative (N−) macrophages (corresponding to our B6 mice), but not in Nramp1-positive (N+) macrophages (corresponding to our D2 mice) (24). These findings were well explained by our proteomics study that D2 mice expressing high-level GLO1 protein could resist the invasion of pathogen due to the better ability of D2 mice to clear the toxic methylglyoxal.
Coexpression network analysis unveils genetic control of mouse innate resistance to S. Typhimurium infection.
We next sought to identify coexpression clusters of functionally related proteins that contributed to mouse responses to S. Typhimurium infection (Fig. 3A). By using weighted gene correlation network analysis (WGCNA), three coexpression protein clusters were identified from 475 DEPs between B6 and D2 strains (Fig. 3B and C and Table S4). Cluster 1 contains 214 (45%) DEPs whose expression displayed upregulation in B6 compared to D2 mice with high-dose infection. In contrast, the expression of these proteins remains at similar levels in B6 and D2 with low-dose infection. Enrichment analysis showed that most of these proteins are involved in the metabolic and catabolic processes of cellular amino acids and posttranslational transportation of proteins (Fig. 3C and Table S5), indicating the possible mobilization of protein synthesis machinery in response to the invasion of the pathogen.
FIG 3.

Weighted protein coexpression network and functional enrichment analysis of proteins in coexpressed modules. (A) Workflow of coexpression analysis followed by protein-protein interaction (PPI) network modularization. Three coexpression clusters and 16 PPI modules were detected. (B) Three coexpression protein clusters were detected from 475 DEPs that showed strain difference between B6 and D2 mice infected by high-dose S. Typhimurium. (C) Heat map showing the Gene Ontology (GO) pathways significantly enriched in one of the three coexpression clusters. Enrichment analysis was performed using the R package clusterProfiler (version 3.18.1). The gradient presents the corresponding logarithmic enrichment P value. (D) Heat map showing six proteins involved in lysosome and autophagy pathways. These six proteins were significantly upregulated in D2 compared to B6 mice.
Conversely, cluster 2 showed noticeable downregulation in B6 compared to D2 after high-dose infection. Cluster 2 is composed of 124 (26%) DEPs, which are primarily responsible for RNA binding and processing (Fig. 3C and Tables S4 and S5). The proteins in cluster 2 are slightly upregulated after low-dose infection and significantly increased in the Salmonella-resistant D2 strain compared to the Salmonella-susceptible B6 strain. The patterns of change in protein expression in clusters 1 and 2 suggest that the innate immune response of D2 strain to Salmonella infection might be predominantly taking place at the level of RNA regulation. The unleashed rapid proliferation of Salmonella in B6 mice might deploy a large amount of protein synthesis machinery.
Further scrutinizing DEPs in cluster 2, we observed changes in protein products from a group of lysosome and autophagy pathway-related genes that were significantly upregulated in D2 mice compared to those from B6 mice (Fig. 3D). It has been well established that autophagosomes selectively targeted S. Typhimurium and delivered the pathogens to the lysosome compartment for degradation as an antibacterial defensive mechanism (25). Our results indicated that the activation of the lysosome/autophagy pathway may account for the resistance to Salmonella for D2 mice. Noticeably, our results demonstrated the expression of the CTSE gene, encoding an aspartic proteinase (cathepsin E) necessary for class II antigen presentation in macrophages (26), markedly increased in D2 mice after Salmonella infection compared to B6 mice.
Cluster 3 comprises 111 (23%) DEPs (Table S4). The expression of proteins in cluster 3 did not show a significant difference between B6 and D2 low-dose infection groups but significant downregulation in B6 high-dose infection mice, whereas upregulation was shown in the D2 high-dose infection mice. Looking into the proteins of cluster 3, we found they appertained to the pathway of immune response. Noticeably, many major histocompatibility complex class II (MHC-II) molecules were identified among these DEPs in this cluster (Table S5). MHC-II molecules have been well known for presenting antigens derived from exogenous sources, including bacteria to CD4+ T cells, in contrast to MHC-I molecules presenting peptides originated from intracellular sources to CD8+ cells (27). The pathway analysis implied that many DEPs in cluster 3 functioned in the IFN signaling pathway and appeared to be inversely regulated in the Salmonella-resistant (D2) and -sensitive (B6) mouse strains.
Protein-protein interaction network analysis suggests signaling pathways involved in innate immune response.
To further identify signaling pathways involved in the innate immune response to S. Typhimurium infection, we superimposed proteins within each cluster onto the PPI network, identifying 16 functional modules (Fig. 3A and Table S6). Each module consisted of 2 to 28 proteins (Table S6). Many of these modules were associated with known signaling pathways (Table S6). Prominently, module 2 in cluster 3 which contained 13 genes of the IFN signaling pathway (Fig. 4A and Table S6), including GBP1, GBP2, GBP4, GBP5, ISG20 (interferon-stimulated exonuclease gene 20), IRF3 (interferon regulatory factor 3), STAT1 (signal transducer and activator of transcription 1), and PARP9 [poly(ADP-ribose) polymerase family member 9] (Fig. 4B). Previous studies showed that loss-of-function mutations in the IFN signaling pathway resulted in vulnerability to infections of various pathogens, including Salmonella (19). The expression of hundreds of genes was elicited by the IFN signaling pathway, inclusive of p47 and p65 GBPs (19). It was unveiled that after Gram-negative bacterial (Salmonella and Shigella) infection, interferon-induced GBPs 1 to 4 were assembled on the surface of bacteria in a hierarchical manner, which further activated caspase-4 and its downstream pyroptotic program mediated by gasdermin-D (GSDMD) and interleukin-18 (IL-18) (19).
FIG 4.
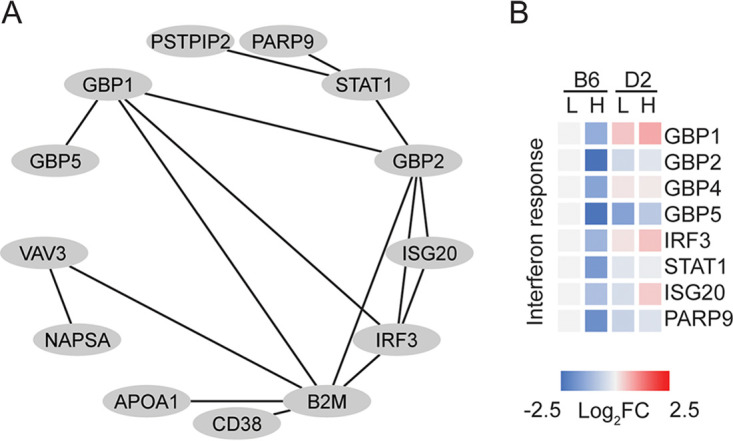
Functional modules identified by superimposing coexpression clusters on the protein-protein interaction (PPI) network. (A) PPI network showing interactions of 13 proteins of the interferon (IFN) signaling pathway. The PPI network was generated using the STRING database and visualized in Cytoscape. (B) Heat map showing eight proteins involved in IFN signaling pathway. The expression levels of these eight proteins showed downregulation in B6 after high-dose S. Typhimurium infection compared to the control group.
Another notable example was module 1 of cluster 1, the largest module consisting of 28 DEPs. Most of these DEPs were involved in the protein synthesis and posttranslational pathways, accounting for the changes at the translational level after S. Typhimurium infection. Correspondingly, module 1 in cluster 2, the second largest module, was mainly composed of DEPs enriched in RNA synthesis, splicing, processing, and binding, which reflected the responses of organisms to S. Typhimurium infection at the transcriptional level. Taken together, our network analysis provided a panoramic picture of the coordinated immune and inflammatory mechanisms after S. Typhimurium infection in mice.
IFN signaling pathway plays imperative roles in mouse innate immune responses to S. Typhimurium infection.
To confirm the roles of the IFN-γ signaling pathway in the innate immune response to S. Typhimurium infection, we performed Western blotting and histological analysis (Fig. 5A). Both results validated our findings from large-scale proteomic screening. Among proteins associated with the IFN-γ-mediated signaling pathway and differentially expressed between B6 and D2 strains after S. Typhimurium infection, we validated four important proteins, STAT1, IRF3, GBP1, and ISG20. Our results confirmed the patterns of expression levels quantified by the proteomic experiment (Fig. 5B), with upregulation in both B6 and D2 mice after S. Typhimurium infection. Notably, the upregulation of all four proteins in D2 mice was more pronounced than the changes observed in B6 mice.
FIG 5.

Gamma interferon (IFN-γ) neutralization assay to validate the role of IFN-γ in innate immune response to S. Typhimurium infection revealed by proteomics results. (A) Experimental design of IFN-γ neutralization assay; (B) Western blot analysis to validate the change of expression levels identified by the proteomics study. The B6 and D2 mice were inoculated with S. Typhimurium by oral gavage. For the IFN-γ neutralization assay, mice were intraperitoneally injected with neutralizing anti-IFN-γ antibody and the matched isotype control. Spleens were harvested from mice and homogenized by RIPA lysis with protease inhibitor cocktail. The protein concentrations of tissue lysates were quantified by BCA assay. Cell extracts were resolved on 10% SDS-PAGE and transferred to PVDF membrane. Five primary antibodies were used to probe the target proteins: STAT1, IRF3, GBP1, ISG20, and GAPDH. The membrane was then probed by goat anti-rabbit HRP-linked secondary antibody and developed with SuperSignal West Femto maximum sensitivity substrate. All four target proteins were upregulated in both B6 and D2 mice after S. Typhimurium infection compared with the corresponding controls, but the levels of upregulation in D2 mice appeared to be more pronounced than those in the B6 mice. The upregulation of these proteins in response to S. Typhimurium infection was completely abolished by anti-IFN-γ neutralizing antibody, while the upregulation could not be abrogated by the matching isotype control. (C) Representative photomicrographs of hematoxylin and eosin (H&E)-stained spleen and liver sections (magnification, ×40; bar, 250 μm). The spleens of B6 and D2 control mice had distinct and intact areas of white pulp and red pulp. The spleen of S. Typhimurium-infected B6 mice showed elevated inflammation, disrupted splenic architecture, and coalescing regions of necrosis. In contrast, the spleens of D2 mice presented minimal signs of inflammation, retained the architecture of red and white pulp, and displayed only mild multifocal necrosis. In the groups of B6 and D2 mice injected with IFN-γ neutralization antibody, the IFN-γ signaling pathway was blocked, and the spleens of B6 and D2 displayed equally severe signs of infection. The liver sections demonstrated similar patterns. Compared with the healthy liver sections from corresponding control mice, the livers of S. Typhimurium-infected B6 mice had much more inflammatory nodules and hypercellularity (extramedullary hematopoiesis) than D2 mice. However, in the IFN-γ neutralization groups, the livers of both B6 and D2 mice displayed the same extent of disruptions of histological structure and lesions.
To test the significant roles of IFN-γ signaling pathway in the innate immune responses to S. Typhimurium infection, we next performed an IFN-γ neutralization assay (Fig. 5A). The B6 and D2 mice inoculated with S. Typhimurium were intraperitoneally injected with either neutralizing anti-IFN-γ antibody or the matched isotype control. The upregulation of STAT1, IRF3, GBP1, and ISG20 in response to S. Typhimurium infection was completely abolished by anti-IFN-γ neutralizing antibody, with no reversal observed in the matched isotype control (Fig. 5B). In addition, S. Typhimurium infection caused significantly more histological changes in B6 mice than D2 ones (Fig. 5C). In the control groups of both B6 and D2 mice, hematoxylin and eosin (H&E)-stained spleen sections demonstrated intact splenic architecture with distinct areas of white and red pulp generally associated with lymphatic nodules and venous sinuses, respectively. Compared with the spleens of S. Typhimurium-infected D2 mice, the spleens of infected B6 mice overall showed many more signs of elevated inflammation, disrupted splenic architecture with expansion of the red pulp region, and coalescing regions of marked necrosis. In the IFN-γ neutralization groups, the IFN-γ signaling pathway was blocked; therefore, both infected B6 and D2 mice displayed extensive disruption of the splenic architecture and a significant number of lesions. In the liver sections of S. Typhimurium-infected B6 mice, there were a large number of inflammatory nodules and hypercellularity (extramedullary hematopoiesis) compared with the control B6 mice. In contrast, there were only sporadic lesions in the infected livers of D2 mice compared with livers in the control D2 mice. However, when the IFN-γ signaling pathway was abolished by the function-blocking antibody, the livers of S. Typhimurium-infected D2 mice showed the same level of disrupted histological structures and lesions as the livers in the B6 mice.
Macrophage and proinflammatory cytokines in host defense against S. Typhimurium infection.
To understand how macrophages are involved in the immune responses to S. Typhimurium infection, we performed a macrophage phagocytosis assay and experimental validation of cytokine expression in B6 and D2 mouse strains. Our results demonstrated that the macrophages from D2 mice were able to clear Salmonella better than those from B6 mice (Fig. 6A). Many intracellular bacteria, represented by green fluorescent protein (GFP) fluorescent signaling, were found in the macrophages from B6, whereas very few existed in those from D2. This disparity indicated the ability of macrophages to clear invading pathogens via the innate immune responses to S. Typhimurium infection. Our qRT-PCR quantification of the critical cytokines expressed in the macrophages from the two mouse strains further revealed strikingly different patterns of expression (Fig. 6B). Some proinflammatory cytokines, including IFN-γ and inducible nitric oxide synthase (iNOS), were significantly upregulated in D2 mice but not in B6 mice. In contrast, other cytokines (e.g., IFN-β, IL-6, and IL-8) were significantly upregulated in B6 mice but not in D2 mice.
FIG 6.

Experimental validation of macrophages and proinflammatory cytokines after infection by macrophage phagocytosis assay and qRT-PCR. (A) Macrophage phagocytosis assay revealing better clearance of pathogens by macrophages from D2 mice than those from B6 ones. Macrophages were differentiated from the bone marrow cells. Fluorescent images were obtained with a Leica DMi8 Thunder fluorescence microscope (Leica Camera, Wetzlar, Germany) at 550-nm excitation for green fluorescent protein (GFP) expressed in S. Typhimurium strain 14028GFP and 395-nm excitation for DAPI. (B) qRT-PCR analysis for expression of five proinflammatory cytokines (IFN-γ, iNOS, IFN-β, IL-6, and IL-8) after S. Typhimurium infection between B6 and D2 strains by qRT-PCR (n = 2 for each group). Error bars represent mean ± standard deviation (SD). *, P < 0.05; **, P < 0.01.
DISCUSSION
In this study, we conducted proteomic profiling to understand the mechanisms responsible for the natural resistance to Salmonella. Our analysis identified nearly 4,000 proteins in mouse spleen tissue, 475 of which displayed significantly differential protein expression levels between B6 and D2 mice after S. Typhimurium infection. Integrative network analysis revealed centrally connected genes and pathways implicated in response to S. Typhimurium infection in mice. We confirmed the role of the IFN-γ signaling pathway in the mouse innate immune responses to S. Typhimurium infection by performing Western blotting and histological analysis. We further experimentally validated the function of macrophage and proinflammatory cytokine expression targeting critical areas involved in host defense mechanisms against S. Typhimurium infection (macrophage phagocytosis assay and qRT-PCR validation). Taken together, the findings of the present study provided a comprehensive understanding of genetic control of innate immune responses to Salmonella infection by profiling the spleen proteome and various ways of experimental validation.
Our network analysis strongly pointed to critical functions of the IFN signaling pathway in natural resistance to S. Typhimurium infection by identifying multiple key proteins, including GBPs, STAT1, IRF3, and ISG20 (Fig. 4). Our results also revealed the upregulation of IFN-γ (type II IFN or immune IFN)-related proteins in the Salmonella-resistant D2 strain compared to the susceptible B6 strain. These results were consistent with the prior observation that IFN-γ worked as a protective cytokine in the natural host response to several bacterial infections (28). The important roles of IFN-γ in innate host responses were supported by the significantly compromised immune responses in mutant mice with gene disruptions in the IFN-γ signaling pathway (28). Many MHC-II molecules were shown as differentially expressed proteins between B6 and D2 strains (see Tables S3a and S4 in the supplemental material). MHC-II molecules were one group of the most predominant upregulated proteins in response to Salmonella infection in cultured macrophages and intestinal epithelial cells, which were regulated by IFN-γ as well (28).
Interestingly, previous studies have provided evidence of S. Typhimurium-induced production of type I interferon leading to necroptosis of macrophages, which may allow the pathogens to escape the host immune responses (29). Further study demonstrated that host type I IFN system facilitated the spread of S. Typhimurium by IFN-β-mediated repression of macrophage innate immune transcriptional responses (30). Based on our current results, we speculated that to counteract the natural resistance to Salmonella in the D2 strain, the pathogens might strategically mobilize more proteins involved in the type I IFN system.
Both IFN-α (type I IFN) and IFN-γ (type II IFN) have been implicated in Salmonella infection. Our results suggested differential response pathway utilization in the two strains, with the upregulation of type I IFNs observed in B6 mice in contrast to the type II IFN upregulation observed in D2 mice. This difference may account for the distinctive innate immune responses to Salmonella infection clearly displayed by the two strains. Type I and II IFNs activate the classical JAK (Janus-activated kinase)-STAT (signal transducer and activator of transcription) pathway of signaling (31). Since the activation of the JAK-STAT signaling pathway involves changes in the phosphorylation status of its components, further phosphoproteomic study may reveal the detailed regulatory mechanisms.
We observed that the iNOS mRNA level was significantly elevated (Fig. 6B). iNOS plays an important part in the polarization of macrophages between M1 (proinflammatory) and M2 (anti-inflammatory) states (32). IFN-γ and iNOS can differentiate macrophages into M2 macrophages and therefore promote inflammation, with the expression of iNOS depending on IFN-γ levels (33). The upregulation of the proinflammatory cytokines such as IFN-γ and iNOS in the macrophages from D2 mice implied the importance of the inflammation process—the polarization to M1 macrophages—in the innate immune responses to Salmonella infection.
Our results not only integrated many previously studied proteins in the macrophage-mediated immune responses, including components in the IFN signaling pathway, but also pointed toward novel functions of some proteins. For example, our data demonstrated strikingly different expression patterns of GLO1 between D2 and B6 mice (Fig. 2D). GLO1 was found to be responsible for converting cytotoxic metabolite methylglyoxal (MG) to S-d-lactoylglutathione, previously identified as a crucial component in osteoclastogenesis (20). The receptor activator of NF-κB ligand (RANKL) and macrophage colony-stimulating factor (M-CSF) were recognized as key regulators for osteoblasts in this process. The expression of GLO1 was detected in the macrophages in mice (34). Interestingly, a recent study has indicated the role of GLO1 in alleviating the immune inflammatory response by regulating the apoptosis pathway mediated by tumor necrosis factor alpha (TNF-α) (35). Due to the importance of RANKL and M-CSF in the immune response, it is intriguing to further decipher their enigmatic roles in the natural resistance to S. Typhimurium infection.
While we identified and experimentally validated proteins associated with immune responses to Salmonella infection, the current study has several limitations. First, our study was limited by the depth of proteomic data obtained, which can be improved by employing more orthogonal basic pH reverse-phase fractionations. Second, our proteomic measurement was based on a bulk tissue, which only reflects the average expression of heterogeneous cell populations. Single-cell proteomics technologies, such as SCoPE-MS (Single Cell ProtEomics by Mass Spectrometry) and nanoPOTs (Nanodroplet Processing in One Pot for Trace Samples), can be used for quantification of cell-type-specific expressions (36). This would be especially useful in characterizing the roles of different immune cells in the host defense responses. Third, integration of proteomic and transcriptomic data will further improve our understanding of the genetic basis of the host responses to Salmonella infection.
In summary, although previous studies have comprehensively investigated Salmonella infection in mice using a multiomics approach (37), our proteomics analysis together with Western blot validation, histology study, quantification of proinflammatory cytokines, and phagocytosis assay unveiled the molecular mechanisms underlying the different immune responses to Salmonella infection between D2 and B6 mouse strains. Our findings offer new insights into intricate processes of immune responses to Salmonella infection in mice, clarify potential mechanisms for explaining differential response to infection, and identify clear avenues to explore potential protein targets/pathways for controlling the infection.
MATERIALS AND METHODS
Bacterial culture.
The Salmonella strain used in this study is the Salmonella enterica subsp. enterica serovar Typhimurium GFP-expressing strain 14028GFP (ATCC). A sterile inoculating loop was used to lightly scratch the surface of frozen Salmonella glycerol stock. The loop was used to streak across a Luria-Bertani (LB) agar plate containing 100 μg/mL ampicillin. The plates were inverted and incubated overnight at 37°C. A single colony was picked up and inoculated into 5 mL LB medium with 100 μg/mL ampicillin. The small bacterial culture was shaken at 250 rpm overnight at 37°C. One milliliter (mL) of overnight culture was inoculated into 50 mL LB medium. The bacterial culture was incubated at 37°C until the optical density at 600 nm (OD600) reached 0.6. The density of bacteria was estimated using the formula OD600 of 1.0 = 8 × 10⁸ cells/mL. The bacteria were spun down and resuspended in phosphate-buffered saline (PBS) to 5 × 10⁶ (low dose) and 5 × 10⁸ (high dose) per 200 μL. Two hundred microliters of Salmonella suspended in PBS was administered to each mouse by oral gavage.
Animals.
All procedures for mouse infection studies were approved by the Institutional Animal Care and Use Committee at the University of North Dakota. Two inbred mouse strains were used in this study: C57BL/6J (B6) and DBA/2J (D2). Both male and female mice of each strain were used as biological replicates in this study. All animals were purchased from The Jackson Laboratory. Animals were housed and maintained in a 12-h/12-h light/dark cycle, with ad libitum access to food and water. Mice at 12 weeks old were infected with S. Typhimurium strain 14028GFP by oral administration of S. Typhimurium at two dosages (5 × 10⁶ and 5 × 10⁸ CFU) for 14 days for male and female individuals of each mouse strain. A total of 12 mice were used for the experiment. S. Typhimurium was grown in LB medium at 37°C. The bacterial titer was determined by a standard CFU count on an LB agar plate. Mice were orally inoculated with S. Typhimurium by gavage needle. Mice were assayed daily for morbidity (determined as percentage of weight loss), mortality, and clinical disease scores. After 14 days postinfection, mice were sacrificed and dissected rapidly. Spleen samples were collected, snap-frozen in liquid nitrogen, and stored at −80°C for the subsequent proteomic profiling.
Protein extraction and quantification.
The frozen spleen samples were weighed and homogenized in the lysis buffer (50 mM HEPES [pH 8.5], 8 M urea, and 0.5% sodium deoxycholate at 100 μL buffer per 10 mg tissue). The samples were homogenized in a blender (Bullet Blender Gold; Next Advance) at 4°C at speed 8 for 30 s, with a rest for 5 s, and repeated 5 to 10 times. The protein concentration was measured by bicinchoninic acid assay (BCA) (Pierce BCA protein assay kit; Thermo Scientific, catalog no. 23225).
Protein digestion and tandem mass tag labeling.
Quantified protein samples (200 μg in the lysis buffer with 8 M urea) were treated with 1 mM dithiothreitol (DTT) for 1 h at room temperature to reduce disulfide bonds. Samples were diluted to 2 M urea with 50 mM HEPES (pH 8.5) and proteolyzed with 1:50 (wt/wt) trypsin (mass spectrometry grade; Promega, catalog no. V5280) at room temperature overnight. Peptides were reduced by 1 mM DTT for 2 h at room temperature and then incubated with 10 mM iodoacetamide (IAA) for 30 min in the dark to alkylate cysteine-containing peptides. The reaction was quenched with 30 mM DTT for 30 min at room temperature. Samples were acidified by adding trifluoroacetic acid (TFA) to achieve a 1% concentration and then centrifuged at 20,000 × g at room temperature for 10 min. The supernatant was collected and desalted with a Sep-Pak C18 cartridge (Waters), and then lyophilized with a centrifugal vacuum concentrator. Each sample was resuspended in 50 mM HEPES (pH 8.5) for tandem mass tag (TMT) labeling (TMTpro 16plex label reagent set; Thermo Scientific, catalog no. A44521) following the manufacturer’s protocol and then mixed equally, followed by desalting for the subsequent fractionation.
Extensive two-dimensional liquid chromatography-tandem mass spectrometry.
The TMT-labeled samples were fractionated by offline basic pH reverse-phase liquid chromatography (LC), yielding 80 fractions, and then concatenated to 20 superfractions. Each superfraction was analyzed by acidic pH reverse-phase LC-tandem mass spectrometry (LC-MS/MS). In the acidic pH LC-MS/MS analysis, each superfraction was run sequentially on a column (75 μm inside diameter [i.d.] by 20 cm long by 365 μm outside diameter [o.d.]) (CoAnn Technologies, LLC, catalog no. HEB07502001718I) interfaced with a Q Exactive Orbitrap (Thermo Scientific). Peptides were eluted by a 4-h gradient (buffer A, water; buffer B, acetonitrile). MS settings included the MS1 scan (m/z 445 to 1,600, 70,000 resolution, 1 × 10⁶ automatic gain control [AGC], and 60-ms maximal ion time) and 10 data-dependent MS2 scans (fixed first mass of m/z 120, 70,000 resolution, 1 × 10⁵ AGC, 105-ms maximal ion time, 1.0 m/z isolation window).
Identification of proteins by database search.
We used the JUMP suite with the comet search engine (38) to search MS/MS raw data against a composite target/decoy database to evaluate the false-discovery rate (FDR). All original target protein sequences were reversed to generate a decoy database that was concatenated to the target database. FDR in the target database was estimated by the number of decoy matches (nd) and the number of target matches (nt) according to the equation (FDR = nd/nt), assuming mismatches in the target database were the same as in the decoy database. The target database was downloaded from the UniProt mouse database (87,952 entries), and the decoy database was generated by reversing targeted protein sequences. Major parameters included precursor and product ion mass tolerance (±15 ppm), full trypticity, static mass shift for the TMT tags (+304.2071453), and carbamidomethyl modification of 57.02146 on cysteine, dynamic mass shift for Met oxidation (+15.99491), maximal missed cleavage (n = 2), and maximal modification sites (n = 3). Putative peptide spectrum matches (PSMs) were filtered by mass accuracy and then grouped by precursor ion charge state and filtered by matching scores (cross-correlation [Xcorr] and ΔXcorr) to reduce the FDR below 1% for proteins. If one peptide could be generated from multiple homologous proteins, based on the rule of parsimony, the peptide was assigned to the canonical protein form in the manually curated Swiss-Prot database. If no canonical form was defined, the peptide was assigned to the protein with the highest PSM number. We removed one-hit wonders from the list of proteins identified.
TMT-based peptide/protein quantification by JUMP software suite.
Protein expression was quantified using the following steps with the JUMP software suite. (i) TMT reporter ion intensities were extracted for each PSM. (ii) The raw intensities were corrected based on isotopic distribution of each labeling reagent. (iii) PSMs with very low intensities (e.g., minimum intensity of 1,000 and median intensity of 5,000) were excluded from the subsequent analysis. (iv) Sample loading bias was normalized with the trimmed median intensity of all PSMs. (v) The mean-centered intensities across samples were calculated. (vi) Protein relative intensities were calculated by averaging related PSMs. (vii) Protein absolute intensities were computed by multiplying the relative intensities by the grand mean of the three most highly abundant PSMs.
Principal-component analysis.
Principal-component analysis (PCA) was used to visualize the differences among samples. Intensities of all proteins in a sample were used as features of PCA. The pairwise Euclidean distance between features was calculated. PCA was performed using the R package prcomp (version 3.4.0).
Differential expression analysis.
Differentially expressed proteins between the two strains and two different doses were identified by the limma R package (version 3.46.0). The Benjamini-Hochberg method was used to control multiple-testing correction, and proteins with an adjusted P value of <0.05 and log2 fold change of >1.0 or 1.5 were defined as differentially expressed.
Pathway enrichment.
To assess the functional relevance of the differentially expressed proteins, the R package clusterProfiler (version 3.18.1) was used for Gene Ontology enrichment analysis (39). Gene Ontology terms with a Benjamini-Hochberg adjusted P value of <0.05 were defined as significantly enriched. Kyoto Encyclopedia of Genes and Genomes (KEGG) enrichment analyses were conducted by a web server (DAVID) using the DEPs in spleen between C57BL/6J and DBA/2J mice treated with the high dose of Salmonella. The cutoff P value was 0.05 (40). The pathways were visualized by Cytoscape 3.9.0 (41).
Weighted gene correlation network analysis.
Weighted gene correlation network analysis (WGCNA) was performed as described before (42) with the WGCNA R package (43), using an integrated software suite JUMPn (44). The DEPs were used to construct the cluster. Pearson correlation matrix (with direction, i.e., for building signed correlation network) was calculated. An adjacency matrix was calculated by raising the correlation matrix to a power of 16 using modified scale-free topology criterion (45). Correlation clusters were defined by hybrid dynamic tree-cutting method (43) with a minimum height for merging modules of 0.2. A consensus trend was calculated based on the first principal component (i.e., eigengene) for every cluster. Proteins were assigned to the most correlated cluster with a minimum cutoff of Pearson correlation coefficient (r) of 0.7.
Protein-protein interaction network analysis.
Protein-protein interaction (PPI) network analysis was conducted as described before (42), using the integrated software suite JUMPn (44). Proteins in each cluster by WGCNA were superimposed onto a heterogeneous composite PPI database that combined STRING (v.11.5), BioPlex (46), and InWeb_IM (47), which included 18,515 proteins and 469,993 PPI connections. Modules in each protein cluster were defined by a two-step procedure: (i) PPI edges were retained only if both nodes (i.e., the two connected proteins) came from proteins in the same cluster, and then (ii) a topologically overlapping matrix (48) for the PPI network was computed, and this network was modularized into individual modules by the hybrid dynamic tree-cutting method (43).
Neutralization of IFN-γ in infected mice.
Mice were inoculated as described in the previous paragraph and kept in separate cages. Mice were injected intraperitoneally with 200 μg of either an anti-IFN-γ neutralizing antibody (Ultra-LEAF purified anti-mouse IFN-γ antibody; BioLegend, catalog no. 505834), or 200 μg isotype matched control antibody (Ultra-LEAF purified rat IgG1, κ isotype control antibody; BioLegend, catalog no. 400432). Fourteen days after the last challenge, mice were euthanized by carbon dioxide inhalation followed by cervical dislocation. Spleen and liver tissue was collected for further analysis.
Western blot analysis.
Spleens were harvested from mice and homogenized in radioimmunoprecipitation assay (RIPA) lysis and extraction buffer (Thermo Scientific, catalog no. 89900) with 100× Halt protease inhibitor cocktail (EDTA free) (Thermo Scientific, catalog no. 87885) added immediately prior to lysis. The protein concentrations of tissue lysates were quantified by Pierce BCA protein assay kit (Thermo Scientific, catalog no. 23225). Cell extracts were resolved on 10% sodium dodecyl sulfate-polyacrylamide gel electrophoresis (SDS-PAGE) and transferred for 2 h at 48 mA to Immobilon-P polyvinylidene difluoride (PVDF) membrane (Millipore, catalog no. IPVH00010). The following primary antibodies were used to probe the target proteins: a 1:1,000 dilution of rabbit anti-total STAT1 (Cell Signaling, catalog no. 9172T), a 1:1,000 dilution of monoclonal rabbit anti-IRF3 (Cell Signaling, catalog no. 4302S), a 1:1,000 dilution of polyclonal rabbit anti-GBP1 (Novus Biologicals, catalog no. NBP2-03972SS), a 1:2,000 dilution of polyclonal rabbit anti-ISG20 (Proteintech, catalog no. 22097-1-AP), and a 1:2,000 dilution of rabbit anti-GAPDH (anti-glyceraldehyde-3-phosphate dehydrogenase) antibody (Cell Signaling, catalog no. 5174). The proteins were then probed with a 1:3,000 dilution of goat anti-rabbit horseradish peroxidase (HRP)-linked secondary antibody (Cell Signaling, catalog no. 7074P2). Then, the membrane was developed with SuperSignal West Femto maximum-sensitivity substrate (Thermo Scientific, catalog no. 34094) according to the manufacturer's protocol.
Histology image analysis.
Spleens and livers were harvested from mice and immediately fixed in paraformaldehyde (4% in PBS solution) (Fisher Scientific, catalog no. AAJ61899AP) for 48 h and embedded in paraffin. Five-micrometer sections (microtome; Leica) were used for H&E and Brown-Hopps-Gram staining. The slides were scanned on the Nanozoomer 2.0 (Hamamatsu) at ×40. Histological assessment was performed randomly.
Macrophage phagocytosis assay.
B6 and D2 mice (one male and one female for each strain) were sacrificed by carbon dioxide (CO2) inhalation followed by cervical dislocation. The abdomen regions and hind limbs were sterilized with 70% ethanol. The bone marrow of femur and tibia was harvested by flushing the bones with Dulbecco's modified Eagle’s medium (DMEM) (Gibco, Thermo Scientific) using a 1-mL insulin syringe (31-gauge needle) in a laminar flow hood. The bone marrow cells were pipetted up and down to bring the cells into single-cell suspension. Macrophages were differentiated in 10-cm cell culture petri dishes in DMEM supplemented with 10% heat-inactivated fetal bovine serum (FBS) (Gibco, Thermo Scientific), 30% L929-conditioned medium (courtesy of Ramkumar Mathur), and 10% penicillin-streptomycin (10,000 U/mL) (Gibco, Thermo Scientific) in a humidified incubator with 5% CO2 at 37°C. Fresh medium was added every 2 to 3 days. Macrophage progenitors adhered to the cell dish and were not washed away. Macrophages were fully differentiated by day 6. On the seventh day, macrophages were counted using a hemocytometer. One million macrophages were seeded into one well of a 12-well plate, with one coverslip in each well. S. Typhimurium bacteria were introduced into the medium with a nominal multiplicity of infection (MOI) of 10. Infection proceeded for 15 min. Then, macrophages were washed twice with PBS supplemented with 20% penicillin-streptomycin to remove extracellular bacteria and then incubated in DMEM for 2 h. The coverslips were taken out and mounted with Fluoromount-G mounting medium, with DAPI (4′,6-diamidino-2-phenylindole) (Invitrogen, Thermo Scientific) on microscope slides. Fluorescent images were obtained by a Leica DMi8 Thunder fluorescence microscope (Leica Camera, Wetzlar, Germany) at 550-nm excitation for green fluorescent protein (GFP) expressed in S. Typhimurium strain 14028GFP and 395-nm excitation for DAPI. The rest of the macrophage cells were collected for quantitative reverse transcription-PCR (qRT-PCR) analysis.
qRT-PCR quantification of cytokines.
Total RNA was isolated from macrophages using TRIzol reagent (Thermo Scientific). To extract RNA, macrophage cells were washed with PBS and quickly homogenized in TRIzol reagent. The RNA pellets were resuspended in 50 μL RNase-free water and incubated for 10 min at 55°C. The concentration of RNA was measured using a Smart-Spec Plus spectrophotometer (Bio-Rad). Then, cDNA was synthesized from 0.5 to 1 g of total RNA in a 20-μL volume using a high-capacity cDNA reverse transcription kit (Applied Biosystems, Thermo Scientific, catalog no. 4368814). The qRT-PCR procedure was performed with 5 min at 25°C, 30 min at 42°C, and 30 min at 95°C. Two microliters of cDNA was combined with SYBR green PCR master mix (Thermo Scientific) and loaded into the CFX Connect real-time PCR detection system (Bio-Rad) as technical duplicates. Primer sets for a panel of proinflammatory marker genes were employed. These included IFN-α, IFN-β, IFN-γ, TNF-α, iNOS, CD11b, IL-1, IL-6, and IL-8. Primer sequences are listed in Table S7 in the supplemental material. The raw data from real-time PCR was analyzed as previously described (49, 50). After normalization to 18S rRNA, we assessed the difference in relative gene expression between the infection and control groups using threshold cycle (CT) values normalized to 18S rRNA. To determine statistical significance, a t test was performed.
Data availability.
The mass spectrometry proteomics data have been deposited in the ProteomeXchange Consortium (http://proteomecentral.proteomexchange.org) via the PRIDE partner repository (51) with the data set identifier PXD038436, including the mass spectrometer output files (.raw) and peptide identification files (.pepXML).
Footnotes
Supplemental material is available online only.
Contributor Information
Ramkumar Mathur, Email: ramkumar.mathur@und.edu.
Xusheng Wang, Email: xusheng.wang@und.edu.
Manuela Raffatellu, University of California San Diego School of Medicine.
REFERENCES
- 1.Gal-Mor O, Boyle EC, Grassl GA. 2014. Same species, different diseases: how and why typhoidal and non-typhoidal Salmonella enterica serovars differ. Front Microbiol 5:391. 10.3389/fmicb.2014.00391. [DOI] [PMC free article] [PubMed] [Google Scholar]
- 2.Stevens MP, Kingsley RA. 2021. Salmonella pathogenesis and host-adaptation in farmed animals. Curr Opin Microbiol 63:52–58. 10.1016/j.mib.2021.05.013. [DOI] [PubMed] [Google Scholar]
- 3.Zha L, Garrett S, Sun J. 2019. Salmonella infection in chronic inflammation and gastrointestinal cancer. Diseases 7:28. 10.3390/diseases7010028. [DOI] [PMC free article] [PubMed] [Google Scholar]
- 4.Centers for Disease Control and Prevention. 2022. Salmonella. https://www.cdc.gov/salmonella/index.html.
- 5.Caron J, Loredo-Osti JC, Morgan K, Malo D. 2005. Mapping of interactions and mouse congenic strains identified novel epistatic QTLs controlling the persistence of Salmonella Enteritidis in mice. Genes Immun 6:500–508. 10.1038/sj.gene.6364234. [DOI] [PubMed] [Google Scholar]
- 6.Galán JE. 2021. Salmonella Typhimurium and inflammation: a pathogen-centric affair. Nat Rev Microbiol 19:716–725. 10.1038/s41579-021-00561-4. [DOI] [PMC free article] [PubMed] [Google Scholar]
- 7.Robson HG, Vas SI. 1972. Resistance of inbred mice to Salmonella typhimurium. J Infect Dis 126:378–386. 10.1093/infdis/126.4.378. [DOI] [PubMed] [Google Scholar]
- 8.Ashbrook DG, Arends D, Prins P, Mulligan MK, Roy S, Williams EG, Lutz CM, Valenzuela A, Bohl CJ, Ingels JF, McCarty MS, Centeno AG, Hager R, Auwerx J, Sen S, Lu L, Williams RW. 2019. The expanded BXD family of mice: a cohort for experimental systems genetics and precision medicine. BioRxiv https://www.biorxiv.org/content/10.1101/672097v2. [DOI] [PMC free article] [PubMed]
- 9.Benjamin WH, Turnbough CL, Posey BS, Briles DE. 1986. Salmonella typhimurium virulence genes necessary to exploit the Itys/s genotype of the mouse. Infect Immun 51:872–878. 10.1128/iai.51.3.872-878.1986. [DOI] [PMC free article] [PubMed] [Google Scholar]
- 10.Westermann AJ, Förstner KU, Amman F, Barquist L, Chao Y, Schulte LN, Müller L, Reinhardt R, Stadler PF, Vogel J. 2016. Dual RNA-seq unveils noncoding RNA functions in host-pathogen interactions. Nature 529:496–501. 10.1038/nature16547. [DOI] [PubMed] [Google Scholar]
- 11.Avital G, Avraham R, Fan A, Hashimshony T, Hung DT, Yanai I. 2017. scDual-Seq: mapping the gene regulatory program of Salmonella infection by host and pathogen single-cell RNA-sequencing. Genome Biol 18:200. 10.1186/s13059-017-1340-x. [DOI] [PMC free article] [PubMed] [Google Scholar]
- 12.Liu Y, Beyer A, Aebersold R. 2016. On the dependency of cellular protein levels on mRNA abundance. Cell 165:535–550. 10.1016/j.cell.2016.03.014. [DOI] [PubMed] [Google Scholar]
- 13.Plant J, Glynn AA. 1979. Locating salmonella resistance gene on mouse chromosome 1. Clin Exp Immunol 37:1–6. [PMC free article] [PubMed] [Google Scholar]
- 14.O’Brien AD, Rosenstreich DL, Taylor BA. 1980. Control of natural resistance to Salmonella typhimurium and Leishmania donovani in mice by closely linked but distinct genetic loci. Nature 287:440–442. 10.1038/287440a0. [DOI] [PubMed] [Google Scholar]
- 15.Mock B, Krall M, Blackwell J, O’Brien A, Schurr E, Gros P, Skamene E, Potter M. 1990. A genetic map of mouse chromosome 1 near the Lsh-Ity-Bcg disease resistance locus. Genomics 7:57–64. 10.1016/0888-7543(90)90518-y. [DOI] [PubMed] [Google Scholar]
- 16.Lissner CR, Swanson RN, O’Brien AD. 1983. Genetic control of the innate resistance of mice to Salmonella typhimurium: expression of the Ity gene in peritoneal and splenic macrophages isolated in vitro. J Immunol 131:3006–3013. [PubMed] [Google Scholar]
- 17.Maskell DJ, Hormaeche CE, Harrington KA, Joysey HS, Liew FY. 1987. The initial suppression of bacterial growth in a Salmonella infection is mediated by a localized rather than a systemic response. Microb Pathog 2:295–305. 10.1016/0882-4010(87)90127-6. [DOI] [PubMed] [Google Scholar]
- 18.Ritchie ME, Phipson B, Wu D, Hu Y, Law CW, Shi W, Smyth GK. 2015. limma powers differential expression analyses for RNA-sequencing and microarray studies. Nucleic Acids Res 43:e47. 10.1093/nar/gkv007. [DOI] [PMC free article] [PubMed] [Google Scholar]
- 19.MacMicking JD. 2004. IFN-inducible GTPases and immunity to intracellular pathogens. Trends Immunol 25:601–609. 10.1016/j.it.2004.08.010. [DOI] [PubMed] [Google Scholar]
- 20.Kawatani M, Okumura H, Honda K, Kanoh N, Muroi M, Dohmae N, Takami M, Kitagawa M, Futamura Y, Imoto M, Osada H. 2008. The identification of an osteoclastogenesis inhibitor through the inhibition of glyoxalase I. Proc Natl Acad Sci USA 105:11691–11696. 10.1073/pnas.0712239105. [DOI] [PMC free article] [PubMed] [Google Scholar]
- 21.Chakraborty S, Gogoi M, Chakravortty D. 2015. Lactoylglutathione lyase, a critical enzyme in methylglyoxal detoxification, contributes to survival of Salmonella in the nutrient rich environment. Virulence 6:50–65. 10.4161/21505594.2014.983791. [DOI] [PMC free article] [PubMed] [Google Scholar]
- 22.Ramasamy R, Yan SF, Schmidt AM. 2006. Methylglyoxal comes of AGE. Cell 124:258–260. 10.1016/j.cell.2006.01.002. [DOI] [PubMed] [Google Scholar]
- 23.Chakraborty S, Karmakar K, Chakravortty D. 2014. Cells producing their own nemesis: understanding methylglyoxal metabolism: cause and consequences of methylglyoxal metabolism. IUBMB Life 66:667–678. 10.1002/iub.1324. [DOI] [PubMed] [Google Scholar]
- 24.Shi L, Adkins JN, Coleman JR, Schepmoes AA, Dohnkova A, Mottaz HM, Norbeck AD, Purvine SO, Manes NP, Smallwood HS, Wang H, Forbes J, Gros P, Uzzau S, Rodland KD, Heffron F, Smith RD, Squier TC. 2006. Proteomic analysis of Salmonella enterica serovar Typhimurium isolated from RAW 264.7 macrophages. J Biol Chem 281:29131–29140. 10.1074/jbc.M604640200. [DOI] [PubMed] [Google Scholar]
- 25.Huang J, Brumell JH. 2014. Bacteria-autophagy interplay: a battle for survival. Nat Rev Microbiol 12:101–114. 10.1038/nrmicro3160. [DOI] [PMC free article] [PubMed] [Google Scholar]
- 26.Szulc-Dąbrowska L, Bossowska-Nowicka M, Struzik J, Toka FN. 2020. Cathepsins in bacteria-macrophage interaction: defenders or victims of circumstance? Front Cell Infect Microbiol 10:601072. 10.3389/fcimb.2020.601072. [DOI] [PMC free article] [PubMed] [Google Scholar]
- 27.Neefjes J, Jongsma MLM, Paul P, Bakke O. 2011. Towards a systems understanding of MHC class I and MHC class II antigen presentation. Nat Rev Immunol 11:823–836. 10.1038/nri3084. [DOI] [PubMed] [Google Scholar]
- 28.Shtrichman R, Samuel CE. 2001. The role of gamma interferon in antimicrobial immunity. Curr Opin Microbiol 4:251–259. 10.1016/s1369-5274(00)00199-5. [DOI] [PubMed] [Google Scholar]
- 29.Robinson N, McComb S, Mulligan R, Dudani R, Krishnan L, Sad S. 2012. Type I interferon induces necroptosis in macrophages during infection with Salmonella enterica serovar Typhimurium. Nat Immunol 13:954–962. 10.1038/ni.2397. [DOI] [PMC free article] [PubMed] [Google Scholar]
- 30.Perkins DJ, Rajaiah R, Tennant SM, Ramachandran G, Higginson EE, Dyson TN, Vogel SN. 2015. Salmonella Typhimurium co-opts the host type I IFN system to restrict macrophage innate immune transcriptional responses selectively. J Immunol 195:2461–2471. 10.4049/jimmunol.1500105. [DOI] [PMC free article] [PubMed] [Google Scholar]
- 31.Platanias LC. 2005. Mechanisms of type-I- and type-II-interferon-mediated signalling. Nat Rev Immunol 5:375–386. 10.1038/nri1604. [DOI] [PubMed] [Google Scholar]
- 32.Xue Q, Yan Y, Zhang R, Xiong H. 2018. Regulation of iNOS on immune cells and its role in diseases. Int J Mol Sci 19:3805. 10.3390/ijms19123805. [DOI] [PMC free article] [PubMed] [Google Scholar]
- 33.Mosser DM, Edwards JP. 2008. Exploring the full spectrum of macrophage activation. Nat Rev Immunol 8:958–969. 10.1038/nri2448. [DOI] [PMC free article] [PubMed] [Google Scholar]
- 34.Hollenbach M, Hintersdorf A, Huse K, Sack U, Bigl M, Groth M, Santel T, Buchold M, Lindner I, Otto A, Sicker D, Schellenberger W, Almendinger J, Pustowoit B, Birkemeyer C, Platzer M, Oerlecke I, Hemdan N, Birkenmeier G. 2008. Ethyl pyruvate and ethyl lactate down-regulate the production of pro-inflammatory cytokines and modulate expression of immune receptors. Biochem Pharmacol 76:631–644. 10.1016/j.bcp.2008.06.006. [DOI] [PubMed] [Google Scholar]
- 35.Du F, Li Y, Shen J, Zhao Y, Kaboli PJ, Xiang S, Wu X, Li M, Zhou J, Zheng Y, Yi T, Li X, Li J, Xiao Z, Wen Q. 2019. Glyoxalase 1 gene improves the antistress capacity and reduces the immune inflammatory response. BMC Genet 20:95. 10.1186/s12863-019-0795-z. [DOI] [PMC free article] [PubMed] [Google Scholar]
- 36.Kelly RT. 2020. Single-cell proteomics: progress and prospects. Mol Cell Proteomics 19:1739–1748. 10.1074/mcp.R120.002234. [DOI] [PMC free article] [PubMed] [Google Scholar]
- 37.Deatherage Kaiser BL, Li J, Sanford JA, Kim Y-M, Kronewitter SR, Jones MB, Peterson CT, Peterson SN, Frank BC, Purvine SO, Brown JN, Metz TO, Smith RD, Heffron F, Adkins JN. 2013. A multi-omic view of host-pathogen-commensal interplay in Salmonella-mediated intestinal infection. PLoS One 8:e67155. 10.1371/journal.pone.0067155. [DOI] [PMC free article] [PubMed] [Google Scholar]
- 38.Eng JK, Jahan TA, Hoopmann MR. 2013. Comet: an open-source MS/MS sequence database search tool. Proteomics 13:22–24. 10.1002/pmic.201200439. [DOI] [PubMed] [Google Scholar]
- 39.Yu G, Wang L-G, Han Y, He Q-Y. 2012. clusterProfiler: an R package for comparing biological themes among gene clusters. OMICS 16:284–287. 10.1089/omi.2011.0118. [DOI] [PMC free article] [PubMed] [Google Scholar]
- 40.Sherman BT, Hao M, Qiu J, Jiao X, Baseler MW, Lane HC, Imamichi T, Chang W. 2022. DAVID: a web server for functional enrichment analysis and functional annotation of gene lists (2021 update). Nucleic Acids Res 50:W216–W221. 10.1093/nar/gkac194. [DOI] [PMC free article] [PubMed] [Google Scholar]
- 41.Shannon P, Markiel A, Ozier O, Baliga NS, Wang JT, Ramage D, Amin N, Schwikowski B, Ideker T. 2003. Cytoscape: a software environment for integrated models of biomolecular interaction networks. Genome Res 13:2498–2504. 10.1101/gr.1239303. [DOI] [PMC free article] [PubMed] [Google Scholar]
- 42.Bai B, Wang X, Li Y, Chen P-C, Yu K, Dey KK, Yarbro JM, Han X, Lutz BM, Rao S, Jiao Y, Sifford JM, Han J, Wang M, Tan H, Shaw TI, Cho J-H, Zhou S, Wang H, Niu M, Mancieri A, Messler KA, Sun X, Wu Z, Pagala V, High AA, Bi W, Zhang H, Chi H, Haroutunian V, Zhang B, Beach TG, Yu G, Peng J. 2020. Deep multilayer brain proteomics identifies molecular networks in Alzheimer’s disease progression. Neuron 105:975–991.e7. 10.1016/j.neuron.2019.12.015. [DOI] [PMC free article] [PubMed] [Google Scholar]
- 43.Langfelder P, Horvath S. 2008. WGCNA: an R package for weighted correlation network analysis. BMC Bioinformatics 9:559. 10.1186/1471-2105-9-559. [DOI] [PMC free article] [PubMed] [Google Scholar]
- 44.Vanderwall D, Suresh P, Fu Y, Cho J-H, Shaw TI, Mishra A, High AA, Peng J, Li Y. 2021. JUMPn: a streamlined application for protein co-expression clustering and network analysis in proteomics. J Vis Exp 10.3791/62796. [DOI] [PMC free article] [PubMed] [Google Scholar]
- 45.Zhang B, Horvath S. 2005. A general framework for weighted gene co-expression network analysis. Stat Appl Genet Mol Biol 4:Article17. 10.2202/1544-6115.1128. [DOI] [PubMed] [Google Scholar]
- 46.Huttlin EL, Bruckner RJ, Paulo JA, Cannon JR, Ting L, Baltier K, Colby G, Gebreab F, Gygi MP, Parzen H, Szpyt J, Tam S, Zarraga G, Pontano-Vaites L, Swarup S, White AE, Schweppe DK, Rad R, Erickson BK, Obar RA, Guruharsha KG, Li K, Artavanis-Tsakonas S, Gygi SP, Harper JW. 2017. Architecture of the human interactome defines protein communities and disease networks. Nature 545:505–509. 10.1038/nature22366. [DOI] [PMC free article] [PubMed] [Google Scholar]
- 47.Li T, Wernersson R, Hansen RB, Horn H, Mercer J, Slodkowicz G, Workman CT, Rigina O, Rapacki K, Stærfeldt HH, Brunak S, Jensen TS, Lage K. 2017. A scored human protein-protein interaction network to catalyze genomic interpretation. Nat Methods 14:61–64. 10.1038/nmeth.4083. [DOI] [PMC free article] [PubMed] [Google Scholar]
- 48.Ravasz E, Somera AL, Mongru DA, Oltvai ZN, Barabási A-L. 2002. Hierarchical organization of modularity in metabolic networks. Science 297:1551–1555. 10.1126/science.1073374. [DOI] [PubMed] [Google Scholar]
- 49.Livak KJ, Schmittgen TD. 2001. Analysis of relative gene expression data using real-time quantitative PCR and the 2−ΔΔCT method. Methods 25:402–408. 10.1006/meth.2001.1262. [DOI] [PubMed] [Google Scholar]
- 50.Schmittgen TD, Livak KJ. 2008. Analyzing real-time PCR data by the comparative CT method. Nat Protoc 3:1101–1108. 10.1038/nprot.2008.73. [DOI] [PubMed] [Google Scholar]
- 51.Perez-Riverol Y, Csordas A, Bai J, Bernal-Llinares M, Hewapathirana S, Kundu DJ, Inuganti A, Griss J, Mayer G, Eisenacher M, Pérez E, Uszkoreit J, Pfeuffer J, Sachsenberg T, Yılmaz Ş, Tiwary S, Cox J, Audain E, Walzer M, Jarnuczak AF, Ternent T, Brazma A, Vizcaíno JA. 2019. The PRIDE database and related tools and resources in 2019: improving support for quantification data. Nucleic Acids Res 47:D442–D450. 10.1093/nar/gky1106. [DOI] [PMC free article] [PubMed] [Google Scholar]
Associated Data
This section collects any data citations, data availability statements, or supplementary materials included in this article.
Supplementary Materials
Tables S1 to S7. Download iai.00499-22-s0001.xlsx, XLSX file, 2.3 MB (2.4MB, xlsx)
Fig. S1 and S2 and list of supplemental tables. Download iai.00499-22-s0002.pdf, PDF file, 0.2 MB (165.3KB, pdf)
Data Availability Statement
The mass spectrometry proteomics data have been deposited in the ProteomeXchange Consortium (http://proteomecentral.proteomexchange.org) via the PRIDE partner repository (51) with the data set identifier PXD038436, including the mass spectrometer output files (.raw) and peptide identification files (.pepXML).