

Abstract
Background and aim
Existing real-time reverse transcriptase PCR (RT-qPCR) has certain limitations for the point-of-care detection of severe acute respiratory syndrome coronavirus 2 (SARS-CoV-2) since it requires sophisticated instruments, reagents and skilled laboratory personnel. In this study, we evaluated an assay termed the reverse transcriptase-polymerase spiral reaction (RT-PSR) for rapid and visual detection of SARS-CoV-2.
Methods
The RT-PSR assay was optimized using RdRp gene and evaluated for the detection of SARS-CoV-2. The time of 60min and a temperature of 63°C was optimized for targeting the RNA-dependent RNA polymerase gene of SARS-CoV-2. The sensitivity of the assay was evaluated by diluting the in-vitro transcribed RNA, which amplifies as low as ten copies.
Results
The specific primers designed for this assay showed 100% specificity and did not react when tested with other lung infection-causing viruses and bacteria. The optimized assay was validated with 190 clinical samples in two phases, using automated RTPCR based TrueNat test, and the results were comparable.
Conclusions
The RT-PSR assay can be considered for rapid and sensitive detection of SARS-CoV-2, particularly in resource-limited settings. To our knowledge, there is as yet no RT-PSR-based kit developed for SARS-CoV-2.
Keywords: COVID-19, RT-PSR, SARS-CoV-2, Coronavirus detection, TrueNat test
1. Introduction
Severe acute respiratory syndrome coronavirus 2 (SARS-CoV-2), is a novel coronavirus, the causative agent of coronavirus disease 2019 (COVID-19). It is a single-stranded positive-sense RNA (+ssRNA) virus belonging to the genus β-coronavirus [1]. The genome of the virus codes for four structural proteins, the spike (S) protein, nucleocapsid (N) protein, membrane “matrix” (M) protein, and envelope (E) proteins [2]. SARS-CoV-2 is aerosol borne and can spread from person to person mainly through respiratory droplets. Infected persons may be asymptomatic, and yet shed the virus. Early diagnosis is crucial to combat COVID-19, for which the availability of tools for rapid detection of the virus holds the key. The nucleic acid amplification tests (NAAT, such as probe-based reverse transcriptase (RT) - real-time polymerase chain reaction (PCR) (RT-qPCR), are considered the gold standard globally for the detection of SARS-CoV-2 [3], [4], [5], [6], [7]. The assay is accepted globally as it has a high level of sensitivity and offers a low limit of detection (LOD). However, performing RT-qPCR requires sophisticated equipment, the Real-Time PCR machine, coupled with high-quality reagents, and skilled laboratory personnel, all of which contribute to it being cost-intensive [8]. In addition, the turnaround time is more. Additionally, a low viral concentration limits the effectiveness of the test [9]. Hence, there is a need for an alternative rapid, portable, and affordable NAAT-based point-of-care assay to detect SARS-CoV-2.
Unlike the PCR-based method, isothermal amplification is relatively simple, in that it rapidly amplifies the nucleic acids at a constant temperature without the need for a programmable thermocycler [10]. The continuous search for novel isothermal amplification techniques has contributed to the development of reverse transcriptase-polymerase spiral reaction (RT-PSR) as a diagnostic assay that does not require sophisticated equipment [11].
The RT-PSR nucleic acid amplification is carried out with 1–2 pairs of primers, a strand displacing DNA polymerase enzyme, and reverse transcriptase enzyme. This technique can be performed using a simple dry bath without the need for a thermal cycler. The validation of the assay using clinical swab samples from COVID-19 patients showed this assay to be highly sensitive, specific [12], and one which can lend itself as a POC test of high utility through low cost. We developed and optimized the reaction conditions of RT-PSR assay for the detection of SARS-CoV-2 that can be sensitive, specific, and detected visually. Further, the assay was independently validated with clinical samples and compared with automated RT-PCR based TrueNat test results.
2. Material and methods
2.1. Ethical and bio-safety statement
Ethical approval for the study was taken by the Central Ethics Committee, Nitte (Deemed to be University), and Madras Medical Mission, Chennai, India. The biosafety approval was taken from the Institutional Biosafety Committee (IBSC), Nitte (Deemed to be University).
2.2. Primer designing for RT-PSR assay
The RNA-dependent RNA polymerase gene (RdRp) sequence of SARS-CoV-2 was retrieved from the NCBI GenBank database. The obtained sequences were subjected to multiple sequence alignment (MSA) tool MultAlin to find the conserved regions in each gene. Primers for RT-PSR were designed using the Primer3Plus software. The best pair was selected as forward and reverse primers (PS-F & PS-R) for the assay, and an unrelated sequence from a plant source was linked to it. To amplify the target gene, an extra pair of primers were designed using Primer3Plus software as auxiliary accelerated outer primers (PS-OF & PS-OR). Sequence of primers used for the test is listed in Table.1 .
Table 1.
List of primers used in this study.
| Primer name | Sequence (5′--3′) | Purpose | Reference |
|---|---|---|---|
| RdRp-F | ATGGCCTCACTTGTTCTTGC | For PCR assay | This study |
| RdRp-R | GGCCCCTAGGATTCTTGATG | ||
| RdRp- T7F | TAATACGACTCACTATAGGGATGGCCTCA CTTGTTCTTGC | For in-vitro RNA synthesis | This study |
| RdRp-PS-F | ACGAATTCGTACATAGAAGTATAGGTAGCTTGT CACACCGTT | For RT-PSR assay | This study |
| RdRp-PS-R | GATATGAAGATACATGCTTAAGCAGCATTAACA TTGGCCGTG | ||
| RdRp-PS-OF | TCTGACGATGCTGTTGTGTGT | ||
| RdRp-PS-OR | CAGTCTCAGTCCAACATTTTGC |
2.3. SARS-CoV-2 and RNA extraction
Lysed SARS-CoV-2 samples with protocol were kindly provided by the National Institute of Virology, Pune. Viral RNA was extracted using QIAampviral RNA extraction kit (Qiagen, Germany) and the concentration was measured using Nanophotometer®NP80 (Implen, Germany) and stored at −80°C deep freezer (Panasonic, Japan) for further use.
2.4. Ligation and transformation of the target gene
RT-PCR was performed by a One-step RT-PCR Kit (Qiagen, Germany) using gene-specific primers and the extracted viral RNA. The amplified products were purified using the QIAquick PCR purification kit (Qiagen, Germany). The RdRp gene was further ligated to pDrive vector using a Quick-start QIAGEN PCR cloning kit (Qiagen, Germany). Competent cells of E. coli DH5α were used to transform the ligated product by heat shock method and confirmed by blue-white screening followed by colony PCR using gene/vector-specific primers. Plasmid DNA was then extracted from the positive clones using the QIAprep Spin Miniprep kit (Qiagen, Germany)and Sanger sequencing was performed (M/S Eurofins Genomics India Pvt ltd., India). The sequences obtained were analyzed using various bioinformatics tools and the integrity of the gene was confirmed.
2.5. In-vitro RNA synthesis
The PCR of the target sequence was performed using a T7 promoter containing forward primer and gene-specific reverse primer and the product was used for in-vitro RNA synthesis with HiScribe™ T7 quick high yield RNA synthesis kit (New England BioLabs, USA). The RNA obtained was purified using a Monarch® RNA cleanup kit (New England BioLabs, USA) and the presence was confirmed by treating it with RNase A (New England BioLabs, USA) followed by agarose gel electrophoresis. Purified RNA was stored at –80°C (Panasonic, Japan) for further use. The concentration and purity of the in-vitro transcribed RNA were estimated using Nanophotometer® NP80 (Implen, Germany).
2.6. Optimization of RT-PSR for the detection of SARS-CoV-2
In-vitro transcribed SARS-CoV-2 RNA was used for the optimization of the RT-PSR assay (Fig. 1 ). The temperature was optimized considering 60℃, 63℃, and 65℃. Likewise, the assay time was optimized by considering 15 min, 30 min, 45 min, and 60 min time points. The requirement of magnesium sulphate was also optimized using varying concentrations. The assay was optimized in a microcentrifuge tube using 25 µl of reaction mixture comprising 1.6 µM each of forward and reverse primers (FP and RP), 0.2 µM each of outer primers (OF and OR), 2.5 µl of 10X isothermal amplification buffer, 1.6 M betaine (Sigma-Aldrich, USA), 4 mM magnesium sulphate, 1.4 mM of each of the four dNTPs, 0.8 µl WarmStart® RTx Reverse Transcriptase (NewEngland BioLabs, USA), and 1 μl Bst 2.0 DNA Polymerase (New England BioLabs, USA). Two microliters of in-vitro synthesized RNA were used as the template for the reaction.
Fig. 1.

Schematic representation of workflow for the detection of SARS-CoV-2 using RT-PSR assay targeting RdRp gene.
2.7. Visual detection of the amplicons and agarose gel electrophoresis
Visual detection of the amplicon was based on an enzymatic reaction using hydroxynapthol blue (HNB) dye at a concentration of 120 µM in the 25 µl reaction mixture [13]. The change in colour of the reaction mixture from dark blue to sky blue was considered positive. Further confirmation was by agarose gel electrophoresis, gel being stained with ethidium bromide (0.5 μg/ml) and visualized using a gel documentation system (Gel Doc XR+, Bio-Rad, USA).
2.8. Sensitivity test for RT-PSR assay
The sensitivity test was performed by diluting the in-vitro synthesized RdRp RNA to yield varying concentrations (5 ng/µl, 25 ng/µl, 50 ng/µl, and 200 ng/µl), which served as a template for the RT-PSR assay. Further, the analytical sensitivity of RT-PSR assay was performed by serially diluting the in-vitro synthesized RdRp RNA to contain varying RNA copy numbers (from 2.65 x10 11 to 2.65 × 1 copies of RNA).
2.9. Specificity test for RT-PSR assay
The specificity assay was performed using both in-vitro and in-silico analysis. For in-silico analysis, sequences of SARS-CoV-2 reference genome (Wuhan City, Hubei, 2019–12-26, GenBank ID MN908947), other SARS-CoV-2 emerging sequence variants from around the world, other coronaviruses and related RNA viruses were retrieved from NCBI GenBank and GISAID (global initiative on sharing all influenza data EpiFlu database). The MSA analysis was performed against the RT-PSR primer sequences using the bioinformatics software Geneious (https://www.geneious.com/) to check for any mismatches. In-vitro specificity test was performed using RNA sample of influenza virus and other bacterial infectious agents causing lung infection such as Burkholderia cepacia (ATCC 25416), Mycobacterium marinum (ATCC 11565), Acinetobacter baumannii (ATCC 19606) and Pseudomonas aeruginosa (Lab isolate, NUCSER).
2.10. Internal validation of RT-PSR with clinical samples
The developed RT-PSR assay was validated in two phases, with clinical samples (nasopharyngeal swab samples) at the tertiary care hospital, Madras Medical Mission, Chennai, India. During the first phase, 90 random clinical samples were selected, of which 60 were positive and 30 were negative based on TrueNat test results. The positive samples comprised 36 that were collected in July and August 2021 (stored samples) and 24 were collected in September and October 2021 (freshly collected samples). All the 30 negative samples were collected during October 2021 and validation study was performed by the end of October 2021. During the second phase, 100 samples were collected in January 2022, of which 80 were positive and 20 negative by TrueNat. All the samples were validated at the end of January 2022. The total viral RNA was extracted from the samples using the High Pure Viral RNA kit (Roche, Switzerland) as per the manufacturer’s instructions, for use as template and results of RT-PSR correlated with that of TrueNat (Table 2 ).
Table 2.
The results of first and second phases of clinical sample validation.
| Phase of clinical sample validation | Period of sample collection | TrueNat positive samples |
TrueNat negative samples |
||||
|---|---|---|---|---|---|---|---|
| Total positive samples | True positive by RT-PSR |
True positive sample for RT-PSR (%) | Total negative samples | True negative by RT-PSR |
True negative for RT-PSR (%) |
||
| First phase | July-August 2021 | 36 | 28* | 77 % | – | – | – |
| September-October 2021 | 24 | 23‘ns’ | 95.8 % | 30 | 29‘ns’ | 96 % | |
| Second phase | January 2022 | 80 | 75* | 93.7 % | 20 | 20‘ns’ | 100 % |
*Significant difference in RT-PSR results in comparison to TrueNat test.
‘ns’No significant difference in RT-PSR results in comparison to TrueNat test.
2.11. Statistical analysis
The two-sample proportion test with a significance of p < 0.05 was used to assess the significant difference between the RT-PSR assay and the TrueNat test and was calculated using online software, Mathcracker. The graphs were generated using Prism version 5.0 software (Graph Pad, Inc., La Jolla, USA).
3. Results
3.1. Cloning and in-vitro transcription of SARS-CoV-2gene
The sequence and MSA analysis showed a 100 % match between all the aligned sequences with the primer sequence. The RNA concentration obtained for the RdRp target was > 450 ng/µl. Treatment of RNA with RNase resulted in detection of no band in electrophoresis study, whereas all the untreated RNA showed a band in the gel.
3.2. Optimization of RT-PSR assay to amplify RdRp gene
Four primers (FP, BP, OFP, ORP) were designed to target RdRp gene. The optimized temperature and time for the assay were found to be 63°C and 60 min, respectively. The HNB dye at a concentration of 120 µM showed a colour change from dark blue to sky blue in positive samples and no change in negative samples (Fig. 2 ).
Fig. 2.
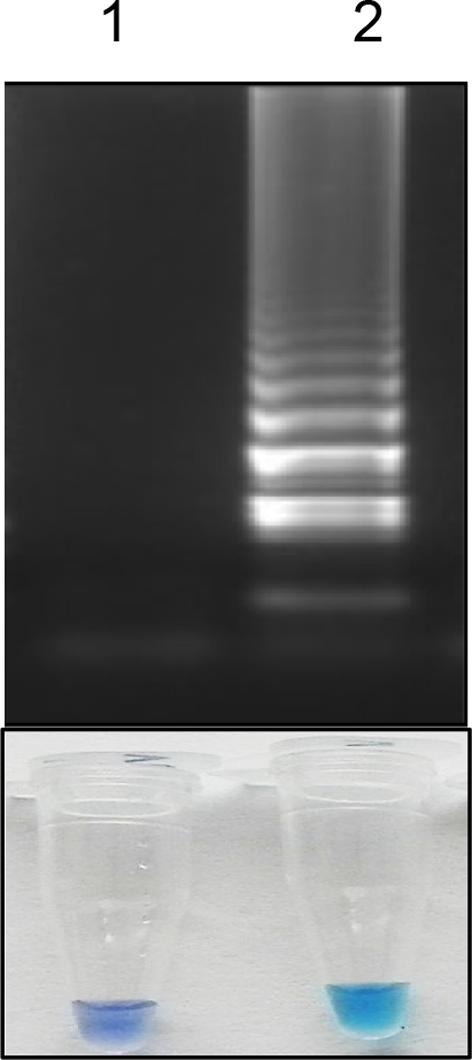
A representative image showing the visual detection of RT-PSR amplified product followed by agarose gel electrophoresis analysis. Lane 1: Non template control; Lane 2: Positive control (in-vitro synthesized RNA).
3.3. Sensitivity test for RT-PSR assay
The RT-PSR assay sensitivity was evaluated by agarose gel electrophoresis and HNB dye-based visual detection. Ten-fold serial dilutions of the in-vitro transcribed viral RNA ranging from 2.65 × 10¹¹ to 2.65 x10 copies could be detected (Fig. 3 ). The lowest concentration of RNA at which the RdRp gene target showed amplification was 5 ng/ µl RNA.
Fig. 3.

Optimization of temperature, sensitivity, specificity of RT-PSR assay. A. Temperature optimization using visual detection followed by 2 % agarose gel analysis of RT-PSR assay. Lane 1: Non template control; Lane 2: Amplification at 60 °C for 60 min; Lane 3: Amplification at 63 °C for 60 min, Lane 4: Amplification at 65 °C for 60 min. B. Determination of sensitivity of RT-PSR assay using visual detection followed by 2 % agarose gel analysis. Figure showing the amplification using different RNA concentration for RdRp gene (expressed in copy number). Lane 1: Non template control, Lane 2: 2.65 × 10¹¹ RNA copies; Lane 3: 2.65 × 10⁴ RNA copies; Lane 4: 2.65 × 10³ RNA copies; Lane 5: 2.65 × 10² RNA copies; Lane 6: 2.65 × 10 RNA copies. C. Determination of specificity using visual detection followed by 2 % agarose gel analysis. Lane 1: Non template control; Lane 2: In-vitro RNA (positive control); Lane 3: Influenza virus; Lane 4: B. cepacia; Lane 5: M. marinum; Lane 6: A. baumannii and Lane 7: P. aeruginosa.
3.4. Specificity test for RT-PSR assay
The in-silico analysis for the RT-PSR primers revealed high specificity to the SARS-CoV-2 and its variants. For the primer, no mismatch with SARS-CoV-2 sequences from the world database was recorded, while 100 % mismatch was seen with other coronavirus, and other related RNA virus sequences included for the analysis. No amplification was observed for influenza virus and lung infection, causing bacterial pathogens like B. cepacia, M. marinum, A. baumannii, and P. aeruginosa (Fig. 3).
3.5. Clinical validation of RT-PSR assay
The two-sample Z test statistical analysis was applied with the validated TrueNat test used by Madras Medical Mission, as the reference method. In the first phase of clinical validation, 52 samples (87 %) showed amplification using RT-PSR assay, which included 29 old positive stored samples (80.5 %) and 23 (95 %) fresh positive samples. The 29 (97 %) negative samples did not amplify, by visual detection or gel electrophoresis (Fig. 4 ). Likewise, during the second phase, 75 samples (93.7 %) showed amplification for the RdRp gene. All 20 (100 %) true negative samples showed no amplification, either by visual observation or by gel electrophoresis.
Fig. 4.

Results of internal clinical validation of the optimized RT-PSR assay. A, and B: Visual detection of amplicons followed by agarose gel analysis of clinical samples for first and second phase, respectively. A1: Lane 1: Non template control, Lane 2: Positive control (in-vitro synthesized RNA), Lanes 3–7: Samples showing amplifications. A2: Lane 1: Non template control, Lane 2: Positive control (in-vitro synthesized RNA), Lanes 3–7: Samples showing no amplifications. B1: Lane 1: Non template control, Lane 2: Positive control (in-vitro synthesized RNA), Lanes 3–7: Samples showing amplifications. B2: Lane 1: Non template control, Lane 2: Positive control (in-vitro synthesized RNA), Lanes 3–7: Samples showing no amplifications. C. Results for first phase of sample validation compared to TrueNat confirmed old positive (80.5 %), new positive (95.8 %) and negative (96.6 %). D. Results for second phase of clinical validation compared to TrueNat confirmed positive (93.7 %) and negative (100 %) samples. E. Comparison of results between TrueNat and RT-PSR assay for first phase sample validations. ‘*’ indicates Significant difference between RT-PSR and TrueNat (p = <0.05). ‘ns’ No significant difference between RT-PSR and TrueNat assay (p = >0.05); F. Comparison of results between TrueNat and RT-PSR assay for second phase sample validation. ‘*’ indicates Significant difference between RT-PSR and TrueNat (p = <0.05). ‘ns’ No significant difference between RT-PSR and TrueNat assay (p = >0.05).
4. Discussion
The pandemic due to SARS-CoV-2 has caused an unprecedented situation globally for health and the economy [14]. The development and application of highly specific, rapid and sensitive point-of-care diagnostics for timely detection and contact tracing have been considered most important tool as of now [15], [16]. Although the gold standard RT-qPCR is highly sensitive and specific, there are some limitations, such as the need for sophisticated equipments, skilled research personnel, complex protocol and long waiting time [6], [17]. In this study, we developed, optimized and evaluated the suitability of a colorimetric RT-PSR assay for the detection of SARS-CoV-2 without compromising on the specificity, sensitivity and rapidity. To the best of our knowledge, this is the first study on the use of RT-PSR for the detection of SARS-CoV-2 with the attributes mentioned above.
In the initial phase of development of RT-PSR, we designed and tested primers targeting the various SARS-CoV-2 genes like nucleocapsid, spike, envelope, and RdRp genes. However, it was observed that RdRp gene primer worked the best for this assay. An additional feature with regard to RdRp gene was its highly conserved nature [18]. As compared to other isothermal amplification-based assays, such as loop-mediated isothermal amplification (LAMP), the primer design for RT-PSR assay is far simpler [9], [11] and offers greater detection efficiency [19], [20]. Further, the assay has been optimized using HNB dye for the visual detection of the amplification product [21]. During the amplification, the insoluble magnesium pyrophosphate products formed at the end of the isothermal amplification facilitate the direct visual determination of the result for a given reaction because of the dye complex, resulting in an easy to read coloured format for a POC test [22].
Previous studies on porcine epidemic diarrhoea virus, canine parvovirus 2 and coxsackie virus have shown RT-PSR assay to be highly sensitive with an ability to amplify even a single copy of RNA [12], [23], [24]. This study also reflected the high sensitivity of the test with the ability to amplify RNA as low as 5 ng/μL. The limit of detection in terms of copy numbers was as low as ten copies of RNA. The in-silico analysis demonstrated the specificity of the primer for the detection of SARS-CoV-2. The primer binding region was highly conserved and specific with ability to detect all the major variants of the virus. Further, the assay was specific as, influenza virus and other respiratory infection-causing bacterial species showed no cross-reactivity with the PSR primers. This was further confirmed by our observation that all TrueNAT negative clinical samples were negative in this assay.
The key feature of the assay relates to the short time and isothermal temperature of 63°C for about 60 min, significantly reducing the clinical testing time, thus making it faster than RT-qPCR. Additionally, the reaction results can be determined visually by the colour change, without the need for fluorescent probes, making it simple and cost-effective. The practicability of the developed RT-PSR assay was validated using clinical samples and compared with the widely accepted TrueNat test results. In the first phase of clinical samples received and tested during July-October 2021, the sample positivity rate was low (87 %) for the stored samples. There were also few false-negative results by RT-PSR obtained for true-positive (TrueNat positive) samples. Interestingly, majority of these samples were relatively old samples stored at −80°C (collected during July and August 2021). However, no false-negative result was obtained in the samples collected during September-October 2021. We summarise that the false-negative results of old stored true positive samples to be due to the degradation of the sample during the storage period. Likewise, during the second testing phase, a total of 75 samples (93.7 %) showed amplification for the RdRp gene. All the 20 (100 %) true negative samples showed no amplification when results were read both visually and by gel electrophoresis. In the second phase of sample validation, we tried to address the issue of false-negative result that was observed during the first phase. For this, 100 fresh samples were selected based on TrueNat test results (collected and tested end of January 2022). The RT-PSR assay results were comparable with TrueNat results. The RT-PSR assay targeting the RdRp gene showed amplification for 94 % of samples that were positive by TrueNat and 100 % of true-negative samples did not show any amplification. We conclude that the RT-PSR assay results are comparable with TrueNat test results and can be a point-of-care diagnostic assay for detecting SARS-CoV-2 in a low-resource setting with the cardinal features of specificity, sensitivity, rapidity and affordability.
Author contributions
SP and PA performed experiments, interpreted the results, analyzed the data, and wrote the manuscript. KPA performed experiments. VSP performed experiments. KSP and AN sample validated and analyzed the data. PR designed the experiments, supervised, and reviewed the manuscript. AR sample validated, provided resources, and reviewed the manuscript. IK and IK conceptualized, supervised, and reviewed the manuscript. BM conceptualized, designed the experiments, supervised, provided funds and resources, and reviewed the manuscript.
Data availability
Data will be made available on request.
Declaration of Competing Interest
The authors declare that they have no known competing financial interests or personal relationships that could have appeared to influence the work reported in this paper.
Acknowledgments
This study was supported by the Science and Engineering Research Board (SERB), DST-Government of India, through the COVID-19 project (CVD/2020/000150).
Data availability
Data will be made available on request.
References
- 1.Raj V.S., Osterhaus A.D., Fouchier R.A., Haagmans B.L. MERS: emergence of a novel human coronavirus. Curr. Opin. Virol. 2014;5:58–62. doi: 10.1016/j.coviro.2014.01.010. [DOI] [PMC free article] [PubMed] [Google Scholar]
- 2.Mariano G., Farthing R.J., Lale-Farjat S.L., Bergeron J.R. Structural characterization of SARS-CoV-2: Where we are, and where we need to be. Front. Mol. Biosci. 2020;7 doi: 10.3389/fmolb.2020.605236. [DOI] [PMC free article] [PubMed] [Google Scholar]
- 3.Dhama K., Khan S., Tiwari R., Sircar S., Bhat S., Malik Y.S., Singh K.P., Chaicumpa W., Bonilla-Aldana D.K., Rodriguez-Morales A.J. Coronavirus disease 2019–COVID-19. Clin. Microbiol. Rev. 2020;33:e00028–e120. doi: 10.1128/CMR.00028-20. [DOI] [PMC free article] [PubMed] [Google Scholar]
- 4.Yüce M., Filiztekin E., Özkaya K.G. COVID-19 diagnosis—a review of current methods. Biosens. Bioelectron. 2021;72 doi: 10.1016/j.bios.2020.112752. [DOI] [PMC free article] [PubMed] [Google Scholar]
- 5.Islam K.U., Iqbal J. An update on molecular diagnostics for COVID-19. Front. Cell Infect. Microbiol. 2020;10 doi: 10.3389/fcimb.2020.560616. [DOI] [PMC free article] [PubMed] [Google Scholar]
- 6.Rai P., Kumar B.K., Kumar D.V., Kumar P., Kumar A., Shetty S.K., Maiti B. In: COVID-19: From Bench to Bedside. Barh D., Lundstrom K., editors. CRC Press; 2022. The Evolution of COVID-19 Diagnostics. 9781000510126. [Google Scholar]
- 7.Rai P., Kumar B.K., Deekshit V.K., Karunasagar I., Karunasagar I. Detection technologies and recent developments in the diagnosis of COVID-19 infection. Appl. Microbiol. Biotechnol. 2021;105:441–455. doi: 10.1007/s00253-020-11061-5. [DOI] [PMC free article] [PubMed] [Google Scholar]
- 8.Xu W., Gao J., Zheng H., Yuan C., Hou J., Zhang L., Wang G. Establishment and application of polymerase spiral reaction amplification for Salmonella detection in food. J Microbiol Biotechnol. 2019;29:1543–1552. doi: 10.4014/jmb.1906.06027. [DOI] [PubMed] [Google Scholar]
- 9.Sethuraman N., Jeremiah S.S., Ryo A. Interpreting diagnostic tests for SARS-CoV-2. JAMA. 2020;323:2249–2251. doi: 10.1001/jama.2020.8259. [DOI] [PubMed] [Google Scholar]
- 10.Zhao Y., Chen F., Li Q., Wang L., Fan C. Isothermal amplification of nucleic acids. Chem. Rev. 2015;115:12491–12545. doi: 10.1021/acs.chemrev.5b00428. [DOI] [PubMed] [Google Scholar]
- 11.Liu W., Dong D., Yang Z., Zou D., Chen Z., Yuan J., Huang L. Polymerase spiral reaction (PSR): A novel isothermal nucleic acid amplification method. Sci. Rep. 2015;5:1–8. doi: 10.1038/srep12723. [DOI] [PMC free article] [PubMed] [Google Scholar] [Retracted]
- 12.Maiti B., Anupama K.P., Rai P., Karunasagar I., Karunasagar I. Isothermal amplification-based assays for rapid and sensitive detection of severe acute respiratory syndrome coronavirus 2: Opportunities and recent developments. J Med. Virol. 2022;32:e2274. doi: 10.1002/rmv.2274. [DOI] [PMC free article] [PubMed] [Google Scholar]
- 13.Anupama K.P., Nayak A., Karunasagar I., Maiti B. Rapid visual detection of Vibrio parahaemolyticus in seafood samples by loop-mediated isothermal amplification with hydroxynaphthol blue dye. World J Microbiol. Biotechnol. 2020;36:1. doi: 10.1007/s11274-020-02851-0. [DOI] [PubMed] [Google Scholar]
- 14.Riley W.T., Borja S.E., Hooper M.W., Lei M., Spotts E.L., Phillips J.W., Gordon J.A., Hodes R.J., Lauer M.S., Schwetz T.A., Perez-Stable E. National Institutes of Health social and behavioral research in response to the SARS-CoV2 Pandemic. Transl. Behav. Med. 2020;10:857–861. doi: 10.1093/tbm/ibaa075. [DOI] [PMC free article] [PubMed] [Google Scholar]
- 15.Hellewell J., Abbott S., Gimma A., Bosse N.I., Jarvis C.I., Russell T.W., Munday J.D., Kucharski A.J., Edmunds W.J., Funk S., Eggo R.M., Sun F., Flasche S., Quilty B.J., Davies N., Liu Y., Clifford S., Klepac P., Jit M., Diamond C., Gibbs H., van Zandvoort K. Feasibility of controlling COVID-19 outbreaks by isolation of cases and contacts. Lancet Glob. Health. 2020;8(4):e488–e496. doi: 10.1016/S2214-109X(20)30074-7. [DOI] [PMC free article] [PubMed] [Google Scholar]
- 16.Younes N., Al-Sadeq D.W., Al-Jighefee H., Younes S., Al-Jamal O., Daas H.I., Yassine H., Nasrallah G.K. Challenges in laboratory diagnosis of the novel coronavirus SARS-CoV-2. Viruses. 2020;12:582. doi: 10.3390/v12060582. [DOI] [PMC free article] [PubMed] [Google Scholar]
- 17.Dramé M., Teguo M.T., Proye E., Hequet F., Hentzien M., Kanagaratnam L., Godaert L. Should RT-PCR be considered a gold standard in the diagnosis of Covid-19? J Med. Virol. 2020;92:2312–2313. doi: 10.1002/jmv.25996. [DOI] [PMC free article] [PubMed] [Google Scholar]
- 18.Nawattanapaiboon K., Pasomsub E., Prombun P., Wongbunmak A., Jenjitwanich A., Mahasupachai P., Vetcho P., Chayrach C., Manatjaroenlap N., Samphaongern C., Watthanachockchai T. Colorimetric reverse transcription loop-mediated isothermal amplification (RT-LAMP) as a visual diagnostic platform for the detection of the emerging coronavirus SARS-CoV-2. Analyst. 2021;146:471–477. doi: 10.1039/d0an01775b. [DOI] [PubMed] [Google Scholar]
- 19.Milton A.A., Momin K.M., Ghatak S., Thomas S.C., Priya G.B., Angappan M., Das S., Sanjukta R.K., Puro K., Shakuntala I., Sen A. Development of a novel polymerase spiral reaction (PSR) assay for rapid and visual detection of Staphylococcus aureus in meat. LWT. 2021;139 doi: 10.1016/j.heliyon.2021.e05941. [DOI] [PMC free article] [PubMed] [Google Scholar]
- 20.A.A. Milton, K.M. Momin, S. Ghatak, G.B. Priya, M. Angappan, S. Das, K. Puro, R.K. Sanjukta, I. Shakuntala, A. Sen, B.K. Kandpal, Development of a novel polymerase spiral reaction (PSR) assay for rapid and visual detection of Clostridium perfringens in meat. Heliyon 7 (2021) e05941. [DOI] [PMC free article] [PubMed]
- 21.Goto M., Honda E., Ogura A., Nomoto A., Hanaki K.I. Colorimetric detection of loop-mediated isothermal amplification reaction by using hydroxy naphthol blue. Biotechniques. 2009;46:167–172. doi: 10.2144/000113072. [DOI] [PubMed] [Google Scholar]
- 22.Mori Y., Nagamine K., Tomita N., Notomi T. Detection of loop-mediated isothermal amplification reaction by turbidity derived from magnesium pyrophosphate formation. Biochem. Biophys. Res. Commun. 2001;289:150–154. doi: 10.1006/bbrc.2001.5921. [DOI] [PubMed] [Google Scholar]
- 23.Wang X., Xu X., Hu W., Zuo K., Li Z., Kan Y., Yao L., Ji J., Bi Y. Visual detection of porcine epidemic diarrhea virus using a novel reverse transcription polymerase spiral reaction method. BMC Vet. Res. 2019;15:1–7. doi: 10.1186/s12917-019-1851-7. [DOI] [PMC free article] [PubMed] [Google Scholar]
- 24.He S., Huang Y., Zhao Y., Pang B., Wang L., Sun L., Yu H., Wang J., Li J., Song X., Li H. A reverse transcription-polymerase spiral reaction (RT- PSR)-based rapid coxsackievirus A16 detection method and its application in the clinical diagnosis of hand, foot, and mouth disease. Front. Microbiol. 2020;11:734. doi: 10.3389/fmicb.2020.00734. [DOI] [PMC free article] [PubMed] [Google Scholar]
Associated Data
This section collects any data citations, data availability statements, or supplementary materials included in this article.
Data Availability Statement
Data will be made available on request.
Data will be made available on request.