

Abstract
Objective:
Our study examines the association between social vulnerability index (SVI1) and pharmacotherapy initiation for gestational diabetes mellitus (GDM2).
Methods:
We studied a retrospective cohort of pregnant patients with GDM, enrolled in Tennessee Medicaid, who gave birth between 2007–2019. Enrollment files were linked to birth and death certificates, state hospitalization registries, and pharmacy claims. SVI, measured at the community level and determined by residential census tract, ranged from 0 to 100 (low to high vulnerability). Multivariable logistic regression assessed the association between SVI and the odds of initiating the most common pharmacotherapies for GDM – insulin, glyburide, or metformin – and adjusted for relevant covariates. SVI was modeled with restricted cubic splines to account for non-linear associations, using the median Tennessee SVI as a reference. Secondary analysis assessed associations with the SVI subthemes.
Results:
Among 33,291 GDM patients, 21.7% (7,209) initiated pharmacotherapy during pregnancy. Patients from areas with higher SVI were more likely to be non-Hispanic Black with higher body mass index, while those with lower SVI were more likely to be nulliparous. Multivariable modeling demonstrated a complex non-linear association between SVI and GDM pharmacotherapy initiation, relative to the reference. Higher SVI was associated with elevated odds of GDM pharmacotherapy initiation (e.g., odds ratio 1.11 [95% CI 1.02–1.22] for SVI 80) and low to medium SVI had variable non-significant associations with GDM pharmacotherapy initiation, relative to the reference (lower odds of initiation for values 25–50, higher odds of initiation for values <25). Secondary analysis demonstrated a non-linear association between subtheme 3 and the odds of GDM pharmacotherapy initiation.
Conclusion:
Social vulnerability is associated with initiation of pharmacotherapy for GDM, highlighting the possible role of social determinants of health in achieving glycemic control.
Keywords: Social vulnerability index, gestational diabetes mellitus, insulin, glyburide, metformin, Medicaid, pharmacotherapy, retrospective cohort study, restricted cubic splines, logistic regression
INTRODUCTION
Gestational diabetes mellitus (GDM) affects approximately 8% of pregnant patients in the United States, with important consequences for maternal and fetal outcomes (Rochon et al., 2006). While the majority of patients manage GDM with diet and lifestyle modifications alone, up to one-third of patients need pharmacotherapy for glycemic control (Lende & Rijhsinghani, 2020). Factors associated with a higher chance of pharmacotherapy initiation include elevated pre-pregnancy body mass index (BMI), older maternal age, prediabetic hemoglobin A1c values, and higher fasting blood sugar (Eleftheriades et al., 2021; Meshel et al., 2016; Watanabe et al., 2016; Wong & Jalaludin, 2011). Nevertheless, in the largest study examining factors associated with pharmacotherapy initiation, only 9% of attributable risk could be explained by clinical factors alone (Pertot et al., 2011).
The Social Vulnerability Index (SVI) was developed by the Centers for Disease Control and Prevention (CDC) Agency for Toxic Substance and Disease Registry (ATSDR) and is defined by the characteristics of a community that affect their capacity to anticipate, confront, repair, and recover from the effects of hazardous events (Flanagan & Hallisey, 2018). Not only do the components of social vulnerability contribute to the inability of a community to fully recover in the wake of a disaster compared to communities that are less socially vulnerable, but they are also associated with individual risk for health disparities and adverse health outcomes (Biggs et al., 2020; Givens et al., 2021; Merkt et al., 2021).
While most studies have examined clinical or biochemical factors associated with pharmacotherapy initiation in GDM management, few have studied the role of social vulnerability (Camelo Castillo et al., 2014; Eleftheriades et al., 2021; Lende & Rijhsinghani, 2020). The diagnosis of GDM and management with lifestyle modifications demand substantial patient involvement in their care (e.g., improved diet and exercise, increased provider visits, and daily monitoring). Given these demands, we hypothesized that social vulnerability as measured by the SVI could play an important role in a patient’s need or a clinician’s decision to initiate pharmacotherapy. Therefore, we conducted this study to examine the association between social vulnerability and pharmacotherapy initiation in pregnant patients with GDM.
MATERIALS AND METHODS
Data source
We performed a retrospective cohort study of pregnant patients, with a diagnosis of GDM, enrolled in Tennessee Medicaid who gave birth between January 2007 and December 2019. The Tennessee Medicaid program (TennCare) provided coverage for over half of all annual births in the state of Tennessee. TennCare data included enrollment, healthcare encounter claims, and pharmacy files that were used to identify patient eligibility, health encounters, and records of filled prescriptions. TennCare data were supplemented with Tennessee vital records data (birth and death certificates) and the Tennessee Hospital Discharge Data System (a registry of all hospital-based encounters in Tennessee). The study was approved by the Vanderbilt University Medical Center’s Institutional Review Board (IRB #190068, approval date 1/18/2019), the Tennessee Department of Health (IRB #2019-0099, approval date 5/10/2021), and the Division of TennCare.
Study Population
We included pregnant patients between the ages of 15 and 44 years who were enrolled in TennCare by 14 weeks of gestation and gave birth in a Tennessee hospital between January 1, 2007 and December 31, 2019. GDM diagnosis was identified by coded diagnoses (ICD-9 code 648.8 and ICD-10 code O24.4) and required at least two outpatient diagnostic codes recorded on separate dates after the first trimester to improve accuracy of inclusion of patients with confirmed gestational diabetes. A patient could contribute more than one birth during the study period. We excluded patients who gave birth at birthing centers and those with evidence of type 2 diabetes either by diagnosis (ICD-9, ICD-10) or because of filled prescriptions for a hypoglycemic medication prior to GDM diagnosis. We also excluded patients with GDM who filled prescriptions for hypoglycemic medications other than insulin, glyburide, and metformin and those who filled more than one hypoglycemic medication at pharmacotherapy initiation for GDM.
Exposure
The primary exposure of interest was social vulnerability as measured by SVI (Flanagan & Hallisey, 2018), which captured information from 15 US census variables categorized under four main subthemes: socioeconomic condition, household composition and housing, transportation, and concentration of people belonging to minoritized groups and residents with limited English proficiency (See Appendix A). The State-based CDC/ATSDR SVI database ranked the social vulnerability of a census tract against all tracts within a particular state of interest. SVI data were retrieved from the US census survey and the American Community survey. For each tract, a percentile rank, defined as the proportion of census tracts that were equal to or lower than a tract of interest in terms of social vulnerability, was generated among all tracts for the 15 individual variables and the four subthemes (CDC, 2021). SVI was a composite scale derived from census tract level information as the overall percentile rank for each tract that ranges from 0 to 100, with higher values indicating greater vulnerability (CDC, 2021; Flanagan et al., 2011; Yee et al., 2019). For example, a CDC/ATSDR SVI State ranking of 50 was the median for the state and an SVI of 85 signified that 85% of tracts in the State were less vulnerable than the tract of interest and that 15% of tracts in the State were more vulnerable.
For our study, we defined SVI state percentile ranking at the census tract level based on Federal Information Processing System Codes derived from the patient residential address and used the SVI percentile ranking from the published data closest to the year of childbirth. SVI data were available for the years of 2000, 2010, 2014, 2016, 2018. For patients who gave birth in 2007–2012, 2013–2015, 2016–2017, and 2018–2019, we used the SVI percentile ranking from 2010, 2014, 2016, and 2018, respectively. The distribution of SVI percentile ranks in our study population was divided into SVI quintiles (Q) for descriptive characterization but modeled using restricted cubic splines in the regression model.
Outcome and Covariates
The primary study outcome was initiation of pharmacotherapy for GDM management, defined as filling a first prescription for either metformin, glyburide, or insulin during pregnancy. All short- and long-acting insulin formulations were included. We identified covariates a priori as potential confounders, including maternal age, pre-pregnancy BMI, parity, birth year, and gestational age at diagnosis of GDM. Given that race influences social vulnerability, and it is a factor assessed in the “minority status and language” subtheme of SVI (see Appendix A), it was not included as a separate covariate. We exclude observations with missing values (<5% overall) from the analysis as missing values for individual study covariates were rare.
Statistical analysis
We examined the association between SVI and GDM pharmacotherapy initiation using a multivariable logistic regression with robust standard errors while accounting for study covariates. SVI was modeled using restricted cubic splines with five knots at SVI percentile 13.7, 41.2, 63.1, 81.0, and 96.9, selected according to Harrell’s recommended percentiles (Harrell Jr., 2021). This model was used to obtain odds ratios and adjusted predicted probabilities (PPs) of initiating GDM pharmacotherapy at each observed value of SVI relative to the median state (Tennessee) SVI of 50, adjusting for covariates listed above. A secondary analysis was performed to assess the four subthemes of Social Vulnerability Index (see Appendix A) and the odds of initiating GDM pharmacotherapy. First, we examined the pairwise correlation coefficients between SVI and each SVI subtheme. Second, for each SVI subtheme, we used a multivariable logistic regression model using restricted cubic splines, relative to a reference SVI of 50 as described for the main model. Analyses were conducted using Stata 17 (StataCorp, College Station, TX).
RESULTS
Study population
We identified 33,291 pregnant patients with GDM (Figure 1), among whom 21.7% (7, 209) initiated pharmacotherapy in pregnancy. Average maternal age was 26.9 (SD 5.8) years and pre-pregnancy body mass index was 30.4 kg/m2 (SD 8.4). The distribution of SVI percentile ranks in our study population led to the following SVI quintiles: Q1 = SVI value of 0–33, Q2: SVI value of 34–53, Q3: SVI value of 54–71, Q4: SVI value of 72–87, and Q5: SVI value of 88–100 (see Appendix B). Individual-level patient characteristics are displayed according to these quintiles of SVI and are presented in Table 1.
FIGURE 1. Flow Diagram.
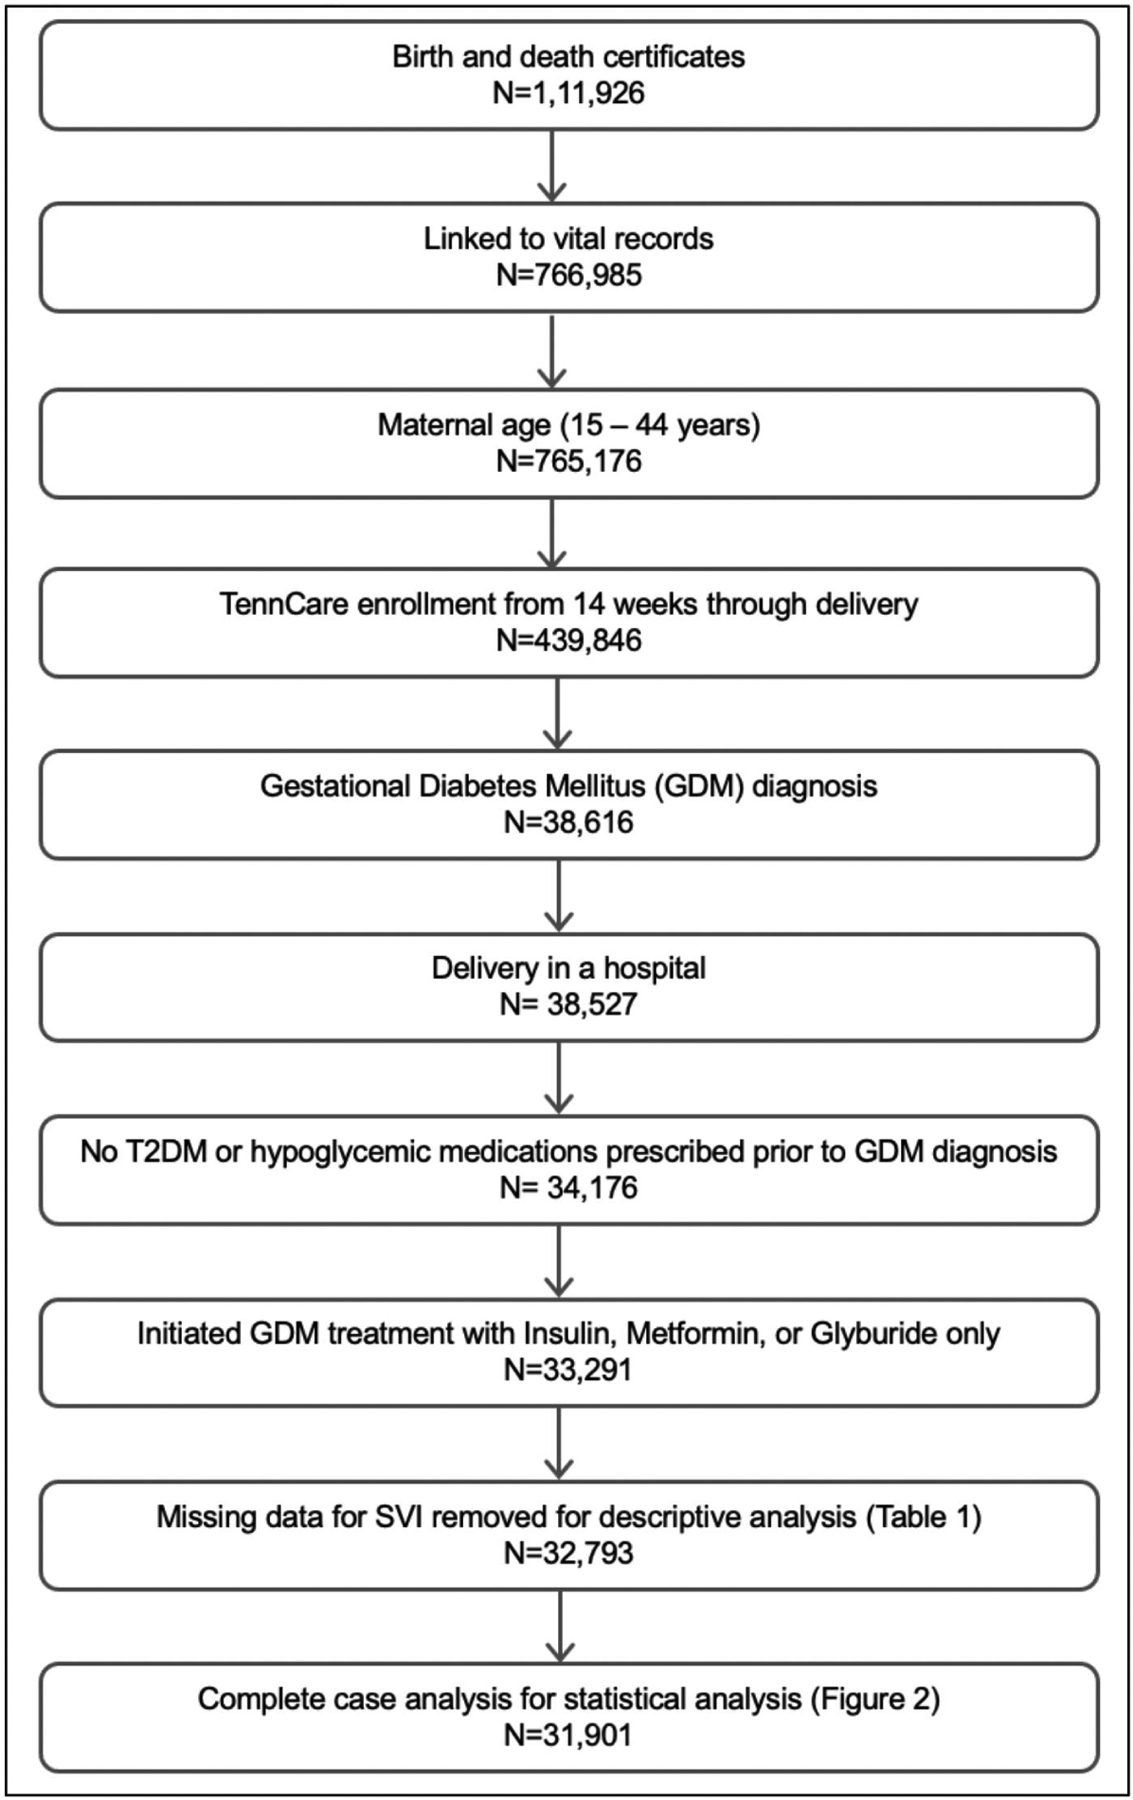
Flow diagram for our study population and complete case analysis.
Table 1:
Demographic and Clinical Characteristics by Social Vulnerability Index
| Individual characteristic | Social Vulnerability Index1 Quintiles2 | |||||
|---|---|---|---|---|---|---|
| Q1 | Q2 | Q3 | Q4 | Q5 | Total | |
| N=6,572 | N=6,570 | N=6,543 | N=6,560 | N=6,548 | N=32,7931 | |
| Maternal age (years) | 27.4 (5.9) | 26.9 (5.8) | 26.7 (5.7) | 26.8 (5.8) | 26.7 (5.8) | 26.9 (5.8) |
| 5,428 (83) | 5,371 (82) | 5,043 (77) | 4,323 (66) | 3,136 (48) | 23,301 (71) | |
| 689 (10) | 778 (12) | 1,052 (16) | 1,782 (27) | 2,916 (44) | 7,217 (22) | |
| 252 (4) | 261 (4) | 292 (4) | 307 (4) | 340 (5) | 1,452 (4) | |
| 147 (2) | 103 (2) | 93 (1) | 91 (1) | 100 (2) | 534 (2) | |
| Other | 56 (1) | 57 (1) | 63 (1) | 57 (1) | 56 (1) | 289 (1) |
| 2,240 (34) | 2,286 (35) | 2,201 (34) | 2,055 (31) | 1,880 (29) | 10,662 (33) | |
| 2,105 (32) | 2,111 (32) | 2,071 (32) | 2,039 (31) | 1,960 (30) | 10,286 (31) | |
| 1,296 (20) | 1,250 (19) | 1,273 (19) | 1,349 (21) | 1,338 (20) | 6,506 (20) | |
| 911 (14) | 905 (14) | 975 (15) | 1,089 (17) | 1,337 (20) | 5,217 (16) | |
| Missing | 20 (0) | 18 (0) | 23 (0) | 28 (0) | 33 (1) | 122 (0) |
| 29.8 (8.3) | 30.1 (8.3) | 30.3 (8.3) | 30.7 (8.5) | 31.3 (8.7) | 30.4 (8.4) | |
| Missing | 127 (2) | 145 (2) | 154 (2) | 168 (3) | 187 (2) | 781 (2) |
| Limited English proficiency, n (%) | 339 (5) | 319 (5) | 335 (5) | 363 (6) | 443 (7) | 1,799 (5) |
| 1,235 (19) | 1,229 (19) | 1,191 (18) | 1,278 (19) | 1,391 (21) | 6,324 (19) | |
| Missing | 13 (0) | 4 (0) | 6 (0) | 14 (0) | 13 (0) | 50 (0) |
| Chronic hypertension, n (%) | 557 (8) | 596 (9) | 619 (9) | 677 (10) | 708 (11) | 3,157 (10) |
| Distance from hospital (miles) | 9.8 (5.7–15.5) | 10.2 (5.4–19.1) | 11.0 (4.7–22.4) | 10.0 (3.7–22.0) | 5.5 (2.4–14.6) | 9.4 (4.2–18.9) |
| 28.3 (5.1) | 28.3 (5.1) | 28.6 (4.9) | 28.6 (5.1) | 28.5 (5.2) | 28.4 (5.1) | |
| 28.8 (4.6) | 28.9 (4.6) | 29.1 (4.5) | 29.2 (4.7) | 29.1 (4.8) | 29.0 (4.6) | |
| Pharmacotherapy only | 26.1 (6.0) | 25.9 (6.1) | 26.6 (5.8) | 26.4 (5.9) | 26.3 (6.1) | 26.3 (6.0) |
| Gestational age at pharmacotherapy initiation (weeks) | 29.6 (5.7) | 29.6 (5.7) | 29.9 (5.5) | 29.8 (5.6) | 29.8 (5.8) | 29.7 (5.6) |
| 1,389 (21) | 1,322 (20) | 1,411 (22) | 1,480 (23) | 1,501 (23) | 7,103 (22) | |
| 3108(5) | 290 (4) | 339 (5) | 371 (6) | 338 (5) | 1,665 (5) | |
| 581 (9) | 518 (8) | 597 (9) | 664 (10) | 687 (10) | 3,047 (9) | |
| 490 (7) | 514 (8) | 475 (7) | 445 (7) | 476 (7) | 2,400 (7) | |
| None | 5,038 (79) | 5,092 (80) | 5,050 (79) | 4,925 (78) | 4,924 (77) | 25,029 (78) |
Data are presented as mean (SD) or median (IQR) for continuous measures, and n (%) for categorical measures
Missing data for SVI (n=498) includes 1.5% of total study population (n=33,291), not included in this table
Quintiles (Q) of SVI determined by study population (Q1: 0–33, Q2: 34–53, Q3: 54–71, Q4: 72–87, and Q5: 88–100)
Any medication defined as insulin, glyburide, or metformin as single therapy
Compared to patients living in areas with the lowest SVI (Q1), patients living in areas with highest SVI (Q5) tended to be more likely to be non-Hispanic Black (Q5: 44% vs. Q1:10%), have a higher body mass index (Q5: 31.3 kg/m2 (SD 8.7) vs. Q1: 29.8 kg/m2 (SD 8.3)), have a diagnosis of chronic hypertension (Q5:11% vs. Q1: 8%), have had a prior cesarean birth (Q5: 21% vs. Q1: 19%), and be prescribed a medication (insulin, glyburide, or metformin) to treat GDM (Q5: 23% vs. Q1: 21%); they were less likely to be nulliparous (Q5: 29% vs. Q1: 34%).
Association between SVI and GDM pharmacotherapy initiation
We included 31, 910 pregnant patients in the multivariable logistic regression, excluding a small fraction of observations with missing data on relevant covariates (total: 1390 missing observations, 4.2%; SVI: 498 missing observations, 1.5%; parity: 126 missing observations, 0.4%; pre-pregnancy BMI: 498 missing observations, 1.5%; prior cesarean birth: 55 missing observations, 0.2%). In the multivariate logistic regression among 31,901 pregnant patients, we observed a non-linear association between SVI and initiation of pharmacotherapy for GDM. Relative to the reference SVI of 50, high SVI (>50) was associated with elevated odds of initiating pharmacotherapy for GDM management (see Figure 2 and Table 2, e.g., odds ratio 1.11 [95% CI 1.02–1.22] for SVI = 80). Conversely, for SVI values 0 to 20 we observed a non-significantly elevated odds of initiation compared to the SVI of 50 (see Table 2), while for SVI values 20 to 50 we observed a non-significantly lower odds of initiation (See Table 2).
FIGURE 2. Adjusted Odds Ratios of Initiating Pharmacotherapy for GDM Management.

Blue: adjusted odds ratio; Red: reference line; Gray bars: 95th % confidence interval Figure 2 represents the adjusted odds ratios for initiation of pharmacotherapy for GDM management by SVI from a logistic regression model using restricted cubic spline terms for SVI. Covariates identified a priori that were adjusted for in the model included maternal age, pre-pregnancy BMI, parity, birth year, and gestational age at diagnosis of GDM.
Table 2:
Adjusted Predicted Probabilities and Odds Ratios of Requiring Pharmacotherapy for GDM Management by SVI
| SVI1 percentile | Predicted Probability2 | PP2 Confidence Interval (95th %) | Adjusted Odds Ratio3 | aOR3 Confidence Interval (95th %) |
|---|---|---|---|---|
| 5 | 0.20 | 0.18 – 0.22 | 1.09 | 0.95 – 1.26 |
| 20 | 0.18 | 0.17 – 0.19 | 1.01 | 0.93 – 1.09 |
| 40 | 0.18 | 0.17 – 0.19 | 0.96 | 0.92 – 1.01 |
| 50 | 0.18 | 0.17 – 0.19 | 1.00 | Reference |
| 60 | 0.19 | 0.18 – 0.20 | 1.06 | 1.02 – 1.11 |
| 80 | 0.20 | 0.19 – 0.21 | 1.11 | 1.02 – 1.22 |
| 95 | 0.19 | 0.18 – 0.21 | 1.08 | 1.00 – 1.18 |
Bold is statistically significant
SVI: Social Vulnerability Index
Predicted probability (PPs) based on a population with the mean value for each continuous variables and with the most common value (typically zero) for each categorical variables included in the model
Adjusted odds ratio (aORs) relative to a reference of SVI 50, adjusted for covariates identified a priori
Secondary analyses explored associations between SVI subthemes and pharmacotherapy initiation. Subthemes 1 (socioeconomic status) and 4 (housing and transportation) were most highly correlated with overall SVI (pairwise correlation coefficients: subtheme 1 r = 0.86, subtheme 4 r = 0.79, compared to subtheme 2 r = 0.67 and subtheme 3 r = 0.43). However, when we applied a multivariable logistic regression model using restricted cubic splines, only the SVI subtheme 3 “minority status and language” showed a statistically significant association with GDM pharmacotherapy initiation. When subtheme 3 value was >83 (more people from minoritized groups and with limited English proficiency), patients living in these areas had a significantly increased odds of initiating GDM pharmacotherapy, compared to the reference (see Appendix C).
DICUSSION
We examined the relationship between social vulnerability and initiation of pharmacotherapy for GDM among 33,291 pregnant patients enrolled in a Medicaid program. Social vulnerability had a complex non-linear association with GDM pharmacotherapy, with patients living in areas with high social vulnerability more likely to initiate pharmacotherapy for GDM management than patients living in areas with average vulnerability. Interestingly, the converse relationship was not present – less social vulnerability was not consistently or statistically associated with being less likely to initiate pharmacotherapy for GDM.
Diabetes management relies heavily on patient understanding of and adherence to medical nutrition therapy, blood glucose tracking, and increased prenatal visits (ACOG, 2018). Unlike patients with type 2 diabetes, patients with GDM often are new to the experience of diabetes self-management and may find these additional demands particularly challenging (Zehle et al., 2008). Understanding factors associated with pharmacotherapy initiation can inform plans for GDM management. However, most studies that have assessed factors associated with pharmacotherapy initiation in patients with GDM focused entirely on maternal demographics, clinical characteristics (Bardenheier et al., 2015; Camelo Castillo et al., 2014; Eleftheriades et al., 2021; Langer et al., 2005; Lee et al., 2018; Meshel et al., 2016; Nguyen et al., 2012; Palatnik et al., 2020; Pertot et al., 2011; Pu et al., 2015; Rochon et al., 2006; Shah et al., 2021; Watanabe et al., 2016; Wong & Jalaludin, 2011), and genetic information (Cormier et al., 2015; Powe et al., 2020). Importantly, these variables only explain a relatively small fraction of the variability in pharmacotherapy initiation for GDM (Pertot et al., 2011).
There is a growing interest in understanding the role of socioeconomic factors on health outcomes, including GDM management and disease control. Some studies have evaluated the role of individual social determinants of health in diabetes management during pregnancy and have found associations between higher prevalence of fast-food restaurants (Kahr et al., 2016), higher life chaos (Colicchia et al., 2016), and more material deprivation (Sampson et al., 2014) with worse glycemic control. Fewer studies have considered integrated indexes like the SVI used in our study, but their findings suggest that SVI may be a key factor contributing to glycemic control of diabetes in pregnancy. Venkatesh et al. studied the association between SVI and glycemic control in pregestational diabetics and found that living in community with higher SVI was associated with lower probability of achieving a hemoglobin A1c <6.0% during pregnancy. In another study by Venkatesh et al., differences in glycemic control between Black and White pregnant patients with pregestational diabetes were nonsignificant after adjusting for SVI.
Our findings should be interpreted with respect to certain limitations. Our population includes only patients whose income or circumstances qualify them for Tennessee Medicaid insurance, which skews the overall distribution of social vulnerability in our population towards higher SVI and may limit generalizability to other populations. However, over half of pregnant patients in Tennessee receive insurance coverage through Tennessee Medicaid, making characterization of social vulnerability in this population important and generalizable. Furthermore, the SVI provides a community-level approximation of socioeconomic characteristics but does not provide a real individual-level assessment of vulnerability for each patient in the study cohort. Because the study population may have limited the observable distribution of SVI scores, and the SVI score is an aggregate, imperfect measurement of vulnerability, these challenges likely made it difficult for our study to have the power to detect significant associations between lower social vulnerability scores and pharmacotherapy initiation. To date, SVI is not a validated tool for identification of social vulnerability in pregnant patients with GDM. Findings from subtheme 3, “minority status and language,” suggest that living in communities with more people from minoritized groups or with limited English proficiency could be associated with increased odds of initiating GDM pharmacotherapy; however, these findings are exploratory and further analyses should explore these separately.
We also acknowledge other limitations inherent to using linked administrative datasets. We used prescription pharmacy dispensing data to assess medication initiation and did not observe actual pharmacotherapy initiation for patients, though the large volume of patients and the retrospective nature of the study made direct assessments of dispensed medication use impractical. Additionally, we did not have access to detailed clinical characterizations of disease severity or glucose measurement results, which are important factors in the decision to initiate GDM pharmacotherapy.
Our study has several strengths. An important strength of this work is our large database with detailed information about individual and community-level covariates and outpatient filled prescriptions, permitting measurement of exposures, outcomes, and covariates and minimizing risk for recall bias. Although most prior analyses assumed a linear relationship between social vulnerability and selected outcomes, this assumption can mask important non-linear relationships and lead to the conclusion that select outcomes only increase or decrease with increasing or decreasing social vulnerability values. Our analytical approach was designed to allow the characterization of non-linear relationships between SVI and pharmacotherapy initiation, helping us to conceptualize these relationships in novel ways for future work in this area (see Appendix D).
Implications for Practice and/or Policy
Our study found that patients living in areas with high social vulnerability are more likely to initiate pharmacotherapy for GDM management than patients living in areas with average vulnerability. These observations are consistent with the findings from prior studies examining how community-level disadvantage remains significantly associated with barriers to healthcare even after accounting for individual-level characteristics (Arora et al., 2020; Lantos et al., 2018). In our study, we suggest that patients living in areas with moderate to high social vulnerability likely encounter more barriers to non-pharmacologic interventions, leading to a higher probability of initiating pharmacotherapy to control GDM. Interestingly, in our study, patients living in areas with lower-than-average SVI did not consistently have a lower probability of initiating pharmacotherapy. This observed non-linear relationship between SVI and pharmacotherapy initiation indicates a complex interplay of factors and underscores the need for subsequent studies. Patients living in areas with very low SVI may experience more access to resources, resulting in more oversight of glycemic management and more recognition of abnormal glycemic control. Presently, there is no consensus regarding the definition of poor glycemic control (ACOG, 2018), leaving the decisions to initiate GDM pharmacotherapy for individual patients to clinicians or their institutions. Patients with lower SVI could receive care from clinicians who demand tighter control and more readily initiate pharmacotherapy. Evaluation of these provocative hypotheses could help inform plans that aim to improve the effectiveness of GDM management.
Conclusions
In a large study of pregnant women with GDM, we demonstrated a complex non-linear association between social vulnerability and initiation of pharmacotherapy for GDM management. Patients living in areas with high social vulnerability were more likely to initiate pharmacotherapy than patients living in areas with average vulnerability. Further investigation into social vulnerability may inform clinicians about how to better manage gestational diabetes.
Supplementary Material
Acknowledgements:
We acknowledge the Division of TennCare of the Tennessee Department of Finance and Administration, which provided data for the study. We are also indebted to the Tennessee Department of Health for providing data for the study. A.P. had full access to all data in the study and takes responsibility for the integrity of the data and accuracy of the data analysis.
Declaration of Interest:
C.G.G. reports consulting fees from Pfizer, Sanofi, and Merck, and received research support from Sanofi-Pasteur, the Campbell Alliance/Syneos Health, NIH, CDC, FDA and AHRQ. A.D.W. reports consulting fees from the Tennessee Department of Health. All other authors report no conflict of interest.
Funding:
This work was supported by the National Institutes of Health [grant number: R21HD104983; grant number: 5K12HD043483] and the National Institute on Drug Abuse [grant number: K01DA051683; grant number: K23DA047476]. The funders did not have a role in any aspect of developing the report or in the decision to submit the article for publication.
Biographies
Amelie Pham: Clinical Fellow, Maternal Fetal Medicine
Andrew Weise: Assistant Professor, Health Policy
Andrew Spieker: Assistant Professor, Biostatistics
Sharon Phillips: Associate, Biostatistics
Margaret Adgent: Assistant Professor, Health Policy
Carlos Grijalva: Associate Professor, Health Policy
Sarah Osmundson: Associate Professor, Obstetrics and Gynecology
Footnotes
Publisher's Disclaimer: This is a PDF file of an unedited manuscript that has been accepted for publication. As a service to our customers we are providing this early version of the manuscript. The manuscript will undergo copyediting, typesetting, and review of the resulting proof before it is published in its final form. Please note that during the production process errors may be discovered which could affect the content, and all legal disclaimers that apply to the journal pertain.
SVI: Social Vulnerability Index;
GDM: Gestational diabetes mellitus
REFERENCES
- ACOG. (2018). Gestational Diabetes Mellitus ACOG Practice Bulletin. ACOG practice bulletin, Number 190. Retrieved from https://www.acog.org/clinical/clinical-guidance/practice-bulletin/articles/2018/02/gestational-diabetes-mellitus Accessed March 1, 2022
- Arora KS, Ascha M, Wilkinson B, Verbus E, Montague M, Morris J, & Einstadter D (2020). Association between neighborhood disadvantage and fulfillment of desired postpartum sterilization. BMC Public Health, 20(1), 1440. 10.1186/s12889-020-09540-5 [DOI] [PMC free article] [PubMed] [Google Scholar]
- Bardenheier BH, Imperatore G, Gilboa SM, Geiss LS, Saydah SH, Devlin HM, Kim SY, & Gregg EW (2015). Trends in Gestational Diabetes Among Hospital Deliveries in 19 U.S. States, 2000–2010. Am J Prev Med, 49(1), 12–19. 10.1016/j.amepre.2015.01.026 [DOI] [PMC free article] [PubMed] [Google Scholar]
- Biggs EN, Maloney PM, Rung AL, Peters ES, & Robinson WT (2020). The Relationship Between Social Vulnerability and COVID-19 Incidence Among Louisiana Census Tracts. Front Public Health, 8, 617976. 10.3389/fpubh.2020.617976 [DOI] [PMC free article] [PubMed] [Google Scholar]
- Camelo Castillo W, Boggess K, Sturmer T, Brookhart MA, Benjamin DK Jr., & Jonsson Funk M (2014). Trends in glyburide compared with insulin use for gestational diabetes treatment in the United States, 2000–2011. Obstet Gynecol, 123(6), 1177–1184. 10.1097/AOG.0000000000000285 [DOI] [PMC free article] [PubMed] [Google Scholar]
- CDC. (2021). Centers for Disease Control and Prevention/ Agency for Toxic Substances and Disease Registry/ Geospatial Research, Analysis, and Services Program. CDC/ATSDR Social Vulnerability Index. Retrieved from https://www.atsdr.cdc.gov/placeandhealth/svi/data_documentation_download.html Accessed March 3, 2022
- Colicchia LC, Parviainen K, & Chang JC (2016). Social Contributors to Glycemic Control in Gestational Diabetes Mellitus. Obstet Gynecol, 128(6), 1333–1339. 10.1097/AOG.0000000000001740 [DOI] [PubMed] [Google Scholar]
- Cormier H, Vigneault J, Garneau V, Tchernof A, Vohl MC, Weisnagel SJ, & Robitaille J (2015). An explained variance-based genetic risk score associated with gestational diabetes antecedent and with progression to pre-diabetes and type 2 diabetes: a cohort study. BJOG, 122(3), 411–419. 10.1111/1471-0528.12937 [DOI] [PubMed] [Google Scholar]
- Eleftheriades M, Chatzakis C, Papachatzopoulou E, Papadopoulos V, Lambrinoudaki I, Dinas K, Chrousos G, & Sotiriadis A (2021). Prediction of insulin treatment in women with gestational diabetes mellitus. Nutr Diabetes, 11(1), 30. 10.1038/s41387-021-00173-0 [DOI] [PMC free article] [PubMed] [Google Scholar]
- Flanagan BE, Gregory EW, Hallisey EJ, Heitgerd JL, & Lewis B (2011). A Social Vulnerability Index for Disaster Management. Journal of Homeland Security and Emergency Management, 8(1). 10.2202/1547-7355.1792 [DOI] [Google Scholar]
- Flanagan BEP, & Hallisey EJ, MA, Adams Erica, MS, MPH, Lavery Amy, MSPH, PhD. (2018). Measuring Community Vulnerability to Natural and Anthropogenic Hazards- The Centers for Disease Control and Prevention’s Social Vulnerability Index. Journal of Environmental Health, 80(10), 34–36. https://www.neha.org/sites/default/files/jeh/JEH6.18-Column-Direct-From-ATSDR.pdf [PMC free article] [PubMed] [Google Scholar]
- Givens M, Teal EN, Patel V, & Manuck TA (2021). Preterm birth among pregnant women living in areas with high social vulnerability. Am J Obstet Gynecol MFM, 3(5), 100414. 10.1016/j.ajogmf.2021.100414 [DOI] [PMC free article] [PubMed] [Google Scholar]
- Harrell FE Jr. (2021). Regression Modeling Strategies, With Applications to Linear Models, Logistic Regression, and Survival Analysis. Springer. https://doi.org/ 10.1007/978-1-4757-3462-1 [DOI] [Google Scholar]
- Kahr MK, Suter MA, Ballas J, Ramin SM, Monga M, Lee W, Hu M, Shope CD, Chesnokova A, Krannich L, Griffin EN, Mastrobattista J, Dildy GA, Strehlow SL, Ramphul R, Hamilton WJ, & Aagaard KM (2016). Geospatial analysis of food environment demonstrates associations with gestational diabetes. Am J Obstet Gynecol, 214(1), 110 e111–119. 10.1016/j.ajog.2015.08.048 [DOI] [PMC free article] [PubMed] [Google Scholar]
- Langer O, Yogev Y, Xenakis EM, & Brustman L (2005). Overweight and obese in gestational diabetes: the impact on pregnancy outcome. Am J Obstet Gynecol, 192(6), 1768–1776. 10.1016/j.ajog.2004.12.049 [DOI] [PubMed] [Google Scholar]
- Lantos PM, Hoffman K, Permar SR, Jackson P, Hughes BL, Kind A, & Swamy G (2018). Neighborhood Disadvantage is Associated with High Cytomegalovirus Seroprevalence in Pregnancy. J Racial Ethn Health Disparities, 5(4), 782–786. 10.1007/s40615-017-0423-4 [DOI] [PMC free article] [PubMed] [Google Scholar]
- Lee KW, Ching SM, Ramachandran V, Yee A, Hoo FK, Chia YC, Wan Sulaiman WA, Suppiah S, Mohamed MH, & Veettil SK (2018). Prevalence and risk factors of gestational diabetes mellitus in Asia: a systematic review and meta-analysis. BMC Pregnancy Childbirth, 18(1), 494. 10.1186/s12884-018-2131-4 [DOI] [PMC free article] [PubMed] [Google Scholar]
- Lende M, & Rijhsinghani A (2020). Gestational Diabetes: Overview with Emphasis on Medical Management. Int J Environ Res Public Health, 17(24). 10.3390/ijerph17249573 [DOI] [PMC free article] [PubMed] [Google Scholar]
- Merkt PT, Kramer MR, Goodman DA, Brantley MD, Barrera CM, Eckhaus L, & Petersen EE (2021). Urban-rural differences in pregnancy-related deaths, United States, 2011–2016. Am J Obstet Gynecol, 225(2), 183 e181–183 e116. 10.1016/j.ajog.2021.02.028 [DOI] [PMC free article] [PubMed] [Google Scholar]
- Meshel S, Schejter E, Harel T, Maslovitz S, Germez N, Elimelech B, Cohen B, & Azuri J (2016). Can we predict the need for pharmacological treatment according to demographic and clinical characteristics in gestational diabetes? J Matern Fetal Neonatal Med, 29(13), 2062–2066. 10.3109/14767058.2015.1077225 [DOI] [PubMed] [Google Scholar]
- Nguyen BT, Cheng YW, Snowden JM, Esakoff TF, Frias AE, & Caughey AB (2012). The effect of race/ethnicity on adverse perinatal outcomes among patients with gestational diabetes mellitus. Am J Obstet Gynecol, 207(4), 322 e321–326. 10.1016/j.ajog.2012.06.049 [DOI] [PMC free article] [PubMed] [Google Scholar]
- Palatnik A, Harrison RK, Walker RJ, Thakkar MY, & Egede LE (2020). Maternal racial and ethnic disparities in glycemic threshold for pharmacotherapy initiation for gestational diabetes. J Matern Fetal Neonatal Med, 1–8. 10.1080/14767058.2020.1711728 [DOI] [PMC free article] [PubMed] [Google Scholar]
- Pertot T, Molyneaux L, Tan K, Ross GP, Yue DK, & Wong J (2011). Can common clinical parameters be used to identify patients who will need insulin treatment in gestational diabetes mellitus? Diabetes Care, 34(10), 2214–2216. 10.2337/dc11-0499 [DOI] [PMC free article] [PubMed] [Google Scholar]
- Powe CE, Hivert MF, & Udler MS (2020). Defining Heterogeneity Among Women With Gestational Diabetes Mellitus. Diabetes, 69(10), 2064–2074. 10.2337/dbi20-0004 [DOI] [PMC free article] [PubMed] [Google Scholar]
- Pu J, Zhao B, Wang EJ, Nimbal V, Osmundson S, Kunz L, Popat RA, Chung S, & Palaniappan LP (2015). Racial/Ethnic Differences in Gestational Diabetes Prevalence and Contribution of Common Risk Factors. Paediatr Perinat Epidemiol, 29(5), 436–443. 10.1111/ppe.12209 [DOI] [PMC free article] [PubMed] [Google Scholar]
- Rochon M, Rand L, Roth L, & Gaddipati S (2006). Glyburide for the management of gestational diabetes: risk factors predictive of failure and associated pregnancy outcomes. Am J Obstet Gynecol, 195(4), 1090–1094. 10.1016/j.ajog.2006.07.029 [DOI] [PubMed] [Google Scholar]
- Sampson L, Dasgupta K, & Ross NA (2014). The association between socio-demographic marginalization and plasma glucose levels at diagnosis of gestational diabetes. Diabet Med, 31(12), 1563–1567. 10.1111/dme.12529 [DOI] [PubMed] [Google Scholar]
- Shah NS, Wang MC, Freaney PM, Perak AM, Carnethon MR, Kandula NR, Gunderson EP, Bullard KM, Grobman WA, O’Brien MJ, & Khan SS (2021). Trends in Gestational Diabetes at First Live Birth by Race and Ethnicity in the US, 2011–2019. JAMA, 326(7), 660–669. 10.1001/jama.2021.7217 [DOI] [PMC free article] [PubMed] [Google Scholar]
- Watanabe M, Katayama A, Kagawa H, Ogawa D, & Wada J (2016). Risk Factors for the Requirement of Antenatal Insulin Treatment in Gestational Diabetes Mellitus. J Diabetes Res, 2016, 9648798. 10.1155/2016/9648798 [DOI] [PMC free article] [PubMed] [Google Scholar]
- Wong VW, & Jalaludin B (2011). Gestational diabetes mellitus: who requires insulin therapy? Aust N Z J Obstet Gynaecol, 51(5), 432–436. 10.1111/j.1479-828X.2011.01329.x [DOI] [PubMed] [Google Scholar]
- Yee CW, Cunningham SD, & Ickovics JR (2019). Application of the Social Vulnerability Index for Identifying Teen Pregnancy Intervention Need in the United States. Matern Child Health J, 23(11), 1516–1524. 10.1007/s10995-019-02792-7 [DOI] [PubMed] [Google Scholar]
- Zehle K, Smith BJ, Chey T, McLean M, Bauman AE, & Cheung NW (2008). Psychosocial factors related to diet among women with recent gestational diabetes: opportunities for intervention. Diabetes Educ, 34(5), 807–814. 10.1177/0145721708323641 [DOI] [PubMed] [Google Scholar]
- Venkatesh KK, Chiang CW, Castillo WC, Battarbee AN, Donneyong M, Harper LM, Costantine M, Saade G, Werner EF, Boggess KA, Landon MB (2022). Changing patterns in medication prescription for gestational diabetes during a time of guideline change in the USA: a cross-sectional study. BJOG. 129(3), 473–483. 10.1111/1471-0528.16960 [DOI] [PMC free article] [PubMed] [Google Scholar]
- Venkatesh KK, Fareed N, Kiefer MK, Ware CA, Buschur E, Landon MB, Thung SF, Costantine MM, Gabbe SG, Joseph JJ (2022). Differences in Hemoglobin A1c during Pregnancy between Non-Hispanic Black versus White Women with Prepregnancy Diabetes. Am J Perinatol. 39(12), 1279–1287. 10.1055/a-1788-5600 [DOI] [PubMed] [Google Scholar]
Associated Data
This section collects any data citations, data availability statements, or supplementary materials included in this article.