

Key Points
Question
Is head injury associated with long-term all-cause mortality risk?
Findings
In this cohort study of 13 037 community-dwelling adults followed up between 1987 and 2019, all-cause mortality risk was higher among individuals with head injury vs those without. Mortality risk was also associated with having multiple head injuries or moderate, severe, or penetrating head injury.
Meaning
The findings suggest the importance of public health strategies to prevent head injury and targeted clinical interventions aimed at reducing morbidity and mortality.
This cohort study uses Atherosclerosis Risk in Communities study data to evaluate the association of head injury with long-term all-cause mortality risk in adults.
Abstract
Importance
Head injury is associated with significant short-term morbidity and mortality. Research regarding the implications of head injury for long-term survival in community-dwelling adults remains limited.
Objective
To evaluate the association of head injury with long-term all-cause mortality risk among community-dwelling adults, with consideration of head injury frequency and severity.
Design, Setting, and Participants
This cohort study included participants with and without head injury in the Atherosclerosis Risk in Communities (ARIC) study, an ongoing prospective cohort study with follow-up from 1987 through 2019 in 4 US communities in Minnesota, Maryland, North Carolina, and Mississippi. Of 15 792 ARIC participants initially enrolled, 1957 were ineligible due to self-reported head injury at baseline; 103 participants not of Black or White race and Black participants at the Minnesota and Maryland field centers were excluded due to race-site aliasing; and an additional 695 participants with missing head injury date or covariate data were excluded, resulting in 13 037 eligible participants.
Exposures
Head injury frequency and severity, as defined via self-report in response to interview questions and via hospital-based International Classification of Diseases diagnostic codes (with head injury severity defined in the subset of head injury cases identified using these codes). Head injury was analyzed as a time-varying exposure.
Main Outcomes and Measures
All-cause mortality was ascertained via linkage to the National Death Index. Data were analyzed between August 5, 2021, and October 23, 2022.
Results
More than one-half of participants were female (57.7%; 42.3% men), 27.9% were Black (72.1% White), and the median age at baseline was 54 years (IQR, 49-59 years). Median follow-up time was 27.0 years (IQR, 17.6-30.5 years). Head injuries occurred among 2402 participants (18.4%), most of which were classified as mild. The hazard ratio (HR) for all-cause mortality among individuals with head injury was 1.99 (95% CI, 1.88-2.11) compared with those with no head injury, with evidence of a dose-dependent association with head injury frequency (1 head injury: HR, 1.66 [95% CI, 1.56-1.77]; 2 or more head injuries: HR, 2.11 [95% CI, 1.89-2.37]) and severity (mild: HR, 2.16 [95% CI, 2.01-2.31]; moderate, severe, or penetrating: HR, 2.87 [95% CI, 2.55-3.22]). Estimates were similar by sex and race, with attenuated associations among individuals aged 54 years or older at baseline.
Conclusions and Relevance
In this community-based cohort with more than 3 decades of longitudinal follow-up, head injury was associated with decreased long-term survival time in a dose-dependent manner, underscoring the importance of measures aimed at prevention and clinical interventions to reduce morbidity and mortality due to head injury.
Introduction
Traumatic brain injury (TBI) occurs when external physical forces cause disruption in normal brain function.1,2,3 Leading causes of TBI include motor vehicle crashes, unintentional falls, and intentional self-harm.4 Based on the most recent data, there were approximately 223 135 TBI-related hospitalizations in 2019 and 64 362 TBI-related deaths in the US in 2020.5
Traumatic brain injury is generally understood to consist of 2 distinct phases. Primary injury describes the tissue distortion and destruction that directly result from the initial injury forces, and secondary injury occurs over time and encompasses a wide range of physiologic processes, including blood-brain barrier dysfunction, edema, ischemia, and intracranial hypertension.6,7,8,9,10 It is well established that mortality in the hours to months following TBI is substantially increased,11,12,13,14 and there is further evidence to suggest that long-term survival is reduced in individuals with TBI compared with the general population.15,16,17,18,19,20 Limitations of prior studies include reliance on data exclusively from hospital admissions and study populations derived from a single hospital or geographic region.
As TBI is associated with significant morbidity, disability, and diminished quality of life,21,22,23,24 an understanding of its implications for long-term mortality risk among diverse individuals is essential to inform clinical management. In this study, we leverage data collected over 30 years to examine all-cause and cause-specific mortality risk associated with head injury in a community-based sample of US adults. As prior research suggests that TBI-associated mortality risk may vary meaningfully across population subgroups, we consider the association between head injury and mortality by sex, race, age, and head injury number and severity.
Methods
Study Design and Study Population
This study assessed data from the Atherosclerosis Risk in Communities (ARIC) study, an ongoing community-based cohort study of 15 792 participants aged 45 to 65 years recruited from the 4 US communities in the northwestern suburbs of Minneapolis, Minnesota; Washington County, Maryland; Forsyth County, North Carolina; and Jackson, Mississippi, in 1987-1989 (>70% participation rate among eligible individuals).25 Participants have attended subsequent in-person visits and are followed semiannually via telephone.26 For the present analysis, follow-up extended from the date of entry into the cohort (1987-1989) until loss to follow-up (4.0% over the study duration), withdrawal from the study (5.4%), death, or administrative censoring on December 31, 2019.27 Of the 15 792 ARIC participants initially enrolled, 1957 were ineligible due to self-reported head injury at baseline. We excluded 103 participants not of Black or White race and Black participants at the Minnesota and Maryland field centers in accordance with ARIC study analysis recommendations due to race-site aliasing, whereby mainly White participants were recruited in Minnesota and Maryland, only Black participants were recruited in Mississippi, and mainly White and Black participants were recruited in North Carolina. A further 373 participants were excluded for missing dates of head injury and 322 with missing covariate data, resulting in 13 037 included participants (Figure 1).
Figure 1. Study Timeline and Measures for Atherosclerosis Risk in Communities (ARIC) Study Participants, 1987-2019.
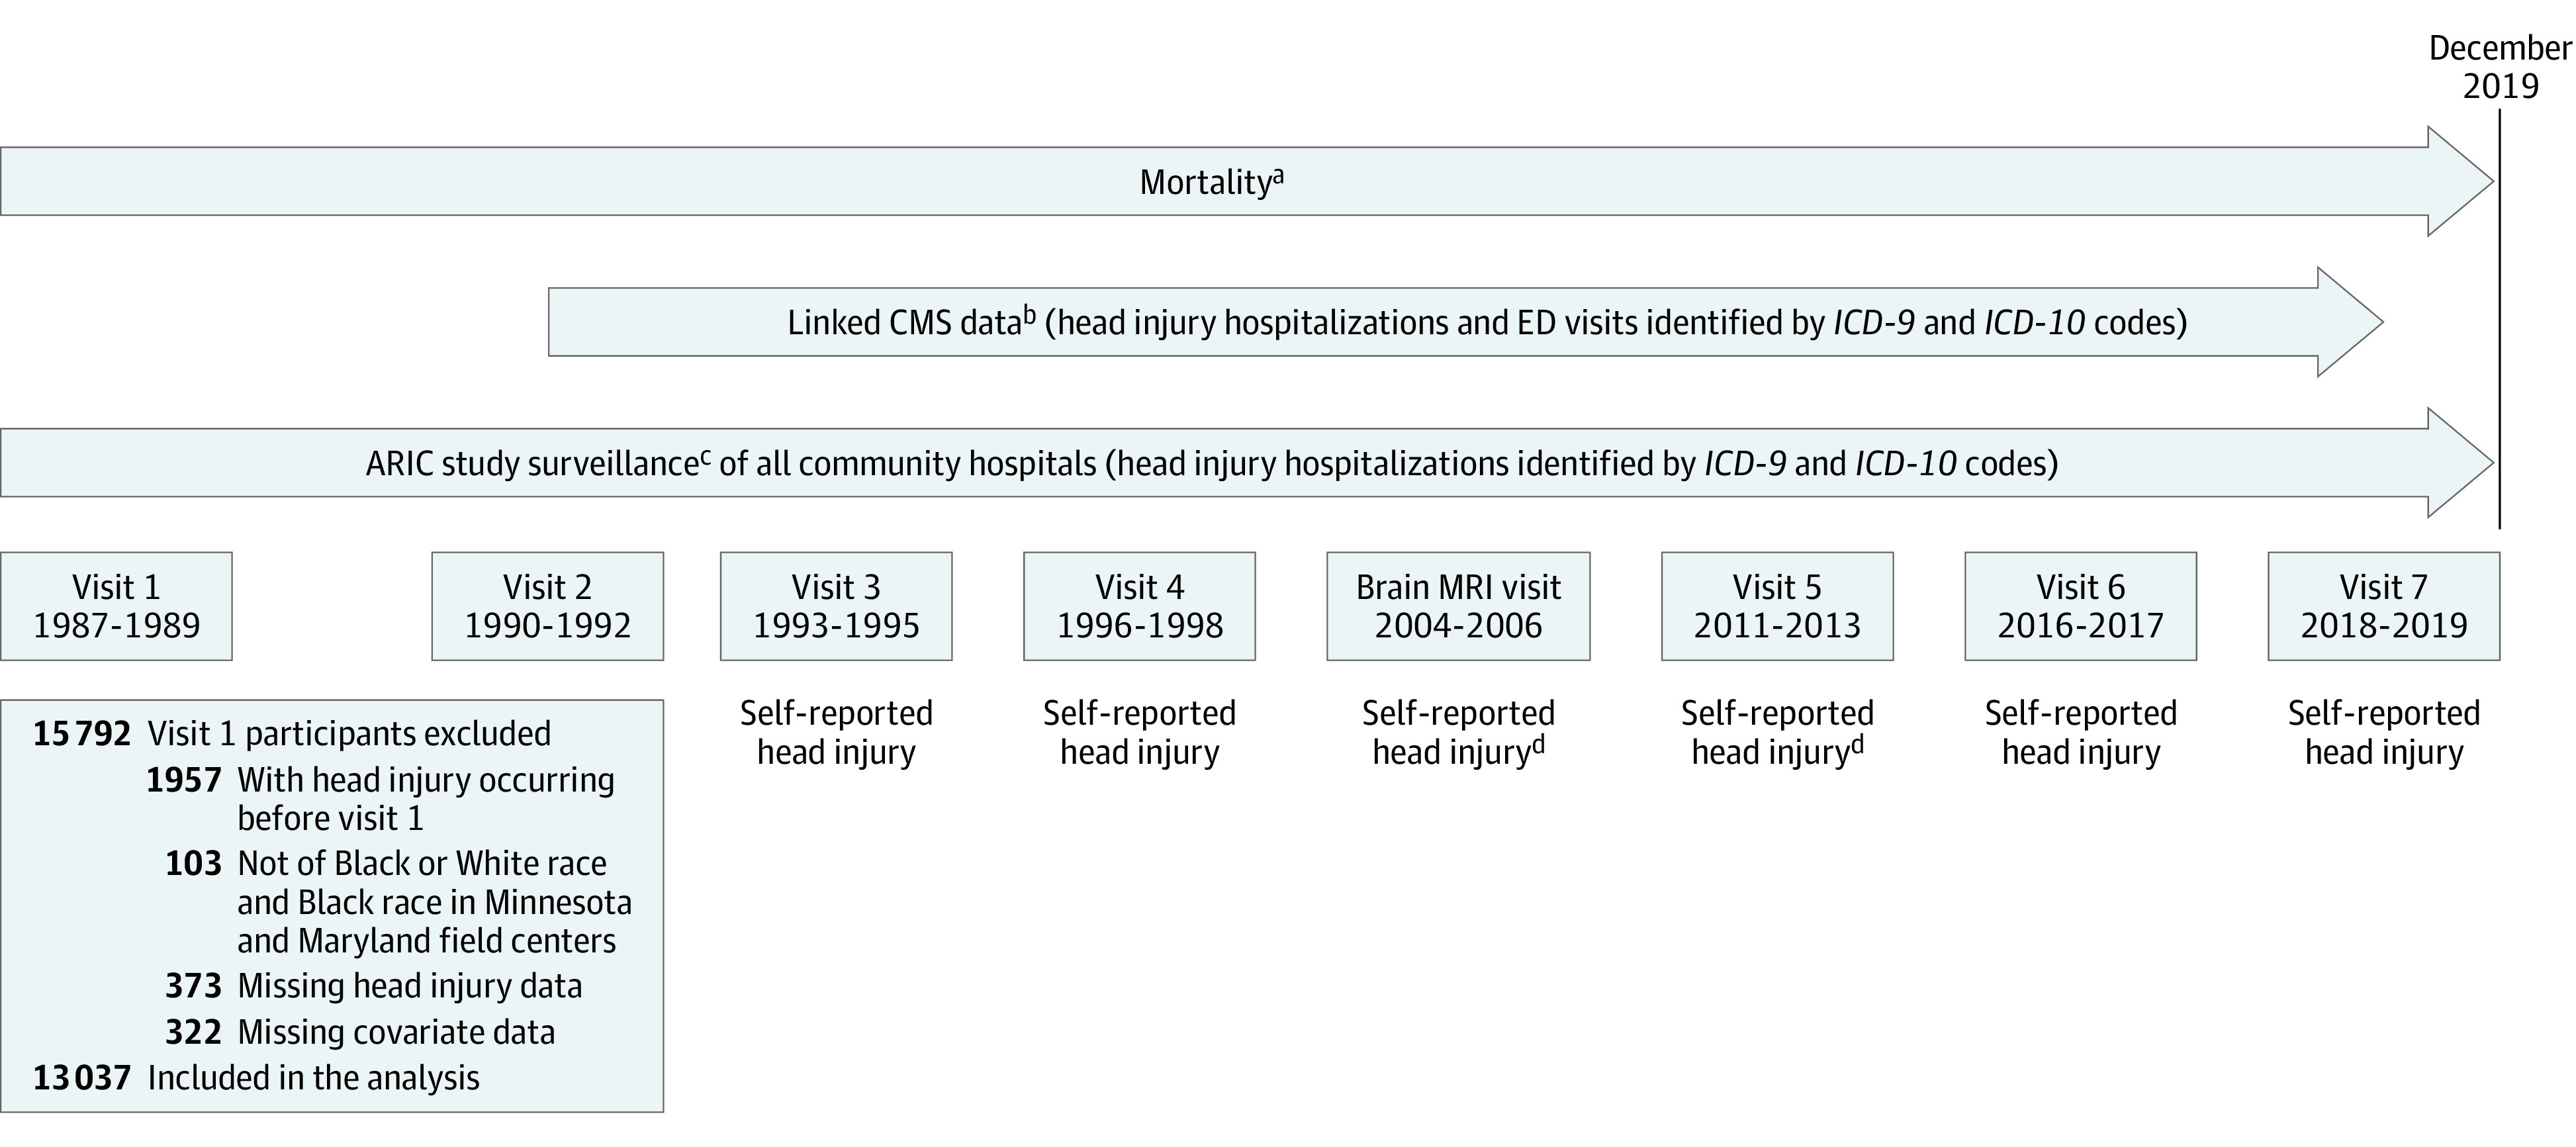
CMS indicates Centers for Medicare & Medicaid Services; ED, emergency department; ICD-9, International Classification of Diseases, Ninth Revision; ICD-10, International Classification of Diseases, Tenth Revision.
aAvailable for all ARIC participants from January 1, 1987, through December 31, 2019.
bAvailable for ARIC participants aged 65 years or older enrolled in Medicare fee-for-service Part B from January 1, 1991, through December 31, 2018.
cAvailable for ARIC participants in Minnesota, Maryland, and North Carolina from January 1, 1987, through December 31, 2019, and for ARIC participants in Mississippi from January 1, 1987, through December 31, 2017.
dQuestions asked in a subgroup of ARIC participants selected for brain magnetic resonance imaging (MRI) scans.
The ARIC study was approved by the institutional review boards of all participating institutions. All participants gave written informed consent to participate at each study visit. Further details about the ARIC study are found in eMethods 1 in Supplement 1. This study followed the Strengthening the Reporting of Observational Studies in Epidemiology (STROBE) reporting guideline.
Head Injury
Head injury with or without loss of consciousness was defined as an absorbing state based on self-report and data from emergency department visits and inpatient hospitalizations. Self-reported head injury was measured from visit 3 onward based on questions about head injury requiring physician or hospital care, loss of consciousness, number of head injuries, and year of head injury (eTable 1 in Supplement 1). The month and date for each self-reported head injury was imputed randomly using the random point method.28 Head injuries requiring hospital care were identified using codes from the International Classification of Diseases, Ninth Revision (ICD-9) and Tenth Revision (ICD-10) based on records from community hospitals and claims data from the Centers for Medicare & Medicaid Services according to the Centers for Disease Control and Prevention case definition for head injury29,30,31 (eTable 2 in Supplement 1). Hospitalization records were available from ARIC study surveillance of all community hospitals from January 1, 1987, to December 31, 2019, in Minnesota, Maryland, and North Carolina and to December 31, 2017, in Mississippi. Linked Centers for Medicare & Medicaid Services data for hospitalizations and emergency department visits were available for participants aged 65 years or older enrolled in Medicare fee-for-service Part B from January 1, 1991, through December 31, 2018.
We created a time-varying indicator for head injury, which equaled 0 until an individual self-reported or received an ICD-9 or ICD-10 diagnostic code for head injury and equaled 1 thereafter. We further classified individuals by number of head injuries using a time-varying categorical variable (no head injury, 1 head injury, and ≥2 head injuries). Finally, among the subset of head injury cases identified by ICD-9 or ICD-10 codes, we categorized head injuries by severity based on the Department of Defense head injury severity classification (no head injury; mild head injury; and moderate, severe, or penetrating injury).32
Mortality
Vital status and date of death were ascertained from state vital records, death certificates, and the National Death Index. We further classified cause-specific mortality based on diagnostic codes for underlying cause of death into the following categories: unintentional or traumatic; cardiovascular; endocrine, nutritional, or metabolic; gastrointestinal; infectious; kidney disease; neoplasm; neurologic; respiratory; and other.33
Statistical Analysis
Participant characteristics are shown overall and stratified by head injury status as median and IQR for continuous variables or number and percent for categorical variables. We conducted a descriptive analysis of cause-specific mortality by first calculating the number of overall deaths in each category and then calculating the percentage of deaths by category and head injury status, with associated 95% CIs calculated using the exact binomial method.
Cox proportional hazards regression models with follow-up (ie, time elapsed since enrollment in the ARIC study) as the time scale were used to model all-cause mortality risk as a function of time-varying head injury. We assessed whether the proportional hazards assumption was satisfied based on the complementary log-log plot and using Schoenfeld residuals.34,35 Our main statistical analysis proceeded in 3 stages. First, we estimated the unadjusted association between head injury and all-cause mortality (model 1). Second, we adjusted for a priori–specified confounding variables, including sex, age, prior military service, race and field center, education, household income, physical activity, and alcohol consumption (model 2). Third, we incorporated adjustment for vascular risk factors (cigarette smoking, hypertension, diabetes, and body mass index) that have been previously associated with head injury and are established risk factors for mortality36,37,38,39 (model 3). A 2-sided P < .05 was set as the threshold of significance. A detailed description of model covariates is found in eMethods 2 in Supplement 1.
As secondary analyses, we evaluated the association between head injury and all-cause mortality in subgroups defined by sex, race, and age (stratified at the median of baseline age for the overall study population [<54 or ≥54 years]). For each subgroup analysis, we conducted formal tests of statistical interaction. We further examined risk of all-cause mortality by number of head injuries. Among the subset of head injuries defined by ICD-9 and ICD-10 data, we evaluated the risk of all-cause mortality by severity. As a sensitivity analysis, we separately considered risk of all-cause mortality associated with self-reported and hospital-diagnosed head injury. Data were analyzed between August 5, 2021, and October 23, 2022. Statistical analyses were performed using R, version 4.0.0 (R Foundation for Statistical Computing).
Results
Of the 13 037 participants included in this study, 2402 (18.4%) had at least 1 head injury, and 512 had 2 or more head injuries. There were 1862 individuals with head injuries identified from hospital diagnosis alone, 299 with head injuries identified via self-report alone, and 241 with head injuries identified from both hospital diagnosis and self-report. Median follow-up time was 27.0 years (IQR, 17.6-30.5 years), and among individuals with head injury, the median time from enrollment to first head injury was 17.0 years (IQR, 7.5-23.0 years). More than one-half of participants were women (57.7%; 43.3% men), 27.9% were Black (72.1% White), and the median age at baseline was 54.0 years (IQR, 49.0-59.0 years). A total of 7353 individuals (56.4%) were recorded as having died during the study period, of whom 1552 (64.6%) were individuals with head injury (Table 1). Among individuals with head injury, the median follow-up time from head injury to death was 4.7 years (IQR, 1.1-10.8 years). Timing of injury to death was similar for older participants (aged ≥54 years: median, 4.6 years; IQR, 1.1-10.7 years) and younger participants (aged <54 years: median, 4.8 years; IQR, 1.1-10.7 years).
Table 1. Baseline Characteristics, Atherosclerosis Risk in Communities Study Visit 1 (1987-1989).
| No. (%) | |||
|---|---|---|---|
| All participants | Head injury | No head injury | |
| No. of participants | 13 037 | 2402 | 10 635 |
| Age, median (IQR), y | 54.0 (49.0-59.0) | 56.0 (51.0-60.0) | 54.0 (49.0-59.0) |
| Sex | |||
| Male | 5511 (42.3) | 836 (34.8) | 4675 (44.0) |
| Female | 7526 (57.7) | 1566 (65.2) | 5960 (56.0) |
| Military service | |||
| No | 10 539 (80.8) | 1946 (81.0) | 8593 (80.8) |
| Yes | 2498 (19.2) | 456 (19.0) | 2042 (19.2) |
| Race and field center | |||
| Black | |||
| Forsyth County, NC | 438 (3.4) | 73 (3.0) | 365 (3.4) |
| Jackson, MS | 3196 (24.5) | 514 (21.4) | 2682 (25.2) |
| White | |||
| Forsyth County, NC | 2872 (22.0) | 529 (22.0) | 2343 (22.0) |
| Minneapolis, MN | 3222 (24.7) | 579 (24.1) | 2643 (24.9) |
| Washington County, MD | 3309 (25.4) | 707 (24.9) | 2602 (24.5) |
| Education | |||
| Less than high school | 3222 (24.7) | 581 (24.2) | 2641 (24.8) |
| GED, high school, vocational | 5349 (41.0) | 936 (39.0) | 4413 (41.5) |
| College, graduate, professional | 4466 (34.3) | 885 (36.8) | 3581 (33.7) |
| Income | |||
| <$35 000 per year | 6989 (53.6) | 1328 (55.3) | 5661 (53.2) |
| ≥$35 000 per year | 5266 (40.4) | 942 (39.2) | 4324 (40.7) |
| Not reported | 782 (6.0) | 132 (5.5) | 650 (6.1) |
| Alcohol consumption | |||
| Current | 7148 (54.8) | 1295 (53.9) | 5853 (55.0) |
| Former | 2463 (18.9) | 420 (17.5) | 2043 (19.2) |
| Never | 3426 (26.3) | 687 (28.6) | 2739 (25.8) |
| Physical activity, median (IQR)a | 2.25 (1.75-3.00) | 2.25 (1.75-3.00) | 2.25 (1.75-3.00) |
| Cigarette smoking | |||
| Current | 3440 (26.4) | 561 (23.4) | 2879 (27.1) |
| Former | 4076 (31.3) | 753 (31.3) | 3323 (31.2) |
| Never | 5521 (42.3) | 1088 (43.5) | 4433 (41.7) |
| Hypertension | |||
| No | 8344 (64.0) | 1470 (61.2) | 6874 (64.6) |
| Yes | 4693 (36.0) | 932 (38.8) | 3761 (35.4) |
| Diabetes | |||
| No | 11 438 (87.7) | 2095 (87.2) | 9343 (87.9) |
| Yes | 1599 (12.3) | 307 (12.8) | 1292 (12.1) |
| BMI, median (IQR) | 26.9 (24.0-30.5) | 27.4 (24.3-31.0) | 26.7 (23.9-30.4) |
| Death | |||
| No | 5954 (45.6) | 850 (35.4) | 4834 (45.5) |
| Yes | 7353 (56.4) | 1552 (64.6) | 5801 (54.5) |
Abbreviations: BMI, body mass index (calculated as weight in kilograms divided by height in meters squared); GED, General Educational Development.
Physical activity is measured as a score ranging from 1 to 5 based on responses to the modified Baecke Physical Activity Questionnaire.
We evaluated cause-specific mortality among individuals with and without head injury. Overall, the most common causes of death were neoplasm, cardiovascular disease, and neurologic disorders (Figure 2A). Among individuals with head injury, deaths caused by neurologic disorders and unintentional injury or trauma occurred more frequently as indicated by nonoverlapping 95% CIs (Figure 2B). We further evaluated specific underlying neurologic causes of death among participants with head injury (n = 355) compared with those without head injury (n = 745). Nearly two-thirds of neurologic causes of death were attributed to neurodegenerative disease (62.2%) among individuals with head injury compared with 51.4% among those without head injury. Neurodegenerative diseases, such as Parkinson disease and dementia, composed a greater proportion of overall deaths among individuals with head injury (14.2%) vs those without (6.6%). Among individuals with head injury, a further 30.7% of neurologic causes of death were attributed to cerebrovascular disorders; 1.1% to motor neuron disease; 0.8% to anoxic brain injury; and 5.1% to other, nonspecific neurologic disease.
Figure 2. Cause-Specific Mortality Overall and by Head Injury Status.

The number of deaths in each category includes individuals with and without head injuries combined. The percentage of deaths in each category of cause-specific mortality by head injury status with associated 95% CIs was calculated using the exact binomial method.
Cox proportional hazards regression models were used to model all-cause mortality risk as a function of time-varying head injury. The proportional hazards assumption was satisfied based on Schoenfeld residuals and the complementary log-log plot (eFigure 1 in Supplement 1). Kaplan-Meier curves depict that cumulative survival was consistently decreased among individuals with head injury compared with those without head injury (eFigure 2 in Supplement 1). Estimated hazard ratio (HRs) for the association between head injury and mortality for each model specification, as well as for covariates included to control for potential confounding (models 2 and 3), are depicted in Table 2. In unadjusted analysis (model 1), the HR of mortality among individuals with head injury was 2.21 (95% CI, 2.09-2.34) compared with those without head injury. The association was attenuated but remained significant with adjustment for sociodemographic factors (model 2: HR, 1.99; 95% CI, 1.88-2.11) and with adjustment for vascular risk factors in the final model (model 3: HR, 1.92; 95% CI, 1.81-2.03). In subgroup analyses, we found no evidence of a statistical interaction by sex or race, although results were attenuated among individuals aged 54 years or older at baseline (<54 years: HR, 2.26; 95% CI, 2.03-2.51; ≥54 years: HR, 2.00; 95% CI, 1.87-2.14; P for interaction = .03). Model results for subgroup analyses are presented in eTables 3 to 5 in Supplement 1.
Table 2. Hazard Ratios for Association Between Head Injury and Risk of All-Cause Mortalitya.
| No. of cases | Person-years | HR (95% CI) | |||
|---|---|---|---|---|---|
| Model 1 | Model 2 | Model 3 | |||
| Head injury | |||||
| No | 5801 | 296 114 | 1 [Reference] | 1 [Reference] | 1 [Reference] |
| Yes | 1552 | 25 965 | 2.21 (2.09-2.34) | 1.99 (1.88-2.11) | 1.92 (1.81-2.03) |
| Sex | |||||
| Male | 3611 | 127 274 | NA | 1 [Reference] | 1 [Reference] |
| Female | 3742 | 194 805 | NA | 0.43 (0.40-0.45) | 0.45 (0.42-0.47) |
| Military service | |||||
| No | 5861 | 254 526 | NA | 1 [Reference] | 1 [Reference] |
| Yes | 1492 | 67 553 | NA | 0.50 (0.47-0.53) | 0.52 (0.48-0.55) |
| Race and field center | |||||
| Black | |||||
| Forsyth County, NC | 268 | 9787 | NA | 1.26 (1.10-1.44) | 0.98 (0.86-1.12) |
| Jackson, MS | 1817 | 73 164 | NA | 1.25 (1.15-1.35) | 1.02 (0.95-1.11) |
| White | NA | ||||
| Forsyth County, NC | 1603 | 72 347 | NA | 1.05 (0.98-1.13) | 1.02 (0.95-1.09) |
| Minneapolis, MN | 1686 | 83 009 | NA | 1 [Reference] | 1 [Reference] |
| Washington County, MD | 1979 | 83 772 | NA | 0.98 (0.91-1.05) | 0.98 (0.92-1.05) |
| Education | |||||
| Less than high school | 2294 | 70 420 | NA | 1 [Reference] | 1 [Reference] |
| GED, high school, vocational | 2917 | 134 948 | NA | 0.89 (0.84-0.95) | 0.96 (0.91-1.02) |
| College, graduate, professional | 2142 | 116 711 | NA | 0.80 (0.75-0.85) | 0.90 (0.85-0.97) |
| Income | |||||
| <$35 000 per year | 4482 | 162 270 | NA | 1 [Reference] | 1 [Reference] |
| ≥$35 000 per year | 2440 | 140 851 | NA | 0.77 (0.73-0.82) | 0.81 (0.77-0.86) |
| Not reported | 431 | 18 958 | NA | 0.92 (0.83-1.01) | 0.96 (0.87-1.06) |
| Alcohol consumption | |||||
| Current | 3892 | 180 643 | NA | 1 [Reference] | 1 [Reference] |
| Former | 1626 | 55 403 | NA | 1.15 (1.08-1.22) | 1.14 (1.08-1.22) |
| Never | 1835 | 86 033 | NA | 0.84 (0.79-0.89) | 0.98 (0.92-1.04) |
| Physical activityb | NA | NA | NA | 0.89 (0.86-0.92) | 0.93 (0.90-0.96) |
| Agec | NA | NA | NA | 1.66 (1.62-1.70) | 1.67 (1.64-1.71) |
| Cigarette smoking | |||||
| Current | 2438 | 75 178 | NA | NA | 1 [Reference] |
| Former | 2367 | 101 009 | NA | NA | 0.52 (0.49-0.56) |
| Never | 2548 | 145 892 | NA | NA | 0.42 (0.39-0.44) |
| Hypertension | |||||
| No | 4108 | 216 652 | NA | NA | 1 [Reference] |
| Yes | 3245 | 105 427 | NA | NA | 1.36 (1.29-1.42) |
| Diabetes | |||||
| No | 6037 | 291 092 | NA | NA | 1 [Reference] |
| Yes | 1316 | 30 987 | NA | NA | 1.87 (1.75-1.99) |
| BMI | NA | NA | NA | NA | 1.02 (1.01-1.02) |
Abbreviations: BMI, body mass index (calculated as weight in kilograms divided by height in meters squared); GED, General Educational Development; HR, hazard ratio; NA, not applicable.
Follow-up (ie, years elapsed since enrollment in the Atherosclerosis Risk in Communities study) served as the time scale. Head injury was treated as a time-varying covariate (with person-years allocated to no head injury and head injury).
Coefficient corresponds to a 1-point increase in activity score (Baecke Physical Activity Questionnaire).
Coefficient corresponds to a 5-point increase in age in years.
We further examined the risk of all-cause mortality by number of head injuries and by injury severity. By number of prior head injuries, the HR for individuals with 1 head injury was 1.66 (95% CI, 1.56-1.77), and the HR for those with 2 or more head injuries was 2.11 (95% CI, 1.89-2.37) compared with no head injury (Figure 3A and C; eTable 6 in Supplement 1). In analyses restricted to hospitalized individuals for whom measures of head injury severity were available, the HR for mild head injury was 2.16 (95% CI, 2.01-2.31), and the HR for moderate, severe, or penetrating head injury was 2.87 (95% CI, 2.55-3.22) compared with no head injury (Figure 3B and D; eTable 7 in the Supplement). In sensitivity analysis, we separately considered head injury identified via self-report vs hospital record. There was no clear evidence of a difference in all-cause mortality among individuals with self-reported head injury vs those with no head injury (HR, 0.98; 95% CI, 0.87-1.10), although we did observe an association among individuals with hospital-recorded head injuries (HR, 2.14; 95% CI, 2.01-2.27) (eTable 8 in Supplement 1).
Figure 3. Adjusted Hazard Ratios (HRs) for All-Cause Mortality by Number and by Severity of Head Injuries.

For both statistical models, follow-up served as the time scale. Head injury was defined as a time-varying covariate, with person-years allocated to no head injury or head injury. All models included controls for sex, race and field center, age, military service, education, income, alcohol consumption, and physical activity. ARIC indicates Atherosclerosis Risk in Communities.
Discussion
This cohort study focuses on long-term mortality risk associated with both self-reported and hospital-diagnosed head injuries in a diverse cohort of community-dwelling US adults followed for 30 years. We found an approximately 2-fold increase in all-cause mortality risk associated with head injury. It is important to note that head injuries cannot be and are not randomly assigned; therefore, our findings could reflect that individuals who experienced head injury have increased mortality risk at baseline, that head injury causes an increase in mortality risk, or a combination thereof. Regardless of the underlying mechanism, results of this study underscore the importance of public health measures that prevent head injuries and swift clinical intervention to reduce morbidity and mortality if head injury occurs.
Our findings are consistent with results from several prior studies that showed decreased long-term survival associated with TBI among individuals identified through hospital and rehabilitation facility discharge records.15,16,17,40,41 Our results are also consistent with an analysis of data collected from a community-based random sample of Olmsted County, Minnesota, residents with confirmed TBI identified through the Rochester Epidemiology Project (REP). Analysis of the REP cohort revealed increased all-cause mortality risk in individuals with TBI compared with matched population control participants over the 22-year study, although this association did not persist when individuals with head injury were compared with control participants with other injury.19 Our study naturally extends prior research that includes only those individuals diagnosed via hospital discharge records by including those with self-reported, likely milder, head injuries. Additionally, although analysis of TBI in Olmsted County constitutes a key contribution to the literature by leveraging data gathered from a community-based sample, Olmsted County residents are predominantly White (approximately 90%), and residents receive medical care from 2 group practices.42 Our study adds to the literature by evaluating all-cause mortality risk associated with TBI within a geographically diverse community-based sample of Black and White study participants. We estimate that median survival after head injury is 4.7 years (IQR, 1.1-10.8), which is comparable to 6.8 years in the REP population; importantly, the REP study population is significantly younger than the ARIC study population. While our results likely have limited generalizability to survival risk among young adults with head injury, the majority of TBI-related morbidity and mortality is concentrated among older adults. Based on US surveillance data, adults aged 75 years or older account for approximately 32% of TBI-related hospitalizations and 28% of TBI-related deaths.5
Another contribution is our analysis of cause-specific mortality. We found that neurologic and unintentional and traumatic causes of death occurred more frequently among individuals with head injury. Neurodegenerative diseases, such as Parkinson disease and dementia, composed a greater proportion of overall deaths among individuals with head injury (14.2%) vs those without (6.6%), and a greater proportion of deaths were due to neurologic causes among individuals with head injury (62.2%) vs those without (51.4%), raising the possibility of reverse causality wherein individuals with neurodegenerative diseases may be more likely to fall and sustain head injuries. Our results, therefore, point to the need for future research that is focused on better elucidating the time-dependent association among neurodegenerative diseases, head injury, and mortality, particularly where detailed longitudinal measures are available. Our finding that deaths due to neurodegenerative disorders comprised nearly two-thirds of deaths due to neurologic causes in head injury is also consistent with a prior analysis of this study population that showed an increased risk of dementia associated with head injury.43
In subgroup analyses, results were similar by race and sex. In a prior analysis of a nationally representative sample of US adults, the prevalence of TBI was higher among men than women.44 In our data, head injury occurred more frequently among women than in men, which may partly reflect the female predominance in our study population and greater life expectancy of women. Our findings by sex are inconsistent with some prior research showing an increased mortality risk following TBI in women vs men.45,46,47 Few studies have specifically considered racial and ethnic differences in TBI mortality risk. By age, the association between TBI and all-cause mortality was stronger among younger (<54 years at baseline) vs older individuals. Descriptive studies have shown that TBI incidence peaks in young adulthood and among older adults,4,48 and some research has suggested that mortality risk associated with TBI is higher in middle age.17,49 Our findings of increased all-cause mortality associated with TBI in older adults may reflect differences in injury severity or mechanism among younger vs older adults.
We further reveal a dose-response pattern in which the strength of association with all-cause mortality increased with the frequency and severity of head injury. In our analysis of head injury frequency, the association with all-cause mortality was greater for individuals with 2 or more head injuries but persisted among individuals with only 1 head injury. This finding suggests that any head injury confers increased mortality risk and that subsequent head injuries may further increase that risk.
In our analysis of severity, we found an association between all-cause mortality and moderate, severe, or penetrating head injuries. These findings are consistent with those from sensitivity analyses in which hospital-diagnosed head injuries were associated with mortality risk, whereas head injuries diagnosed via self-report were not. Additionally, our findings are in keeping with several prior studies that found evidence of increased all-cause mortality risk among individuals with moderate to severe TBI compared with those with mild TBI50 or no TBI.15,16,17 Importantly, our results reveal that all-cause mortality risk remains increased with mild head injury compared with no head injury, which should motivate ongoing consideration of TBI frequency and severity (including mild TBI) as determinants of subsequent morbidity and mortality.
Limitations
Our study has several limitations. First, our findings may not be generalizable to other US regions, racial and ethnic subgroups, and age groups not represented in this study population. Although relatively smaller sample sizes from some study sites (ie, Black participants from Forsyth County) may have influenced study results, participants were selected using probability sampling and are therefore representative of each community. Second, head injury was ascertained via hospital or emergency department diagnoses and self-reported head injuries. Definitions of TBI based on ICD-9 or ICD-10 codes are susceptible to misclassification, particularly for mild injuries, with validation studies reporting sensitivities of 55% to 72% and specificity of 80% to 85%, depending on the code definition used.51,52 We used standard ICD-9 and ICD-10 codes to identify hospital and emergency department diagnoses of head injuries.29,31 The language of questions used to assess self-reported head injury changed over time but focused on individuals who required medical attention or had an associated loss of consciousness. Therefore, mild head injuries may not have been captured, although the attenuation of the association with mortality observed when using self-report–defined head injury suggests that self-reported cases in the ARIC study are largely milder than the ICD-9 and ICD-10 code–defined ones. However, prior research has suggested that self-report offers reliable assessment of head injury, even among individuals with cognitive impairment.53 Third, study data were available on a daily (not hourly) level, so we could not distinguish between associations of the primary vs secondary phases of head injury with mortality risk. Fourth, we did not have details on other traumatic injuries or TBI mechanisms, which may yield additional insights, particularly among women for whom intimate partner violence is a more frequent cause of TBI.54
Conclusions
This study reports an approximately 2-fold increase in long-term mortality risk associated with head injury (identified by both self-report and hospital diagnosis) in a diverse cohort of US adults followed for 30 years. This finding was consistent within subgroups defined by race and sex, with an attenuated strength of association among adults aged 54 years or older at baseline. Analysis of head injury frequency and severity revealed an association with increased mortality risk among individuals with 2 or more head injuries and among those with moderate, severe, or penetrating head injuries. This robust and dose-dependent long-term association underscores the importance of public health measures aimed at preventing head injuries and targeted clinical interventions to reduce morbidity and mortality after head injury.
eMethods 1. Atherosclerosis Risk in Communities Study Design and Protocols
eMethods 2. Covariates
eTable 1. Self-Reported Head Injury Questions
eTable 2. International Classification of Diseases, Ninth Revision (ICD-9) and Tenth Revision (ICD-10) Codes Used to Define Head Injury
eFigure 1. Complementary Log-Log Plot for Proportional Hazards Assumption
eFigure 2. Kaplan-Meier Curve for Cumulative Survival Among Individuals With and Without Head Injury in the Atherosclerosis Risk in Communities (ARIC) Study Population, 1987-2019
eTable 3. Adjusted Hazard Ratios (HRs) for Association Between Head Injury and All-Cause Mortality by Race
eTable 4. Adjusted Hazard Ratios (HRs) for Association Between Head Injury and All-Cause Mortality by Sex
eTable 5. Adjusted Hazard Ratios (HRs) for Association Between Head Injury and All-Cause Mortality by Baseline Age
eTable 6. Adjusted Hazard Ratios (HRs) for All-Cause Mortality by Number of Head Injuries
eTable 7. Adjusted Hazard Ratios (HRs) for All-Cause Mortality by Severity of Head Injuries
eTable 8. Adjusted Hazard Ratios (HRs) for All-Cause Mortality by Self-Report vs Hospital Report
Data Sharing Statement
References
- 1.Parikh S, Koch M, Narayan RK. Traumatic brain injury. Int Anesthesiol Clin. 2007;45(3):119-135. doi: 10.1097/AIA.0b013e318078cfe7 [DOI] [PubMed] [Google Scholar]
- 2.Menon DK, Schwab K, Wright DW, Maas AI; Demographics and Clinical Assessment Working Group of the International and Interagency Initiative toward Common Data Elements for Research on Traumatic Brain Injury and Psychological Health . Position statement: definition of traumatic brain injury. Arch Phys Med Rehabil. 2010;91(11):1637-1640. doi: 10.1016/j.apmr.2010.05.017 [DOI] [PubMed] [Google Scholar]
- 3.National Institute of Neurological Disorders and Stroke. Traumatic brain injury. Published 2022. Accessed May 1, 2022. https://www.ninds.nih.gov/health-information/disorders/traumatic-brain-injury
- 4.Peterson AB, Thomas KE, Zhou H. Traumatic brain injury-related hospitalizations and deaths by age group, sex, and mechanism of injury: United States 2018 and 2019. Centers for Disease Control and Prevention; 2022. [Google Scholar]
- 5.CDC WONDER. Centers for Disease Control and Prevention . Published 2022. Accessed October 1, 2022. https://wonder.cdc.gov
- 6.Greve MW, Zink BJ. Pathophysiology of traumatic brain injury. Mt Sinai J Med. 2009;76(2):97-104. [DOI] [PubMed] [Google Scholar]
- 7.Finnie J. Animal models of traumatic brain injury: a review. Aust Vet J. 2001;79(9):628-633. doi: 10.1111/j.1751-0813.2001.tb10785.x [DOI] [PubMed] [Google Scholar]
- 8.Jarrahi A, Braun M, Ahluwalia M, et al. Revisiting traumatic brain injury: from molecular mechanisms to therapeutic interventions. Biomedicines. 2020;8(10):389. doi: 10.3390/biomedicines8100389 [DOI] [PMC free article] [PubMed] [Google Scholar]
- 9.Werner C, Engelhard K. Pathophysiology of traumatic brain injury. Br J Anaesth. 2007;99(1):4-9. doi: 10.1093/bja/aem131 [DOI] [PubMed] [Google Scholar]
- 10.Blumbergs PC, Jones NR, North JB. Diffuse axonal injury in head trauma. J Neurol Neurosurg Psychiatry. 1989;52(7):838-841. doi: 10.1136/jnnp.52.7.838 [DOI] [PMC free article] [PubMed] [Google Scholar]
- 11.Fabbri A, Servadei F, Marchesini G, Stein SC, Vandelli A. Early predictors of unfavourable outcome in subjects with moderate head injury in the emergency department. J Neurol Neurosurg Psychiatry. 2008;79(5):567-573. doi: 10.1136/jnnp.2007.120162 [DOI] [PubMed] [Google Scholar]
- 12.Jiang J-Y, Gao G-Y, Li W-P, Yu M-K, Zhu C. Early indicators of prognosis in 846 cases of severe traumatic brain injury. J Neurotrauma. 2002;19(7):869-874. doi: 10.1089/08977150260190456 [DOI] [PubMed] [Google Scholar]
- 13.Lannoo E, Van Rietvelde F, Colardyn F, et al. Early predictors of mortality and morbidity after severe closed head injury. J Neurotrauma. 2000;17(5):403-414. doi: 10.1089/neu.2000.17.403 [DOI] [PubMed] [Google Scholar]
- 14.McGarry LJ, Thompson D, Millham FH, et al. Outcomes and costs of acute treatment of traumatic brain injury. J Trauma. 2002;53(6):1152-1159. doi: 10.1097/00005373-200212000-00020 [DOI] [PubMed] [Google Scholar]
- 15.Selassie AW, McCarthy ML, Ferguson PL, Tian J, Langlois JA. Risk of posthospitalization mortality among persons with traumatic brain injury, South Carolina 1999-2001. J Head Trauma Rehabil. 2005;20(3):257-269. doi: 10.1097/00001199-200505000-00008 [DOI] [PubMed] [Google Scholar]
- 16.Ratcliff G, Colantonio A, Escobar M, Chase S, Vernich L. Long-term survival following traumatic brain injury. Disabil Rehabil. 2005;27(6):305-314. doi: 10.1080/09638280400018338 [DOI] [PubMed] [Google Scholar]
- 17.Harrison-Felix C, Kolakowsky-Hayner SA, Hammond FM, et al. Mortality after surviving traumatic brain injury: risks based on age groups. J Head Trauma Rehabil. 2012;27(6):E45-E56. doi: 10.1097/HTR.0b013e31827340ba [DOI] [PubMed] [Google Scholar]
- 18.Fuller GW, Ransom J, Mandrekar J, Brown AW. Long-term survival following traumatic brain injury: a population-based parametric survival analysis. Neuroepidemiology. 2016;47(1):1-10. doi: 10.1159/000445997 [DOI] [PMC free article] [PubMed] [Google Scholar]
- 19.Brown AW, Leibson CL, Mandrekar J, Ransom JE, Malec JF. Long-term survival after traumatic brain injury: a population-based analysis controlled for nonhead trauma. J Head Trauma Rehabil. 2014;29(1):E1-E8. doi: 10.1097/HTR.0b013e318280d3e6 [DOI] [PMC free article] [PubMed] [Google Scholar]
- 20.Harrison-Felix CL, Whiteneck GG, Jha A, DeVivo MJ, Hammond FM, Hart DM. Mortality over four decades after traumatic brain injury rehabilitation: a retrospective cohort study. Arch Phys Med Rehabil. 2009;90(9):1506-1513. doi: 10.1016/j.apmr.2009.03.015 [DOI] [PubMed] [Google Scholar]
- 21.Andelic N, Howe EI, Hellstrøm T, et al. Disability and quality of life 20 years after traumatic brain injury. Brain Behav. 2018;8(7):e01018. doi: 10.1002/brb3.1018 [DOI] [PMC free article] [PubMed] [Google Scholar]
- 22.Andelic N, Sigurdardottir S, Schanke A-K, Sandvik L, Sveen U, Roe C. Disability, physical health and mental health 1 year after traumatic brain injury. Disabil Rehabil. 2010;32(13):1122-1131. doi: 10.3109/09638280903410722 [DOI] [PubMed] [Google Scholar]
- 23.Mailhan L, Azouvi P, Dazord A. Life satisfaction and disability after severe traumatic brain injury. Brain Inj. 2005;19(4):227-238. doi: 10.1080/02699050410001720149 [DOI] [PubMed] [Google Scholar]
- 24.Lundin A, de Boussard C, Edman G, Borg J. Symptoms and disability until 3 months after mild TBI. Brain Inj. 2006;20(8):799-806. doi: 10.1080/02699050600744327 [DOI] [PubMed] [Google Scholar]
- 25.Zheng Z, Rebholz CM, Matsushita K, et al. Survival advantage of cohort participation attenuates over time: results from three long-standing community-based studies. Ann Epidemiol. 2020;45:40-46.e44. doi: 10.1016/j.annepidem.2020.03.010 [DOI] [PMC free article] [PubMed] [Google Scholar]
- 26.Wright JD, Folsom AR, Coresh J, et al. The ARIC (Atherosclerosis Risk in Communities) study: JACC focus seminar 3/8. J Am Coll Cardiol. 2021;77(23):2939-2959. doi: 10.1016/j.jacc.2021.04.035 [DOI] [PMC free article] [PubMed] [Google Scholar]
- 27.George KM, Folsom AR, Kucharska-Newton A, Mosley TH, Heiss G. Factors related to differences in retention among African American and White participants in the Atherosclerosis Risk in Communities study (ARIC) prospective cohort: 1987-2013. Ethn Dis. 2017;27(1):31-38. doi: 10.18865/ed.27.1.31 [DOI] [PMC free article] [PubMed] [Google Scholar]
- 28.Vandormael A, Dobra A, Bärnighausen T, de Oliveira T, Tanser F. Incidence rate estimation, periodic testing and the limitations of the mid-point imputation approach. Int J Epidemiol. 2018;47(1):236-245. doi: 10.1093/ije/dyx134 [DOI] [PMC free article] [PubMed] [Google Scholar]
- 29.Langlois JA, Kegler SR, Butler JA, et al. Traumatic brain injury-related hospital discharges: results from a 14-state surveillance system, 1997. MMWR Surveill Summ. 2003;52(4):1-20. [PubMed] [Google Scholar]
- 30.Burke JF, Stulc JL, Skolarus LE, Sears ED, Zahuranec DB, Morgenstern LB. Traumatic brain injury may be an independent risk factor for stroke. Neurology. 2013;81(1):33-39. doi: 10.1212/WNL.0b013e318297eecf [DOI] [PMC free article] [PubMed] [Google Scholar]
- 31.Hedegaard H, Johnson RL, Warner M, Chen L-H, Annest JL. Proposed framework for presenting injury data using the International Classification of Diseases, Tenth Revision, Clinical Modification (ICD-10-CM) diagnosis codes. Natl Health Stat Report. 2016;(89):1-20. [PubMed] [Google Scholar]
- 32.Defense and Veterans Brain Injury Center . DoD Worldwide Numbers for TBI. Department of Defense; 2018. [Google Scholar]
- 33.World Health Organization . International Classification of Diseases: Ninth Revision, Basic Tabulation List With Alphabetic Index. World Health Organization; 1978. [Google Scholar]
- 34.Grambsch PM, Therneau TM. Proportional hazards tests and diagnostics based on weighted residuals. Biometrika. 1994;81(3):515-526. doi: 10.1093/biomet/81.3.515 [DOI] [Google Scholar]
- 35.Kleinbaum DG, Klein M. Survival Analysis. Vol 3. Springer; 2010. [Google Scholar]
- 36.Barmparas G, Liou DZ, Lamb AW, et al. Prehospital hypertension is predictive of traumatic brain injury and is associated with higher mortality. J Trauma Acute Care Surg. 2014;77(4):592-598. doi: 10.1097/TA.0000000000000382 [DOI] [PubMed] [Google Scholar]
- 37.Mishra R, Galwankar S, Konar S, et al. Obesity as a predictor of outcome following traumatic brain injury: a systematic review and meta-analysis. Clin Neurol Neurosurg. 2022;217:107260. doi: 10.1016/j.clineuro.2022.107260 [DOI] [PubMed] [Google Scholar]
- 38.Rao RK, McConnell DD, Litofsky NS. The impact of cigarette smoking and nicotine on traumatic brain injury: a review. Brain Inj. 2022;36(1):1-20. doi: 10.1080/02699052.2022.2034186 [DOI] [PubMed] [Google Scholar]
- 39.Tatara Y, Shimada R, Kibayashi K. Effects of preexisting diabetes mellitus on the severity of traumatic brain injury. J Neurotrauma. 2021;38(7):886-902. doi: 10.1089/neu.2020.7118 [DOI] [PubMed] [Google Scholar]
- 40.Brooks JC, Shavelle RM, Strauss DJ, Hammond FM, Harrison-Felix CL. Long-term survival after traumatic brain injury part II: life expectancy. Arch Phys Med Rehabil. 2015;96(6):1000-1005. doi: 10.1016/j.apmr.2015.02.002 [DOI] [PubMed] [Google Scholar]
- 41.Brooks JC, Strauss DJ, Shavelle RM, Paculdo DR, Hammond FM, Harrison-Felix CL. Long-term disability and survival in traumatic brain injury: results from the National Institute on Disability and Rehabilitation Research Model Systems. Arch Phys Med Rehabil. 2013;94(11):2203-2209. doi: 10.1016/j.apmr.2013.07.005 [DOI] [PubMed] [Google Scholar]
- 42.Rocca WA, Yawn BP, St Sauver JL, Grossardt BR, Melton LJ III. History of the Rochester Epidemiology Project: half a century of medical records linkage in a US population. Mayo Clin Proc. 2012;87(12):1202-1213. [DOI] [PMC free article] [PubMed] [Google Scholar]
- 43.Schneider ALC, Selvin E, Latour L, et al. Head injury and 25-year risk of dementia. Alzheimers Dement. 2021;17(9):1432-1441. doi: 10.1002/alz.12315 [DOI] [PMC free article] [PubMed] [Google Scholar]
- 44.Schneider ALC, Wang D, Ling G, Gottesman RF, Selvin E. Prevalence of self-reported head injury in the United States. N Engl J Med. 2018;379(12):1176-1178. doi: 10.1056/NEJMc1808550 [DOI] [PMC free article] [PubMed] [Google Scholar]
- 45.Balestreri M, Steiner LA, Czosnyka M. Sex-related differences and traumatic brain injury. J Neurosurg. 2003;99(3):616-617. [DOI] [PubMed] [Google Scholar]
- 46.Czosnyka M, Radolovich D, Balestreri M, et al. Gender-related differences in intracranial hypertension and outcome after traumatic brain injury. Acta Neurochir Suppl. 2008;102:25-28. doi: 10.1007/978-3-211-85578-2_5 [DOI] [PubMed] [Google Scholar]
- 47.Kraus JF, Peek-Asa C, McArthur D. The independent effect of gender on outcomes following traumatic brain injury: a preliminary investigation. Neurosurg Focus. 2000;8(1):e5. doi: 10.3171/foc.2000.8.1.156 [DOI] [PubMed] [Google Scholar]
- 48.Bruns J Jr, Hauser WA. The epidemiology of traumatic brain injury: a review. Epilepsia. 2003;44(s10):2-10. doi: 10.1046/j.1528-1157.44.s10.3.x [DOI] [PubMed] [Google Scholar]
- 49.Ventura T, Harrison-Felix C, Carlson N, et al. Mortality after discharge from acute care hospitalization with traumatic brain injury: a population-based study. Arch Phys Med Rehabil. 2010;91(1):20-29. doi: 10.1016/j.apmr.2009.08.151 [DOI] [PubMed] [Google Scholar]
- 50.Brown AW, Leibson CL, Malec JF, Perkins PK, Diehl NN, Larson DR. Long-term survival after traumatic brain injury: a population-based analysis. NeuroRehabilitation. 2004;19(1):37-43. doi: 10.3233/NRE-2004-19105 [DOI] [PubMed] [Google Scholar]
- 51.Carlson KF, Barnes JE, Hagel EM, Taylor BC, Cifu DX, Sayer NA. Sensitivity and specificity of traumatic brain injury diagnosis codes in United States Department of Veterans Affairs administrative data. Brain Inj. 2013;27(6):640-650. doi: 10.3109/02699052.2013.771795 [DOI] [PubMed] [Google Scholar]
- 52.Warwick J, Slavova S, Bush J, Costich J. Validation of ICD-10-CM surveillance codes for traumatic brain injury inpatient hospitalizations. Brain Inj. 2020;34(13-14):1763-1770. doi: 10.1080/02699052.2020.1849801 [DOI] [PMC free article] [PubMed] [Google Scholar]
- 53.Wilmoth K, LoBue C, Clem MA, et al. Consistency of traumatic brain injury reporting in older adults with and without cognitive impairment. Clin Neuropsychol. 2018;32(3):524-529. doi: 10.1080/13854046.2017.1378371 [DOI] [PMC free article] [PubMed] [Google Scholar]
- 54.Kwako LE, Glass N, Campbell J, Melvin KC, Barr T, Gill JM. Traumatic brain injury in intimate partner violence: a critical review of outcomes and mechanisms. Trauma Violence Abuse. 2011;12(3):115-126. doi: 10.1177/1524838011404251 [DOI] [PubMed] [Google Scholar]
Associated Data
This section collects any data citations, data availability statements, or supplementary materials included in this article.
Supplementary Materials
eMethods 1. Atherosclerosis Risk in Communities Study Design and Protocols
eMethods 2. Covariates
eTable 1. Self-Reported Head Injury Questions
eTable 2. International Classification of Diseases, Ninth Revision (ICD-9) and Tenth Revision (ICD-10) Codes Used to Define Head Injury
eFigure 1. Complementary Log-Log Plot for Proportional Hazards Assumption
eFigure 2. Kaplan-Meier Curve for Cumulative Survival Among Individuals With and Without Head Injury in the Atherosclerosis Risk in Communities (ARIC) Study Population, 1987-2019
eTable 3. Adjusted Hazard Ratios (HRs) for Association Between Head Injury and All-Cause Mortality by Race
eTable 4. Adjusted Hazard Ratios (HRs) for Association Between Head Injury and All-Cause Mortality by Sex
eTable 5. Adjusted Hazard Ratios (HRs) for Association Between Head Injury and All-Cause Mortality by Baseline Age
eTable 6. Adjusted Hazard Ratios (HRs) for All-Cause Mortality by Number of Head Injuries
eTable 7. Adjusted Hazard Ratios (HRs) for All-Cause Mortality by Severity of Head Injuries
eTable 8. Adjusted Hazard Ratios (HRs) for All-Cause Mortality by Self-Report vs Hospital Report
Data Sharing Statement