

Abstract
BACKGROUND/OBJECTIVES:
Racial/ethnic and socioeconomic disparities are reported in sepsis, with increased mortality for minority and low SES groups; however, these studies rely on billing codes that are imprecise in identifying sepsis. Using a previously validated algorithm to detect pediatric sepsis using electronic clinical data, we hypothesized that racial/ethnic and SES disparities would be evident in this group.
METHODS:
We performed a retrospective study from a large quaternary academic center, including sepsis episodes from January 20, 2011 to May 20, 2021 identified by an algorithm indicative of bacterial infection with organ dysfunction (cardiac, respiratory, renal or hematologic). Multivariable logistic regression was used to measure association of race/ethnicity, insurance status and social disorganization index with the primary outcome of mortality, adjusting for age, sex, complex chronic conditions, organ dysfunction on day 1, source of admission, and time to hospital. Secondary outcomes were ICU admission, readmission, organ dysfunction-free days and sepsis therapies.
RESULTS:
Among 4,532 patient episodes, the mortality rate was 9.7%. There was no difference in adjusted odds of mortality based on race/ethnicity, insurance status, or social disorganization. There was no significant association between our predictors and ICU admission. Hispanic patients and publicly insured patients were more likely to be readmitted within one year (Hispanic OR 1.28 [1.06–1.5]; Public OR 1.19 [1.05–1.35]).
CONCLUSION:
Previously described disparities were not observed when using electronic clinical data to identify sepsis, however data were only single center. There were significantly higher readmissions in patients that were publicly insured or identified as Hispanic or Latino, which require further investigation.
Table of Contents Summary
This study describes an innovative approach to investigating disparities in pediatric sepsis by using clinical data from the electronic health record.
INTRODUCTION
Despite great medical advances, sepsis is consistently a significant cause of morbidity and mortality in children1–4. Previous investigations of sepsis have been limited because they often rely on the assignment of a billing code by a medical provider1,3,5 or inconsistent designations based on clinical data6,7. Recently, our large quaternary academic center was able to create a validated algorithm to identify infection with organ dysfunction using electronic health data to identify pediatric sepsis (Figure 1)8. The algorithm integrates components of the pediatric Sequential Organ Failure Assessment (pSOFA)9,10 with additional modifications taken from adult criteria and pediatric organ dysfunction score (Pediatric Logistic Organ Dysfunction 2 score)11,12. Use of this algorithm generates an objective cohort of pediatric sepsis patients, a foundation upon which we can investigate health disparities.
Figure 1:
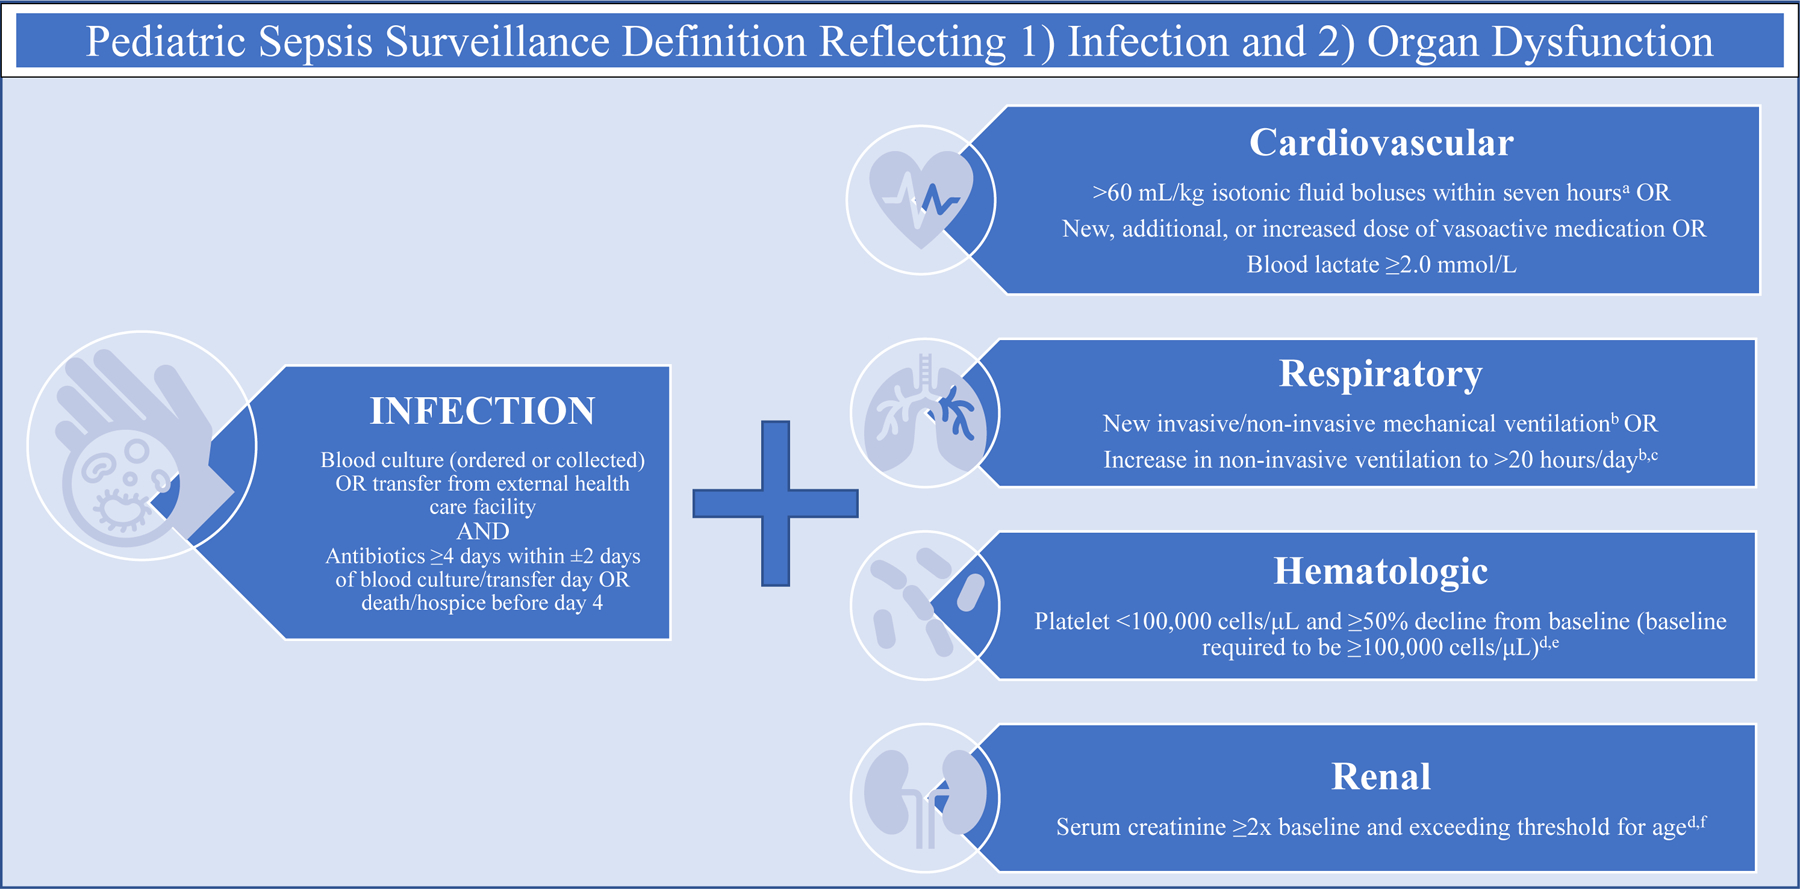
Surveillance Definition of Pediatric Sepsis Based on Electronic Clinical Health Data
Health disparities are defined as “differences in the quality of healthcare that are not due to access related factors or clinical needs, preferences and appropriateness of intervention”13. Identifying disparities in care and outcomes is crucial to decreasing morbidity/mortality and providing equitable care14.
Disparities in sepsis incidence and outcomes have been identified both in the adult15–19 and neonatal populations20–22. For example, non-White adults have almost double the incidence rate of sepsis16 and have higher rates of sepsis-related mortality when compared with White patients17. Lack of insurance is associated with increased risk of organ dysfunction at sepsis presentation and higher predicted in-hospital mortality in adults when compared to privately insured patients even after severity adjustment18.
Much less is known about disparities in younger populations, apart from data in the neonatal population and emerging pediatric studies. Thus far, neonatal data reveal Black race, lower household income, and uninsured status are associated with increased sepsis mortality20. Pediatric studies are limited, but prior investigation showed that both race23 and socioeconomic status24 were associated with increased risk of mortality. All these studies, however, are restricted by the use of billing codes to identify sepsis patients, which are known to have poor sensitivity and specificity, depending on which coding strategy is utilized5,7. In addition, diagnostic codes may miss episodes of clinical sepsis, which may reflect implicit provider bias.
The purpose of this study was to investigate whether racial/ethnic and/or socioeconomic disparities exist in a cohort of children with sepsis reliably and objectively defined by a validated electronic algorithm, using clinical data elements rather than sepsis billing codes. We hypothesized that non-White race, high social disorganization, and uninsured/public insured status would confer increased risk of mortality.
METHODS
Study Design
This was a retrospective study from a large quaternary academic center, including sepsis episodes from January 20, 2011 to May 20, 2021 identified by an algorithm indicative of bacterial infection with concurrent organ dysfunction. This study was deemed exempt research by our institutional review board (IRB20–018322).
Data Source
The sepsis algorithm was derived as part of an institutional program which links clinical and research data on more than two million patients. Infection was defined as a blood culture obtained (not necessarily positive) and administration of antibiotics for at least four days, similar to adult clinical definitions of sepsis25. This duration of antibiotics is meant to exclude patients for whom sepsis is suspected but “ruled out.” Organ dysfunction (Figure 1) was defined based on criteria for pediatric SOFA (pSOFA)9 with additional modifications taken from adult criteria and pediatric organ dysfunction score (Pediatric Logistic Organ Dysfunction 2 score)11,12. Most importantly, this approach reflects the Sepsis-3 definition of sepsis, which reframes sepsis as infection with associated increase of ≥2 points on the Sequential Organ Failure Assessment (SOFA) organ dysfunction score26. Not only does this approach identify a broader cohort of patients, but aligns with the efforts of pediatric medicine to mirror Sepsis-3.27 During its validation period, this algorithm had 84% sensitivity, 65% specificity (positive prediction value of 43% and negative prediction value of 93%) when compared to manual chart review8.
Study Population
All patients identified by algorithm above from January 20, 2011 to May 20, 2021 were included. No age limits were imposed, so as to fully represent the population seen at our center.
Patients with congenital heart disease admitted the cardiac center and neonatal intensive care unit (NICU) were excluded. For patients with more than one sepsis episode, we included only the most recent sepsis episode as their index episode. This approach ensured each patient was only represented once in the sample and maintained proximity to our primary outcome of mortality.
Exposures
The primary exposures were race/ethnicity, social disorganization index and insurance status. Race/ethnicity was categorized as Non-Hispanic White (NH-White), Non-Hispanic Black (NH-Black), Hispanic, and Other (inclusive of patients identifying as Asian, Native Hawaiian, Pacific Islander, American Indian, Alaskan Native or Multiracial). Race and ethnicity were self-reported by patients and entered into the electronic medical record. Insurance status (at time of presentation) was categorized as private, public, and self-pay. The social disorganization index was created based on patient home ZIP code and incorporates the following socioeconomic parameters using American Community Survey (ACS): overall unemployment, households receiving public assistance, low-income persons (<100% poverty level), low-income persons (100–149% poverty level), high school dropouts, female-headed households, renter-occupied houses, and moved households within the last three years. These parameters were linked to ZIP codes based on patient admission year, with admissions occurring in 2019–2021 linked to 2018 data due to data availability. To create the index, the parameters are summed and a Z-score is created based on the sum. Patients were then stratified into high or low social disorganization index, with low disorganization defined as quintiles 1 and 2 and high disorganization included quintiles 3–5. This index has been previously used to represent social determinants of health in prior literature 28–31.
In addition, we examined relevant patient- and encounter-level covariates. Patient-level covariates included age, gender, time to hospital (based on patient home ZIP code) and presence of complex chronic condition. Complex condition is coded using Feudtner et al’s complex chronic conditions categorization system, which refers to a comprehensive set of ICD codes that meet the following definition: “any medical condition that can be reasonably expected to last at least 12 months (unless death intervenes) and to involve either several different organ systems or one organ system severely enough to require specialty pediatric care and probably some period of hospitalization in a tertiary care center”32. Since there was no validated score of severity of illness across all patient settings (and since PELOD and pSOFA are intrinsically embedded in the sepsis criteria), we used number of organ dysfunctions on day 1 as a proxy. Organ dysfunction could be categorized as cardiovascular, respiratory, renal or hematologic, referring to the surveillance definition utilized in the sepsis identification algorithm (Figure 1). At the encounter level, we looked at source of admission to hospital as presenting at the emergency department, intensive care unit, inpatient floor, outside hospital or perioperative care.
Outcomes
The primary outcome was all-cause mortality during index sepsis episode. Secondary outcomes included ICU admission during index sepsis episode, readmission within year after hospital discharge (for any indication), hospital-free days at day 30, ICU-free days at day 30, organ dysfunction-free days at day 30 and use of sepsis therapies (vasopressor, steroids, transfusions, or ECMO).
Data Analysis
Standard descriptive statistics, n (%) and median (IQR), were used to summarize patient demographics, mortality, and other secondary outcomes. Our study was powered to detect an odds ratio of at least 1.3 with respect to mortality (similar to prior studies)23,24. Multivariable logistic regression was used to assess the association of race/ethnicity, insurance status, and social disorganization index with in-hospital mortality, adjusted for age, sex, presence of at least one chronic complex condition, number of organ dysfunctions on day 1, source of admission, and time to hospital. Pearson’s Chi-square test and Fisher’s exact test were used to measure the association between our exposures and the following binary secondary outcomes: ICU admission, readmission within 1 year of hospital discharge, and use of sepsis therapies (vasopressor, steroids, transfusions, or ECMO). Kruskal-Wallis rank sum test and Wilcoxon rank sum test were used to examine association between exposures and hospital-free days at day 30, ICU-free days at day 30, and organ dysfunction-free days at day 30. Post-hoc test Fisher test and Dunn test for multiple comparisons were applied to those outcomes with p value ≤ 0.05. Multiple comparison p-values were adjusted with the Benjamini-Hochberg method. Statistical analysis was completed using SAS 9.4 (SAS Institute Inc., Cary, NC, USA) and R (R core team 2019).
RESULTS
Among 7,288 total sepsis episodes, there were 4,532 unique patients represented. We subsequently described characteristics of each patient’s index episode (most recent episode), for which the mortality rate was 9.7% (Table 1). The median age was 7 (IQR 2–14) years with 44% identified as NH-White, 28% NH-Black, 14% Hispanic or Latino and 15% as Other. Roughly half (48%) were privately insured, with the remainder publicly insured (<1% self-pay/charity care). A majority of patients (76%) had the presence of at least one complex chronic condition. Nearly half of index sepsis episodes were identified in the emergency department (45%) with the remainder occurring in the ICU (16%), inpatient floors (16%), outside hospital transfers (19%) and perioperative settings (3.7%). The average time to hospital (from patient zip code) was 41 minutes, with patients who died having longer travel time (51 minutes compared to 40 minutes, p-value <0.001).
Table 1:
Demographic and Clinical Characteristics of Pediatric Sepsis Cohort Identified by Algorithm 2011–2021
| Characteristic | Overall, N = 4,532 | Died, N = 441 | Survived, N = 4,091 | p-value |
|---|---|---|---|---|
| Age | 0.007 | |||
| 0–5 years | 2,201 (49%) | 199 (45%) | 2,002 (49%) | |
| 6–11 years | 911 (20%) | 84 (19%) | 827 (20%) | |
| 12–17 years | 1,030 (23%) | 101 (23%) | 929 (23%) | |
| 18 years and older | 390 (8.6%) | 57 (13%) | 333 (8.1%) | |
| Sex | 0.507 | |||
| Female | 2,082 (46%) | 196 (44%) | 1,886 (46%) | |
| Male | 2,450 (54%) | 245 (56%) | 2,205 (54%) | |
| Race/Ethnicity | <0.001 | |||
| Non-Hispanic White | 1,975 (44%) | 212 (48%) | 1,763 (43%) | |
| Non-Hispanic Black | 1,269 (28%) | 94 (21%) | 1,175 (29%) | |
| Hispanic or Latino | 629 (14%) | 52 (12%) | 577 (14%) | |
| Other | 659 (15%) | 83 (19%) | 576 (14%) | |
| Complex Chronic Condition | ||||
| Malignancy | 692 (15%) | 137 (31%) | 555 (14%) | <0.001 |
| Hemaimmuno | 916 (20%) | 148 (34%) | 768 (19%) | <0.001 |
| Respiratory | 1,165 (26%) | 149 (34%) | 1,016 (25%) | <0.001 |
| Gastro | 1,611 (36%) | 185 (42%) | 1,426 (35%) | 0.003 |
| Metabolic | 1,213 (27%) | 221 (50%) | 992 (24%) | <0.001 |
| Neuromuscular | 1,722 (38%) | 267 (61%) | 1,455 (36%) | <0.001 |
| Cardiovascular | 1,101 (24%) | 248 (56%) | 853 (21%) | <0.001 |
| Renal | 510 (11%) | 61 (14%) | 449 (11%) | 0.072 |
| Other congenital | 727 (16%) | 77 (17%) | 650 (16%) | 0.398 |
| Number of Complex Chronic Conditions | <0.001 | |||
| None | 1,090 (24%) | 7 (1.6%) | 1,083 (26%) | |
| One | 852 (19%) | 52 (12%) | 800 (20%) | |
| Two or More | 2,586 (57%) | 382 (87%) | 2,204 (54%) | |
| Insurance Status | 0.742 | |||
| Private | 2,153 (48%) | 214 (49%) | 1,939 (47%) | |
| Public | 2,343 (52%) | 225 (51%) | 2,118 (52%) | |
| Self-pay/Charity | 36 (0.8%) | 2 (0.5%) | 34 (0.8%) | |
| Social Disorganization Index | 0.002 | |||
| Low | 1,816 (40%) | 207 (47%) | 1,609 (39%) | |
| High | 2,716 (60%) | 234 (53%) | 2,482 (61%) | |
| Source of Admission | <0.001 | |||
| ED | 2,054 (45%) | 74 (17%) | 1,980 (48%) | |
| ICU | 702 (16%) | 141 (32%) | 561 (14%) | |
| Inpatient | 745 (16%) | 67 (15%) | 678 (17%) | |
| OSH | 858 (19%) | 157 (36%) | 701 (17%) | |
|
| ||||
| Perioperative | 169 (3.7%) | 2 (0.5%) | 167 (4.1%) | |
|
| ||||
| Time to Hospital from Patient Zip Code (minutes) | 41 (23, 76) | 51 (27, 92) | 40 (23, 72) | <0.001 |
Compared to NH-White, the unadjusted odds of mortality were significantly lower for NH-Blacks (0.69 [0.52–0.91]), but not significantly different for Hispanics (0.76 [0.54–1.06]) and other races (1.21 [0.92–1.59]) (Table 2). There was no difference in odds of mortality based on insurance. Patients residing in ZIP codes with higher social disorganization had lower unadjusted odds of mortality (0.78 [0.63–0.98]). However, once adjusted for age, sex, presence of at least one complex chronic condition, organ dysfunction on day 1 and source of admission, there was no significant association between exposures and mortality. An additional adjusted model which included time to hospital also showed no significant association with mortality.
Table 2:
Logistic Regression Model of Mortality by Race/Ethnicity, Insurance Status, and Social Disorganization Index
| Without adjustment | With adjustment2 | With adjustment of time to hospital3 | |||||||
|---|---|---|---|---|---|---|---|---|---|
|
| |||||||||
| Characteristic | OR1 | 95% CI1 | p-value | OR1 | 95% CI1 | p-value | OR1 | 95% CI1 | p-value |
| Race ethnicity | |||||||||
| Non-Hispanic White | — | — | — | — | — | — | |||
| Non-Hispanic Black | 0.69 | 0.52, 0.91 | 0.010 | 0.81 | 0.60, 1.09 | 0.169 | 0.80 | 0.59, 1.08 | 0.142 |
| Hispanic or Latino | 0.76 | 0.54, 1.06 | 0.109 | 0.76 | 0.53, 1.09 | 0.140 | 0.76 | 0.53, 1.08 | 0.138 |
| Other | 1.21 | 0.92, 1.59 | 0.172 | 1.13 | 0.83, 1.54 | 0.432 | 1.13 | 0.83, 1.54 | 0.438 |
| Insurance status | |||||||||
| Private | — | — | — | — | — | — | |||
| Public | 1.19 | 0.96, 1.49 | 0.121 | 1.08 | 0.85, 1.36 | 0.534 | 1.07 | 0.85, 1.36 | 0.574 |
| Self-pay/Charity | 0.61 | 0.10, 2.03 | 0.498 | 0.88 | 0.13, 3.63 | 0.875 | 0.87 | 0.12, 3.60 | 0.866 |
| Social Disorganization Index | |||||||||
| Low | — | — | — | — | — | — | |||
| High | 0.78 | 0.63, 0.98 | 0.029 | 0.93 | 0.74, 1.18 | 0.568 | 0.94 | 0.75, 1.19 | 0.619 |
OR = Odds Ratio, CI = Confidence Interval
is adjusted with adjustment of categorical age, sex, presence of at least one chronic complex condition, organ dysfunction on day 1, and source of admission
is adjusted with adjustment of categorical age, sex, presence of at least one chronic complex condition, organ dysfunction on day 1, source of admission, and time to hospital
The sample size used for all models is 4526.
Bold values indicate p<0.05
Regarding admission rates, 68% required ICU admission during the sepsis episode and 50% were readmitted (for any reason) within one year (Table 3). NH-Black patients and those residing in ZIP codes with higher social disorganization index were more likely to be admitted to the hospital (p-value <0.001 for both, Table 3). There was no significant association between our predictors and ICU admission. Hispanic patients and publicly insured patients were more likely to be readmitted within one year (Hispanic 1.28 [1.06–1.55]; Public 1.19 [1.05–1.35]) whereas as patients classified as Other or Self Pay were less likely to be readmitted (Other 0.79 [0.66–0.96]; Self Pay 0.43 [0.19–0.9]).
Table 3:
Association of ICU admission, and Readmission within 1 year with Race/Ethnicity, Insurance Status, and Social Disorganization Index
| ICU admission (Overall N=4528) |
Readmission within 1 year (Overall N=4129) |
|||||||
|---|---|---|---|---|---|---|---|---|
|
| ||||||||
| Characteristic | No (N = 1,453, 32%) | Yes (N = 3,075, 68%) | OR (95% CI) | p-value | No (N=2,074, 50%) | Yes (N = 2,055, 50%) | OR (95% CI) | p-value* |
| Race ethnicity | 0.177 | <0.001 | ||||||
| Non-Hispanic White | 615 (31%) | 1,358 (69%) | 925 (50%) | 908 (50%) | ||||
| Non-Hispanic Black | 419 (33%) | 850 (67%) | 0.92 (0.79,1.07) | 568 (50%) | 576 (50%) | 1.03 (0.89, 1.20) | 0.679 | |
| Hispanic or Latino | 220 (35%) | 407 (65%) | 0.84(0.69, 1.01) | 246 (44%) | 310 (56%) | 1.28 (1.06, 1.55) | 0.024 | |
| Other | 199 (30%) | 460 (70%) | 1.05(0.87, 1.27) | 335 (56%) | 261 (44%) | 0.79 (0.66–0.96) | 0.024 | |
| Insurance status | 0.847 | <0.001 | ||||||
| Private | 699 (32%) | 1,453 (68%) | 1,038 (52%) | 946 (48%) | ||||
| Public | 742 (32%) | 1,598 (68%) | 1.04 (0.91–1.17) | 1,013 (48%) | 1,100 (52%) | 1.19 (1.05–1.35) | 0.011 | |
| Self-pay/Charity | 12 (33%) | 24 (67%) | 0.96 (0.49–2.00) | 23 (72%) | 9 (28%) | 0.43 (0.19–0.90) | 0.032 | |
| Social Disorganization Index | 0.224 | 0.500 | ||||||
| Low | 564 (31%) | 1,252 (69%) | 853 (51%) | 824 (49%) | ||||
| High | 889 (33%) | 1,823 (67%) | 0.92 (0.81, 1.05) | 1,221 (49%) | 1,231 (50%) | 1.04 (0.92, 1.18) | ||
Bold denotes significant values (p < 0.05)
Statistics presented: n (%)
Statistical tests performed: Pearson’s Chi-square test; Fisher’s exact test. Post-hoc test Fisher for multiple comparisons is shown in the following tables with p-values less than 0.05 and groups larger than 2 in the above table. Group Non-Hispanic White was compared with other groups of race/ethnicity separately, and group private was compared with other groups of insurance status separately.
p-values adjusted with the Benjamini-Hochberg method.
The sample size of ICU admission and Readmission within 1 year are 4528 and 4129 separately.
With respect to hospital-, ICU-, and organ dysfunction-free days (Table 4), NH-Black patients had significantly higher hospital-free and organ dysfunction-free days when compared to NH-White patients (NH-Black median hospital free days 20 [IQR 7.7–25.2] compared to NH-White days 19 [IQR 0–24.8], p-value=0.011; NH-Black median organ-dysfunction free days 27 [IQR 23–29] compared to NH-White days 27 [IQR 20–29], p-value=0.035). Hispanic patients had lower organ-dysfunction free days when compared to NH-White patients (Hispanic median organ-dysfunction free days 26 [IQR 18–29] compared to NH White days 27 [IQR 18–29], p-value=0.035).
Table 4:
Association of Hospital-, ICU-, and Organ Dysfunction-Free Days with Race/Ethnicity, Insurance Status and Social Disorganization Index
| Hospital Free Days at Day 30 (N=4510, 99.51%) | ICU Free Days at Day 30 (N=3232, 71.32%) |
Organ Dysfunction Free Days (N=4532, 100%) |
||||
|---|---|---|---|---|---|---|
| Median (IQR) | p-value* | Median (IQR) | p-value* | Median (IQR) | p-value* | |
| Overall | 18.9 (1.3, 24.9) | 25.3 (17.2, 27.9) | 27.0 (20.0, 29.0) | |||
| Race/Ethnicity | <0.001 | 0.348 | <0.001 | |||
| Non-Hispanic White | 19.0 (0.0, 24.8) | 25.2 (16.6, 27.9) | 27.0 (20.0, 29.0) | |||
| Non-Hispanic Black | 20.0 (7.7, 25.2) | 0.011 | 25.5 (19.0, 28.0) | 27.0 (23.0, 29.0) | 0.035 | |
| Hispanic | 17.1 (0.0, 24.2) | 0.142 | 25.2 (16.9, 28.0) | 26.0 (18.0, 29.0) | 0.035 | |
| Other | 17.5 (0.0, 24.8) | 0.410 | 25.4 (13.1, 28.0) | 27.0 (18.0, 29.0) | 0.070 | |
| Insurance Status | 0.009 | 0.020 | 0.014 | |||
| Private | 19.6 (2.4, 25.0) | 25.3 (17.2, 27.9) | 27.0 (20.0, 29.0) | |||
| Public | 18.1 (0.0, 24.6) | 0.05 | 25.2 (17.0, 28.0) | 1.00 | 27.0 (19.0, 29.0) | 0.06 |
| Self-pay | 23.2 (14.6, 25.6) | 0.06 | 28.2 (23.0, 29.3) | 0.01 | 29.0 (25.0, 30.0) | 0.06 |
| Social Disorganization Index | ||||||
| Low | 18.7 (0.0, 24.6) | 0.067 | 25.0 (14.7, 27.8) | <0.001 | 27.0 (19.0, 29.0) | 0.009 |
| High | 19.0 (2.3, 25.0) | 25.6 (18.4, 28.0) | 27.0 (20.8, 29.0) | |||
Statistics presented: Median (IQR) Statistical tests performed: Kruskal-Wallis rank sum test
Post-hoc test Dunn test for multiple comparisons are applied to those outcomes with p value <=0.05 and multiple groups larger than 2 in the above table, and multiple groups larger than 2. Group Non-Hispanic White was compared with other groups of race/ethnicity separately, and group private was compared with other groups of insurance status separately.
p-values for pair-wise comparisons adjusted with the Benjamini-Hochberg method
When investigating the association of our predictors with additional sepsis therapies (Table 5), there was significantly less vasopressor use in NH-Black and Hispanic patients (compared to 32.9% NH-White; NH-Black 27.5%, p-value= 0.005; Hispanic 28%, p-value=0.041) as well for those residing in ZIP codes with high social disorganization category (compared to low SDI 33.6%; high SDI 29.3%, p-value=0.003). There was also significantly less transfusion use in publicly insured patients compared to private (public 26.8%, p value=0.007). There were no significant differences in ECMO and steroid use amongst our predictors.
Table 5:
Association of Race/Ethnicity, Socioeconomic Status and Insurance Status and Sepsis Treatments
| Characteristic | Pressor | ECMO | Steroid | Transfusion | ||||||||
|---|---|---|---|---|---|---|---|---|---|---|---|---|
| Characteristic | No, N = 2,925 | Yes, N = 1,314 | p-value* | No, N = 4,475 | Yes, N = 53 | p-value* | No, N = 3,138 | Yes, N = 1,390 | p-value* | No, N = 3,230 | Yes, N = 1,298 | p-value* |
| Race ethnicity | 0.001 | 0.607 | 0.197 | 0.216 | ||||||||
| Non-Hispanic White | 1,248 (67.1%) | 613 (32.9%) | 1,952 (98.9%) | 21 (1.1%) | 1,396 (70.8%) | 577 (29.2%) | 1,384 (70.1%) | 589 (29.9%) | ||||
| Non-Hispanic Black | 860 (72.5%) | 327 (27.5%) | 0.005 | 1,251 (98.6%) | 18 (1.4%) | 868 (68.4%) | 401 (31.6%) | 932 (73.4%) | 337 (26.6%) | |||
| Hispanic or Latino | 413 (72.0%) | 161 (28.0%) | 0.041 | 622 (99.2%) | 5 (0.8%) | 435 (69.4%) | 192 (30.6%) | 450 (71.8%) | 177 (28.2%) | |||
| Other | 404 (65.5%) | 213 (34.5%) | 0.490 | 650 (98.6%) | 9 (1.4%) | 439 (66.6%) | 220 (33.4%) | 464 (70.4%) | 195 (29.6%) | |||
| Insurance Status | 0.372 | 0.204 | 0.280 | 0.006 | ||||||||
| Private | 1,378 (68.0%) | 648 (32.0%) | 2,123 (98.7%) | 29 (1.3%) | 1,499 (69.7%) | 653 (30.3%) | 1,489 (69.2%) | 663 (30.8%) | ||||
| Public | 1,522 (69.8%) | 657 (30.2%) | 2,317 (99.0%) | 23 (1.0%) | 1,610 (68.8%) | 730 (31.2%) | 1,712 (73.2%) | 628 (26.8%) | 0.007 | |||
| Self-pay/Charity | 25 (73.5%) | 9 (26.5%) | 35 (97.2%) | 1 (2.8%) | 29 (80.6%) | 7 (19.4%) | 29 (80.6%) | 7 (19.4%) | 0.201 | |||
| Social Disorganization Index | 0.003 | 0.942 | 0.716 | 0.116 | ||||||||
| Low | 1,131 (66.4%) | 572 (33.6%) | 1,795 (98.8%) | 21 (1.2%) | 1,253 (69.0%) | 563 (31.0%) | 1,272 (70.0%) | 544 (30.0%) | ||||
| High | 1,794 (70.7%) | 742 (29.3%) | 2,680 (98.8%) | 32 (1.2%) | 1,885 (69.5%) | 827 (30.5%) | 1,958 (72.2%) | 754 (27.8%) | ||||
Statistics presented: n (%) Statistical tests performed: Pearson’s Chi-square test; Fisher’s exact test.
Post-hoc test Fisher for multiple comparisons is shown in the following tables with p-values less than 0.05 and groups larger than 2 in the above table. Group Non-Hispanic White was compared with other groups of race/ethnicity separately, and group private was compared with other groups of insurance status separately.
*p-values for pair-wise comparisons adjusted with the Benjamini-Hochberg method
The sample size for pressor, ECMO, steroid and transfusion are 4239, 4528, 4528 and 4,528 separately.
DISCUSSION
Overall, this is a novel approach to study disparities in a cohort of clinically defined pediatric sepsis, which leverages the power and information of the electronic health record. The mortality rate of 9.7% is comparable to prior studies using billing/administrative codes1,2,4. In contrast to prior studies23,33, we did not observe a difference in mortality for Black or Hispanic/Latino patients. In fact, these patients had lower odds of mortality, though these were not statistically significant after adjusting for age, sex, complex chronic condition, organ dysfunction on day 1, source of admission, and time to hospital. Rather than presume that disparities do not exist, we thought it was important to highlight the community context of our patients and practice location, as well as acknowledge that our findings may not be generalizable to other geographic areas. Since the racial composition of our city is different from that observed in this cohort (namely that the county is approximately 45% NH-Black and 34% NH-White34, compared to our cohort of 28% and 44%, respectively), we wondered if our findings were skewed by sicker patients in surrounding counties (which are predominately NH-White) that were referred to our quaternary care center. That said, we adjusted for complex chronic condition and number of organ dysfunctions on day 1 in order to account for potential differences in severity of illness. It is also possible that the lower unadjusted odds of mortality for NH-Black and Hispanic patients is due to proximity to the hospital. It is well known in sepsis that rapid fluid resuscitation and antibiotics is key to survival; it may be that these patients were closer to the hospital (that additionally specializes in pediatrics), leading to quicker recognition and resuscitation. For this reason, an additional adjusted model including time to hospital was created (Table 2). This third model was nearly identical to the previous adjusted model, suggesting that time to hospital did not contribute significantly to mortality.
Additionally, we observed lower odds of mortality in patients residing in ZIP codes with high social disorganization, though this did not reach statistical significance when adjusted for age, sex, complex chronic condition, organ dysfunction on day 1, source of admission, and time to hospital. This is likely due to co-linearity between race/ethnicity and social disorganization index. Similar to the racial trends described above, we wondered if the patients with high social disorganization were representative of our urban environment and, again, the sicker patients were referred from the suburban areas surrounding the city. Along the same lines, these may be patients with higher medical complexity (over 75% of this cohort had one or more complex chronic conditions) for which our center was their medical home.
When investigating admission, ICU admission and readmission trends it is important to note that almost all patients required admission, conditional on the algorithm definition of sepsis including four or more days of antibiotics. The remaining patients either died prior to admission, were transferred elsewhere, or left against medical advice. An important limitation of the surveillance definition (Figure 1) is that patients who had a blood culture and died prior to admission were included as a sepsis episode, though in many cases the true cause of death may be unknown (i.e. cardiac arrest, sudden infant death syndrome, etc), but a blood culture was ordered as part of broad workup.
With regard to ICU admission, we did not observe any differences by race/ethnicity or socioeconomic status. We did, however, observe that publicly insured and Hispanic or Latino patients were more likely to be readmitted within 1 year. This raised questions of whether post-discharge instructions, care, or follow up is different for these groups. There are many prior studies which show increased readmissions for publicly or uninsured patients35–37. Conceivably, publicly insured patients may have different access to resources based on coverage or insurance status may just be a proxy for low socioeconomic status and barriers to post-discharge care (inability to pay for medications, lack of transportation to follow up visits, etc.). It is also possible that medically complex or technology dependent patients (who are more frequently readmitted) may be more likely to be publicly insured, though the data regarding insurance coverage of these patients is mixed38,39. With regard to the increased readmission of Hispanic patients, there may exist cultural or language barriers contributing to understanding of post-discharge care or anticipatory guidance, which may lead to readmission. However, ethnicity is poor proxy for English language proficiency and requires further investigation with a more specific variable representing English language proficiency. Prior studies have been mixed with regard to limited English proficiency as a risk factor for readmission 40–42. We did not find increased readmission rate in Black patients which has been previously documented 36,43. It is likely that this trend was not observed due to the aforementioned racial composition of our single center.
When we examined secondary outcomes related to severity of illness, namely hospital- and organ dysfunction-free days (Table 4) and additional sepsis therapies (Table 5), we did observe that there was significantly less pressor use in Black and Hispanic as well as in the high social disorganization group. This aligns with our prior observations that these patients may represent our local community acquired sepsis, who are potentially less sick when compared to patients that are referred from other facilities.
There are several limitations to this study, including its single-center and retrospective nature. Nonetheless, our approach allows for investigation of clinical sepsis identified by electronic algorithm, decreasing the bias associated with billing/coding databases. This study is additionally limited by small sample size. Prior studies, among national databases, were able to show more subtle differences in mortality due to larger sample size, which may be missed in our smaller group. Despite this limitation, our study was powered to detect an odds ratio of at least 1.3 with respect to mortality (similar to prior studies)23,24 and yields findings that can inform institutional and local practice. Lastly, we did not have reliable indicator of severity of illness to show whether there are differences in how sick minority or low SES children are, which may be a more appropriate outcome than mortality. That said, we did incorporate number of organ dysfunctions on day 1, ancillary sepsis therapies (vasopressor use, ECMO, etc.) as well as hospital- and organ dysfunction-free days, which can shed light on the severity of sepsis.
CONCLUSION
Previously observed racial/ethnic and socioeconomic disparities in mortality were not confirmed when sepsis was identified using electronic clinical data, however these results are not reflective of local or national trends due to the single center nature of the study. There were significantly higher hospital readmissions in patients that were publicly insured or identify as Hispanic or Latino, which require further investigation. This study illustrates an innovative approach to investigating racial/ethnic and socioeconomic disparities in pediatric sepsis, by capitalizing on an algorithm which identifies clinically defined sepsis. This approach alleviates bias embedded in retrospective studies using billing/coding data and can be used to identify populations with disparate outcomes, which can be used to inform local and/or institutional health equity efforts.
What’s Known on This Subject:
Emerging pediatric data shows racial/ethnic and socioeconomic disparities in sepsis care and outcomes. These studies rely heavily on sepsis defined by billing/administrative codes, which are imprecise in identifying pediatric sepsis.
What This Study Adds
This study investigates disparities in pediatric sepsis using a novel algorithm to identify clinical episodes of sepsis using electronic health data, in order to inform local and institutional health equity efforts.
Funding:
ARR is supported by NIH-funded training grant T32HL098054. JCF is supported by NIH K23119463.
Abbreviations:
- ACS
American Community Survey
- CHOP
Children’s Hospital of Philadelphia
- ECMO
Extracorporeal Membrane Oxygenation
- ICU
Intensive Care Unit
- NH
Non-Hispanic
- PELOD
Pediatric Logistic Organ Dysfunction
- pSOFA
Pediatric Sequential Organ Failure Assessment
- SES
Socioeconomic status
- SOFA
Sequential Organ Failure Assessment
Footnotes
Conflict of Interest: We have no conflicts of interest to disclose.
References
- 1.Balamuth F, Weiss SL, Neuman MI, et al. Pediatric Severe Sepsis in U.S. Children’s Hospitals* 2014;15(9):798–805. [DOI] [PMC free article] [PubMed] [Google Scholar]
- 2.Czaja AS, Zimmerman JJ, Nathens AB. Readmission and late mortality after pediatric severe sepsis. Pediatrics 2009;123(3):849–857. [DOI] [PubMed] [Google Scholar]
- 3.Ruth A, McCracken CE, Fortenberry JD, Hall M, Simon HK, Hebbar KB. Pediatric severe sepsis: current trends and outcomes from the Pediatric Health Information Systems database. Pediatric Critical Care Medicine 2014;15(9):828–838. [DOI] [PubMed] [Google Scholar]
- 4.Hartman ME, Linde-Zwirble WT, Angus DC, Watson RS. Trends in the epidemiology of pediatric severe sepsis*. Pediatric critical care medicine : a journal of the Society of Critical Care Medicine and the World Federation of Pediatric Intensive and Critical Care Societies 2013;14(7):686–693. [DOI] [PubMed] [Google Scholar]
- 5.Balamuth F, Weiss SL, Hall M, et al. Identifying Pediatric Severe Sepsis and Septic Shock: Accuracy of Diagnosis Codes. J Pediatr 2015;167(6):1295–1300.e1294. [DOI] [PMC free article] [PubMed] [Google Scholar]
- 6.Weiss SL, Fitzgerald JC, Maffei FA, et al. Discordant identification of pediatric severe sepsis by research and clinical definitions in the SPROUT international point prevalence study. Critical Care 2015;19(1):325. [DOI] [PMC free article] [PubMed] [Google Scholar]
- 7.Weiss SL, Parker B, Bullock ME, et al. Defining pediatric sepsis by different criteria: discrepancies in populations and implications for clinical practice. Pediatric critical care medicine : a journal of the Society of Critical Care Medicine and the World Federation of Pediatric Intensive and Critical Care Societies 2012;13(4):e219–226. [DOI] [PubMed] [Google Scholar]
- 8.Weiss SL, Balamuth F, Chilutti M, et al. Identification of Pediatric Sepsis for Epidemiologic Surveillance Using Electronic Clinical Data. Pediatric critical care medicine : a journal of the Society of Critical Care Medicine and the World Federation of Pediatric Intensive and Critical Care Societies 2020;21(2):113–121. [DOI] [PMC free article] [PubMed] [Google Scholar]
- 9.Matics TJ, Sanchez-Pinto LN. Adaptation and validation of a pediatric sequential organ failure assessment score and evaluation of the sepsis-3 definitions in critically ill children. JAMA pediatrics 2017;171(10):e172352–e172352. [DOI] [PMC free article] [PubMed] [Google Scholar]
- 10.Schlapbach LJ, Straney L, Bellomo R, MacLaren G, Pilcher D. Prognostic accuracy of age-adapted SOFA, SIRS, PELOD-2, and qSOFA for in-hospital mortality among children with suspected infection admitted to the intensive care unit. Intensive care medicine 2018;44(2):179–188. [DOI] [PMC free article] [PubMed] [Google Scholar]
- 11.Leclerc F, Duhamel A, Deken V, Grandbastien B, Leteurtre S. Can the pediatric logistic organ dysfunction-2 score on day 1 be used in clinical criteria for sepsis in children? Pediatric Critical Care Medicine 2017;18(8):758–763. [DOI] [PubMed] [Google Scholar]
- 12.Leteurtre S, Duhamel A, Salleron J, et al. PELOD-2: an update of the PEdiatric logistic organ dysfunction score. Critical care medicine 2013;41(7):1761–1773. [DOI] [PubMed] [Google Scholar]
- 13.Medicine I, Policy BHS, Care CUEREDH, Nelson AR Stith AY, Smedley BD. Unequal Treatment: Confronting Racial and Ethnic Disparities in Health Care National Academies Press; 2002. [PubMed] [Google Scholar]
- 14.Braveman PA, Kumanyika S, Fielding J, et al. Health disparities and health equity: the issue is justice. American journal of public health 2011;101(S1):S149–S155. [DOI] [PMC free article] [PubMed] [Google Scholar]
- 15.Martin GS, Mannino DM, Eaton S, Moss M. The epidemiology of sepsis in the United States from 1979 through 2000. New England Journal of Medicine 2003;348(16):1546–1554. [DOI] [PubMed] [Google Scholar]
- 16.Barnato AE, Alexander SL, Linde-Zwirble WT, Angus DC. Racial variation in the incidence, care, and outcomes of severe sepsis: analysis of population, patient, and hospital characteristics. American journal of respiratory and critical care medicine 2008;177(3):279–284. [DOI] [PMC free article] [PubMed] [Google Scholar]
- 17.Mayr FB, Yende S, Linde-Zwirble WT, et al. Infection rate and acute organ dysfunction risk as explanations for racial differences in severe sepsis. Jama 2010;303(24):2495–2503. [DOI] [PMC free article] [PubMed] [Google Scholar]
- 18.Baghdadi JD, Wong M, Comulada WS, Uslan DZ. Lack of insurance as a barrier to care in sepsis: A retrospective cohort study. Journal of Critical Care 2018;46:134–138. [DOI] [PubMed] [Google Scholar]
- 19.Galiatsatos P, Brigham EP, Pietri J, et al. The effect of community socioeconomic status on sepsis-attributable mortality. Journal of Critical Care 2018;46:129–133. [DOI] [PMC free article] [PubMed] [Google Scholar]
- 20.Bohanon FJ, Nunez Lopez O, Adhikari D, et al. Race, Income and Insurance Status Affect Neonatal Sepsis Mortality and Healthcare Resource Utilization. Pediatr Infect Dis J 2018;37(7):e178–e184. [DOI] [PMC free article] [PubMed] [Google Scholar]
- 21.Weston EJ, Pondo T, Lewis MM, et al. The burden of invasive early-onset neonatal sepsis in the United States, 2005–2008. Pediatr Infect Dis J 2011;30(11):937–941. [DOI] [PMC free article] [PubMed] [Google Scholar]
- 22.Cohen S, Doyle WJ, Turner RB, Alper CM, Skoner DP. Childhood socioeconomic status and host resistance to infectious illness in adulthood. Psychosomatic Medicine 2004;66(4):553–558. [DOI] [PubMed] [Google Scholar]
- 23.Mitchell HK, Reddy A, Montoya-Williams D, Harhay M, Fowler JC, Yehya N. Hospital outcomes for children with severe sepsis in the USA by race or ethnicity and insurance status: a population-based, retrospective cohort study. The Lancet Child & Adolescent Health 2021;5(2):103–112. [DOI] [PMC free article] [PubMed] [Google Scholar]
- 24.Reddy AR, Badolato GM, Chamberlain JM, Goyal MK. Disparities Associated with Sepsis Mortality in Critically Ill Children. Journal of Pediatric Intensive Care 2020. [DOI] [PMC free article] [PubMed] [Google Scholar]
- 25.Rhee C, Dantes R, Epstein L, et al. Incidence and Trends of Sepsis in US Hospitals Using Clinical vs Claims Data, 2009–2014. Jama 2017;318(13):1241–1249. [DOI] [PMC free article] [PubMed] [Google Scholar]
- 26.Singer M, Deutschman CS, Seymour CW, et al. The Third International Consensus Definitions for Sepsis and Septic Shock (Sepsis-3). JAMA 2016;315(8):801–810. [DOI] [PMC free article] [PubMed] [Google Scholar]
- 27.Schlapbach LJ. Time for Sepsis-3 in children? Pediatric Critical Care Medicine 2017;18(8):805–806. [DOI] [PubMed] [Google Scholar]
- 28.Byrnes HF, Miller BA, Morrison CN, Wiebe DJ, Woychik M, Wiehe SE. Association of environmental indicators with teen alcohol use and problem behavior: Teens’ observations vs. objectively-measured indicators. Health & place 2017;43:151–157. [DOI] [PMC free article] [PubMed] [Google Scholar]
- 29.Favilla E, Faerber JA, Hampton LE, et al. Early evaluation and the effect of socioeconomic factors on neurodevelopment in infants with tetralogy of Fallot. Pediatric cardiology 2021;42(3):643–653. [DOI] [PMC free article] [PubMed] [Google Scholar]
- 30.Leventhal T, Brooks-Gunn J. The neighborhoods they live in: the effects of neighborhood residence on child and adolescent outcomes. Psychological bulletin 2000;126(2):309. [DOI] [PubMed] [Google Scholar]
- 31.Min J, Griffis HM, Tam V, Meyers KE, Natarajan SS. Association of neighborhood-level social determinants and food environments with pediatric hypertension care. Health & Place 2020;65:102383. [DOI] [PubMed] [Google Scholar]
- 32.Feudtner C, Feinstein JA, Zhong W, Hall M, Dai D. Pediatric complex chronic conditions classification system version 2: updated for ICD-10 and complex medical technology dependence and transplantation. BMC Pediatrics 2014;14(1):199. [DOI] [PMC free article] [PubMed] [Google Scholar]
- 33.Melamed A, Sorvillo FJ. The burden of sepsis-associated mortality in the United States from 1999 to 2005: an analysis of multiple-cause-of-death data. Critical care 2009;13(1):1–8. [DOI] [PMC free article] [PubMed] [Google Scholar]
- 34.Bureau USC. QuickFacts: Philadelphia County, Pennsylvania 2020. [Google Scholar]
- 35.Jiang HJ, Wier LM. All-cause hospital readmissions among non-elderly medicaid patients, 2007: Statistical Brief# 89 2011. [PubMed] [Google Scholar]
- 36.Berry JG, Hall DE, Kuo DZ, et al. Hospital utilization and characteristics of patients experiencing recurrent readmissions within children’s hospitals. Jama 2011;305(7):682–690. [DOI] [PMC free article] [PubMed] [Google Scholar]
- 37.Gay JC, Hain PD, Grantham JA, Saville BR. Epidemiology of 15-day readmissions to a children’s hospital. Pediatrics 2011;127(6):e1505–e1512. [DOI] [PubMed] [Google Scholar]
- 38.Simon TD, Berry J, Feudtner C, et al. Children with complex chronic conditions in inpatient hospital settings in the United States. Pediatrics 2010;126(4):647–655. [DOI] [PMC free article] [PubMed] [Google Scholar]
- 39.Kuo DZ, Cohen E, Agrawal R, Berry JG, Casey PH. A national profile of caregiver challenges among more medically complex children with special health care needs. Archives of pediatrics & adolescent medicine 2011;165(11):1020–1026. [DOI] [PMC free article] [PubMed] [Google Scholar]
- 40.Ju M, Luna N, Park K. The effect of limited English proficiency on pediatric hospital readmissions. Hospital pediatrics 2017;7(1):1–8. [DOI] [PubMed] [Google Scholar]
- 41.López L, Rodriguez F, Huerta D, Soukup J, Hicks L. Use of interpreters by physicians for hospitalized limited English proficient patients and its impact on patient outcomes. Journal of general internal medicine 2015;30(6):783–789. [DOI] [PMC free article] [PubMed] [Google Scholar]
- 42.Karliner LS, Kim SE, Meltzer DO, Auerbach AD. Influence of language barriers on outcomes of hospital care for general medicine inpatients. Journal of hospital medicine 2010;5(5):276–282. [DOI] [PubMed] [Google Scholar]
- 43.Kenyon CC, Melvin PR, Chiang VW, Elliott MN, Schuster MA, Berry JG. Rehospitalization for childhood asthma: timing, variation, and opportunities for intervention. The Journal of pediatrics 2014;164(2):300–305. [DOI] [PubMed] [Google Scholar]