Abstract
Background
Preclinical studies have suggested that solid-state MRI markers of cortical bone porosity, morphologic structure, mineralization, and osteoid density are useful measures of bone health.
Purpose
To explore whether MRI markers of cortical bone porosity, morphologic structure, mineralization, and osteoid density are affected in postmenopausal osteoporosis (OP) and to examine associations between MRI markers and bone mineral density (BMD) in postmenopausal women.
Materials and Methods
In this single-center study, postmenopausal women were prospectively recruited from January 2019 to October 2020 into two groups: participants with OP who had not undergone treatment, defined as having any dual-energy x-ray absorptiometry (DXA) T-score of −2.5 or less, and age-matched control participants without OP (hereafter, non-OP). Participants underwent MRI in the midtibia, along with DXA in the hip and spine, and peripheral quantitative CT in the midtibia. Specifically, MRI measures of cortical bone porosity (pore water and total water), osteoid density (bound water [BW]), morphologic structure (cortical bone thickness), and mineralization (phosphorous [P] density [31P] and 31P-to-BW concentration ratio) were quantified at 3.0 T. MRI measures were compared between OP and non-OP groups and correlations with BMD were assessed.
Results
Fifteen participants with OP (mean age, 63 years ± 5 [SD]) and 19 participants without OP (mean age, 65 years ± 6) were evaluated. The OP group had elevated pore water (11.6 mol/L vs 9.5 mol/L; P = .007) and total water densities (21.2 mol/L vs 19.7 mol/L; P = .03), and had lower cortical bone thickness (4.8 mm vs 5.6 mm; P < .001) and 31P density (6.4 mol/L vs 7.5 mol/L; P = .01) than the non-OP group, respectively, although there was no evidence of a difference in BW or 31P-to-BW concentration ratio. Pore and total water densities were inversely associated with DXA and peripheral quantitative CT BMD (P < .001), whereas cortical bone thickness and 31P density were positively associated with DXA and peripheral quantitative CT BMD (P = .01). BW, 31P density, and 31P-to-BW concentration ratio were positively associated with DXA (P < .05), but not with peripheral quantitative CT.
Conclusion
Solid-state MRI of cortical bone was able to help detect potential impairments in parameters reflecting porosity, morphologic structure, and mineralization in postmenopausal osteoporosis.
© RSNA, 2023
Supplemental material is available for this article.
See also the editorial by Bae in this issue.
Summary
Solid-state MRI markers of cortical bone porosity, morphologic structure, and mineralization were associated with bone mineral density in postmenopausal women, and they helped detect impairments in bone quality associated with postmenopausal osteoporosis.
Key Results
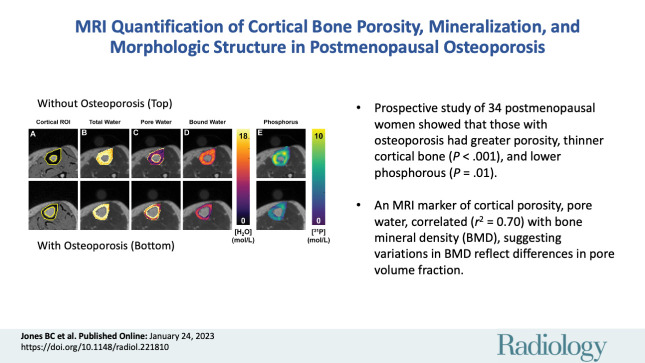
■ In a prospective study of 34 postmenopausal women, women with osteoporosis had elevated pore water (P < .001) and total water densities (P = .03), indicating greater porosity; thinner cortical bone (P < .001); and lower mineral phosphorous 31 concentration (P = .01).
■ An MRI marker of cortical porosity, pore water, explained 70% (r2 = 0.70) of the variation in bone mineral density (BMD) in the same tibia location, indicating that variations in BMD reflect differences in pore volume fraction.
Introduction
Osteoporosis (OP) is a health issue associated with 2 million annual fractures and more than $57 billion in fracture-related costs (1). The clinical standard of OP fracture risk prediction is bone mineral density (BMD), typically assessed with dual-energy x-ray absorptiometry (DXA) in the lumbar vertebrae and hip. However, DXA helps measure areal density and can neither differentiate cortical bone from trabecular bone nor distinguish between the structural and material properties that determine bone mechanical competence, which are the chief determinants of OP fracture risk (2,3). Cortical bone composes 80% of whole-body skeletal mass, and anti-OP medications can affect the two bone compartments differently (4–7). A recent prospective study (8) involving 7000 participants found that cortical bone measures of area and porosity were able to predict fracture independent of age, sex, height, weight, and BMD.
Several drugs are known to improve cortical bone microarchitecture (5–7). Whereas rapid remodeling in OP is known to reduce the degree of mineralization of bone (9), mineralization can be improved with treatment (10), which explains some treatment-related fracture reduction independent of BMD (11). Although cortical bone microarchitecture is usually measured with high-resolution CT, advances in solid-state MRI techniques of ultrashort echo time (UTE) and zero echo time sequences enabled quantification of previously undetectable signals in tissues with solid-like MRI properties (ie, short lifetime of excited spins) (12), similar to those from cortical bone water residing in pores (known as pore water) and water hydrogen-bonded to the osteoid (known as bound water [BW]) (13,14). Furthermore, whereas quantification of degree of mineralization of bone was previously possible only with biopsy, phosphorus (P) density (31P) solid-state MRI was shown to image bone mineral in human wrists (15) and, recently, actual 31P densities were reported in the tibia (16). Pore water, a measure of porosity, was shown in cadaver studies to predict bone strength (17–19) and density (17–20). BW, a measure of osteoid density, is related to bone’s post-yield properties (18,19). 31P MRI quantification was shown to be reduced in ovariectomized rats but improved after treatment with alendronate (21). Finally, simultaneous measurement of 31P and BW can yield a noninvasive marker for degree of mineralization of bone (ie, the ratio of mineral to osteoid densities, found with the 31P-to-BW ratio) (22).
The purpose of our study was to explore whether MRI markers of cortical bone porosity, morphologic structure, mineralization, and osteoid density are impacted in postmenopausal OP and to examine associations between MRI markers and BMD in postmenopausal women.
Materials and Methods
Study Participants
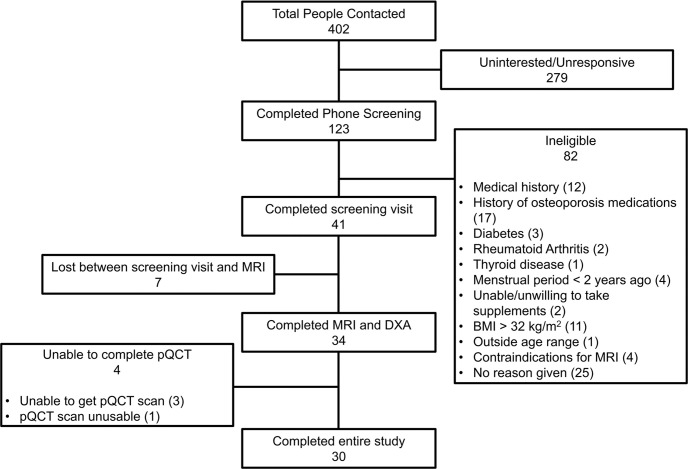
Our prospective study was performed at the Hospital of the University of Pennsylvania (Philadelphia, Pa) and was compliant with Health Insurance Portability and Accountability Act and institutional review board regulations. Written informed consent was received before the procedures. Eligible participants were postmenopausal women aged 50–75 years with more than 2 years since their last menstrual period. Exclusion criteria were current or previous use of medications known to affect bone mineral homeostasis (eg, bisphosphonates, denosumab, glucocorticoids); contraindication for MRI (implant or disability precluding MRI); body mass index, calculated as weight in kilograms divided by height in meters squared, greater than 32; hysterectomy; daily consumption of more than three alcoholic beverages; and presence or history of other diseases affecting bone health (Appendix S1). OP was defined as a DXA BMD T-score of −2.5 or less in any location. Thirty-four postmenopausal women were enrolled into two groups: 15 women with OP who had not undergone treatment and 19 reference participants who were age-matched, healthy, and without OP (Fig 1).
Figure 1:
STROBE flow chart diagram for the study. BMI = body mass index, DXA = dual-energy x-ray absorptiometry, pQCT = peripheral quantitative CT.
Quantification at MRI
We performed MRI with a 3-T MRI unit (TIM Trio; Siemens) using a custom-built transmit-receiver hydrogen-phosphorous (1H, 127.7 MHz; 31P, 51.7 MHz) dual-tuned birdcage coil (Rapid Biomedical). The complete protocol was approximately 50 minutes and included scout examinations and 31P flip-angle calibration followed by two UTE and one zero echo time examinations. MRI was centered on the tibia at the 38% diaphyseal line from the medial malleolus (16). Bone water was quantified by 1H UTE MRI, whereas phosphorus density was quantified at 31P zero echo time MRI. The imaging techniques were described previously (16,22–24). For all MRI quantifications, manual segmentation of the periosteum and endosteum was performed (B.C.J., with 6 years of experience), and the MRI markers were automatically quantified with a custom code based on our described equations and methods (16). Full details of the pulse sequence, scan parameters, reference sample characteristics, relaxation parameters, image segmentation, and quantification methods are provided in Appendix S1.
Bone morphologic quantification.—Two morphologic biomarkers were computed on the basis of image segmentation: Cortical bone thickness was computed by modeling the periosteum and endosteum as concentric circles (20), and cortical area fraction was computed as the ratio of the area of the cortical bone to the area bounded by the periosteum.
Bone water quantification.—Absolute concentrations in moles per liter and voxelwise parametric maps of cortical bone water were calculated by referencing the cortical bone signal with that of a nearby reference sample of known water concentrations by using the following equation (23):
 |
where C is the molar concentration of cortical bone water (total water and BW, respectively) or reference sample; Cbone is the molar concentration of cortical bone water in the bone; C ref is the reference molar concentration of cortical bone water; I is the image intensity within the bone or reference sample; TE is echo time; T2* is the effective transverse relaxation time; and Fref and Fbone are mapping functions representing the fractions of the magnetization detected in the reference sample and bone, respectively, when the radiofrequency pulse duration is comparable or longer than T2* (23). Relaxation parameters were obtained from previous studies (16,25,26). Total water was computed from the UTE images and BW from the inversion recovery rapid UTE images, which together yielded voxelwise pore water as the difference of total water minus BW (16).
Bone mineralization quantification.—Molar quantification of bone phosphorus was similarly performed by using the Equation based on known relaxation parameters of phosphorus in bone and reference samples (16,24). To overcome the four orders of magnitude lower signal-to-noise ratio for 31P relative to 1H, single values of molar concentration of 31P in the bone (C bone in Equation) and the reference molar concentration of 31P (C ref in Equation) were computed in each participant by complex summing across 18 contiguous sections. The 31P-to-BW concentration ratio was then used as a surrogate for degree of mineralization of bone (22). Details of the signal-to-noise ratio derivation and phosphorus quantification are provided in Appendix S1.
Radiography procedures.—Total hip, femoral neck, and posteroanterior lumbar spine (L1–L4) areal BMD were measured using DXA (Hologic) in the array mode with standard position protocols. Participant classification as OP was determined based on a T-score of −2.5 or less at any measurement site.
Cortical bone volumetric BMD in the left tibia was measured at contrast-unenhanced peripheral quantitative CT (12–detector row CT; Stratec XCT 2000) with axial sections at the 38% diaphyseal site. Scanning parameters were as follows: pixel size, 0.4 × 0.4 mm; section thickness, 2.3 mm; and scanning speed, 25 mm/sec, resulting in 12.5-mrem radiation. Images were processed using software (Stratec version 6.00; N.K.).
Statistical analysis.—Normality of each parameter was assessed using the Shapiro-Wilk test. Correlations were assessed using Pearson coefficient for normal distributions and Spearman coefficient for nonnormal distributions. Similarly, group differences were assessed with unpaired t tests for normal and Wilcoxon rank sum tests for nonnormal distributions. All statistical analyses were performed by using statistical software (JMP Statistical Discovery Software version 16.0; SAS Institute). P values less than .05 indicated statistical significance (B.C.J.; C.S.R., with 25 years of experience; and N.K., with 6 years of experience).
Results
Participant Characteristics
Fifteen women who had not undergone treatment for OP (mean age, 65 years ± 6 [SD]; mean body mass index, 23.1 ± 3.1) and 19 age-matched healthy reference participants without OP (hereafter, non-OP; mean age, 63 years ± 5; mean body mass index, 26.8 ± 3.4) were recruited. All 34 women enrolled in the study underwent both DXA and MRI. There were four women who were either unable to undergo peripheral quantitative CT or in whom the data were deemed unusable by the radiographers, thus leaving 30 women who underwent and completed all imaging experiments (Fig 1).
There was no evidence of any differences between the OP and non-OP groups in terms of age, height, or weight; however, body mass index was greater in the reference group (P = .003) (Table 1). The average DXA T-scores were lower in the OP than in the non-OP group (P < .003) because the classification of OP was made based on DXA T-scores of −2.5 or less at any location.
Table 1:
Demographics for Groups with and without Osteoporosis
MRI Measures Distinguishing Women with OP and Non-OP
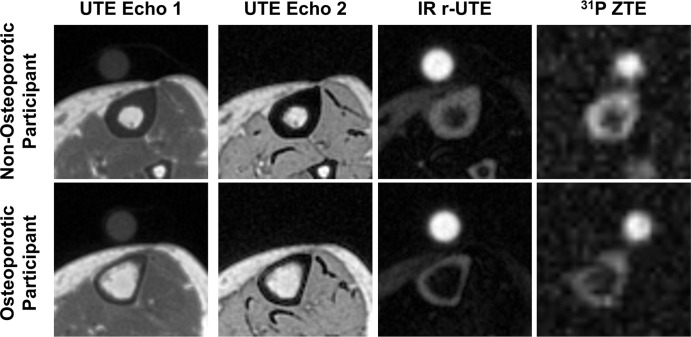
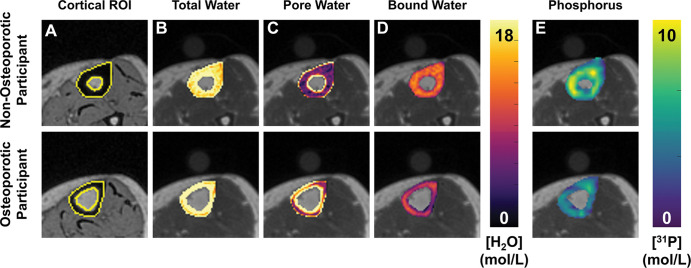
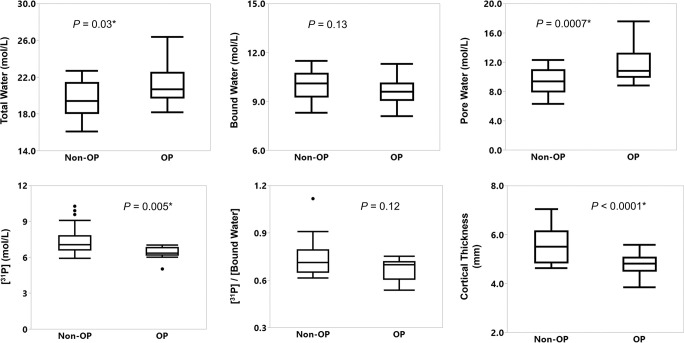
Representative MRI scans in the tibia in a participant with OP and non-OP are shown on Figure 2. Corresponding cortical segmentations and overlaid color maps are provided for the same two women on Figure 3. Figure 4 shows box plots comparing MRI parameters between groups, and Table 2 summarizes the statistics for the group differences. The OP group had an elevated total water and pore water density compared with the non-OP group (mean total water, 21.2 mol/L ± 2.1 vs 19.7 mol/L ± 1.9, respectively [P = .03]; mean pore water, 11.6 mol/L ± 2.3 vs 9.5 mol/L ± 1.9, respectively [P = .007]). The OP group showed lower mineral content (31P, 6.3 mol/L [IQR, 0.6 mol/L] vs 7.1 mol/L [IQR, 1.2 mol/L], respectively; P = .005) and lower morphologic markers of cortical bone thickness and cortical area fraction (mean cortical bone thickness, 4.8 mm ± 0.5 vs 5.6 mm ± 0.7, respectively [P < .001]; mean cortical area fraction, 0.69 ± 0.06 vs 0.75 ± 0.05, respectively [P = .007]). BW and 31P-to-BW concentration ratio did not differ between OP and non-OP groups (P = .13 and .12, respectively).
Figure 2:
Representative MRI axial magnitude scans for each noncontrast sequence compared between a 70-year-old woman with osteoporosis (OP; osteoporotic participant) and a 62-year-old woman without OP (non-osteoporotic participant). The circular structure above the tibia is the calibration reference sample that converts signal intensities to absolute concentrations. The sample concentrations and relaxation times are approximately matched to those of the bone water properties and are therefore not visible on the ultrashort echo time (UTE) echo 2 image. The UTE images in the participant with OP exhibit the characteristic cortical thinning from periosteal expansion and endosteal resorption. The phosphorous 31 (31P) zero–echo time (ZTE) image indicates a general reduction in the phosphorus signal in the OP subject. IR = inversion recovery, r-UTE = rapid UTE.
Figure 3:
Representative cortical segmentation and quantitative parametric color maps overlaid on ultrashort echo time (UTE) images for the same women pertaining to Figure 2. (A) Yellow boundaries depict manually drawn contours of cortical bone overlaid on a UTE echo 2 image, which has strong bone-tissue contrast. Color maps for each MRI parameter, (B) total water, (C) pore water, (D) bound water, and (E) phosphorous, are overlaid on UTE echo 1 images. ROI = region of interest.
Figure 4:
Box and whisker plots show comparison of means between the groups with osteoporosis (OP) and without OP (non-OP). OP was diagnosed with a dual-energy x-ray absorptiometry (DXA) T-score of –2.5 or less at the measurement location. Boxes represent median and IQR. Outliers (ie, individual data >1.5 IQRs outside of the first or third quartile) are represented by dots. Whiskers extend to the maximum and minimum data points unless there are outliers; in that case, the whiskers extend 1.5 IQRs beyond the boxes. * P value less than .05.
Table 2:
Imaging Parameters Compared between Groups with and without Osteoporosis
Associations between MRI Parameters and DXA
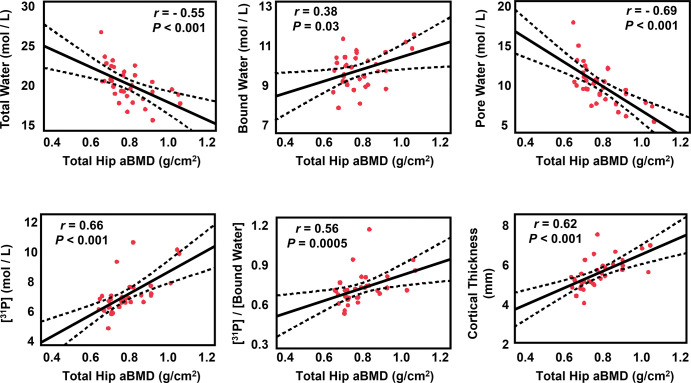
MRI parameters were compared with DXA-derived total hip, femoral neck, and total lumbar areal BMD values as the accepted clinical standard for OP assessment. Figure 5 depicts correlations between DXA-derived total hip areal BMD and MRI parameters, and Table S1 summarizes all correlations between MRI markers and BMD. DXA-derived total hip areal BMD and femoral neck areal BMD were both associated with all MRI parameters (all P < .05). Total hip areal BMD was negatively correlated with total water (r = −0.55; P < .001) and pore water (r = −0.69; P < .001), which supports that pore water is a measure of pore space in bone and that much of the free water in bone resides in pore spaces (16). Total hip areal BMD was positively associated with BW (r = 0.38; P = .03), 31P concentration (r = 0.66; P < .001), 31P-to-BW concentration ratio (r = 0.56; P < .001), cortical bone thickness (r = 0.62; P < .001), and cortical area fraction (r = 0.52; P = .002), which suggests that greater areal density is associated with greater mineralization and overall bone size (2). Similar to the total hip values, femoral neck areal BMD was negatively associated with total water (r = −0.45; P = .008) and pore water (r = −0.58; P < .001), and femoral neck areal BMD correlated positively with BW (r = 0.37; P = .03), 31P density (r = 0.54; P < .001), 31P-to-BW concentration ratio (r = 0.42; P = .01), cortical bone thickness (r = 0.54; P < .001), and cortical area fraction (r = 0.47; P = .006). Most MRI parameters showed analogous but weaker relationships to lumbar areal BMD. That observation is because the lumbar spine is more trabecular and has a smaller fraction of cortical bone. Specifically, total lumbar areal BMD was negatively associated with total water (r = −0.37; P = .03) and pore water (r = −0.47; P = .004) but positively with BW (r = 0.35; P = .04), 31P concentration (r = 0.44; P = .009), 31P-to-BW concentration ratio (r = 0.34; P = .04), and cortical bone thickness (r = 0.44; P = .01).
Figure 5:
Associations between MRI markers and dual-energy x-ray absorptiometry (DXA)-derived total hip areal bone mineral density (aBMD). The solid line is the best fit and the dotted lines are the 95% CIs for the regression line. Total and pore water are negatively correlated with density values. The red dots indicate each participant's data.
Correlations between MRI Parameters and Tibial Peripheral Quantitative CT Volumetric BMD
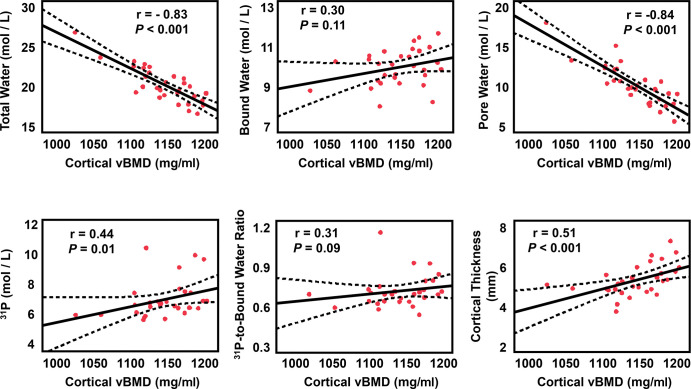
MRI parameters were also compared with peripheral quantitative CT–derived volumetric BMD values as the reference standard for same region of the midtibia, where the MRI parameters were assessed. Figure 6 depicts correlations between volumetric BMD and MRI markers derived at peripheral quantitative CT. Volumetric BMD derived at peripheral quantitative CT showed strong inverse relationships with total water (r = −0.83; P < .001) and pore water (r = −0.84; P < .001), which indicates that lower mineral density is generally the result of expanded pore space. Furthermore, peripheral quantitative CT–derived volumetric BMD was positively associated with mineral 31P concentration (r = 0.44; P = .01) and with both morphologic markers (cortical bone thickness, r = 0.51 [P < .001]; and cortical area fraction, r = 0.52 [P < .001]). There were no relationships found between volumetric BMD and BW (P = .11) or 31P-to-BW concentration ratio (P = .09).
Figure 6:
Correlations of MRI biomarkers versus tibia peripheral quantitative CT volumetric bone mineral density (vBMD). The solid bold black line is best fit and dotted lines are 95% CIs for the line of best fit. Red dots are each participant's data. Total and pore water are negatively correlated with density values.
Relationships between Measured MRI Parameters
Correlations between all MRI parameters are shown in Table S2. Total water showed a strong positive relationship with pore water (r = 0.92) because intersubject differences in total water are driven by differences in fractional pore size (16). Pore water was weakly inversely related to BW (r = −0.38; P = .009) and 31P (r = −0.44; P = .03), which is supported by the hypothesis that intracortical pore expansion occurs at the expense of loss of osteoid and mineral (16). BW was weakly positively associated with 31P (r = 0.42; P = .01), which can be explained by greater osteoid density, resulting in more potential locations for mineral apposition (9). Finally, the positive association between 31P and 31P-to-BW concentration ratio (r = 0.68; P < .001) is consistent with the hypothesis that more highly mineralized bone would also have a greater overall mineral content. Conversely, bone with high turnover would tend to be unable to fully mineralize the osteoid before resorption occurs, resulting in both lower 31P and lower degree of mineralization of bone. Overall, the statistically significant, albeit weak, relationships between the MRI parameters suggest that we are measuring separate but related markers of bone quality.
Discussion
Preclinical studies have suggested that solid-state MRI markers of cortical bone porosity, morphologic structure, and mineralization can independently probe the multifaceted contributors to cortical bone health, in contrast to dual-energy x-ray absorptiometry, which measures a single aggregated whole-bone density. In this preliminary study in postmenopausal women, MRI markers helped detect impairments in cortical bone quality associated with osteoporosis (OP), and all markers were associated with bone mineral density (BMD). Specifically, OP was associated with elevated porosity (P = .007) and lower mineral content (P = .01) and cortical bone thickness (P < .001). Furthermore, porosity markers were negatively correlated with BMD (P < .001), whereas mineralization and morphologic markers were positively correlated with BMD (P < .001), supporting the technical validity that these measures can potentially evaluate bone quality in vivo.
Cortical bone water was previously shown to be impaired with aging and bone disease. Total water was found to be both inversely associated with volumetric BMD (27) and elevated with menopause and with renal osteodystrophy (23). Manhard et al (14) subsequently demonstrated high precision in assessing bone water in vivo. Recently, the porosity index, which is related to pore water density (20), was found to be associated with chronic kidney disease stage and renal biomarkers (28). Finally, lumbar spine BW was positively associated with volumetric BMD and had a high area under the curve in diagnosing OP (29). In line with some of these observations, this study demonstrated that porosity markers of pore water and total water were elevated in postmenopausal women with OP compared with age-matched control participants (pore water, P = .007; total water, P = .03). Importantly, pore water explained 70% (r2 = 0.70) of the variation in volumetric BMD in the same tibia location, indicating that variations in BMD reflect differences in pore volume fraction. However, although BW was positively associated with BMD at DXA, there was no intergroup difference. Considering previously reported BW values of 10.4 ± 0.8 in young, healthy people (16) versus 9.6 ± 0.8 in the OP group, interparticipant variability in tibia osteoid density is likely too small to be detectable.
Along with elevated porosity, OP also adversely affects cortical bone morphologic structure, which manifests as endosteal resorption outpacing periosteal expansion (3). Indeed, our study found OP to be associated with lower cortical bone thickness (P < .001) and cortical area fraction (P = .007). Similarly, cortical bone morphologic structure and porosity parameters derived from high-resolution peripheral quantitative CT had previously been shown to be associated with incident fracture, independent of age, sex, height, weight, and BMD at DXA (8,30). Because cortical bone strength and fracture risk are determined by cortical bone structure and its composition (2,3), a comprehensive assessment of cortical bone health would likely combine measures of both morphologic structure and porosity.
Quantification of cortical bone parameters is particularly relevant because the treatment response to anti-OP medications can differ between trabecular and cortical bone (4–7). Whereas antiresorptives lower cortical bone porosity and increase thickness, and anabolic agents improve trabecular quality, there is evidence that anabolic treatment increases cortical bone porosity and reduces cortical bone thickness (4–7). Additionally, because anabolic agents increase bone turnover, long-term treatment likely reduces degree of mineralization of bone (9). Some studies have found that sequential or simultaneous treatment with both anabolics and bisphosphonates improves bone quality more than either treatment alone (6,7). However, because treatment guidelines limit some anabolic agents to 2 years and some bisphosphonates to 3–5 years (6), and OP is a long-term systemic bone disorder, the optimal treatment course for sustained antifracture efficacy remains an open question. Advanced imaging methods that help to comprehensively assess both cortical and trabecular compartments could further our understanding of OP treatments.
Solid-state MRI quantification of 31P has shown promise in preclinical studies. MRI 31P assessment differentiated between normal and hypophosphatemic rabbits and was correlated with degree of mineralization of bone and bone strength (31). Similarly, MRI 31P was reduced in ovariectomized rats but improved with bisphosphonate treatment (21). Whereas 31P MRI was previously demonstrated in vivo (15,32), actual mineral densities were only reported recently (16). Our study builds on these findings and, to our knowledge, it is the first to investigate 31P MRI in degenerative bone disease. 31P density was shown to be lower in women with OP (P = .01) and to be positively associated with BMD (P < .001).
Our proposed protocol may provide pathophysiologic insights into bone disorders other than OP. Osteomalacia is a demineralization disorder that requires a biopsy for diagnosis because DXA is unable to help distinguish it from OP (33). Direct 31P quantification could thus provide a means for noninvasive diagnosis (22). Similarly, type 2 diabetes mellitus is characterized by normal-to-elevated BMD even though these patients have increased risk of fractures because of greater cortical bone porosity and abnormal mineralization and collagen glycation (34). Thus, quantifying 31P-to-BW concentration ratio as a surrogate of degree of mineralization of bone could provide insights into mineralization changes from bone turnover, disease, or antiresorptive treatment (9,22).
Our study had some limitations. First, this preliminary study was limited in size, and therefore could not account for all confounders such as lower body mass index in the OP group. Second, the main outcomes in this study were MRI variables and the association between these imaging parameters and meaningful clinical outcomes such as fractures remains to be tested. Third, 31P imaging requires specialized hardware in the form of custom-built radiofrequency coils, and the currently achievable signal-to-noise ratio is marginal. Fourth, manual segmentation of cortical bone is laborious and not practical in the clinical setting. This shortcoming could be alleviated with the use of machine learning for automatic segmentation (35). Fifth, a calibration sample is needed to scale signal to absolute concentrations in moles per liter. Sixth, although the most devastating OP fractures occur at the femur, we elected to image the tibia for technical reasons because the dense cortex and superficial location provide superior signal-to-noise ratio, thereby facilitating phosphorus quantification. However, because of the systemic nature of OP and because both locations were load bearing, the mechanical and structural properties of the two sites should parallel each other, and image-based measurements in the tibia are associated with fracture risk (8).
In conclusion, solid-state MRI was able to help detect impairment in cortical bone porosity, morphologic structure, and mineralization in participants with postmenopausal osteoporosis. Future work should investigate these markers in larger groups to determine if they can detect changes in bone health following pharmacologic treatment.
Current addresses: School of Electronics Engineering, Kyungpook National University, Daegu, Korea.
Department of Computer Science and Engineering, National Sun Yat-sen University, Kaohsiung, Taiwan, Republic of China.
Study supported by the National Institutes of Health (R01 AR050068, T32 EB020087, and F31 AR079925).
Data sharing: Data generated or analyzed during the study are available from the corresponding author by request.
Disclosures of conflicts of interest: B.C.J. No relevant relationships. H.L. No relevant relationships. C.C.C. No relevant relationships. M.a.M. Funding from Ipsen/Clementia, Incyte; funding from Regeneron; honoraria from Excel, Catalyst; support for meetings from Cooley Anemia Foundation, International Clinical Counsel on Fibrodysplasia Ossificans Progressiva (FOP), International Fibrodysplasia Ossificans Progressiva Association (IFOPA); advisory board member for Biocryst and IFOPA; member of the International Clinical Council on FOP. H.K.S. No relevant relationships. P.J.S. No relevant relationships. N.K. No relevant relationships. C.S.R. No relevant relationships. F.W.W. No relevant relationships.
Abbreviations:
- BMD
- bone mineral density
- BW
- bound water
- DXA
- dual-energy x-ray absorptiometry
- OP
- osteoporosis
- UTE
- ultrashort echo time
References
- 1. Lewiecki EM , Ortendahl JD , Vanderpuye-Orgle J , et al . Healthcare Policy Changes in Osteoporosis Can Improve Outcomes and Reduce Costs in the United States . JBMR Plus 2019. ; 3 ( 9 ): e10192 . [DOI] [PMC free article] [PubMed] [Google Scholar]
- 2. Bouxsein ML . Technology insight: noninvasive assessment of bone strength in osteoporosis . Nat Clin Pract Rheumatol 2008. ; 4 ( 6 ): 310 – 318 . [DOI] [PubMed] [Google Scholar]
- 3. Seeman E , Delmas PD . Bone quality--the material and structural basis of bone strength and fragility . N Engl J Med 2006. ; 354 ( 21 ): 2250 – 2261 . [DOI] [PubMed] [Google Scholar]
- 4. Seeman E . Age- and menopause-related bone loss compromise cortical and trabecular microstructure . J Gerontol A Biol Sci Med Sci 2013. ; 68 ( 10 ): 1218 – 1225 . [DOI] [PubMed] [Google Scholar]
- 5. Hansen S , Hauge EM , Beck Jensen JE , Brixen K . Differing effects of PTH 1-34, PTH 1-84, and zoledronic acid on bone microarchitecture and estimated strength in postmenopausal women with osteoporosis: an 18-month open-labeled observational study using HR-pQCT . J Bone Miner Res 2013. ; 28 ( 4 ): 736 – 745 . [DOI] [PubMed] [Google Scholar]
- 6. Kanis JA , Cooper C , Rizzoli R , Reginster JY ; Scientific Advisory Board of the European Society for Clinical and Economic Aspects of Osteoporosis (ESCEO) and the Committees of Scientific Advisors and National Societies of the International Osteoporosis Foundation (IOF). European guidance for the diagnosis and management of osteoporosis in postmenopausal women . Osteoporos Int 2019. ; 30 ( 1 ): 3 – 44 . [Published correction appears in Osteoporos Int 2020;31(1):209.] [DOI] [PMC free article] [PubMed] [Google Scholar]
- 7. Tsai JN , Nishiyama KK , Lin D , et al . Effects of Denosumab and Teriparatide Transitions on Bone Microarchitecture and Estimated Strength: the DATA-Switch HR-pQCT study . J Bone Miner Res 2017. ; 32 ( 10 ): 2001 – 2009 . [Published correction appears in J Bone Miner Res 2019;34(5):976.] [DOI] [PubMed] [Google Scholar]
- 8. Samelson EJ , Broe KE , Xu H , et al . Cortical and trabecular bone microarchitecture as an independent predictor of incident fracture risk in older women and men in the Bone Microarchitecture International Consortium (BoMIC): a prospective study . Lancet Diabetes Endocrinol 2019. ; 7 ( 1 ): 34 – 43 . [DOI] [PMC free article] [PubMed] [Google Scholar]
- 9. Meunier PJ , Boivin G . Bone mineral density reflects bone mass but also the degree of mineralization of bone: therapeutic implications . Bone 1997. ; 21 ( 5 ): 373 – 377 . [DOI] [PubMed] [Google Scholar]
- 10. Paschalis EP , Krege JH , Gamsjaeger S , et al . Teriparatide Treatment Increases Mineral Content and Volume in Cortical and Trabecular Bone of Iliac Crest: A Comparison of Infrared Imaging With X-Ray-Based Bone Assessment Techniques . J Bone Miner Res 2018. ; 33 ( 12 ): 2230 – 2235 . [DOI] [PubMed] [Google Scholar]
- 11. Roschger P , Misof B , Paschalis E , Fratzl P , Klaushofer K . Changes in the degree of mineralization with osteoporosis and its treatment . Curr Osteoporos Rep 2014. ; 12 ( 3 ): 338 – 350 . [DOI] [PubMed] [Google Scholar]
- 12. Seifert AC , Wehrli FW . Solid-State Quantitative (1)H and (31)P MRI of Cortical Bone in Humans . Curr Osteoporos Rep 2016. ; 14 ( 3 ): 77 – 86 . [Published correction appears in Curr Osteoporos Rep 2016;14(4):159-161.] [DOI] [PMC free article] [PubMed] [Google Scholar]
- 13. Biswas R , Bae W , Diaz E , et al . Ultrashort echo time (UTE) imaging with bi-component analysis: bound and free water evaluation of bovine cortical bone subject to sequential drying . Bone 2012. ; 50 ( 3 ): 749 – 755 . [DOI] [PMC free article] [PubMed] [Google Scholar]
- 14. Manhard MK , Horch RA , Gochberg DF , Nyman JS , Does MD . In Vivo Quantitative MR Imaging of Bound and Pore Water in Cortical Bone . Radiology 2015. ; 277 ( 1 ): 21 – 229 . [DOI] [PMC free article] [PubMed] [Google Scholar]
- 15. Wu Y , Reese TG , Cao H , et al . Bone mineral imaged in vivo by 31P solid state MRI of human wrists . J Magn Reson Imaging 2011. ; 34 ( 3 ): 623 – 633 . [DOI] [PMC free article] [PubMed] [Google Scholar]
- 16. Zhao X , Song HK , Seifert AC , Li C , Wehrli FW . Feasibility of assessing bone matrix and mineral properties in vivo by combined solid-state 1H and 31P MRI . PLoS One 2017. ; 12 ( 3 ): e0173995 . [Published correction appears in PLoS One 2018;13(1):e0192186.] [DOI] [PMC free article] [PubMed] [Google Scholar]
- 17. Jerban S , Ma Y , Li L , et al . Volumetric mapping of bound and pore water as well as collagen protons in cortical bone using 3D ultrashort echo time cones MR imaging techniques . Bone 2019. ; 127 : 120 – 128 . [DOI] [PMC free article] [PubMed] [Google Scholar]
- 18. Manhard MK , Uppuganti S , Granke M , Gochberg DF , Nyman JS , Does MD . MRI-derived bound and pore water concentrations as predictors of fracture resistance . Bone 2016. ; 87 : 1 – 10 . [DOI] [PMC free article] [PubMed] [Google Scholar]
- 19. Bae WC , Chen PC , Chung CB , Masuda K , D’Lima D , Du J . Quantitative ultrashort echo time (UTE) MRI of human cortical bone: correlation with porosity and biomechanical properties . J Bone Miner Res 2012. ; 27 ( 4 ): 848 – 857 . [DOI] [PMC free article] [PubMed] [Google Scholar]
- 20. Rajapakse CS , Bashoor-Zadeh M , Li C , Sun W , Wright AC , Wehrli FW . Volumetric Cortical Bone Porosity Assessment with MR Imaging: Validation and Clinical Feasibility . Radiology 2015. ; 276 ( 2 ): 526 – 535 . [DOI] [PMC free article] [PubMed] [Google Scholar]
- 21. Anumula S , Wehrli SL , Magland J , Wright AC , Wehrli FW . Ultra-short echo-time MRI detects changes in bone mineralization and water content in OVX rat bone in response to alendronate treatment . Bone 2010. ; 46 ( 5 ): 1391 – 1399 . [DOI] [PMC free article] [PubMed] [Google Scholar]
- 22. Seifert AC , Li C , Rajapakse CS , et al . Bone mineral (31)P and matrix-bound water densities measured by solid-state (31)P and (1)H MRI . NMR Biomed 2014. ; 27 ( 7 ): 739 – 748 . [DOI] [PMC free article] [PubMed] [Google Scholar]
- 23. Techawiboonwong A , Song HK , Leonard MB , Wehrli FW . Cortical bone water: in vivo quantification with ultrashort echo-time MR imaging . Radiology 2008. ; 248 ( 3 ): 824 – 833 . [DOI] [PMC free article] [PubMed] [Google Scholar]
- 24. Zhao X , Song HK , Wehrli FW . In vivo bone 31 P relaxation times and their implications on mineral quantification . Magn Reson Med 2018. ; 80 ( 6 ): 2514 – 2524 . [DOI] [PMC free article] [PubMed] [Google Scholar]
- 25. Seifert AC , Wehrli SL , Wehrli FW . Bi-component T2 * analysis of bound and pore bone water fractions fails at high field strengths . NMR Biomed 2015. ; 28 ( 7 ): 861 – 872 . [DOI] [PMC free article] [PubMed] [Google Scholar]
- 26. Rad HS , Lam SC , Magland JF , et al . Quantifying cortical bone water in vivo by three-dimensional ultra-short echo-time MRI . NMR Biomed 2011. ; 24 ( 7 ): 855 – 864 . [DOI] [PMC free article] [PubMed] [Google Scholar]
- 27. Li C , Seifert AC , Rad HS , et al . Cortical bone water concentration: dependence of MR imaging measures on age and pore volume fraction . Radiology 2014. ; 272 ( 3 ): 796 – 806 . [DOI] [PMC free article] [PubMed] [Google Scholar]
- 28. Xiong Y , He T , Wang Y , et al . CKD Stages, Bone Metabolism Markers, and Cortical Porosity Index: Associations and Mediation Effects Analysis . Front Endocrinol (Lausanne) 2021. ; 12 : 775066 . [DOI] [PMC free article] [PubMed] [Google Scholar]
- 29. Liu J , Liao JW , Li W , et al . Assessment of Osteoporosis in Lumbar Spine: In Vivo Quantitative MR Imaging of Collagen Bound Water in Trabecular Bone . Front Endocrinol (Lausanne) 2022. ; 13 : 801930 . [DOI] [PMC free article] [PubMed] [Google Scholar]
- 30. Kral R , Osima M , Borgen TT , Vestgaard R , Richardsen E , Bjørnerem Å . Increased cortical porosity and reduced cortical thickness of the proximal femur are associated with nonvertebral fracture independent of Fracture Risk Assessment Tool and Garvan estimates in postmenopausal women . PLoS One 2017. ; 12 ( 9 ): e0185363 . [DOI] [PMC free article] [PubMed] [Google Scholar]
- 31. Anumula S , Magland J , Wehrli SL , Ong H , Song HK , Wehrli FW . Multi-modality study of the compositional and mechanical implications of hypomineralization in a rabbit model of osteomalacia . Bone 2008. ; 42 ( 2 ): 405 – 413 . [DOI] [PMC free article] [PubMed] [Google Scholar]
- 32. Robson MD , Gatehouse PD , Bydder GM , Neubauer S . Human imaging of phosphorus in cortical and trabecular bone in vivo . Magn Reson Med 2004. ; 51 ( 5 ): 888 – 892 . [DOI] [PubMed] [Google Scholar]
- 33. Jha S , Chapman M , Roszko K . When Low Bone Mineral Density and Fractures Is Not Osteoporosis . Curr Osteoporos Rep 2019. ; 17 ( 5 ): 324 – 332 . [DOI] [PMC free article] [PubMed] [Google Scholar]
- 34. Napoli N , Chandran M , Pierroz DD , Abrahamsen B , Schwartz AV , Ferrari SL ; IOF Bone and Diabetes Working Group . Mechanisms of diabetes mellitus-induced bone fragility . Nat Rev Endocrinol 2017. ; 13 ( 4 ): 208 – 219 . [DOI] [PubMed] [Google Scholar]
- 35. Siddique N , Paheding S , Elkin CP , Devabhaktuni V . U-Net and Its Variants for Medical Image Segmentation: A Review of Theory and Applications . IEEE Access 2021. ; 9 : 82031 – 82057 . [Google Scholar]


