

Abstract
High‐throughput screening (HTS) is a technique mostly used by pharmaceutical companies to rapidly screen multiple libraries of compounds to find drug hits with biological or pharmaceutical activity. Mass spectrometry (MS) has become a popular option for HTS given that it can simultaneously resolve hundreds to thousands of compounds without additional chemical derivatization. For this application, it is convenient to do direct analysis from well plates. Herein, we present the development of an infrared matrix‐assisted laser desorption electrospray ionization (IR‐MALDESI) source coupled directly to an Agilent 6545 for direct analysis from well plates. The source is coupled to a quadrupole time‐of‐flight (Q‐TOF) mass spectrometer to take advantage of the high acquisition rates without sacrificing resolving power as required with Orbitrap or Fourier‐transform ion cyclotron resonance (FTICR) instruments. The laser used for this source operates at 100 Hz, firing 1 pulse‐per‐burst, and delivers around 0.7 mJ per pulse. Continuously firing this laser for an extended duration makes it a quasi‐continuous ionization source. Additionally, a metal capillary was constructed to extend the inlet of the mass spectrometer, increase desolvation of electrospray charged droplets, improve ion transmission, and increase sensitivity. Its efficiency was compared with the conventional dielectric glass capillary by measured signal and demonstrated that the metal capillary increased ionization efficiency due to its more uniformly distributed temperature gradient. Finally, we present the functionality of the source by analyzing tune mix directly from well plates. This source is a proof of concept for HTS applications using IR‐MALDESI coupled to a different MS platform.
Keywords: ambient ionization, direct analysis, IR‐MALDESI, Q‐TOF mass spectrometer
1. INTRODUCTION
High‐throughput screening (HTS) is an experimental technique that utilizes automated equipment to process tens of thousands to millions of compounds per day. 1 The analysis time per sample typically is on the sub‐second timescale. 2 HTS is commonly used in the pharmaceutical industry for drug discovery due to the need to screen large compound libraries to find hits with a biological or pharmaceutical activity to be used for therapeutic intervention. 3 , 4 Other applications that require HTS are doping control, 5 forensic identification, 6 and food safety. 7
Optical methods, such as fluorescence, have been widely used and developed for HTS applications. 8 However, these methods can be inconvenient due to the need of additional chemical derivatization and the common interferences, such as matrix effects, which can result in false positives. Mass spectrometry (MS) has become a popular option due to its high sensitivity, specificity, and no additional labeling preparatory steps. 9 Different methods for sample introduction to the mass spectrometer have been developed, which prove the capability of MS for HTS applications. 10 , 11 , 12 , 13 , 14 , 15 , 16 Many of these methods are ambient ionization‐based techniques, which can be performed in the open air and require minimal sample preparation. 17
Infrared matrix‐assisted laser desorption electrospray ionization (IR‐MALDESI) is an ambient ionization technique that combines matrix‐assisted laser desorption ionization (MALDI) and electrospray ionization (ESI). The sample is placed on a translation stage with a short‐wavelength IR laser directed and focused on the meniscus of the sample. The laser ablates the surface of the sample generating a plume of mostly neutrals that interact with the charged droplets from the orthogonal electrospray resulting in an ESI‐like ionization mechanism. 18 Therefore, the advantage to produce multiply charged ions allows the analysis of biological samples such as proteins. 19 Different versions of this source have been presented previously using trap‐based mass spectrometers. 20 , 21 , 22 This source has been extensively used for mass spectrometry imaging (MSI) applications. 23 , 24 , 25 , 26
Previously, the MSI source had been coupled to an ion mobility (IM) quadrupole time‐of‐flight (Q‐TOF) instrument. 27 This instrument contains an ion trap to accumulate ions before entering the drift tube for gas phase separation. An IM Q‐TOF delivers a new dimension that provides structural resolution of ions allowing the identification of isomers. This type of instrument is very useful for the analysis of various biological samples such as plasma, tissue, and biological fluids. However, it is important to consider that the drift tube limits the duty cycle and the dynamic range of the mass spectrometer. 28 An IM scan will have significantly less transients summed per scan, which decreases the dynamic range of the instrument. 29 Therefore, turning the IM off and using this instrument in Q‐TOF mode increase the duty cycle and dynamic range of the mass spectrometer. Nevertheless, the number of transients summed per scan in Q‐TOF mode is less than when using a regular Q‐TOF instrument due to the longer path the ions must travel. 30 Consequently, an IM Q‐TOF instrument in Q‐TOF mode can achieve comparable duty cycles as a regular Q‐TOF instrument sacrificing the intensity and the detection of low abundant ions.
IR‐MALDESI has also been proven to be a suitable candidate for HTS applications due to its soft ionization characteristics, high salt tolerance, and simple sample preparation using water or ice as a matrix. 31 This source has been previously reported by Radosevich and coworkers 32 to achieve μHTS sampling rates when coupled to an Orbitrap QExactive HF‐X mass spectrometer with which they report being able to scan 22.7 samples per second at 7500 resolving power (RP). 33 Orbitrap‐based instruments need to accumulate ions for a set time before mass analysis. Reducing the time of accumulation increases throughput but sacrifices RP.
The RP on time‐of‐flight (TOF)‐based instruments, in contrast to Orbitrap mass analyzers, does not depend on m/z; therefore, it is relatively constant across the entire mass range. 34 Also, the Q‐TOF achieves fast duty cycles preserving the dynamic range, high‐resolution, and high mass accuracy, which is ideal for HTS analyses. 35 Table 1 shows a comparison between Orbitrap and Q‐TOF‐based mass spectrometers, showcasing the advantages and disadvantages of both types of instruments. Given the limitations presented on the Orbitrap mass analyzer, the IR‐MALDESI source would benefit from the advantages of the Q‐TOF mass spectrometer. In this work, we present in detail the construction of a quasi‐continuous IR‐MALDESI source, its coupling to a commercial Q‐TOF mass spectrometer, and its functionality for direct analysis from well plates.
TABLE 1.
Advantages and disadvantages of Orbitrap and Q‐TOF‐based mass spectrometers 34
| Mass spectrometer | Advantages | Disadvantages |
|---|---|---|
| Orbitrap | Significantly higher RP compared with Q‐TOF instruments | RP is dependent on m/z (bias towards smaller m/z ions) and duty cycle |
| The dynamic range is not affected by increasing the duty cycle | Lower acquisition rates compared with Q‐TOF instruments | |
| MSn capabilities a | When using a pulsed ionization source, the throughput would be limited by the ion accumulation time and transient time | |
| Q‐TOF | RP is relatively constant across the m/z range (larger m/z range compared with Orbitrap instruments a ) | RP is proportional to the length of the flight tube |
| Faster duty cycles that do not depend on RP | RP depends on the instrument optics to deliver a thinner ion packet to the pusher of the TOF | |
| When using a pulsed ionization source, the throughput would be limited by the ionization event | Increase in acquisition rate results in a loss of sensitivity and dynamic range |
Abbreviations: MS, mass spectrometry; Q‐TOF, quadrupole time‐of‐flight; RP, resolving power; TOF, time‐of‐flight.
Depending on the instrument model.
2. EXPERIMENTAL
2.1. Materials
All aqueous solutions were prepared with deionized water (Millipore Milli‐Q; Sigma Aldrich, St. Louis, MO, USA). LC‐MS‐Grade methanol (MeOH) and acetonitrile (ACN) were purchased from Honeywell (Charlotte, NC, USA). Formic acid (FA) for the electrospray was purchased from Fisher Scientific (Waltham, MA, USA). Caffeine, reserpine, and leucine enkephalin were purchased from Sigma Aldrich. ESI‐L Low Concentration Tuning Mix and 0.5 ml 96‐well plates were bought from Agilent Technologies (Santa Clara, CA, USA).
2.2. Source design
The MALDESI source was developed from previous MALDESI systems. 21 The sample stage consists of a custom‐built water‐cooled Peltier cold plate bolted onto a 3D translational stage. This source uses a high precision motorized Z stage (GTS30V; Newport Corporation, Irvine, CA, USA) on top of an integrated XY linear motor table (ONE‐XY100; Newport Corporation). These stages are connected to a motion controller (XPS‐RLD4; Newport Corporation) that is operated by the in‐house developed program RastirZ, which is a modified version of the previously published software RastirX. 36 In contrast to the MSI source, this system does not have an enclosure, because controlling the humidity to form an ice layer is not necessary for direct analysis. The description of the materials used to assemble the source is provided in Table S1.
2.3. Laser and optics
The quasi‐continuous IR‐MALDESI source employs an optical parametric oscillator (OPO) solid‐state laser (MSI‐0‐2970; JGM Associates, Inc., Burlington, MA, USA) that provides nanosecond (7 ns) pulses at a wavelength of 2970 nm. It operates with a laser diode driver (LDD‐1) that has on‐board circuitry to control the peak current, the current duration, and the number of pulses‐per‐burst (PPB). This laser has been designed to fire 1 PPB at 100 Hz or less. The parameters used for the pulse generator are as follows: pulse width = 2.0 ms, 1 PPB, 80% duty cycle, and a burst period of 0.01 s (100 Hz). The measured energy at the sample stage is 0.7 mJ per pulse. The laser is mounted vertically; the beam goes through an anodized aluminum dust tube that contains a CaF2 concave lens (LC5401; Thorlabs, Newton, NJ, USA) to expand the beam. At the end of the path, the beam is focused using a MgF2 plano‐convex lens (LA6002; Thorlabs). The laser energy was measured with a pyroelectric energy meter (PE25‐C; Ophir‐Spiricon, North Logan, UT, USA). It is important to consider that this is a Class IV laser requiring laser safety training and appropriate eye protection while operating the source.
2.4. IR‐MALDESI‐MS analysis
The source was coupled to a Q‐TOF mass spectrometer (6545/6546 Q‐TOF; Agilent Technologies). To test the metal capillary, the composition of the electrospray was 50% ACN/water, 0.2% FA, and 1 μM of the analyte of interest. To test the IR‐MALDESI source, the ESI composition was 50% ACN/water, 0.2% FA, and 1 μM caffeine. Experiments were carried out with a 3.5 kV spray voltage in positive ion mode. The voltage for the ESI was provided by an external power supply. The Q‐TOF capillary voltage (VCap) and the fragmentor voltage were set to 175 V. The drying gas temperature for the ion transfer capillary was set at 350°C. The Q‐TOF was set and tuned at “Low Mass Range” (100 m/z to 1700 m/z). To couple the source to the mass spectrometer, we use the remote start connection to trigger the instrument to start and stop a run. The acquisition clock is obtained from the fraction collector port after having a firmware update. Because this is an ambient source located in front of the instrument, the safety interlock of the Q‐TOF needs to be bypassed, using a magnet and an iButton, to access the inlet of the mass spectrometer. The iButton is an electronic communication device that tells the software the type of source connected to the front of the instrument. This allows the user to run the instrument without a commercial source enclosure. It must be taken into consideration the potential risk due to the exposure of the high voltage on the outside of the capillary. All the data were analyzed using MassHunter Qualitative Analysis 10.0 (Agilent Technologies).
3. RESULTS AND DISCUSSION
3.1. IR‐MALDESI source construction
The quasi‐continuous IR‐MALDESI source was constructed and coupled to a commercial Q‐TOF mass spectrometer (6545/6546 Q‐TOF; Agilent Technologies). Figure 1 shows a schematic representation of the source and its major components.
FIGURE 1.

Center top: Quasi‐continuous infrared matrix‐assisted laser desorption electrospray ionization (IR‐MALDESI) source. (A) 2970 nm laser with a visualization of the burst rate (100 Hz). (B) Electrospray orthogonal to the sample and coaxial to the inlet of the mass spectrometer. Caffeine was added to the electrospray to monitor the variability of the signal over time. (C) The geometry used to align the emitter tip (E = 15 mm), laser (L = 4 mm), and well plate (H = 14 mm) relative to the inlet of the mass spectrometer. (D) Fully automated X, Y, and Z stages controlled by a Newport XPS‐RLD controller using the in‐house developed program RastirZ. (E) A diagram of the metal capillary dimensions used to replace the glass dielectric ion transfer capillary within the quadrupole time‐of‐flight (Q‐TOF)
Considering that a Q‐TOF mass spectrometer operates differently than an Orbitrap or Fourier‐transform ion cyclotron resonance (FTICR) instrument, the components of the IR‐MALDESI source have been modified to couple and accommodate to the front end of the instrument. The IR laser used in this source is configured to fire 1 PPB at 100 Hz. This allows for a quasi‐continuous ion generation from the sample. For HTS applications, a faster laser is ideal because the purpose is to analyze as many samples as possible in the shortest amount of time. This laser provides sufficient energy to ablate the sample in 0.02 s firing 2 bursts.
To be able to access the entire sample stage in the source, the inlet to the instrument was extended. For this purpose, an extended metal capillary was designed and constructed to replace the dielectric capillary inside the desolvation unit of the Q‐TOF. This metal capillary was constructed out of a 304/304L stainless steel rod that has a higher thermal conductivity than glass and is able to heat the entire capillary without the need of external heating supplies. Having a uniformly heated capillary increases the desolvation rate of the electrospray charged droplets, therefore increasing ionization efficiency. The capillary consists of two parts: an outer shell and an inner capillary tube. The outer shell is assembled by threaded pieces that connect with each other, with a hollow cavity the diameter of the inner capillary tube. This feature provides the capability to change the length of the capillary by adding or reducing the number of total segments. The inner tube is a stainless steel tubing with an outer diameter of 1/16″ and an inner diameter of 0.6 mm. The inner diameter of the metal capillary is the same as the glass capillary, which allows for comparison of the results.
To operate and couple the source to the Q‐TOF, the MALDESI source contains an Arduino Nano used to receive and send signals to the different components; a scheme is shown in Figure 2.
FIGURE 2.

(A) Scheme of the communication between the different electronic components of the quasi‐continuous infrared matrix‐assisted laser desorption electrospray ionization (IR‐MALDESI) source. An Arduino Nano is used to synchronize axes motion with triggering the laser using the in‐house developed program RastirZ. (B) Screenshot of the RastirZ graphical user interface (GUI). This GUI easily enables the user to fire the laser and jog the axis, move to a desired position, or set up a raster scan pattern. Q‐TOF, quadrupole time‐of‐flight
The user programs the MALDESI settings using the RastirZ software, where they can choose how to move the stages and fire the laser. The Arduino Nano also communicates with the Q‐TOF to send an external trigger to start recording data. Figure 3 indicates the timing of the signals to and from each IR‐MALDESI‐MS component. The signals illustrate acquiring data from two adjacent wells (samples) in an experiment. To increase throughput, the Arduino sends one start signal to the instrument before the first well, and the system keeps recording until the last well has been analyzed.
FIGURE 3.

Synchronization timing for collecting infrared matrix‐assisted laser desorption electrospray ionization (IR‐MALDESI) data with the Agilent quadrupole time‐of‐flight (Q‐TOF). The Q‐TOF acquisition signal is set to 3 scans/s and the width of each pulse is 100 μs. The Arduino to XPS‐Controller signal has a pulse width of 30 ms. The XPS‐Controller signal has a pulse width of 20 ms. The Q‐TOF start and stop signals each have a pulse width of 500 ms. The laser pulses have a burst width of 10 ms firing 1 PPB at 100 Hz with 80% duty cycle. The yellow section shows the acquisition clock while the Q‐TOF is recording data.
The broken axis in the middle shows a variable delay between the scans of the first well and the scans of the second well. The delay depends on the sampling rate of the mass spectrometer. The acquisition rate of the Q‐TOF is variable and can be set in the “Method Editor” section of the instrument software. For the experiments shown in this work, the acquisition rate was set to 3 scans/s. The Q‐TOF constantly acquires data and resets the scan clock to 0 when it receives a start signal to record data. The trigger signal from the Arduino Nano to the XPS‐Controller initiates stage movement. Afterwards, the XPS‐Controller sends a signal to the Arduino indicating that stage motion is complete. The delay shown in this signal as a broken axis depends on the velocity and distance the stages travel. The Newport ONE‐XY linear motor axes are capable of 400 mm/s velocity and 2.94 m/s2 acceleration. After the XPS‐Controller confirms position, the Arduino sends the start signal to the Q‐TOF to begin recording data. The Arduino then triggers the laser, and it starts firing 1 PPB at 100 Hz. The number of pulses per burst, pulse width, duty cycle, burst width, and number of bursts can be specified up to a maximum pulse rate of 10 kHz and a maximum burst rate of 100 Hz.
We can find that the timing difference between the signal of the Arduino to the XPS‐Controller (purple) and the laser trigger (teal) is different for the first and second wells. The order of events after the analysis of the first well follows below: (1) Arduino sends a signal to the XPS‐Controller to move the stage to the next well, shown in purple line. (2) After the stage moves to the position, the XPS‐Controller returns a signal to confirm the position, shown in pink line. (3) The laser is triggered to fire the desired number of pulses, shown in teal rectangle. During this process, the Q‐TOF is continuously operating, which largely reduces the timing between wells. Another start signal sent to Q‐TOF to begin recording data of the second well would cause a delay between analyses of the first and second wells. The stop signal is sent to the instrument after all the desired wells have been analyzed.
3.2. Comparing the heated metal capillary and glass dielectric capillary
Using the IR‐MALDESI electrospray, reserpine, leucine enkephalin, and tune mix were analyzed to compare the glass dielectric and metal capillaries. For both experiments, an external power supply was used to set the high voltage on the emitter tip. The voltage on the capillary and fragmentor was set to 175 V because the metal capillary will conduct the voltage from one end to the other. Figure 4 shows the extracted ion chromatogram (EIC) and the mass spectrum of reserpine, leucine enkephalin, and each compound in the tune mix. As predicted, the metal capillary resulted in higher measured signal for each analyte tested, relative to the glass dielectric capillary. This is likely due to a more uniform heat distribution across the metal capillary resulting in a higher desolvation rate. In the case of Figure 4A, the electrospray was less stable with the metal capillary than the glass capillary. However, it is also worth considering that the stability of the electrospray varies as ambient conditions such as humidity change. Therefore, we cannot conclude that the variability of the signal in this experiment is solely due to the metal capillary or ambient reasons. Moreover, in Figure 4B, we can see that the stability of the signal using the metal capillary is comparable with the glass capillary.
FIGURE 4.
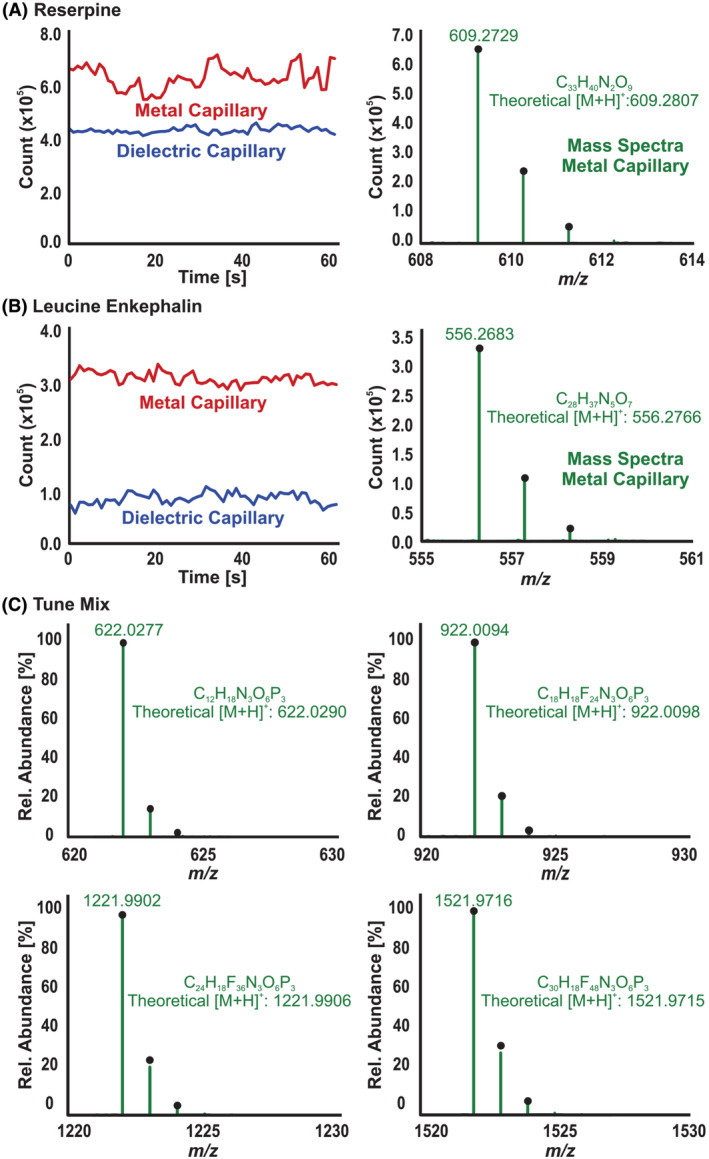
(A) Extracted ion chromatogram (EIC) and spectrum of reserpine acquired with the metal and glass capillaries by electrospray ionization (ESI). (B) EIC and spectrum of leucine enkephalin acquired with the metal and glass capillaries by ESI. (C) Spectra of the main ions in the tune mix showing mass accuracy acquired with the metal capillary by ESI
We can see that for reserpine, we have a 1.5× increase in signal whereas for leucine enkephalin, we have 3× more signal abundance using the metal capillary. The difference in increase between these two molecules could be due to their ionization efficiencies, but we have insufficient information to be confident of that conclusion. Regarding mass accuracy, we can see that the main ions of the tune mix have ±2 ppm, considering that we are not using an internal reference. Overall, we can say that the metal capillary works as well or better than the dielectric glass capillary at introducing ions into the mass spectrometer. Additionally, the metal capillary provides the extension needed to run IR‐MALDESI with the Q‐TOF.
To prove the functionality and capabilities of the IR‐MALDESI source, tune mix diluted to 50% with water was added to a 0.5 ml 96‐well plate. A 1 μM caffeine solution diluted in ESI solvent was added to the electrospray to monitor its stability and variability in time. Two experiments were performed: one firing bursts for 10 s (Figure 5A) and the second one firing bursts continuously for 60 s (Figure 5B). For Figure 5A, the laser was fired twice over 120 s. In green, we can see the IR‐MALDESI mass spectra for both replicates. For Figure 5B, the laser was fired once for a longer period of time. The two mass spectra shown are representations of the IR‐MALDESI signal at two different times showing the highest abundance and the lowest abundance sections of the EIC. The EIC shows spikes due to the acquisition time of the instrument and the quasi‐continuous ion generation from the source. However, we can see that even when the abundances are lower, we obtain good mass spectra with high mass accuracy.
FIGURE 5.

(A) The burst mode consists of firing the laser for a short period of time intermittently. (B) The quasi‐continuous mode consists of firing the laser for a long period of time. This mode demonstrates the capability of the source to ionize an analyte quasi‐continuously.
We can say that this ionization source has two modes of operation given by the laser: burst and quasi‐continuous. Each mode could be used for different applications. The burst mode is useful for imaging purposes whereas the quasi‐continuous mode for HTS analyses. Laser‐based sources operate as pulsed ionization sources. However, this MALDESI source presents a new capability to operate as a quasi‐continuous ionization source given by the speed of the laser bursts. This MS platform could lead to an increase in the throughput analysis by IR‐MALDESI‐MS.
4. CONCLUSIONS
A novel quasi‐continuous IR‐MALDESI source was developed and coupled to a Q‐TOF mass spectrometer to overcome limitations of IR‐MALDESI coupled to Orbitrap mass spectrometers. This instrument provides the advantage of having high acquisition rates maintaining the RP constant over the entire m/z range, which is especially beneficial to analysis of macromolecules (e.g., proteins). The laser mounted in this source fires 1 PPB at 100 Hz and provides sufficient energy to ablate the sample with a single pulse. Firing this laser for a long period of time allows this source to generate a quasi‐continuous ion beam, ideal for coupling to a continuous mass analyzer. Additionally, an extended metal capillary was built to extend the inlet of the Q‐TOF, which increased measured signal compared with the conventionally used glass dielectric capillary by Agilent. The functionality and capabilities of this source were proven in this work, demonstrating a new system for direct analysis from well plates. The capabilities of this source show the potential it has for HTS and other applications. In future work, the source will be further characterized with this mass spectrometer using a broad range of molecules and biological samples.
CONFLICT OF INTEREST
The authors declare no competing financial interests.
Supporting information
Table S1. Parts used to construct the IR‐MALDESI source.
ACKNOWLEDGEMENTS
The mass spectrometry measurements were conducted in the Molecular Education, Technology and Research Innovation Center (METRIC) at North Carolina State University and Agilent Technologies Santa Clara Site in California. Funding for this study was provided in part by Agilent Technologies and a grant from the National Institute of General Medical Sciences, NIH (R01GM087964).
Arciniega C, Garrard KP, Guymon JP, et al. Quasi‐continuous infrared matrix‐assisted laser desorption electrospray ionization source coupled to a quadrupole time‐of‐flight mass spectrometer for direct analysis from well plates. J Mass Spectrom. 2023;58(1):e4902. doi: 10.1002/jms.4902
DATA AVAILABILITY STATEMENT
We will make data public in METASPACE once the paper is accepted.
REFERENCES
- 1. Attene‐Ramos MS, Austin CP, Xia M. High throughput screening. In: Encyclopedia of Toxicology. Third ed. Elsevier; 2014:916‐917. doi: 10.1016/B978-0-12-386454-3.00209-8 [DOI] [Google Scholar]
- 2. Haslam C, Hellicar J, Dunn A, et al. The evolution of MALDI‐TOF mass spectrometry toward ultra‐high‐throughput screening: 1536‐well format and beyond. J Biomol Screen. 2016;21(2):176‐186. doi: 10.1177/1087057115608605 [DOI] [PubMed] [Google Scholar]
- 3. Sundberg S. High‐throughput and ultra‐high‐throughput screening: solution‐ and cell‐based approaches. Curr Opin Biotechnol. 2000;11(1):47‐53. doi: 10.1016/S0958-1669(99)00051-8 [DOI] [PubMed] [Google Scholar]
- 4. Hertzberg RP, Pope AJ. High‐throughput screening: new technology for the 21st century. Curr Opin Chem Biol. 2000;4(4):445‐451. doi: 10.1016/S1367-5931(00)00110-1 [DOI] [PubMed] [Google Scholar]
- 5. Musenga A, Cowan DA. Use of ultra‐high pressure liquid chromatography coupled to high resolution mass spectrometry for fast screening in high throughput doping control. J Chromatogr a. 2013;1288:82‐95. doi: 10.1016/j.chroma.2013.03.006 [DOI] [PubMed] [Google Scholar]
- 6. Pan M, Xiang P, Yu Z, Zhao Y, Yan H. Development of a high‐throughput screening analysis for 288 drugs and poisons in human blood using Orbitrap technology with gas chromatography‐high resolution accurate mass spectrometry. J Chromatogr a. 2019;1587:209‐226. doi: 10.1016/j.chroma.2018.12.022 [DOI] [PubMed] [Google Scholar]
- 7. Yan Y, Ai L, Zhang H, Kang W, Zhang Y, Lian K. Development an automated and high‐throughput analytical platform for screening 39 glucocorticoids in animal‐derived food for doping control. Microchem J. 2021;165:106142. doi: 10.1016/j.microc.2021.106142 [DOI] [Google Scholar]
- 8. Eggeling C, Brand L, Ullmann D, Jäger S. Highly sensitive fluorescence detection technology currently available for HTS. Drug Discov Today. 2003;8(14):632‐641. doi: 10.1016/S1359-6446(03)02752-1 [DOI] [PubMed] [Google Scholar]
- 9. McLaren DG, Shah V, Wisniewski T, et al. High‐throughput mass spectrometry for hit identification: current landscape and future perspectives. SLAS Disc. 2021;26(2):168‐191. doi: 10.1177/2472555220980696 [DOI] [PubMed] [Google Scholar]
- 10. Häbe TT, Liu C, Covey TR, et al. Ultrahigh‐throughput ESI‐MS: sampling pushed to six samples per second by acoustic ejection mass spectrometry. Anal Chem. 2020;92(18):12242‐12249. doi: 10.1021/acs.analchem.0c01632 [DOI] [PubMed] [Google Scholar]
- 11. Simon RP, Häbe TT, Ries R, et al. Acoustic ejection mass spectrometry: a fully automatable technology for high‐throughput screening in drug discovery. SLAS Disc. 2021;26(8):961‐973. doi: 10.1177/24725552211028135 [DOI] [PubMed] [Google Scholar]
- 12. Pearson LA, Green CJ, Lin D, et al. Development of a high‐throughput screening assay to identify inhibitors of the SARS‐CoV‐2 guanine‐N7‐methyltransferase using RapidFire mass spectrometry. SLAS Disc. 2021;26(6):749‐756. doi: 10.1177/24725552211000652 [DOI] [PMC free article] [PubMed] [Google Scholar]
- 13. Simon RP, Winter M, Kleiner C, et al. MALDI‐TOF‐based affinity selection mass spectrometry for automated screening of protein–ligand interactions at high throughput. SLAS Disc. 2021;26:44‐57. doi: 10.1177/2472555220959266 [DOI] [PubMed] [Google Scholar]
- 14. Wei Z, Xie Z, Kuvelkar R, et al. High‐throughput bioassays using “dip‐and‐go” multiplexed electrospray mass spectrometry. Angewandte Chemie. 2019;131(49):17758‐17762. doi: 10.1002/ange.201909047 [DOI] [PubMed] [Google Scholar]
- 15. Logsdon DL, Li Y, Paschoal Sobreira TJ, Ferreira CR, Thompson DH, Cooks RG. High‐throughput screening of reductive amination reactions using desorption electrospray ionization mass spectrometry. Org Process Res Dev. 2020;24(9):1647‐1657. doi: 10.1021/acs.oprd.0c00230 [DOI] [Google Scholar]
- 16. Khaled A, Belinato JR, Pawliszyn J. Rapid and high‐throughput screening of multi‐residue pharmaceutical drugs in bovine tissue using solid phase microextraction and direct analysis in real time‐tandem mass spectrometry (SPME‐DART‐MS/MS). Talanta. 2020;217:121095. doi: 10.1016/j.talanta.2020.121095 [DOI] [PubMed] [Google Scholar]
- 17. Li LP, Feng BS, Yang JW, Chang CL, Bai Y, Liu HW. Applications of ambient mass spectrometry in high‐throughput screening. Analyst. 2013;138(11):3097‐3103. doi: 10.1039/c3an00119a [DOI] [PubMed] [Google Scholar]
- 18. Dixon RB, Muddiman DC. Study of the ionization mechanism in hybrid laser based desorption techniques. Analyst. 2010;135(5):880‐882. doi: 10.1039/b926422a [DOI] [PubMed] [Google Scholar]
- 19. Ho CS, Lam CWK, Chan MHM, et al. Electrospray ionisation mass spectrometry: principles and clinical applications. Clin Biochem Rev. 2003;24(1):3‐12. http://www.ncbi.nlm.nih.gov/pubmed/18568044 [PMC free article] [PubMed] [Google Scholar]
- 20. Knizner KT, Guymon JP, Garrard KP, et al. Next‐generation infrared matrix‐assisted laser desorption electrospray ionization source for mass spectrometry imaging and high‐throughput screening. J am Soc Mass Spectrom. 2022;33(11):2070‐2077. doi: 10.1021/jasms.2c00178 [DOI] [PMC free article] [PubMed] [Google Scholar]
- 21. Robichaud G, Barry JA, Garrard KP, Muddiman DC. Infrared matrix‐assisted laser desorption electrospray ionization (IR‐MALDESI) imaging source coupled to a FT‐ICR mass spectrometer. J am Soc Mass Spectrom. 2013;24(1):92‐100. doi: 10.1007/s13361-012-0505-9 [DOI] [PMC free article] [PubMed] [Google Scholar]
- 22. Sampson JS, Murray KK, Muddiman DC. Intact and top‐down characterization of biomolecules and direct analysis using infrared matrix‐assisted laser desorption electrospray ionization coupled to FT‐ICR mass spectrometry. J am Soc Mass Spectrom. 2009;20(4):667‐673. doi: 10.1016/j.jasms.2008.12.003 [DOI] [PMC free article] [PubMed] [Google Scholar]
- 23. Bai H, Linder KE, Muddiman DC. Three‐dimensional (3D) imaging of lipids in skin tissues with infrared matrix‐assisted laser desorption electrospray ionization (MALDESI) mass spectrometry. Anal Bioanal Chem. 2021;413(10):2793‐2801. doi: 10.1007/S00216-020-03105-6/FIGURES/6 [DOI] [PMC free article] [PubMed] [Google Scholar]
- 24. Mwangi JN, William J, Gilliland M, et al. Mass spectroscopy imaging of hair strands captures short‐term and long‐term changes in emtricitabine adherence. Antimicrob Agents Chemother. 2022;66(4):e0217621. doi: 10.1128/AAC.02176-21 [DOI] [PMC free article] [PubMed] [Google Scholar]
- 25. Pace CL, Simmons J, Kelly RT, Muddiman DC. Multimodal mass spectrometry imaging of rat brain using IR‐MALDESI and NanoPOTS‐LC‐MS/MS. J Proteome Res. 2022;21(3):713‐720. doi: 10.1021/ACS.JPROTEOME.1C00641 [DOI] [PMC free article] [PubMed] [Google Scholar]
- 26. Mellinger AL, Muddiman DC, Gamcsik MP. Highlighting functional mass spectrometry imaging methods in bioanalysis. J Proteome Res. 2022;21(8):1800‐1807. doi: 10.1021/acs.jproteome.2c00220 [DOI] [PubMed] [Google Scholar]
- 27. Ekelöf M, Dodds J, Khodjaniyazova S, Garrard KP, Baker ES, Muddiman DC. Coupling IR‐MALDESI with drift tube ion mobility‐mass spectrometry for high‐throughput screening and imaging applications. J am Soc Mass Spectrom. 2020;31(3):642‐650. doi: 10.1021/JASMS.9B00081 [DOI] [PMC free article] [PubMed] [Google Scholar]
- 28. Delafield DG, Lu G, Kaminsky CJ, Li L. High‐end ion mobility mass spectrometry: a current review of analytical capacity in omics applications and structural investigations. TrAC. 2022;157:116761. doi: 10.1016/j.trac.2022.116761 [DOI] [Google Scholar]
- 29. Stow SM, Fjeldsted JC. Fundamentals of uniform‐field drift tube ion mobility and collision cross section. In: Ion Mobility‐Mass Spectrometry. Fundamentals and Applications. Royal Society of Chemistry; 2021. [Google Scholar]
- 30. Causon TJ, Kurulugama RT, Hann S. Drift‐tube ion mobility‐mass spectrometry for nontargeted ′omics. In: Ion Mobility‐Mass Spectrometry. Methods in Molecular Biology. New York: Humana; 2020:79‐94. 10.1007/978-1-0716-0030-6_4 [DOI] [PubMed] [Google Scholar]
- 31. Caleb Bagley M, Garrard KP, Muddiman DC. The development and application of matrix assisted laser desorption electrospray ionization: the teenage years. Mass Spectrom Rev. 2021;42(1):mas.21696. doi: 10.1002/mas.21696 [DOI] [PMC free article] [PubMed] [Google Scholar]
- 32. Pu F, Radosevich AJ, Sawicki JW, et al. High‐throughput label‐free biochemical assays using infrared matrix‐assisted desorption electrospray ionization mass spectrometry. Anal Chem. 2021;93(17):6792‐6800. doi: 10.1021/ACS.ANALCHEM.1C00737 [DOI] [PubMed] [Google Scholar]
- 33. Radosevich AJ, Pu F, Chang‐Yen D, et al. Ultra‐high‐throughput ambient MS: direct analysis at 22 samples per second by infrared matrix‐assisted laser desorption electrospray ionization mass spectrometry. Anal Chem. 2022;94(12):4913‐4918. doi: 10.1021/ACS.ANALCHEM.1C04605 [DOI] [PubMed] [Google Scholar]
- 34. Eichhorn P, Pérez S, Barceló D. Time‐of‐flight mass spectrometry versus Orbitrap‐based mass spectrometry for the screening and identification of drugs and metabolites: is there a winner? In: Comprehensive Analytical Chemistry. Elsevier B.V.; 2012:217‐272. 10.1016/B978-0-444-53810-9.00009-2 [DOI] [Google Scholar]
- 35. Han J, Datla R, Chan S, Borchers CH. Mass spectrometry‐based technologies for high‐throughput metabolomics. Bioanalysis. 2009;1(9):1665‐1684. doi: 10.4155/bio.09.158 [DOI] [PubMed] [Google Scholar]
- 36. Garrard KP, Ekelöf M, Khodjaniyazova S, Bagley MC, Muddiman DC. A versatile platform for mass spectrometry imaging of arbitrary spatial patterns. J am Soc Mass Spectrom. 2020;31(12):2547‐2552. doi: 10.1021/JASMS.0C00128 [DOI] [PMC free article] [PubMed] [Google Scholar]
Associated Data
This section collects any data citations, data availability statements, or supplementary materials included in this article.
Supplementary Materials
Table S1. Parts used to construct the IR‐MALDESI source.
Data Availability Statement
We will make data public in METASPACE once the paper is accepted.