

Abstract
Genomic analysis, performed on tumoral tissue DNA and on circulating tumor DNA (ctDNA) from blood, is the cornerstone of precision cancer medicine. Herein, we characterized the clinical prognostic implications of the concordance of alterations in major cancer genes between tissue‐ and blood‐derived DNA in a pan‐cancer cohort. The molecular profiles of both liquid (Guardant Health) and tissue (Foundation Medicine) biopsies from 433 patients were analyzed. Mutations and amplifications of cancer genes scored by these two tests were assessed. In 184 (42.5%) patients, there was at least one mutual gene alteration. The mean number of mutual gene‐level alterations in the samples was 0.67 per patient (range: 0–5). A higher mutual gene‐level alteration number correlated with shorter overall survival (OS). As confirmed in multivariable analysis, patients with ≥2 mutual gene‐level alterations in blood and tissue had a hazard ratio (HR) of death of 1.49 (95% confidence interval [CI]=1–2.2; P=0.047), whereas patients with ≥3 mutual gene‐level alterations had an HR of death 2.38 (95% CI=1.47–3.87; P=0.0005). Together, our results show that gene‐level concordance between tissue DNA and ctDNA analysis is prevalent and is an independent factor predicting significantly shorter patient survival.
Keywords: cancer, circulating DNA, genomics, survival, tissue DNA
The molecular profiles of both liquid (circulating tumor DNA [ctDNA] from blood) and tissue (tumor) biopsies from 433 patients with diverse cancers were compared via next‐generation sequencing. Gene‐level concordance between tissue DNA and blood ctDNA analysis was prevalent and higher concordance was an independent factor predicting significantly shorter patient survival.

Abbreviations
- CHIP
clonal hematopoiesis of indetermined potential
- ctDNA
circulating tumor DNA
- FFPE
formalin‐fixed, paraffin‐embedded
- HR
hazard ratio
- MB
megabase
- NGS
next generation sequencing
- OS
overall survival
- TMB
tumor mutational burden
- VAF
variant allele fraction
- VUS
variants of unknown significance
1. Introduction
Malignant transformation occurs, at least in part, due to acquired somatic genomic alterations [1], as identified by large‐scale projects depicting the molecular portfolios of many cancers [2, 3, 4]. These projects enabled the realization that most metastatic cancers have complex mutational landscapes that are distinct from each other [5, 6]. Further, over the last few years, rapid advances in sequencing technology made tumor genomic evaluation feasible in the clinical setting. Simultaneously, many novel compounds targeting specific tumor gene products have been approved, leading to the development of a precision medicine strategy for management of malignancies [7, 8, 9]. This strategy has yielded important clinical breakthroughs, such as targeting ALK rearrangements in lung cancer [10] and NTRK fusions across cancers [11], among others [12].
Conventionally, genomic evaluation of cancers is performed on tissue DNA from tumor specimens obtained by invasive biopsy or surgery. Circulating tumor DNA (ctDNA) reflects cancer‐derived DNA that is shed into the bloodstream. These molecules can be isolated from a small blood sample and assessed for genomic alterations (“liquid biopsy”) [13]. The advantages of liquid biopsy, in addition to the fact that acquiring the blood sample is not invasive, is that it can be obtained in cases in which tumor material is difficult to access or is not sufficient for molecular profiling; moreover, serial samples can be exploited to monitor the response to treatment, and to detect the emergence of mutations that drive resistance and/or that may need to be targeted by other drugs [14, 15, 16, 17].
The concordance level between genomic analysis of tumor tissue DNA and blood‐derived ctDNA when acquired at the same time can be as high as 80–90% [18, 19, 20, 21], although other reports have found lower levels of concordance [15]. A high positive overall blood and tissue concordance rate may be driven in some cases by the large negative/negative subset [22]. It should also be noted that there may be biologic reasons that underlie differences between tissue DNA and blood‐derived ctDNA results: (a) tissue DNA sequencing evaluates the genomics in a small sample of tissue, while ctDNA may uncover alterations from DNA released into the bloodstream from multiple metastatic sites, better mirroring cancer heterogeneity [15]: (b) ctDNA can be suppressed by treatment; and (c) shedding of DNA from cancer cells into the circulation may be limited from some metastatic or primary cancer sites, especially if the tumor burden is low.
Herein, we examined the concordance between blood‐derived ctDNA alterations and tissue DNA aberrations, as determined by next‐generation sequencing (NGS). We demonstrate that higher concordance between tissue and blood DNA alterations is independently associated with poorer outcomes.
2. Materials and methods
2.1. Patients
We included 433 patients seen at the University of California San Diego (UCSD) Moores Cancer Center. The patients had a variety of advanced cancers and both prior systemic therapies or no prior therapies. Each patient had both tissue and ctDNA assessed. The samples collection started in June 2014 and the last ctDNA specimen was obtained on 09/2017. Eligibility for inclusion implied adequate follow up, and demographic information availability. Demographics of each of these patients was curated from the electronic medical record. The study methodologies conformed to the standards set by the Declaration of Helsinki and experimental interventions were approved by the UCSD Internal Review Board‐approved protocol (NCT02478931) and included any investigational procedures for which the participant provided written informed consent.
2.2. Next‐Generation sequencing (NGS)
Tissue NGS testing was analyzed by Foundation Medicine (https://www.foundationmedicine.com/genomic‐testing#how‐does‐it‐work); blood‐derived ctDNA molecular NGS was evaluated by Guardant Health(http://www.guardanthealth.com/). The Foundation Medicine test is now FDA‐approved for reporting deleterious variants. Both laboratories are Clinical Laboratory Improvement Amendment (CLIA)‐accredited. Detailed methods were previously reported [23, 24].
2.2.1. Variants of unknown significance
Synonymous alterations and other variants of unknown significance (VUS) were excluded and only characterized deleterious alterations were included in this report [23]. Characterized alterations refer to pathogenic alterations that are not VUSs.
2.2.2. Tissue NGS
Tissue NGS was assessed at Foundation Medicine (clinical‐grade CLIA testing) with assay panels of 236 or 315 genes. Detailed methods are as previously reported (Cambridge, MA, www.foundationmedicine.com) [23]. All tissue samples (formalin‐fixed, paraffin‐embedded [FFPE]) were reviewed by a pathologist to ensure that ≥20% of the nuclei in the sample were derived from the tumor, a sample volume of ≥1 mm3, and nucleated cellularity ≥80% or ≥30,000 cells. Mean sequencing depth was >250×, with 100× at >99% of exons. This method of sequencing permits identification of copy number alterations, somatic mutations, and gene rearrangements, with >99% sensitivity for base substitutions at ≥5% mutant allele frequency and 99% specificity, as well as >95% sensitivity for copy number alterations. A threshold of ≥8 copies for gene amplification was utilized.
For tumor mutational burden (TMB), measured in mutations per megabase, the number of somatic mutations detected by NGS (interrogating 1.2 mb of the genome) were quantified and that value extrapolated to the whole exome utilizing a validated algorithm [25]. Oncogenic driver alterations and germline polymorphisms were excluded. TMB was measured in mutations per megabase (mb).
2.2.3. Blood‐derived ctDNA NGS
As published by Lanman et al., 5–30 ng of ctDNA was isolated from plasma and sequencing libraries were made with custom in‐line barcode molecular tagging and complete sequencing at 15,000× read depth [24]. The panels utilize hybrid capture followed by NGS of the crucial exons in a panel of 54–73 genes, and read out all four major types of genomic alterations: fusions, point mutations, indels, and copy number amplifications. Postsequencing bioinformatics matches the complementary strands of each barcoded DNA fragment to remove false‐positive results [24]. The variant allele fraction (VAF, which equals %ctDNA) is calculated as the number of mutated DNA molecules divided by the total number (wildtype plus mutate) of DNA fragments at that allele. We analyzed the maximum %ctDNA of any deleterious variant. Most cell‐free DNA is wildtype; therefore, the median %ctDNA of somatic alterations is <0.5%. The analytic sensitivity reaches detection of one to two single‐mutant fragments from a 10‐mL blood sample (0.1% is the threshold for detection), and the analytic specificity is >99.9999% [24].
2.2.4. Genes tested
Guardant 360 panel tested before February 2015 included 54 genes. All samples analyzed before February 2015 were analyzed by this 54‐gene panel. Samples tested afterwards were analyzed by different panel versions that included 68–73 genes in ctDNA analysis. Sixty‐three genes were mutual to all of these later panels and others were excluded from the analysis. We analyzed genes that were sequenced in both the tissue biopsy and the liquid biopsy and excluded all other genes. The Foundation One tissue panel included 309 genes. Intersection with the 54 genes in the first panel resulted in 53 genes. For three of these genes, amplifications were measured and included. We examined the intersection of Foundation Medicine tissue genes with the 63 ctDNA genes tested in the panels after February 2015. Altogether, 55 genes were available for which both ctDNA and tissue DNA was analyzed on February 2015 and later. Sixteen of these genes were also tested for amplifications, which we included. Table S1 provides the two gene lists.
2.2.5. Definition of genomic alterations concordance type
Genes that were not analyzed by both ctDNA and by tissue were not included in the analysis. For each participant, the specific genomic anomaly (or their absence) was compared between tissue and ctDNA. For each genetic abnormality in tissue DNA, we examined whether an abnormality in the same gene was discerned in ctDNA and also whether this genetic abnormality was identical (at the same gene locus) to that found in the tissue DNA.
We defined gene‐level concordance as positive concordance when the gene alteration is found in both tests (not necessarily the same locus aberration) and negative concordance otherwise. We defined mutation‐level concordance as positive concordance when exactly the same locus aberration was identified in both tests (e.g. same location in a single nucleotide variant [point mutation] or amplification in both, etc.) and negative concordance otherwise.
2.3. Statistical analysis
Statistical analysis was done with R programming language version 3.5.1 [26]. Survival time was calculated from time of diagnosis and the defined event was death. Survival was analyzed by Cox regression; patients still alive at the last follow up were censored at that time. Cox proportional hazards regression model and multivariable analysis were performed using the survival r package [27]. Visualization was performed by the r packages of ggplot2 [28]; forest plots (blobbograms) were calculated and drawn by the r package of forest model [29]. Balloon plots (representing the residuals of Chi‐square test) were done with the r package of corrplot [30]. The graphical abstract was created by BioRender.com.
3. Results
3.1. Cohort characteristics
Our cohort included 433 individuals with several different tumor types as described in Rosenberg et al. [31]. All but 28 patients had advanced disease that was surgically unresectable and/or metastatic. For each patient, genomic analysis was carried out twice: (a) for DNA obtained from tissue biopsy (Foundation One test) and (b) for ctDNA (Guardant 360 test). The median time between the tissue biopsy date and the blood draw for ctDNA was 3.7 months (range: −14.6–241.4). The median age at the time of ctDNA liquid biopsy was 62 years (range: 19–93 years) and the median age at diagnosis was 58.6 years (range: 2.2–90.5 years). Approximately 55% of patients were women. The most common tumor types included gastrointestinal cancers, lung cancers, breast and gynecologic cancers, and head and neck cancers [31]. The most common gene mutated in both blood and tissue biopsies was TP53.
3.2. Genomic landscape
There were 853 genomic alterations in the tissue DNA analysis and of these, 739 were point mutations and 114 were amplifications. The mean number of alterations per patient was 1.97 (range: 0–8). There were 680 genomic alterations in the ctDNA analysis and of these, 466 were point mutations and 214 were amplifications. The mean number of alterations per patient was 1.57 (range: 0–15). Table 1 provides the frequency of gene alterations in the cohort.
Table 1.
Number of mutated gene alterations in tissue DNA and ctDNA along with gene and mutation level alteration concordance. For example, for the TP53 gene there is a total of 196 tumors with tissue DNA alterations and 158 tumors with ctDNA alterations. There are 110 tumors for which a TP53 alteration was found in both tissue DNA and ctDNA, but not necessarily in the same positions. There are 69 tumors for which a TP53 alteration in the same locus was identified in both tissue DNA and ctDNA.
| Gene | Tissue DNA alteration number | ctDNA alteration number | Mutual gene alteration number | Mutual mutation alteration number |
|---|---|---|---|---|
| TP53 | 196 | 158 | 110 | 69 |
| KRAS | 81 | 56 | 36 | 11 |
| EGFR | 45 | 43 | 16 | 6 |
| PIK3CA | 44 | 42 | 19 | 6 |
| APC | 40 | 20 | 16 | 14 |
| MYC | 28 | 25 | 8 | 3 |
| PTEN | 26 | 12 | 10 | 9 |
| ERBB2 | 23 | 15 | 8 | 6 |
| CDKN2A | 22 | 8 | 6 | 5 |
| ARID1A | 20 | 7 | 3 | 3 |
| SMAD4 | 18 | 9 | 6 | 4 |
| BRAF | 17 | 31 | 8 | 3 |
| IDH1 | 17 | 2 | 1 | 0 |
| FBXW7 | 11 | 3 | 2 | 2 |
| BRCA2 | 10 | 3 | 1 | 1 |
| GNAS | 10 | 9 | 3 | 2 |
| NF1 | 10 | 9 | 1 | 1 |
| CTNNB1 | 9 | 6 | 4 | 3 |
| ATM | 8 | 7 | 1 | 1 |
| CCNE1 | 8 | 16 | 3 | 1 |
| ESR1 | 8 | 5 | 4 | 2 |
| FGFR1 | 8 | 12 | 4 | 2 |
| MET | 8 | 23 | 4 | 2 |
| CDK4 | 7 | 3 | 1 | 1 |
| KIT | 6 | 6 | 1 | 2 |
| FGFR2 | 5 | 2 | 2 | 1 |
| NRAS | 5 | 4 | 1 | 1 |
| AKT1 | 4 | 2 | 1 | 1 |
| FGFR3 | 4 | 1 | 1 | 1 |
| MAP2K1 | 4 | 2 | 2 | 2 |
| VHL | 4 | 3 | 2 | 1 |
| HRAS | 2 | 2 | 1 | 1 |
| GNA11 | 1 | 1 | 1 | 1 |
| GNAQ | 1 | 1 | 1 | 1 |
3.3. Gene‐level and mutation‐level alteration concordance in blood and tissue
We measured the gene‐level concordance in the cohort. In 249 (57.5%) patients, there were no mutual gene alterations in tissue DNA and ctDNA analysis. In the remaining 184 patients, there was at least one mutual gene alteration. The mean number of mutual gene‐level alterations in the samples was 0.67 per patient (range: 0–5). The number of concordant samples for each concordant gene alteration is given in Table 1. There was a significant correlation between the number of mutual gene‐level alterations and the number of tissue DNA genes with a pathogenic mutation (0.46, P < 2.2e‐16, Pearson correlation test), but not with tissue tumor mutation burden (TMB) (0.044, P=0.37, Pearson correlation test). There was a negative correlation between the time between tissue DNA and ctDNA testing and the number of mutual genes (−0.18, P=0.0001363, Pearson correlation test, Fig. S1). There was a positive correlation between percent ctDNA and tissue gene number (R=0.17, P=0.0004) but not with TMB (R=0.08, P=0.09). Stronger correlation was identified between percent ctDNA and mutual gene number (R=0.44, P < 2.2e‐16), Fig. S2. The number of mutual gene‐level alterations differed markedly between tumor types (P=0.0004, Chi‐square test). Gastrointestinal, breast and gynecologic cancer were associated with a larger number of mutual gene‐level alterations in tissue and blood, whereas brain tumors were associated with a low number of mutual gene‐level alterations in tissue and blood (Fig. S3a).
We also measured the mutation‐level alteration (gene locus) specific concordance in the cohort. The mean number of exact mutual mutation‐level alterations was 0.6 per patient (range: 0–5). There was a significant correlation between the number of mutual mutation‐level alteration number and the number of tissue DNA genes with pathogenic mutations (0.46, P < 2.2e‐16, Pearson correlation test), but not with tissue TMB (0.03, P=0.54, Pearson correlation test). The number of mutual mutation‐level alterations differed markedly between tumor types (P=7.4e‐06, Chi‐square test). Similar to the gene‐level alteration concordance above gastrointestinal, breast, and gynecologic cancer were associated with a larger number of mutual mutation‐level alteration concordance between blood and tissue, whereas brain tumors were associated with a low number of mutual mutation‐level alterations, Fig. S3b.
We estimated the chance of mutual mutation‐level alteration concordance given mutual gene‐level concordance for genes with five or more concordant samples (11 genes, Fig. 1). The median frequency was 0.63 (range: 0.306–0.875).
Fig. 1.
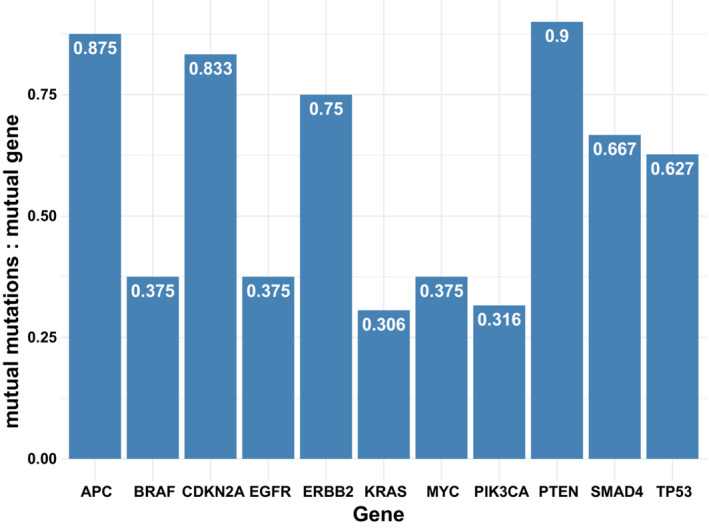
The frequency of mutation‐level concordance given gene‐level concordance. Only genes with gene concordance in more than five samples are shown. Gene‐level concordance implies that the same gene (but not necessarily the same locus) is aberrant in both ctDNA and tissue; mutation‐level concordance implies that the same locus in the same gene is aberrant in both ctDNA and tissue.
3.4. Gene‐level and mutation‐level (locus level) alteration concordance in blood and tissue were predictive of shorter survival in multivariate analysis
A higher mutual gene‐level alteration number was associated with shorter overall survival (OS) (Fig. 2A, P=7.21e‐9, Cox univariate survival test). As shown in Fig. 2B, this was also confirmed in multivariable analysis (hazard ratio [HR]=1.25, P=0.014). Other factors associated with shorter OS in the multivariable test were higher age at diagnosis, certain tumor types (brain and hepatopancreatobiliary), shorter time between the tests, and higher percent ctDNA. Importantly, the tumor gene number and ctDNA gene number were also associated with overall survival (P=0.021, P=1.08E‐5, respectively). A higher percent of ctDNA was also significantly associated with shorter OS (P=7.43E‐6) (Fig. S4). However, in the multivariable analysis tumor gene number was not significant and ctDNA gene number was marginally significant (HR=1.08, P=0.06). Percent ctDNA was independently significant in the multivariable analysis (HR=1.01, P=0.03). These differences between the association of survival with tissue DNA and ctDNA parameters possibly reflect the higher importance of number of ctDNA mutations for survival predictions. Still, the highest level of independent significance was for concordance between tumor and ctDNA alterations and poorer survival (HR=1.25, P=0.014, multivariable Cox regression analysis).
Fig. 2.
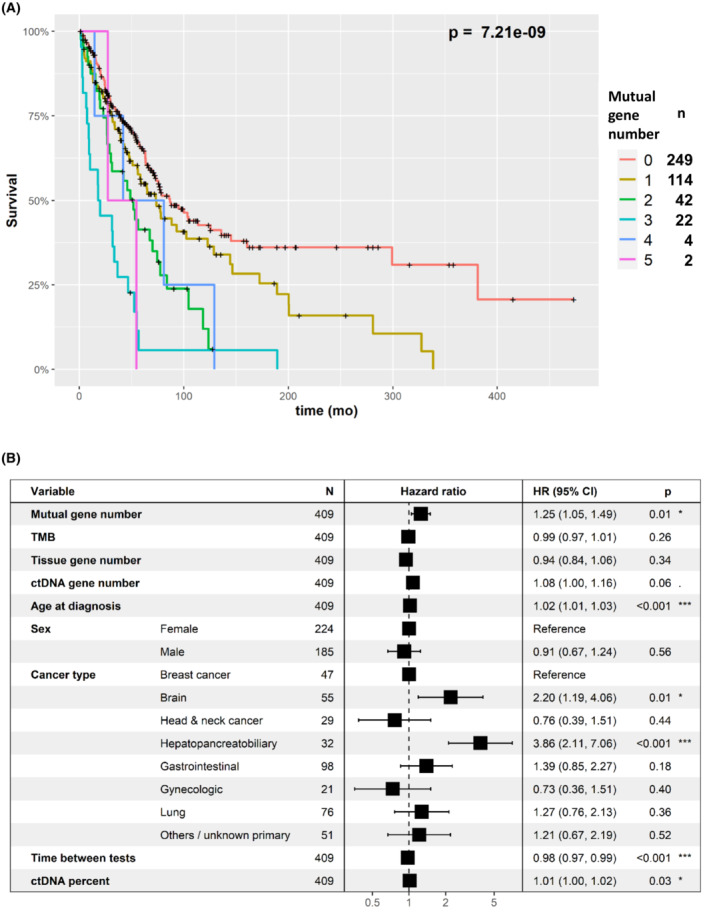
Survival analysis in relation to the number of concordant genes (gene‐level concordance). (A) Kaplan–Meier, univariate analysis. The plots show that the greater the number of gene‐level alteration concordance in tissue and blood ctDNA, the shorter the survival. Number of samples in each mutual gene number category are provided in the right legend. (B) Multivariable analysis (Cox regression). The figure shows that greater gene‐level alteration concordance in tissue and blood (denoted as “mutual gene number”) was associated with significantly shorter survival, independent of other factors. All parameters aside from sex and cancer type were assessed as continuous variables. Younger age, longer time between tests, and lower ctDNA percent was associated with longer survival times, whereas brain and hepatopancreatobiliary cancers were associated with shorter survival times. (Note that the box overlaps the “1” line at times, because of a graphical limitation, although the P value [and 95% CI] are significant.) CI, confidence interval; ctDNA, circulating tumor DNA; HR, hazard ratio; TMB, tumor mutational burden. P values: *: 0.01–0.05, ***: 0–0.001.
Since the time gap between tissue DNA and ctDNA tests is negatively correlated with the mutual gene number, in addition to the multivariable analysis we also performed analysis excluding patients for which the temporal gap was more than 6, 12, 24, and 48 years. Indeed, despite the power reduction due to excluding samples―the P values of number of mutual genes and survival was higher. The P value for all the data was 0.014. For the filtered datasets: <48 months – 0.008, <24 months – 0.003, <12 months – 0.003, <6 months – 0.002 (Fig. S5). A higher mutual mutation alteration number was also associated with shorter OS (P=4.52e‐9, Cox univariate survival test). This was also confirmed in a multivariable analysis (HR=1.25, P=0.013, Fig. S6).
Patients with no mutual gene alteration in blood and tissue had longer OS compared to patients with at least one mutual gene alteration (P=6.18e‐6, Cox univariate test), but this was not significant in multivariable analysis (HR=1.14, P=0.48). Higher thresholds resulted in significance in the multivariable test: patients with two or more mutual genes had shorter OS compared to patients with zero or one mutual genes (HR=1.49, P=0.047). The analysis was even more significant when comparing patients with three or more mutual gene alterations to patients with two or less mutual gene alterations (HR=2.38, P=0.0005) see Fig. 3.
Fig. 3.
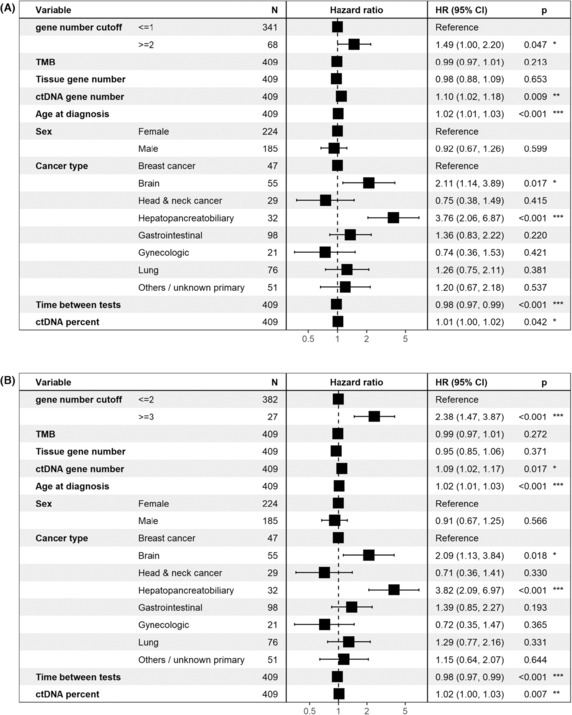
Multivariable survival analysis (Cox regression) with different cutoffs for gene‐level concordance. Regardless, if the cutoff was ≥2 vs <2 or ≥3 vs <3, greater gene‐level concordance is independently associated with shorter survival. (A) Patients with two or more concordant altered genes vs one or zero concordant genes. (B) Patients with three or more concordant genes vs zero to two concordant genes. CI, confidence interval; ctDNA, circulating tumor DNA; HR, hazard ratio; TMB, tumor mutational burden. P values: *: 0.01–0.05, **: 0.001–0.01, ***: 0–0.001.
Next, we wanted to examine whether there is a survival difference between patients with gene concordance (and no mutation specific concordance) compared to patients with at least one mutation specific concordance. Importantly, for most samples with at least one mutual gene there was at least one mutual mutation. Hence, there is a paucity of samples (N=22) with mutual genes and no mutual mutations compared to samples with both (N=156). As shown in Fig. 4, the survival curve of patients with mutual genes and no mutual mutations was similar to the curve of patients without any mutual genes and was significantly longer compared to patients with at least one mutual mutation (P=4.35e‐7, Cox univariate test, comparing the three groups). However, this was not significant in the multivariable analysis (HR=1.23, P=0.289). In order to identify the major factors that reduced the significance of the test, we repeated testing with exclusion of one factor at a time. Omitting ctDNA gene number was the only exclusion resulting in significance of mutual mutation status (HR=1.48, P=0.03). Omitting the time between tests factor resulted in marginal significance of mutual mutations status (HR=1.43, P=0.059). Indeed, the ctDNA gene number was highly correlated with mutual mutations status (Fig. 5, P < 2.2e‐16, Kruskal–Wallis test) and associated with survival (P=1.08e‐5, Cox univariate test).
Fig. 4.
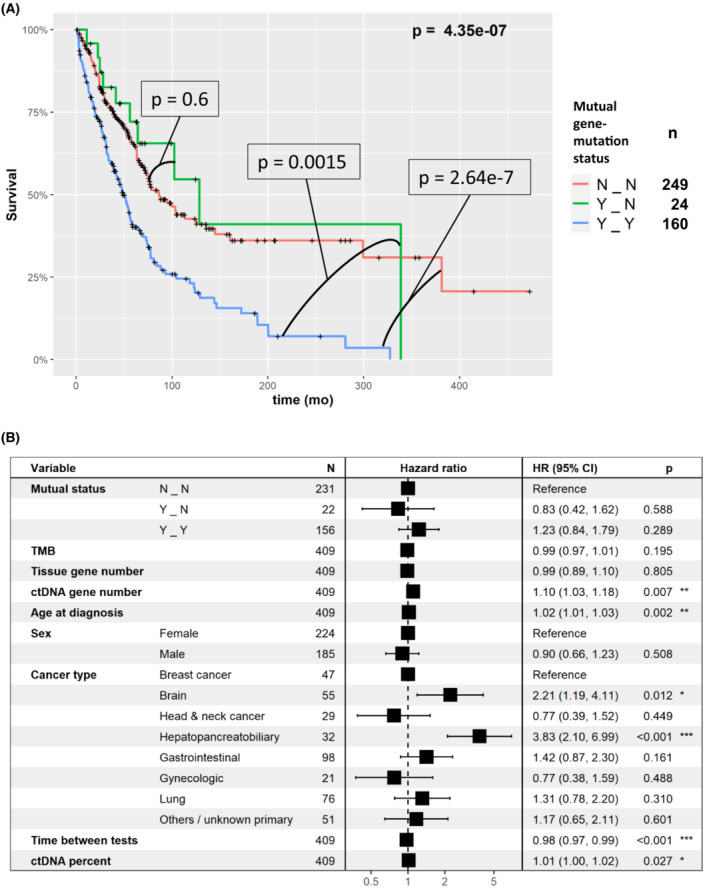
Survival analysis of mutual gene‐level and mutual mutation‐level alteration concordance status between blood and tissue. N_N, no mutual gene‐level nor mutual mutation‐level alteration concordance; Y_N, at least one mutual gene‐level but no mutual mutation‐level alteration concordance; Y_Y, at least one mutual gene‐level and at least one mutual mutation‐level alteration concordance between blood and tissue. (A) Kaplan–Meier, univariate analysis. The plot shows that there is no difference in survival between patients with no mutual gene‐level nor mutual mutation‐level alteration concordance (N_N) and at least one mutual gene‐level but no mutual mutation‐level alteration concordance (Y_N) (P=0.6); however, patients with at least one mutual gene‐level and at least one mutual mutation‐level alteration concordance between blood and tissue (Y_Y) have significantly shorter survival than the first two groups (Y_Y vs N_N, P=2.64e‐7; Y_Y vs Y_N, P=0.0015, Cox univariate test). Examining all three curves confirms this observation (P = 4.35e‐7), as shown in the graphic. These results suggest that it is mutation‐level alteration concordance that is important for predicting outcome in univariate analysis. The number of samples in each mutual gene‐mutation status category are provided in the right legend. (B) Multivariable analysis (Cox regression). In multivariable analysis, the difference between the concordance groups was not significant (the lack of impact of mutation level concordance on outcome in multivariable analysis could be attributed to the fact that only 22 tumors had mutual genes but not mutual gene mutation locus concordance). CI, confidence interval; ctDNA, circulating tumor DNA; HR, hazard ratio; TMB, tumor mutational burden. P values: *: 0.01–0.05, **: 0.001–0.01, ***: 0–0.001.
Fig. 5.
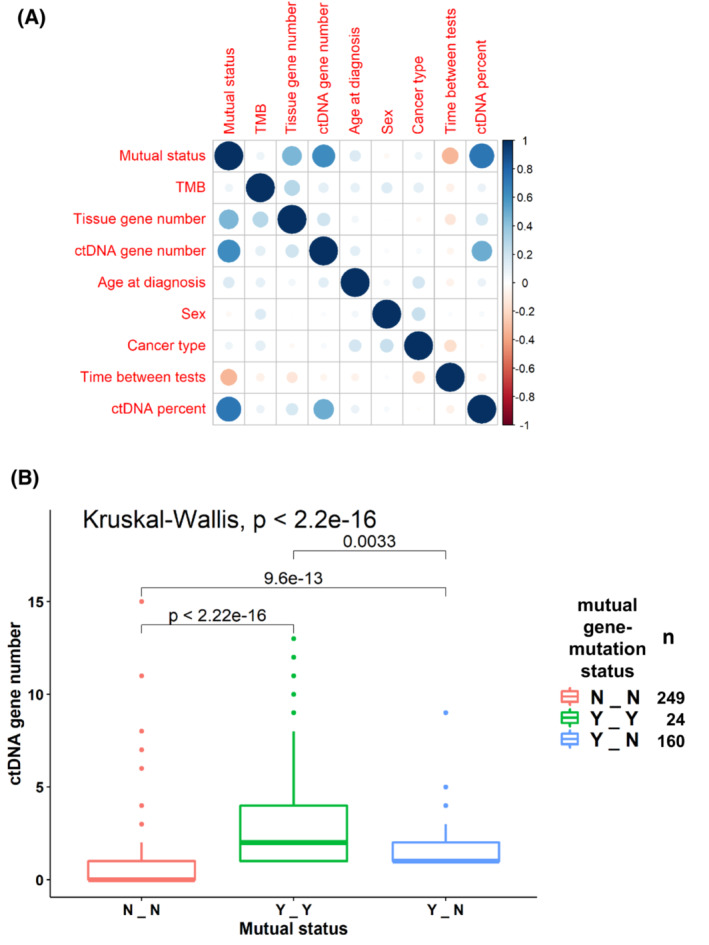
(A) Correlation plot of the independent variables tested. Balloon plot that represents the residuals of the Chi‐square test. Blue implies positive correlation between factors and red implies negative correlation. Intensity of the color reflects the magnitude of the correlation (greater intensity = greater degree of correlation). Mutual status is defined in three levels: N_N, – no mutual gene‐level nor mutual mutation‐level alteration concordance; Y_N, at least one mutual gene‐level but no mutual mutation‐level alteration concordance; Y_Y, at least one mutual gene‐level and at least one mutual mutation‐level alteration concordance between blood and tissue. (B) ctDNA gene number compared to the mutual status of gene‐level and mutation‐level alteration concordance between blood and tissue. Central line represents median value and the box represents the range of 1st to 3rd quartiles. The graphic shows that a higher ctDNA gene alteration number is associated with a greater number of mutual gene‐level alteration concordance (Y‐N) between blood and tissue and an even greater number of mutation‐level alteration concordance between tissue and blood (Y‐Y). Number of samples in each mutual gene‐mutation status category are provided in the right legend. ctDNA, circulating tumor DNA; TMB, tumor mutational burden.
4. Discussion
In this study, we investigated a real‐world cohort of 433 cancer patients for whom two panel genomic tests were performed: tissue DNA and ctDNA. We analyzed only genes and alterations that were sequenced in both tests. We focused on the genes that were mutated in both tests for individual patients' tumors and on genes for which the same locus‐specific alteration was identified in both tests. We aimed to characterize the parameters that were associated with the number of mutual genes and mutual mutations, as well as to investigate the survival implication of these numbers.
We identified that the number of mutual genes per patient was associated with several parameters: several tumor types (gastrointestinal, breast, and gynecologic cancer) showed increased mutual gene alteration numbers in blood and tissue and, as expected, brain tumors were associated with lower numbers of mutual genes, possibly related to less ctDNA shedding in brain tumor patients [14, 32]. Our prior studies have also shown higher concordance rates for blood and tissue gene alterations in specific gastrointestinal malignancies such as colorectal cancer when examining KRAS or TP53 mutations [22, 33].
Importantly, the number of mutual genes altered in blood and tissue was associated with the number of pathogenic mutations in tissue DNA, but not with the general number of alterations as measured by TMB (which in our system does not include deleterious alterations in the TMB count). This finding seems to emphasize that the association of mutual gene alterations in blood and tissue is not related to a higher mutation rate, but rather to the biologic function of the pathogenic variants, perhaps resulting in a selective shedding into the blood for them.
Next, we analyzed the survival implications of gene concordance and identified that the number of concordant gene alterations in blood and tissue correlated with shorter survival independently from other parameters measured. The mere presence of concordant tissue and liquid alterations in one gene was not significantly associated with survival in the multivariable analysis. However, a threshold of two or more mutual gene alterations in tissue and blood was highly significant in predicting a worse survival outcome.
Interestingly, for most of the samples with mutual blood and tissue gene alterations, there were also mutual mutations (meaning that the same locus was altered in the tissue and blood DNA). The correlations between mutual mutation concordance versus mutual gene concordance might be difficult to assess because of the small number of samples in our current study with blood and tissue concordant gene alterations, but discordant locus (mutation) concordance. However, in our prior report examining just TP53 alterations [31], the presence of TP53 mutational (locus) concordance in blood and tissue was associated with poor survival independently of other parameters tested. It should be noted that for some genes, such as TP53, locus discordance in blood and tissue might be attributable to clonal hematopoiesis of indetermined potential (CHIP) [34].
This study had several limitations. The cohort heterogeneity of tumor types with different mutational landscapes and prognosis may create bias. However, for this reason we carried out multivariable analysis to control for tumor types. In addition, we did not consider the effect of therapies provided to the patients. It is known that different therapies could affect the mutations detected in ctDNA, since some resistant clones are emerging after therapy. However, it should be kept in mind that the therapies received in this group were heterogenous, and this further suggests that the concordance between blood and tissue alterations is a prognostic factor, across tumor types and their management. A third limitation is the variable temporal gap between tissue DNA and ctDNA testing. This could affect the concordance rate, and thus the results as well. This could explain that in 249 (57.5%) patients, no mutual gene alterations in tissue DNA and ctDNA analysis were found. However, it should be pointed out that despite these limitations, and despite the temporal gaps in this real‐world dataset, concordance between tissue DNA and ctDNA still predicted OS. This was independent of time between the tests in a multivariable analysis. A fourth weakness is that we were limited to investigate genes that were sequenced in both tissue DNA and ctDNA testing, and we could only assess point mutations and amplifications. Investigating exome sequencing data might provide a more comprehensive view of the clinical and biological importance of performing both tests. A final limitation is that the technology does not permit analysis of subclones which would require isolation of single cells rather than bulk ctDNA. Importantly, this is a real‐world cohort. While such data provide interesting clinical insights, controlled trials are needed to better characterize the clinical impact of these findings.
5. Conclusion
To summarize, in this study we showed that high numbers of genes concordantly mutated in tissue and blood correlate with shorter survival independent of other factors. Larger, prospective clinical trials should be performed in order to establish the clinical utility of the findings presented here.
Author contributions
SR: Conceptualization, data curation, formal analysis, validation, investigation, visualization, methodology, writing‐original draft. GBC: formal analysis, validation, investigation, writing‐review and editing. SK: Data curation, validation, writing‐review and editing. RO: Data curation, validation, writing‐review and editing. SML: Conceptualization, resources, supervision, funding acquisition, writing‐review and editing. RK: Conceptualization, resources, supervision, funding acquisition, validation, investigation, methodology, writing‐original draft, writing‐review and editing.
Conflict of interest
Razelle Kurzrock receives research funding from Genentech, Merck Serono, Pfizer, Boehringer Ingelheim, TopAlliance, Takeda, Incyte, Debiopharm, Medimmune, Sequenom, Foundation Medicine, Konica Minolta, Grifols, Omniseq, and Guardant, as well as consultant and/or speaker fees and/or advisory board for X‐Biotech, Neomed, Pfizer, Actuate Therapeutics, Roche, Turning Point Therapeutics, TD2/Volastra, Bicara Therapeutics, Inc.; has an equity interest in IDbyDNA and CureMatch Inc.; serves on the Board of CureMatch and CureMetrix, and is a co‐founder of CureMatch. Scott M. Lippman serves on the Board of Biological Dynamics, and is a co‐founder of io9. Shumei Kato serves as a consultant for Medpace, Foundation Medicine, NeoGenomics and CureMatch. He receives speaker's fee from Roche and Bayer, and advisory board for Pfizer. He has research funding from ACT Genomics, Sysmex, Konica Minolta, OmniSeq and Personalis. Shai Rosenberg is a medical and scientific consultant of Barcode and Oncotest companies, he receives research funding from MSD.
Peer review
The peer review history for this article is available at https://publons.com/publon/10.1002/1878‐0261.13383.
Supporting information
Fig. S1. Correlation between the time gap between tissue DNA and ctDNA tests and the number of concordant genes.
Fig. S2. Correlation plot of tissue DNA and ctDNA parameters.
Fig. S3. Balloon plots representing the residuals of the Chi‐square tests of: a. mutual gene concordance number tumor type; b. mutual mutation concordance number tumor type.
Fig. S4. Univariate survival analysis of (a) quartiles of percent ctDNA, (b) quartiles of tissue DNA gene number, (c) quartiles of ctDNA gene number.
Fig. S5. Multivariable analysis for the survival test in relation to the number of concordant genes (gene‐level concordance), similar to Fig. 2B including only samples for which the time gap between tissue DNA and ctDNA (a) ≤ 48 months, (b) ≤ 24 months, (c) ≤ 12 months, (d) ≤ 6 months.
Fig. S6. Survival analysis in relation to the number of concordant mutations (mutation‐level concordance).
Table S1. A list of genes compared in the two cohorts of the study.
Table S2. (a) Clinical information and sample‐by‐sample comparison of the two platforms, both at a gene level and at a mutation/variation level. (b) Sample information including all genetic alterations (not only the non‐overlapping genes) identified by the tissue biopsy and the ctDNA exams.
Acknowledgments
This work was supported by the National Cancer Institute [P30 CA023100] and the Joan and Irwin Jacobs Fund (philanthropic fund), Hadassah‐France.
Data accessibility
The datasets used and/or analyzed during the current study are provided in Table S2.
References
- 1. Ciriello G, Miller ML, Aksoy BA, Senbabaoglu Y, Schultz N, Sander C. Emerging landscape of oncogenic signatures across human cancers. Nat Genet. 2013;45(10):1127–33. [DOI] [PMC free article] [PubMed] [Google Scholar]
- 2. Weinstein JN, Collisson EA, Mills GB, Shaw KR, Ozenberger BA, Ellrott K, et al. The cancer genome atlas pan‐cancer analysis project. Nat Genet. 2013;45(10):1113–20. [DOI] [PMC free article] [PubMed] [Google Scholar]
- 3. Zehir A, Benayed R, Shah RH, Syed A, Middha S, Kim HR, et al. Mutational landscape of metastatic cancer revealed from prospective clinical sequencing of 10,000 patients. Nat Med. 2017;23(6):703–13. [DOI] [PMC free article] [PubMed] [Google Scholar]
- 4. Lawrence MS, Stojanov P, Polak P, Kryukov GV, Cibulskis K, Sivachenko A, et al. Mutational heterogeneity in cancer and the search for new cancer‐associated genes. Nature. 2013;499(7457):214–8. [DOI] [PMC free article] [PubMed] [Google Scholar]
- 5. Kurzrock R, Giles FJ. Precision oncology for patients with advanced cancer: the challenges of malignant snowflakes. Cell Cycle. 2015;14(14):2219–21. [DOI] [PMC free article] [PubMed] [Google Scholar]
- 6. Kato S, Krishnamurthy N, Banks KC, De P, Williams K, Williams C, et al. Utility of genomic analysis In circulating tumor DNA from patients with carcinoma of unknown primary. Cancer Res. 2017;77(16):4238–46. [DOI] [PMC free article] [PubMed] [Google Scholar]
- 7. Van Allen EM, Wagle N, Stojanov P, Perrin DL, Cibulskis K, Marlow S, et al. Whole‐exome sequencing and clinical interpretation of formalin‐fixed, paraffin‐embedded tumor samples to guide precision cancer medicine. Nat Med. 2014;20(6):682–8. [DOI] [PMC free article] [PubMed] [Google Scholar]
- 8. Rodon J, Soria JC, Berger R, Miller WH, Rubin E, Kugel A, et al. Genomic and transcriptomic profiling expands precision cancer medicine: the WINTHER trial. Nat Med. 2019;25(5):751–8. [DOI] [PMC free article] [PubMed] [Google Scholar]
- 9. Sicklick JK, Kato S, Okamura R, Schwaederle M, Hahn ME, Williams CB, et al. Molecular profiling of cancer patients enables personalized combination therapy: the I‐PREDICT study. Nat Med. 2019;25(5):744–50. [DOI] [PMC free article] [PubMed] [Google Scholar]
- 10. Shaw AT, Bauer TM, de Marinis F, Felip E, Goto Y, Liu G, et al. First‐line Lorlatinib or Crizotinib in advanced ALK‐positive lung cancer. N Engl J Med. 2020;383(21):2018–29. [DOI] [PubMed] [Google Scholar]
- 11. Drilon A, Laetsch TW, Kummar S, DuBois SG, Lassen UN, Demetri GD, et al. Efficacy of Larotrectinib in TRK fusion‐positive cancers in adults and children. N Engl J Med. 2018;378(8):731–9. [DOI] [PMC free article] [PubMed] [Google Scholar]
- 12. Schwaederle M, Zhao M, Lee JJ, Eggermont AM, Schilsky RL, Mendelsohn J, et al. Impact of precision medicine in diverse cancers: a meta‐analysis of phase II clinical trials. J Clin Oncol. 2015;33(32):3817–25. [DOI] [PMC free article] [PubMed] [Google Scholar]
- 13. Diehl F, Schmidt K, Choti MA, Romans K, Goodman S, Li M, et al. Circulating mutant DNA to assess tumor dynamics. Nat Med. 2008;14(9):985–90. [DOI] [PMC free article] [PubMed] [Google Scholar]
- 14. Bettegowda C, Sausen M, Leary RJ, Kinde I, Wang Y, Agrawal N, et al. Detection of circulating tumor DNA in early‐ and late‐stage human malignancies. Sci Transl Med. 2014;6(224):224ra24. [DOI] [PMC free article] [PubMed] [Google Scholar]
- 15. Corcoran RB, Chabner BA. Application of cell‐free DNA analysis to cancer treatment. N Engl J Med. 2018;379(18):1754–65. [DOI] [PubMed] [Google Scholar]
- 16. Rossi G, Ignatiadis M. Promises and pitfalls of using liquid biopsy for precision medicine. Cancer Res. 2019;79:2798–804. [DOI] [PubMed] [Google Scholar]
- 17. Kato S, Schwaederle MC, Fanta PT, Okamura R, Leichman L, Lippman SM, et al. Genomic assessment of blood‐derived circulating tumor DNA in patients with colorectal cancers: correlation with tissue sequencing, therapeutic response, and survival. JCO Precis Oncol. 2019;3:PO.18.00158. [DOI] [PMC free article] [PubMed] [Google Scholar]
- 18. Adalsteinsson VA, Ha G, Freeman SS, Choudhury AD, Stover DG, Parsons HA, et al. Scalable whole‐exome sequencing of cell‐free DNA reveals high concordance with metastatic tumors. Nat Commun. 2017;8(1):1324. [DOI] [PMC free article] [PubMed] [Google Scholar]
- 19. Zill OA, Greene C, Sebisanovic D, Siew LM, Leng J, Vu M, et al. Cell‐free DNA next‐generation sequencing in pancreatobiliary carcinomas. Cancer Discov. 2015;5(10):1040–8. [DOI] [PMC free article] [PubMed] [Google Scholar]
- 20. Soria‐Comes T, Palomar‐Abril V, Ureste MM, Guerola MT, Maiques ICM. Real‐world data of the correlation between EGFR determination by liquid biopsy in non‐squamous non‐small cell lung cancer (NSCLC) and the EGFR profile in tumor biopsy. Pathol Oncol Res. 2019;26:845–51. [DOI] [PubMed] [Google Scholar]
- 21. Kato S, Okamura R, Baumgartner JM, Patel H, Leichman L, Kelly K, et al. Analysis of circulating tumor DNA and clinical correlates in patients with esophageal, gastroesophageal junction, and gastric adenocarcinoma. Clin Cancer Res. 2018;24(24):6248–56. [DOI] [PMC free article] [PubMed] [Google Scholar]
- 22. Mardinian K, Okamura R, Kato S, Kurzrock R. Temporal and spatial effects and survival outcomes associated with concordance between tissue and blood KRAS alterations in the pan‐cancer setting. Int J Cancer. 2019;146:566–76. [DOI] [PMC free article] [PubMed] [Google Scholar]
- 23. Frampton GM, Fichtenholtz A, Otto GA, Wang K, Downing SR, He J, et al. Development and validation of a clinical cancer genomic profiling test based on massively parallel DNA sequencing. Nat Biotechnol. 2013;31(11):1023–31. [DOI] [PMC free article] [PubMed] [Google Scholar]
- 24. Lanman RB, Mortimer SA, Zill OA, Sebisanovic D, Lopez R, Blau S, et al. Analytical and clinical validation of a digital sequencing panel for quantitative, highly accurate evaluation of cell‐free circulating tumor DNA. PLoS One. 2015;10(10):e0140712. [DOI] [PMC free article] [PubMed] [Google Scholar]
- 25. Chalmers ZR, Connelly CF, Fabrizio D, Gay L, Ali SM, Ennis R, et al. Analysis of 100,000 human cancer genomes reveals the landscape of tumor mutational burden. Genome Med. 2017;9(1):34. [DOI] [PMC free article] [PubMed] [Google Scholar]
- 26. R Core Team . R: a language and environment for statistical computing. Vienna: R Foundation for Statistical Computing; 2018. [Google Scholar]
- 27. Terry MT, Patricia MG. Modeling survival data: extending the cox model. New York: Springer; 2000. [Google Scholar]
- 28. Wickham H. ggplot2: elegant graphics for data analysis. New York: Springer; 2009. [Google Scholar]
- 29. Kennedy N. forestmodel: Forest Plots from Regression Models. 2018. [cited 2018 Apr 25]. Available from: https://mran.microsoft.com/snapshot/2018‐06‐02/web/packages/forestmodel/index.html
- 30. Wei T, Simko V. R package “corrplot”: visualization of a correlation matrix. 2021. Available from: https://github.com/taiyun/corrplot
- 31. Rosenberg S, Okamura R, Kato S, Soussi T, Kurzrock R. Survival implications of the relationship between tissue versus circulating tumor DNA TP53 mutations – a perspective from a real‐world precision medicine cohort. Mol Cancer Ther. 2020;19:2612–20. [DOI] [PubMed] [Google Scholar]
- 32. Okamura R, Piccioni DE, Boichard A, Lee S, Jimenez RE, Sicklick JK, et al. High prevalence of clonal hematopoiesis‐type genomic abnormalities in cell‐free DNA in invasive gliomas after treatment. Int J Cancer. 2021;148(11):2839–47. [DOI] [PMC free article] [PubMed] [Google Scholar]
- 33. Bieg‐Bourne CC, Okamura R, Kurzrock R. Concordance between TP53 alterations in blood and tissue: impact of time interval, biopsy site, cancer type and circulating tumor DNA burden. Mol Oncol. 2020;14(6):1242–51. [DOI] [PMC free article] [PubMed] [Google Scholar]
- 34. Chen S, Liu Y. p53 involvement in clonal hematopoiesis of indeterminate potential. Curr Opin Hematol. 2019;26(4):235–40. [DOI] [PMC free article] [PubMed] [Google Scholar]
Associated Data
This section collects any data citations, data availability statements, or supplementary materials included in this article.
Supplementary Materials
Fig. S1. Correlation between the time gap between tissue DNA and ctDNA tests and the number of concordant genes.
Fig. S2. Correlation plot of tissue DNA and ctDNA parameters.
Fig. S3. Balloon plots representing the residuals of the Chi‐square tests of: a. mutual gene concordance number tumor type; b. mutual mutation concordance number tumor type.
Fig. S4. Univariate survival analysis of (a) quartiles of percent ctDNA, (b) quartiles of tissue DNA gene number, (c) quartiles of ctDNA gene number.
Fig. S5. Multivariable analysis for the survival test in relation to the number of concordant genes (gene‐level concordance), similar to Fig. 2B including only samples for which the time gap between tissue DNA and ctDNA (a) ≤ 48 months, (b) ≤ 24 months, (c) ≤ 12 months, (d) ≤ 6 months.
Fig. S6. Survival analysis in relation to the number of concordant mutations (mutation‐level concordance).
Table S1. A list of genes compared in the two cohorts of the study.
Table S2. (a) Clinical information and sample‐by‐sample comparison of the two platforms, both at a gene level and at a mutation/variation level. (b) Sample information including all genetic alterations (not only the non‐overlapping genes) identified by the tissue biopsy and the ctDNA exams.
Data Availability Statement
The datasets used and/or analyzed during the current study are provided in Table S2.