

Abstract
Background:
Elder abuse (EA) is common and has devastating health impacts. Frailty may increase susceptibility to and consequences of EA for older adults making healthcare system detection more likely, but this relationship has been difficult to study. We examined the association between a recently validated frailty index and referral to social work (SW) for EA evaluation in the Veterans Administration (VA) healthcare system.
Methods:
We conducted a case-control study of veterans age ≥60 years evaluated by SW for suspected EA between 2010–18 (n=14,723) and controls receiving VA primary care services in the same 60-day window (n=58,369). We used VA and Medicare claims data to measure frailty (VA Frailty Index) and comorbidity burden (Elixhauser Comorbidity Index) in the 2-years prior to index. We used adjusted logistic regression models to examine the association of frailty or comorbidity burden with referral to SW for EA evaluation. We used Akaike Information Criterion (AIC) values to evaluate model fit and likelihood ratio (LR) tests to assess the statistical significance of including frailty and comorbidity in the same model.
Results:
The sample (n = 73,092) had mean age 72 years; 14% were Black and 6% Hispanic. More cases (67%) than controls (36%) were frail. LR tests comparing the nested models were highly significant (p<0.001) and AIC values indicated superior model fit when including both frailty and comorbidity in the same model. In a model adjusting for comorbidity and all covariates, pre-frailty (aOR v. robust 1.7; 95% CI 1.5 – 1.8) and frailty (aOR v. robust 3.6; 95% CI 3.3 – 3.9) were independently associated with referral for EA evaluation.
Conclusions:
A claims-based measure of frailty predicted referral to SW for EA evaluation in a national healthcare system independent of comorbidity burden. Electronic health record measures of frailty may facilitate EA risk assessment and detection for this important but under-recognized phenomenon.
Keywords: Elder abuse, frailty, Veterans
Introduction
Annually, an estimated 10% of community-dwelling older adults experience elder abuse (EA), defined as physical, sexual, or psychological abuse, financial exploitation, or neglect at the hands of a trusted person.1–3 EA is associated with adverse health impacts, including depression,4 emergency department visits,5 hospitalization,6 nursing home placement7 and mortality.8–10 Despite the high prevalence and health consequences, less than 5% of EA cases are estimated to be detected,3 greatly limiting opportunities for interventions to improve health and safety for these older adults. Healthcare visits provide a unique opportunity for EA identification and response, as medical assessment may be the only time isolated at-risk older adults leave their home.5,11 Yet currently, EA screening and other detection efforts are not part of routine clinical care of older adults in most settings due in part to insufficient understanding of which high-risk subpopulations may most benefit from EA assessments. While some risk factors for EA, such as disability and social isolation, have been demonstrated in survey-based studies,1,12–15 identifying factors easily measurable from the electronic health record (EHR) could enhance EA detection efforts in healthcare populations.
Frailty, a vulnerability state of decreased physiologic reserve to stressors,16 presents risk for various negative outcomes, including hospitalization,17 institutionalization,18,19 peri-operative morbidity,20 and death.21 Frailty, which is associated with but distinct22 from other EA risk factors such as disability and comorbidity,1,12 may increase both susceptibility to (e.g., via higher likelihood of requiring assistance with personal care) and consequences of (e.g., sustaining more severe injuries from physical abuse) experiencing EA, yet the relationship between frailty and EA has not been studied. Older veterans represent a large population with both high prevalence of frailty21 and previously studied EA risk factors, such as functional impairment, cognitive impairment, social isolation and mental health problems.23 Additionally, identification of older veterans who have been referred to social work for EA concerns is possible in the Veterans Health Administration (VHA) EHR.24 While frailty remains infrequently measured at the point-of-care and rarely documented in the EHR, multiple claims-data based frailty indices have recently been developed that allow assessment of frailty from administrative data. In 2019, the VA Frailty Index (VA-FI) was developed,21 and subsequently validated and updated,25 by Orkaby et. al allowing the measurement of frailty in VHA data. Thus, there is a unique opportunity to use VHA EHR and other administrative data to better understand the relationship of frailty to clinical suspicion for EA.
The objective of this study was to examine the independent association of frailty with referral for elder abuse evaluation. We hypothesized that frailty would be positively associated with referral for elder abuse evaluation. We consider three plausible pathways by which frailty may lead to higher likelihood of receiving a social work evaluation for EA concerns (Figure 1): directly increasing the risk, severity, frequency, or consequences of experiencing EA; increasing the likelihood of detection in the presence of EA or EA-related risk factors; and increasing likelihood of encounters with trained health professionals. Because comorbidity burden may also lead to higher likelihood of referral for EA evaluation through similar pathways, we were also interested in understanding the degree to which any association between frailty and referral for EA evaluation was independent of comorbidity burden.
Figure 1. Conceptual model of potential pathways linking frailty with referral for elder abuse evaluation in the healthcare setting.
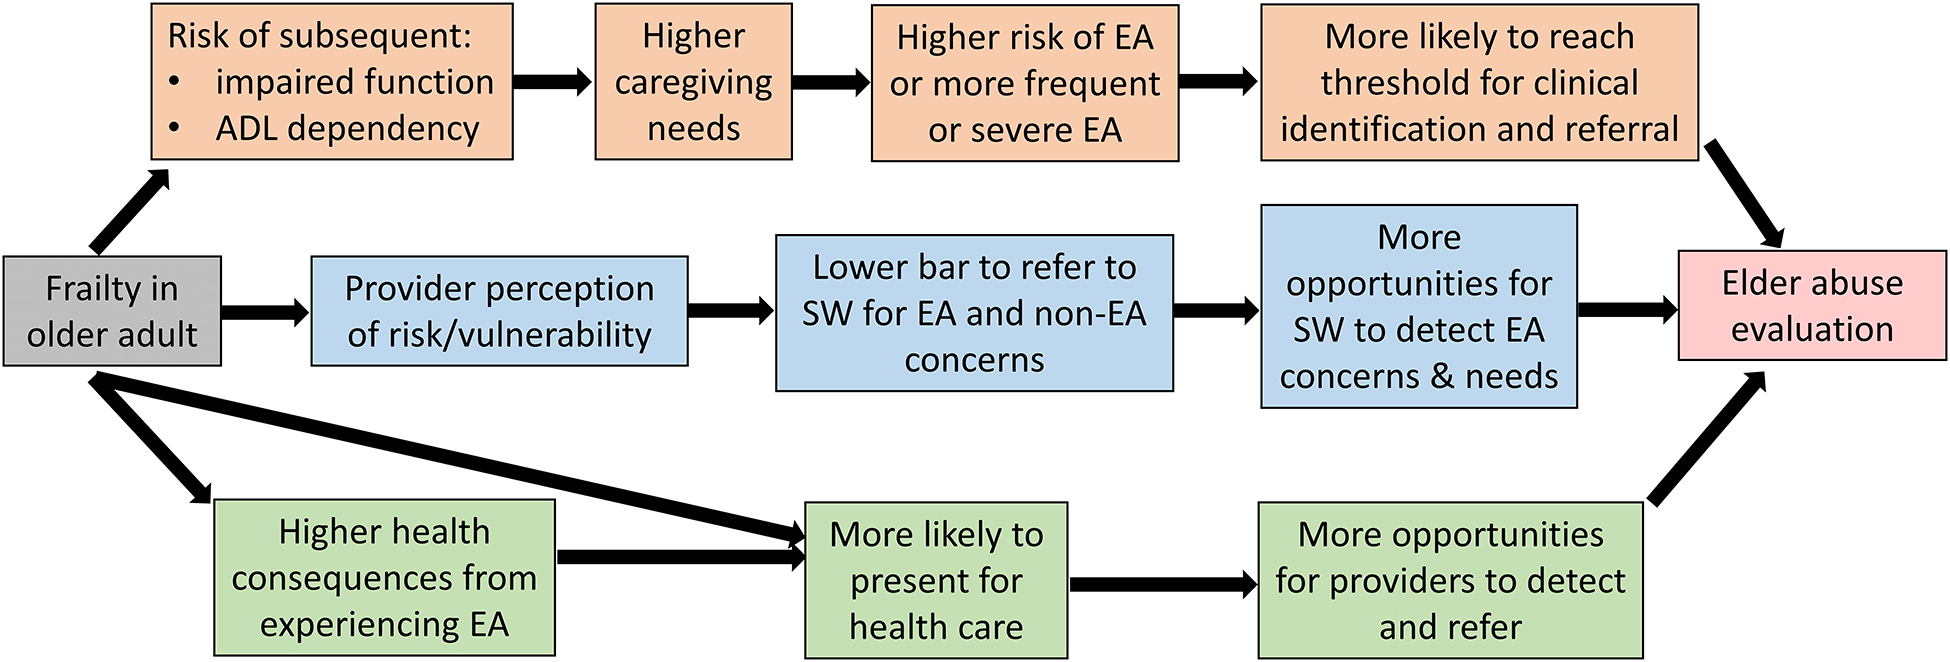
ADL = activities of daily living; EA = elder abuse; SW = social work
Methods
Study Design and Data Sources
We used a case-control study design using retrospective data from the VHA national Corporate Data Warehouse (CDW), a repository from VHA clinical and administrative systems. Medicare data for veterans accessible through the VA Information Resource Center (VA/CMS data) were used to capture claims for healthcare received outside of VHA, as almost all veterans aged 65 or older, and many under age 65 with disability, are dually enrolled in VHA and Medicare.26,27 VA/CMS data includes claims data for all veterans enrolled in Fee-for-Service (FFS) Medicare, but only enrollment data for those in Medicare Advantage (MA) plans.
Case and Control Selection
Details on our population and study approach have been published previously.24 Briefly, cases and controls were veteran enrollees from 130 national VHA healthcare facilities who were aged ≥60 years and actively engaged in primary care between 2010 – 2018. Cases were veterans who completed a consultation with social work for a referral reason of suspected EA, as documented in the EHR. We did not have access to data on the type of EA suspected, whether suspicion remained following evaluation, if a report was made to Adult Protective Services, or the outcome of any non-VA investigation substantiating the concern. We used the social work encounter date as the index date and further restricted cases to patients who had a primary care visit within 60 days prior to their index date to capture patients who were actively engaged in primary care at the time of the EA-related visit to ensure they would have had the opportunity for documentation of claims-based diagnoses of interest and to improve comparability to the control group.
Controls were VHA primary care patients who did not have a social work consultation for EA or any other administrative data marker that might indicate clinical suspicion of EA (e.g., International Classification of Disease diagnostic codes or local, rather than national, VA-specific templated notes for confirmed or suspected abuse or neglect).24 Initially, five controls for each case were randomly selected using simple random sampling without replacement from a pool of those having a primary care visit within the same 60-day window as the case index date.
We excluded any case or control who was not VHA-enrolled two years prior to the index date to ensure two full years of VHA look-back data. We additionally excluded controls originating from 15 VHA sites where no EA cases were identified using our methods, to avoid misclassification given the likelihood that data on clinical suspicion of EA was documented differently at these sites (Figure 2). For the primary analyses, we did not restrict the sample based on Medicare enrollment but conducted sensitivity analyses on more restrictive samples (described below) to account for potential error in measuring frailty and comorbidity in veterans with non-VA health insurance other than fee-for-service Medicare.
Figure 2. Case and control selection flowchart.
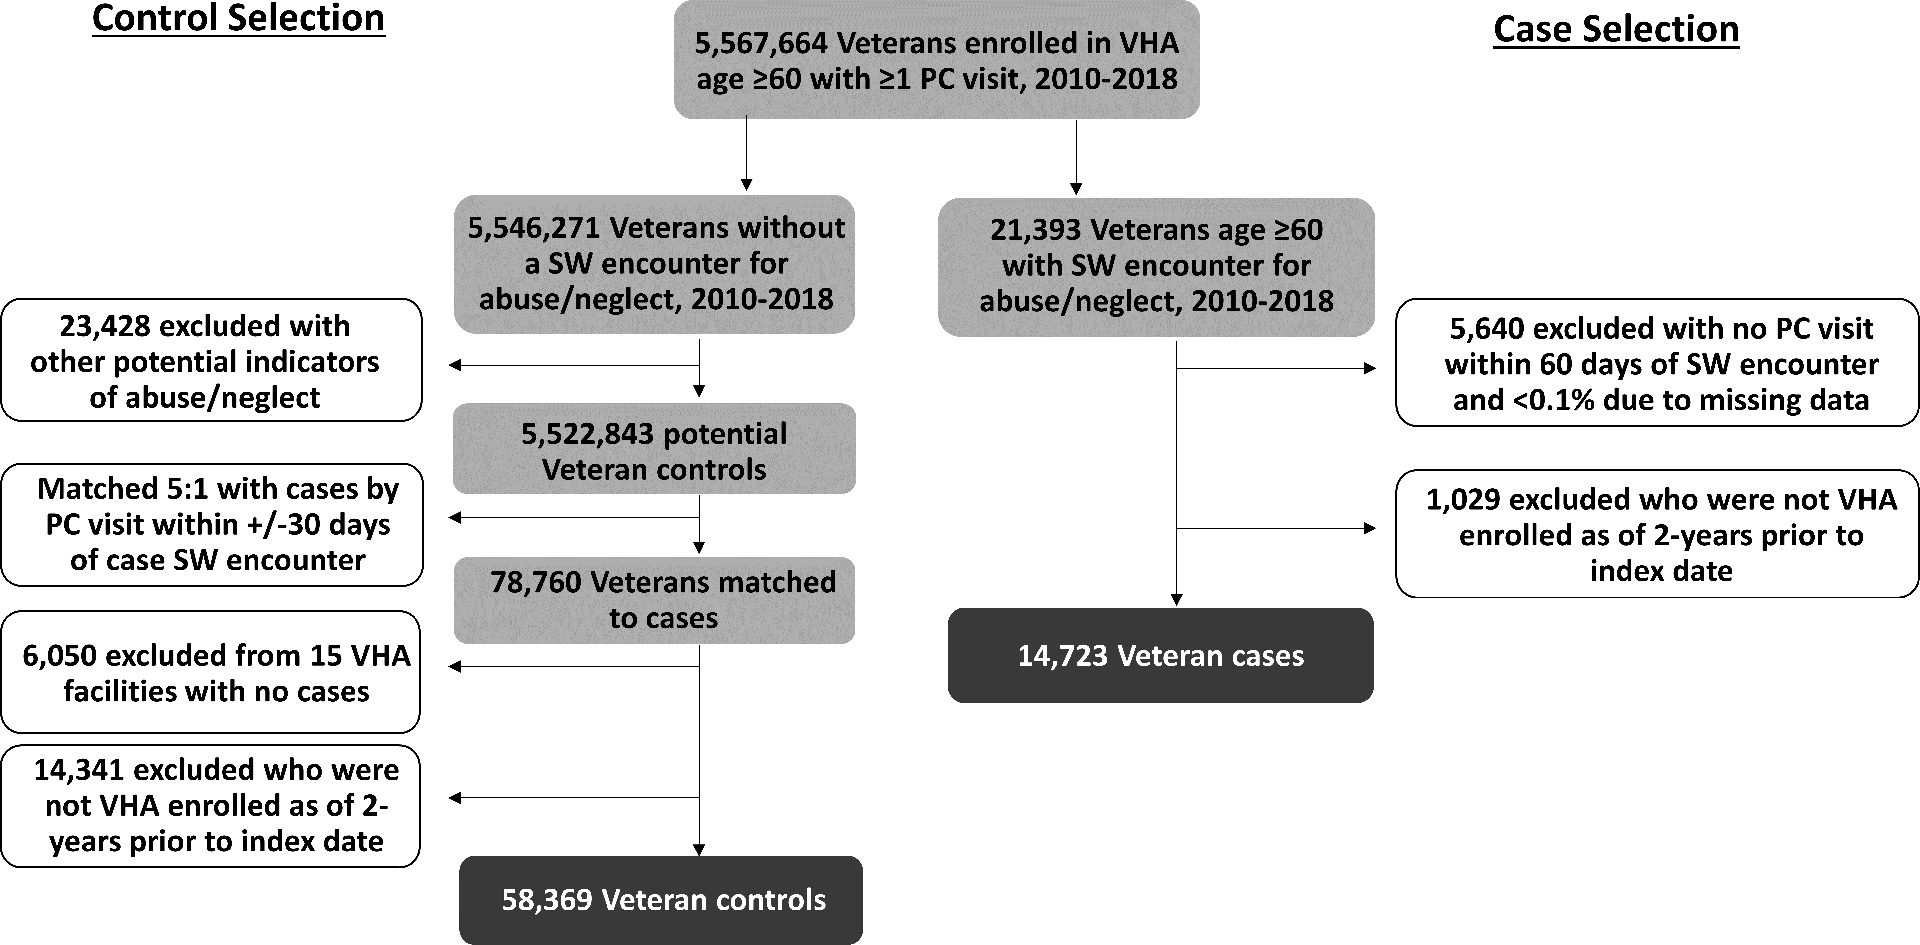
VHA = Veterans Health Administration; PC = primary care; SW = social work.
Measures
Exposures.
Frailty and comorbidity measures were calculated using linked VHA and Medicare FFS claims data for each veteran. We measured frailty using the VA Frailty Index (VA-FI),21,25a validated, claims-based measure defined according to the cumulative deficit method.28,29 Similar to claims-based measures of frailty validated in Medicare data and elsewhere,18,30,31 the VA-FI measures 31 deficits from diagnostic and procedure codes related to functional status (e.g., codes for gait impairment and durable medical equipment), cognition and mood (e.g., dementia and depression), sensory impairment (e.g., hearing or visual impairment), and other geriatric syndromes (e.g., weight loss) in addition to other chronic medical conditions (e.g., heart failure).21 The total number of deficits for an individual are counted and divided by the total possible (i.e., 31 for the VA-FI) to give a score between 0 and 1.28 Based on the derivation and validation studies by Orkaby et. al, we categorized the VA-FI into three groups: robust (0–0.1), pre-frail (0.11 – 0.20) and frail (≥0.21). As validated in previous studies,21,25 diagnoses were measured in the two-years prior to the index date from both inpatient and outpatient codes. If a veteran had no claims including relevant codes, the variable was considered absent. If a veteran had no relevant VA-FI diagnoses, their category defaulted to “robust.”
We sought to measure the burden of comorbid chronic medical conditions that were likely to have a significant impact on a patient’s health. To measure overall comorbidity burden, we used software available from the Agency for Healthcare Research and Quality Healthcare Cost and Utilization Project32 to calculate the Elixhauser comorbidity index score. This weighted summary score of 29 comorbidity conditions was originally validated to predict in-hospital mortality,33 but has also been shown to be associated with healthcare expenditures34 and hospital admission33,35 and is often used to summarize disease burden and adjust for confounding by comorbidity in health services research.36 In the development of the index score, each comorbidity condition category was assigned a weight (range −7 to +14) based on the relationship of that condition with in-hospital mortality. The weighted score for each present condition is summed to arrive at the cumulative index score, with a score of zero indicating no observed comorbidity categories, negative scores indicating conditions associated with lower mortality, and positive scores indicating conditions associated with higher mortality.33 Elixhauser index scores were calculated using claims data from the 2-years prior to index and conditions were considered absent if there were no relevant codes in the VHA or Medicare FFS claims data. To allow for the possibility of non-linear relationships between comorbidity and EA referral, we then categorized scores based on frequencies into five groups (≤ −5, −4 to −1, 0, 1 to 7, and ≥ 8) such that those above and below 0 (reference group; no conditions) were split into roughly equally sized bins.
Covariates.
We extracted age, sex and race/ethnicity from the VHA CDW, all categorized as shown in Table 1. Race/ethnicity was included not because of any documented differences in EA prevalence among historically marginalized racial/ethnic groups,37 but rather because of evidence indicating that provider biases may influence likelihood of being referred for EA assessment,38 as in other similar situations such as child abuse.39,40 To measure patients’ neighborhood socioeconomic status (SES) we used the 2015 Area Deprivation Index (ADI) from the Neighborhood Atlas, which is linked at the veteran census block level.41–43 National ADI percentiles were centered about the mean and scaled by the standard deviation.
Table 1.
Characteristics of older veterans with at least one documented encounter with social work for abuse/neglect and controls included in study
| Characteristic, no. (%) | Overall (N = 73,092) |
Cases (N = 14,723) |
Controls (N = 58,369) |
P-value |
|---|---|---|---|---|
| Age category | <0.0001 | |||
| 60–64 | 16,637 (22.8) | 2,626 (17.8) | 14,011 (24.0) | |
| 65–69 | 18,568 (25.4) | 3,464 (23.5) | 15,104 (25.9) | |
| 70–74 | 12,596 (17.2) | 2,606 (17.7) | 9,990 (17.1) | |
| 75–59 | 7,807 (10.7) | 1,621 (11.0) | 6,186 (10.6) | |
| 80–84 | 7,971 (10.9) | 1,928 (13.1) | 6,043 (10.4) | |
| ≥85 | 9,513 (13.0) | 2,478 (16.8) | 7,035 (12.1) | |
| Male sex | 70,412 (96.3) | 13,978 (94.9) | 56,434 (96.7) | <0.0001 |
| Race/ethnicity | <0.0001 | |||
| Non-Hispanic white | 50,739 (69.4) | 8,772 (59.6) | 41,967 (71.9) | |
| Non-Hispanic Black | 10,252 (14.0) | 2,466 (16.7) | 7,786 (13.3) | |
| Hispanic | 4,387 (6.0) | 1,969 (13.4) | 2,418 (4.1) | |
| Multiple or another race | 2,226 (3.0) | 394 (2.7) | 1,832 (3.1) | |
| Missing | 5,488 (7.5) | 1,122 (7.6) | 4,366 (7.5) | |
| National area deprivation index, mean (SD) | 55.5 (25.4) | 62.4 (24.5) | 53.7 (25.3) | <0.0001 |
| VA Frailty index category | <0.0001 | |||
| Robust | 20,935 (28.6) | 1,705 (11.6) | 19,230 (32.9) | |
| Pre-frail | 21,170 (29.0) | 3,206 (21.8) | 17,964 (30.8) | |
| Frail | 30,987 (42.4) | 9,812 (66.6) | 21,175 (36.3) | |
| Elixhauser index categories | <0.0001 | |||
| ≤ −5 | 7,036 (9.6) | 1,853 (12.6) | 5,183 (8.9) | |
| −4 to −1 | 6,919 (9.5) | 1,792 (12.2) | 5,127 (8.8) | |
| 0 | 44,722 (61.2) | 5,508 (37.4) | 39,214 (67.2) | |
| 1–7 | 7,407 (10.1) | 2,246 (15.3) | 5,161 (8.8) | |
| ≥ 8 | 7,008 (9.6) | 3,324 (22.6) | 3,684 (6.3) |
Statistical Analysis
Frailty scores, Elixhauser index scores, and sociodemographic characteristics were described for the whole cohort and by case-control status. We used logistic regression to fit a series of models examining the association of frailty or comorbidity with social work evaluation for EA. Model 1 examined unadjusted VA-FI categories. Model 2 added age, sex, race/ethnicity and ADI as covariates to Model 1. Model 3 examined the Elixhauser score as the main predictor and adjusted for the same covariates as Model 2, and Model 4 added VA-FI to Model 3 for the fully adjusted model. All models included a fixed effect for VA system to account for system-level pattern variability. Likelihood ratio (LR) tests assessed the statistical significance of including frailty and comorbidity burden in the same model compared to models with only frailty or comorbidity alone.
Missing values for race/ethnicity (approximately 7.5%) were imputed using multiple imputation with chained equations with 10 imputed datasets.44 All logistic regression models that included race/ethnicity (Models 2–4) were conducted on all 10 imputed datasets. Akaike Information Criterion (AIC) values were calculated to determine which model best predicted referral to social work for EA. Because multiple imputations were used for Models 2–4, an AIC range was calculated and presented rather than a single value. Two-sided significance was set at p <0.05.
Sensitivity analyses.
While we conceptualized health service utilization to be a mediator of the relationship between frailty and referral for EA evaluation (Figure 1), we conducted a sensitivity analysis adjusting for VHA primary care, emergency department and mental health visit frequency in the two-years prior to index, recognizing that healthcare utilization could also potentially act as a confounder. We also explored the extent to which the lack of availability of non-VA claims data for veterans dually enrolled in Medicare Advantage or other non-VA health insurance may have influenced our observed results, given the potential for error in measuring frailty and comorbidity in such veterans. First, we conducted additional analyses excluding cases and controls who had any MA enrollment during the look-back period. Second, we conducted sensitivity analyses restricted to cases and controls with continuous enrollment in Medicare FFS during the 2-year look back period - a narrower sample for whom we had both full VA and non-VA utilization records/claims. Finally, given the matched case-control study design, conditional logistic regression models were also run, which yielded similar results (Supplementary Table S2). Therefore, we chose to present the output from the standard logistic regression models for ease of interpretation.
Study activities were approved by the VA Pittsburgh Healthcare System Institutional Review Board. Analyses were conducted using SAS Enterprise Guide 8.2 and Stata 17.
Results
Of 5,567,664 veterans age ≥60 years using primary care in VHA from 2010 – 2018, 14,723 (0.3%) had at least one identifiable encounter with social work for elder abuse concerns and were enrolled in VHA during the 2-years prior (Figure 2). Characteristics for these cases and matched controls (N = 58,369) are shown in Table 1. Overall, the cases and controls had mean age 72, were 14% Black, 6% Hispanic, and 96.3% were men. The prevalence of VA-FI conditions by case-control status is presented in Supplementary Table S1. More cases (67%) than controls (36%) were frail. Two-thirds (67%) of controls had no documented Elixhauser comorbidity conditions (index score = 0), compared with only 37% of the cases. Twenty-three percent of cases and 6% of controls had an Elixhauser index score of ≥8.
Table 2 shows logistic regression model results for Models 1–4. In the unadjusted model, both pre-frailty (odds ratio [OR] pre-frail v. robust 2.1; 95% confidence interval [CI] 1.9 – 2.3) and frailty (OR frail v. robust 5.8; 95% CI 5.4 – 6.2) were associated with higher odds of being referred for EA evaluation, with frailty having a greater than two times higher odds than pre-frailty. These associations were only mildly attenuated after adjusting for covariates in Model 2. Having a non-zero Elixhauser comorbidity score was also highly associated with EA evaluation, with the strongest ORs observed for those with a score of ≥8 v. 0 (adjusted OR [aOR] 4.2; 95% CI 4.0 – 4.5). The LR tests comparing the model including both frailty and comorbidity (Model 4) to reduced models containing either frailty (Model 2) or comorbidity (Model 3) were both highly significant (p<0.001). When frailty and comorbidity scores were included in the same model (Model 4), each remained significantly associated with referral to social work for EA evaluation, with a larger effect size for frail vs robust (aOR 3.6; 95% CI 3.3 – 3.9) compared to pre-frail vs. robust (aOR 1.7; 95% CI 1.5 – 1.8). Comparing the four models, the AIC range values were lowest for Model 4, indicating the best model fit when both frailty and comorbidity were included (Table 2).
Table 2.
Frailty and Comorbidity Model Comparisons Predicting Referral to Social Work for Elder Abuse Evaluation
| Independent variable, OR (95% CI) | Model 1 VA-FI Unadjusted |
Model 2 VA-FI + covariates |
Model 3 Elixhauser + covariates |
Model 4 VA-FI + Elixhauser + covariates |
|---|---|---|---|---|
| VA Frailty Index | ||||
| Robust | Ref | Ref | Ref | |
| Pre-frail | 2.1 (1.9 – 2.3) | 2.0 (1.9 – 2.2) | 1.7 (1.5 – 1.8) | |
| Frail | 5.8 (5.4 – 6.2) | 5.5 (5.1 – 5.9) | 3.6 (3.3 – 3.9) | |
| Elixhauser Index | ||||
| ≤ −5 | 2.8 (2.6 – 3.0) | 1.8 (1.7 – 2.0) | ||
| −4 to −1 | 2.8 (2.5 – 3.0) | 1.7 (1.6 – 1.9) | ||
| 0 | Ref | Ref | ||
| 1–7 | 2.5 (2.3 – 2.7) | 1.6 (1.5 – 1.7) | ||
| ≥ 8 | 4.2 (4.0 – 4.5) | 2.2 (2.1 – 2.4) | ||
| Age group | ||||
| 60–64 | Ref | Ref | Ref | |
| 65–69 | 1.2 (1.1 – 1.3) | 1.3 (1.2 – 1.4) | 1.2 (1.1 – 1.3) | |
| 70–74 | 1.2 (1.1 – 1.4) | 1.5 (1.4 – 1.6) | 1.3 (1.2 – 1.4) | |
| 75–59 | 1.2 (1.1 – 1.3) | 1.6 (1.5 – 1.8) | 1.3 (1.1 – 1.4) | |
| 80–84 | 1.4 (1.2 – 1.5) | 1.9 (1.7 – 2.0) | 1.4 (1.3 – 1.6) | |
| ≥85 | 1.6 (1.5 – 1.8) | 2.3 (2.1 – 2.5) | 1.7 (1.5 – 1.8) | |
| Female sex | 2.3 (2.1 – 2.6) | 2.5 (2.2 – 2.8) | 2.4 (2.1 – 2.7) | |
| Race/ethnicity | ||||
| Non-Hispanic white | Ref | Ref | Ref | |
| Non-Hispanic Black | 1.6 (1.5 – 1.7) | 1.5 (1.4 – 1.6) | 1.6 (1.5 – 1.7) | |
| Hispanic | 1.4 (1.2 – 1.6) | 1.4 (1.2 – 1.6) | 1.4 (1.2 – 1.6) | |
| Multiple or another race | 1.3 (1.2 – 1.6) | 1.4 (1.2 – 1.6) | 1.4 (1.2 – 1.6) | |
| National ADI scaled | 1.3 (1.3 – 1.3) | 1.3 (1.2 – 1.3) | 1.3 (1.2 – 1.3) | |
| AIC range (10 imputations) |
45,779* | 44,906 – 44,932 | 45,528 – 45,554 | 44,425 – 44,452 |
Single value presented as no imputations needed for unadjusted model
VA-FI = VA Frailty Index; ADI = area deprivation index; OR = odds ratio; CI = confidence interval
Results from sensitivity analyses excluding those with any Medicare Advantage data during the look back period (remaining cases and controls N = 57,294) or restricting to only those with continuous enrollment in Medicare FFS during the look back period (N = 41,759) were not meaningfully different (Supplementary Tables S3 and S4). In sensitivity analyses adding VHA health service utilization measures to Model 4, the aOR effect size for frailty and pre-frailty compared to robust were attenuated but remained significant (Supplementary Table S5).
Discussion
To our knowledge, this is the first study to demonstrate a relationship between frailty and elder abuse concerns. In this case-control study, we found that frailty, measured via a claims-based index, was strongly associated with referral to social work for EA evaluation. This association remained strong even after adjusting for comorbidity burden, providing further support to the growing body of literature that frailty indices measure a phenomenon distinct from comorbidity.45–47 These findings suggest that frailty measured from EHR data may be a useful marker available to health systems to enhance EA risk detection efforts among their older patients.
In our analyses, being frail compared to robust was associated with 3.6 times higher odds of referral for EA evaluation after adjusting for sociodemographic variables and comorbidity burden. This association has multiple plausible mechanisms (Figure 1). First, frailty may be associated with higher likelihood of disability and activity of daily living dependency,18 which may lead to higher caregiving needs. While EA is certainly not an assumed consequence of high caregiver burden, mistreatment may be more likely, and frequency and severity more intense, with increased caregiver stress.48 Higher caregiving needs also create more opportunities for neglect. Combined, these effects may increase the likelihood that EA experienced by frail older adults reaches a certain “threshold” of severity that is easier for clinicians to identify and more likely to prompt intervention. Second, frail individuals may have more interactions with the healthcare system31,49 and frailty may exacerbate health consequences for those being mistreated, as frailty decreases physiologic reserve to injuries and other health insults. Healthcare interactions, whether for EA-related reasons or not, present opportunities for EA detection and response. In our sensitivity analyses, adjusting for health service utilization attenuated the association of frailty with EA referral suggesting it could be acting as a partial mediator as proposed in Figure 1, though there may also be a confounding effect (i.e., frequent healthcare users may be more likely to receive diagnoses that result in a frail VA-FI score and also more likely to have EA concerns identified if present). Regardless, the persistence of frailty being associated with nearly double the adjusted odds of referral for EA concerns indicates the VA-FI score provides useful predictive information independent of health service utilization. Finally, while a quick ‘eye-ball test’ may not always accurately identify frail patients,50 there may be a constellation of features unique to patients with high frailty index scores that is perceived by providers as a higher level of vulnerability. This may lead to a lower bar to refer to social work for evaluation of suspected EA or for other unmet needs which may be felt to pose a higher risk to the health status of these patients and could increase the likelihood of EA identification. Future studies directly evaluating these mechanistic pathways, as well as the extent to which common upstream social circumstances may predispose to both frailty and EA experience, are important to further understanding this relationship.
The dose-response nature of our findings on frailty further supports the plausibility of the relationship between frailty and referral for EA evaluation. In our study, in the fully adjusted model, pre-frailty was significantly associated with referral for EA evaluation compared to robust status (aOR 1.7) but with a smaller effect size than frailty (aOR 3.6). Notably, these effects were observed after adjusting for comorbidity burden, suggesting that frailty is impacting the likelihood of EA evaluation above and beyond comorbidity burden and/or via unique pathways. While studies have shown that frailty predicts important health-related outcomes such as life expectancy45 and disease specific mortality46,47 independent of comorbidity burden, this is one of the first studies comparing the relationship for a complex biopsychosocial outcome. If EA risk, severity, and/or consequences increase along a continuum as an older adult becomes more frail, transitions on the frailty trajectory may be opportunities for more intensive interdisciplinary EA detection efforts. Future research may explore whether the period of pre-frailty, for example, represents an ideal time for targeted EA risk detection approaches given patients may be at higher than baseline risk while still being early enough to initiate effective intervention and prevention measures (e.g., assess for caregiver stress and provide caregiver support, identify undiagnosed cognitive impairment, initiate advanced financial planning). With the availability of claims-based frailty indices, health systems may incorporate population-level frailty surveillance into risk assessment tools to identify high-risk older adults who may potentially benefit from EA screening or assessment. In addition, while our study did not explore this, it is plausible that there is a bidirectional relationship between frailty and EA. Those who are experiencing EA may be more likely to become frail or develop frailty more rapidly via numerous mechanisms, for example via social isolation, financial exploitation leading to unmet social and medical needs, depression, and injuries sustained from physical abuse. These represent important areas for future research.
Our findings using the Elixhauser index to measure comorbidity burden revealed that the medical conditions associated with mortality and hospital readmission may be different from those associated with identification of clinical EA suspicion. While negative comorbidity index scores indicated a protective effect against hospital mortality in the Elixhauser index validation study,33 in this study even negative scores (indicating having conditions that were protective against in-hospital mortality, such as obesity) were associated with a higher odds of referral to social work for EA evaluation. It may be that having any type of chronic medical condition, regardless of its association with mortality, will lead to more healthcare interactions, leading to higher odds of referral for EA evaluation as shown in Figure 1. While our prior research in this population has suggested that there are specific medical conditions that may increase the likelihood of being referred for EA evaluation, such as dementia and vision loss,24 future research may further elucidate particularly high risk conditions as well as whether the relationship between overall comorbidity burden and referral for EA is mediated through more health system encounters.
This study had several limitations. First, in this case-control study, the relationship between frailty and referral for EA evaluation identified cannot be interpreted causally. Second, the outcome measure captured consultation for evaluation of suspected EA, not substantiated experience of EA. To better understand the relationship between frailty and actual EA experience, longitudinal cohort studies that measure frailty should also assess for the presence and severity of abuse, neglect and exploitation outcomes among older adults. Third, because our EA measure was dependent on provider recognition and referral for EA evaluation as well as specific documentation, both cases and controls may have been misclassified.24 It is unknown to what extent our results reflect provider knowledge and experience with EA and/or biases. Fourth, we were not able to differentiate the types of EA suspected in our cases and note that each type of EA may be differentially associated with frailty. Fifth, the study sample was predominantly male; frailty is more common among women31 and further research is needed to assess potential gender differences in the findings. In addition, the study was conducted among VHA patients and findings might not apply to other populations or settings.
Despite growing recognition of frailty as a critical indicator of health and resilience, there remains uncertainty about how to use frailty measurement to improve patient care. For the significantly under-detected problem of elder abuse, this study suggests that adding frailty measurement via a claims-based index into EA risk assessment approaches may help identify high-risk populations who would benefit from EA evaluation. If the preliminary findings of this study are confirmed, future research may assess the value of health systems incorporating claims-based measures of frailty into novel predictive analytic decision support tools to enhance EA risk detection efforts. The association between frailty and referral for elder abuse evaluation that we report here offers a foundation for further work to improve health and safety of older adults.
Supplementary Material
Supplementary Table S1. Prevalence of variables in the VA-frailty index by case-control status
Supplementary Table S2. Model Results from Sensitivity Analysis Using Conditional Logistic Regression
Supplementary Table S3. Model Results from Sensitivity Analysis Excluding all Veterans with any Medicare Advantage Enrollment in the Look-Back Period (N = 57,294)
Supplementary Table S4. Model Results from Sensitivity Analysis Restricting to Veterans with Continuous Medicare Fee-for-Service Enrollment During the Look-Back Period (N = 41,759)
Supplementary Table S5. Model Results from Sensitivity Analysis Including VHA Health Service Utilization Variables
Key Points.
Patients with frailty and pre-frailty indicators measured by data in the electronic health record in the VA healthcare system had a higher odds of referral for elder abuse evaluation than those with robust status.
Frailty indicators predicted referral for elder abuse evaluation independent of the patient’s comorbidity level.
Why does this matter?
Understanding the relationship between frailty and elder abuse concerns can facilitate targeted elder abuse risk assessment for those who are becoming or are already frail. Recognition of newly developed frailty may present opportunities for increased consideration of elder abuse assessment and risk reduction by interdisciplinary healthcare teams. Claims-based measures of frailty might be used to enhance population health surveillance and management for elder abuse on a large scale.
Acknowledgements
Sponsor’s Role
This work was supported by the U.S. Department of Veterans Affairs, a VA Pittsburgh Center for Health Equity Research and Promotion Competitive Pilot Award (grant number XVA 72-940), and the National Institute on Aging at the National Institutes of Health (grants numbers P30 AG024827 to L.K.M. and K76 AG054866 to T.R.). Support for VA/CMS data provided by the Department of Veterans Affairs, VA Health Services Research and Development Service, VA Information Resource Center (Project Numbers SDR 02-237 and 98-004). The content is solely the responsibility of the authors and does not necessarily represent the official views of the U.S. Department of Veterans Affairs or the National Institutes of Health. The sponsors had no role in the design, methods, data collection, analysis or preparation of this paper.
Disclosures:
This work was funded by the U.S. Department of Veterans Affairs (VA), a VA Pittsburgh Center for Health Equity Research and Promotion Competitive Pilot Award (grant number XVA 72-940), and the National Institute on Aging at the National Institutes of Health (grants numbers P30 AG024827 to L.K.M. and K76 AG054866 to T.R.). Support for VA/CMS data provided by the VA Health Services Research and Development Service, VA Information Resource Center (Project Numbers SDR 02-237 and 98-004). This work was presented as an Oral Paper Presentation at the 2022 American Geriatrics Society Annual Scientific Meeting on May 13, 2022 in Orlando, FL.
Footnotes
Conflict of Interest
None of the authors report any financial or person conflicts of interest, perceived or otherwise, with the research conducted and presented in this manuscript.
References
- 1.Acierno R, Hernandez MA, Amstadter AB, Resnick HS, Steve K, Muzzy W, et al. Prevalence and Correlates of Emotional, Physical, Sexual, and Financial Abuse and Potential Neglect in the United States: The National Elder Mistreatment Study. Am J Public Health. 2010. Feb;100(2):292–7. [DOI] [PMC free article] [PubMed] [Google Scholar]
- 2.Lachs MS, Pillemer KA. Elder Abuse. N Engl J Med. 2015. Nov 12;373(20):1947–56. [DOI] [PubMed] [Google Scholar]
- 3.Under the Radar: New York State Elder Abuse Prevalence Study [Internet]. New York, NY: Lifespan of Greater Rochester, Inc., Weill Cornell Medical Center of Cornell University, and New York City Department for the Ageing; 2011. May [cited 2016 Oct 12]. Available from: http://ocfs.ny.gov/main/reports/Under%20the%20Radar%2005%2012%2011%20final%20report.pdf [Google Scholar]
- 4.Dong X, Chen R, Chang ES, Simon M. Elder abuse and psychological well-being: a systematic review and implications for research and policy--a mini review. Gerontology. 2013;59(2):132–42. [DOI] [PubMed] [Google Scholar]
- 5.Dong X, Simon MA. Association between elder abuse and use of ED: findings from the Chicago Health and Aging Project. Am J Emerg Med. 2013. Apr 1;31(4):693–8. [DOI] [PMC free article] [PubMed] [Google Scholar]
- 6.Dong X, Simon MA. Elder abuse as a risk factor for hospitalization in older persons. JAMA Intern Med. 2013. May 27;173(10):911–7. [DOI] [PMC free article] [PubMed] [Google Scholar]
- 7.Lachs MS, Williams CS, O’Brien S, Pillemer KA. Adult protective service use and nursing home placement. The Gerontologist. 2002. Dec;42(6):734–9. [DOI] [PubMed] [Google Scholar]
- 8.Lachs MS, Williams CS, O’Brien S, Pillemer KA, Charlson ME. The mortality of elder mistreatment. JAMA. 1998. Aug 5;280(5):428–32. [DOI] [PubMed] [Google Scholar]
- 9.Dong X, Simon M, Mendes de Leon C, Fulmer T, Beck T, Hebert L, et al. Elder self-neglect and abuse and mortality risk in a community-dwelling population. JAMA. 2009. Aug 5;302(5):517–26. [DOI] [PMC free article] [PubMed] [Google Scholar]
- 10.Schofield MJ, Powers JR, Loxton D. Mortality and disability outcomes of self-reported elder abuse: a 12-year prospective investigation. J Am Geriatr Soc. 2013. May;61(5):679–85. [DOI] [PubMed] [Google Scholar]
- 11.Rosen T, Hargarten S, Flomenbaum NE, Platts-Mills TF. Identifying Elder Abuse in the Emergency Department: Toward a Multidisciplinary Team-Based Approach. Ann Emerg Med. 2016. Sep 1;68(3):378–82. [DOI] [PMC free article] [PubMed] [Google Scholar]
- 12.Laumann EO, Leitsch SA, Waite LJ. Elder mistreatment in the United States: prevalence estimates from a nationally representative study. J Gerontol B Psychol Sci Soc Sci. 2008. Jul;63(4):S248–54. [DOI] [PMC free article] [PubMed] [Google Scholar]
- 13.Amstadter AB, Zajac K, Strachan M, Hernandez MA, Kilpatrick DG, Acierno R. Prevalence and correlates of elder mistreatment in South Carolina: the South Carolina elder mistreatment study. J Interpers Violence. 2011. Oct;26(15):2947–72. [DOI] [PMC free article] [PubMed] [Google Scholar]
- 14.Burnes D, Pillemer K, Caccamise PL, Mason A, Henderson CR, Berman J, et al. Prevalence of and Risk Factors for Elder Abuse and Neglect in the Community: A Population-Based Study. J Am Geriatr Soc. 2015. Sep;63(9):1906–12. [DOI] [PubMed] [Google Scholar]
- 15.Peterson JC, Burnes DPR, Caccamise PL, Mason A, Henderson CR, Wells MT, et al. Financial Exploitation of Older Adults: A Population-Based Prevalence Study. J Gen Intern Med. 2014. Dec;29(12):1615–23. [DOI] [PMC free article] [PubMed] [Google Scholar]
- 16.Rockwood K, Howlett SE. Fifteen years of progress in understanding frailty and health in aging. BMC Med. 2018. Nov 27;16(1):220. [DOI] [PMC free article] [PubMed] [Google Scholar]
- 17.Kojima G Frailty as a predictor of hospitalisation among community-dwelling older people: a systematic review and meta-analysis. J Epidemiol Community Health. 2016. Jul;70(7):722–9. [DOI] [PubMed] [Google Scholar]
- 18.Kim DH, Glynn RJ, Avorn J, Lipsitz LA, Rockwood K, Pawar A, et al. Validation of a Claims-Based Frailty Index Against Physical Performance and Adverse Health Outcomes in the Health and Retirement Study. J Gerontol A Biol Sci Med Sci. 2019. Jul 12;74(8):1271–6. [DOI] [PMC free article] [PubMed] [Google Scholar]
- 19.Kojima G Frailty as a Predictor of Nursing Home Placement Among Community-Dwelling Older Adults: A Systematic Review and Meta-analysis. J Geriatr Phys Ther 2001. 2016. Jun 23; [DOI] [PubMed] [Google Scholar]
- 20.Shinall MC Jr, Arya S, Youk A, Varley P, Shah R, Massarweh NN, et al. Association of Preoperative Patient Frailty and Operative Stress With Postoperative Mortality. JAMA Surg. 2020. Jan 15;155(1):e194620. [DOI] [PMC free article] [PubMed] [Google Scholar]
- 21.Orkaby AR, Nussbaum L, Ho YL, Gagnon D, Quach L, Ward R, et al. The Burden of Frailty Among U.S. Veterans and Its Association With Mortality, 2002–2012. J Gerontol A Biol Sci Med Sci. 2019. Jul;74(8):1257–64. [DOI] [PMC free article] [PubMed] [Google Scholar]
- 22.Theou O, Rockwood MRH, Mitnitski A, Rockwood K. Disability and co-morbidity in relation to frailty: how much do they overlap? Arch Gerontol Geriatr. 2012. Oct;55(2):e1–8. [DOI] [PubMed] [Google Scholar]
- 23.Makaroun LK, Taylor L, Rosen tony. Veterans Experiencing Elder Abuse: Improving Care of a High‐Risk Population About Which Little Is Known. J Am Geriatr Soc. 2018. Feb;66(2):389–93. [DOI] [PMC free article] [PubMed] [Google Scholar]
- 24.Makaroun LK, Thorpe CT, Mor MK, Zhang H, Lovelace E, Rosen T, et al. Medical and Social Factors Associated with Referral for Elder Abuse Services in a National Healthcare System. J Gerontol A Biol Sci Med Sci. 2021. Nov 25;glab354. [DOI] [PMC free article] [PubMed] [Google Scholar]
- 25.Cheng D, DuMontier C, Yildirim C, Charest B, Hawley C, Zhuo M, et al. Updating and Validating the Veterans Affairs Frailty Index: Transitioning from ICD-9 to ICD-10. J Gerontol Ser A [Internet]. 2021. Mar 9 [cited 2021 Mar 18];(glab071). Available from: 10.1093/gerona/glab071 [DOI] [Google Scholar]
- 26.Wolinsky FD, Miller TR, An H, Brezinski PR, Vaughn TE, Rosenthal GE. Dual use of Medicare and the Veterans Health Administration: are there adverse health outcomes? BMC Health Serv Res. 2006. Dec 1;6(1):131. [DOI] [PMC free article] [PubMed] [Google Scholar]
- 27.Hynes DM, Koelling K, Stroupe K, Arnold N, Mallin K, Sohn MW, et al. Veterans’ Access to and Use of Medicare and Veterans Affairs Health Care. Med Care. 2007;45(3):214–23. [DOI] [PubMed] [Google Scholar]
- 28.Searle SD, Mitnitski A, Gahbauer EA, Gill TM, Rockwood K. A standard procedure for creating a frailty index. BMC Geriatr. 2008. Sep 30;8(1):24. [DOI] [PMC free article] [PubMed] [Google Scholar]
- 29.Rockwood K, Mitnitski A. Frailty in relation to the accumulation of deficits. J Gerontol A Biol Sci Med Sci. 2007. Jul;62(7):722–7. [DOI] [PubMed] [Google Scholar]
- 30.Kim DH, Patorno E, Pawar A, Lee H, Schneeweiss S, Glynn RJ. Measuring Frailty in Administrative Claims Data: Comparative Performance of Four Claims-Based Frailty Measures in the United States Medicare Data. J Gerontol A Biol Sci Med Sci. 2019. Sep 30; [DOI] [PMC free article] [PubMed] [Google Scholar]
- 31.Kim DH, Schneeweiss S, Glynn RJ, Lipsitz LA, Rockwood K, Avorn J. Measuring Frailty in Medicare Data: Development and Validation of a Claims-Based Frailty Index. J Gerontol A Biol Sci Med Sci. 2018. 14;73(7):980–7. [DOI] [PMC free article] [PubMed] [Google Scholar]
- 32.Elixhauser Comorbidity Software, Version 3.7 [Internet]. [cited 2020 Jun 15]. Available from: https://www.hcup-us.ahrq.gov/toolssoftware/comorbidity/comorbidity.jsp
- 33.Moore BJ, White S, Washington R, Coenen N, Elixhauser A. Identifying Increased Risk of Readmission and In-hospital Mortality Using Hospital Administrative Data: The AHRQ Elixhauser Comorbidity Index. Med Care. 2017. Jul;55(7):698–705. [DOI] [PubMed] [Google Scholar]
- 34.Farley JF, Harley CR, Devine JW. A comparison of comorbidity measurements to predict healthcare expenditures. Am J Manag Care. 2006. Feb;12(2):110–9. [PubMed] [Google Scholar]
- 35.van Walraven C, Austin PC, Jennings A, Quan H, Forster AJ. A modification of the Elixhauser comorbidity measures into a point system for hospital death using administrative data. Med Care. 2009. Jun;47(6):626–33. [DOI] [PubMed] [Google Scholar]
- 36.Austin SR, Wong YN, Uzzo RG, Beck JR, Egleston BL. Why Summary Comorbidity Measures Such As the Charlson Comorbidity Index and Elixhauser Score Work. Med Care. 2015. Sep;53(9):e65–72. [DOI] [PMC free article] [PubMed] [Google Scholar]
- 37.Hernandez-Tejada MA, Amstadter A, Muzzy W, Acierno R. The National Elder Mistreatment Study: Race and Ethnicity Findings. J Elder Abuse Negl. 2013;25(4):281–93. [DOI] [PMC free article] [PubMed] [Google Scholar]
- 38.Lachs MS, Williams C, O’Brien S, Hurst L, Horwitz R. Risk factors for reported elder abuse and neglect: A nine-year observational cohort study. The Gerontologist. 1997;37:469–74. [DOI] [PubMed] [Google Scholar]
- 39.Maguire-Jack K, Font SA, Dillard R. Child protective services decision-making: The role of children’s race and county factors. Am J Orthopsychiatry. 2020;90(1):48–62. [DOI] [PMC free article] [PubMed] [Google Scholar]
- 40.Putnam-Hornstein E, Needell B, King B, Johnson-Motoyama M. Racial and ethnic disparities: a population-based examination of risk factors for involvement with child protective services. Child Abuse Negl. 2013. Jan;37(1):33–46. [DOI] [PubMed] [Google Scholar]
- 41.Kind AJH, Buckingham WR. Making Neighborhood-Disadvantage Metrics Accessible — The Neighborhood Atlas. N Engl J Med. 2018. Jun 28;378(26):2456–8. [DOI] [PMC free article] [PubMed] [Google Scholar]
- 42.Kind AJ, Jencks S, Brock J, Yu M, Bartels C, Ehlenbach W, et al. Neighborhood Socioeconomic Disadvantage and 30 Day Rehospitalizations: An Analysis of Medicare Data. Ann Intern Med. 2014. Dec 2;161(11):765–74. [DOI] [PMC free article] [PubMed] [Google Scholar]
- 43.University of Wisconsin School of Medicine Public Health. 2015 Area Deprivation Index v2.0. Downloaded from https://www.neighborhoodatlas.medicine.wisc.edu/ May 23, 2019. [Google Scholar]
- 44.STATA mi impute chained [Internet]. [cited 2021 Jan 21]. Available from: https://www.stata.com/manuals13/mimiimputechained.pdf
- 45.Schoenborn NL, Blackford AL, Joshu CE, Boyd CM, Varadhan R. Life expectancy estimates based on comorbidities and frailty to inform preventive care. J Am Geriatr Soc. 70(1):99–109. [DOI] [PMC free article] [PubMed] [Google Scholar]
- 46.Mak JKL, Kuja-Halkola R, Wang Y, Hägg S, Jylhävä J. Frailty and comorbidity in predicting community COVID-19 mortality in the U.K. Biobank: The effect of sampling. J Am Geriatr Soc. 2021. May;69(5):1128–39. [DOI] [PMC free article] [PubMed] [Google Scholar]
- 47.Bensken WP, Schiltz NK, Warner DF, Kim DH, Wei MY, Quiñones AR, et al. Comparing the association between multiple chronic conditions, multimorbidity, frailty, and survival among older cancer patients. J Geriatr Oncol. 2022. Jul 1;S1879–4068(22)00148–5. [DOI] [PMC free article] [PubMed] [Google Scholar]
- 48.Burnight K, Mosqueda L. Theoretical Model Development in Elder Mistreatment [Internet]. U.S. Department of Justice; 2011. May [cited 2018 May 23]. Report No.: 23448. Available from: https://www.ncjrs.gov/pdffiles1/nij/grants/234488.pdf [Google Scholar]
- 49.Ensrud KE, Kats AM, Schousboe JT, Taylor BC, Vo TN, Cawthon PM, et al. Frailty Phenotype and Healthcare Costs and Utilization in Older Men. J Am Geriatr Soc [Internet]. [cited 2020 May 14];n/a(n/a). Available from: https://onlinelibrary.wiley.com/doi/abs/10.1111/jgs.16522 [DOI] [PMC free article] [PubMed] [Google Scholar]
- 50.Hii TBK, Lainchbury JG, Bridgman PG. Frailty in acute cardiology: comparison of a quick clinical assessment against a validated frailty assessment tool. Heart Lung Circ. 2015. Jun;24(6):551–6. [DOI] [PubMed] [Google Scholar]
Associated Data
This section collects any data citations, data availability statements, or supplementary materials included in this article.
Supplementary Materials
Supplementary Table S1. Prevalence of variables in the VA-frailty index by case-control status
Supplementary Table S2. Model Results from Sensitivity Analysis Using Conditional Logistic Regression
Supplementary Table S3. Model Results from Sensitivity Analysis Excluding all Veterans with any Medicare Advantage Enrollment in the Look-Back Period (N = 57,294)
Supplementary Table S4. Model Results from Sensitivity Analysis Restricting to Veterans with Continuous Medicare Fee-for-Service Enrollment During the Look-Back Period (N = 41,759)
Supplementary Table S5. Model Results from Sensitivity Analysis Including VHA Health Service Utilization Variables