

Abstract
Improved throughput of analysis and lowered limits of detection has allowed single-cell chemical analysis to go beyond the detection of a few molecules in such volume-limited samples, enabling researchers to characterize different functional states of individual cells. Image-guided single-cell mass spectrometry leverages optical and fluorescence microscopy in the high-throughput analysis of cellular and subcellular targets. In this work, we propose DATSIGMA (DAta-driven Tools for Single-cell analysis using Image-Guided MAss spectrometry), a workflow based on data-driven and machine learning approaches for feature extraction and enhanced interpretability of complex single-cell mass spectrometry data. Here, we implemented our toolset with user-friendly programs and tested it on multiple experimental data sets that cover a wide range of biological applications, including classifying various brain cell types. Because it is open-source, it offers a high level of customization and can be easily adapted to other types of single-cell mass spectrometry data.
Keywords: single-cell analysis, mass spectrometry, data-driven analysis, machine learning
Graphical Abstract

INTRODUCTION
Distinctions and variations within the chemical composition of cells often are responsible for cellular identity and function. The differences in the chemical properties can be found both across and within cell types, contributing to the challenge of understanding cellular heterogeneity and its influence on cell phenotype. 1–3 Mass spectrometry (MS) has emerged as a well-suited platform for the chemical analysis of single cells. 4–7 With progress in analytical sampling techniques, single-cell characterization is becoming more fine-tuned, yielding greater information on cell-to-cell variations. 8–12 Advances in laser-based MS ion sources have achieved attomole (and in some cases zeptomole) detection limits and improved mass resolution for small volume samples, serving as a high-throughput profiling technique for the detection of numerous types of molecules at the single-cell level. 13 Mass spectrometry imaging (MSI) with a subcellular resolution has opened the possibility to study the intra- and intercellular distribution of metabolites, peptides, and proteins in tissue, 14–16 or in culture. 17,18 However, registering MSI data for correlation of acquired pixels to single cells requires delicate preprocessing including multimodal image coregistration, pixel normalization, and cell segmentation. As an alternative approach, image-guided MS involves dispersing isolated single cells or subcellular structures (organelles) across a glass slide while leaving a suitable distance between the cells which allows the high-throughput targeting of specific cell locations that were informed by microscopy image.19,20 Although this method effectively improves experimental throughput and reduces preprocessing efforts, a potential issue involves the lack of a standardized pipeline which impedes the reproducibility of analysis and the downstream interpretation of the high-dimensional data set.
Data-driven methods have long been the major developmental hub for single-cell analysis. Unsupervised and supervised approaches serve as the two common bases for analyzing complex single-cell data sets, especially for RNA-seq data. 21–23 Unsupervised data analysis approaches, such as dimensionality reduction and clustering aim to construct compact and easily interpretable representations from the high-dimensional data. 24,25 In contrast, supervised data analysis approaches seek to optimize the prediction of specific output values through learning a set of model weights. 26,27 Both unsupervised and supervised approaches have been applied extensively for single-cell MS, with the former focusing on exploratory tasks and the latter differentiating between cell types or phenotypes. 28–31 An integrated computational workflow for diverse applications of image-guided MS would standardize the information extracted from data sets collected under various experimental settings.
Here, we present DATSIGMA (DAta-driven Tools for Single-cell analysis using Image-Guided MAss spectrometry), a unified workflow and resource collection to process, analyze, and interpret imaged-guided single-cell MS data. DATSIGMA facilitates extracting knowledge from high-dimensional features, which drive distinction within cell types or subpopulations via automated mass spectra processing, dimensionality reduction, machine learning, and various interactive visualization tools. We demonstrated the applicability to six experimental data sets with diverse sample types and biological applications (Table 1) by adapting different processing and data analysis strategies to optimize the elucidation of the data sets and produce different bioinformatic outputs.
Table 1.
Description of the six data sets used to demonstrate DATSIGMA.
| Data set | Sample type | Number of cells | Instrument | m/z range | Prior knowledge |
|---|---|---|---|---|---|
| Cerebellar dissociates28 | Rat | 33,786 | FT-ICR | 150-3000 | No |
| Neuronal cell specific | Rat | 2,398 | FT-ICR | 400-1100 | No |
| Neuronal and astrocytic cell specific29 | Rat | 1,544 | TOF | 500-1000 | Yes |
| Dense-core and lucent vesicles20 | Aplysia | 717 | FT-ICR | 400-1100 | Yes |
| Ganglia neurons30 | Aplysia | 19,224 | TOF | 900-5000 | Yes |
| Cells from developing brain32 | Human | 124,464 | TOF | 600-900 | Yes |
METHODS AND IMPLEMENTATION
Description of data sets.
The experimental data sets used in this work are listed in Table 1. The samples were collected from various organisms and data acquired on different types of instruments including Fourier transform-ion cyclotron resonance (FT-ICR) and time-of-flight (TOF) mass spectrometers. The experimental details for five previously published data sets can be found in the references listed in Table 1. All data sets are available in both raw and processed formats.
Data preparation and computational analysis workflow.
DATSIGMA is a generic computational framework with a collection of Python open-source and interactive application programming interfaces (APIs) integral to single-cell and single-organelle characterization using the image-guided MS (detailed implementation is shown in Figure S1). In most cases, preprocessing of the microscopy images and mass spectra is an essential step for data interpretation; these include deriving the morphological features as well as canonical cell type labeling from brightfield or fluorescent microscopy images, and extracting mass spectral features from raw data collected on high-mass resolution MS platforms (Figure 1A). DATSIGMA allows analysis of multichannel microscopy images of single cells coupled with interactive preprocessing of the corresponding raw MS (e.g., FTMS) data and provides several signal processing and data-driven approaches to extract statistically significant peaks for the downstream analysis. As the input to the subsequent workflow shown in Figure 1B, a high-dimensional intensity matrix is prepared from the discrete mass spectral features of individual cells. Unsupervised exploratory analysis is applied when no relevant biological information is known prior to sampling, such as labeled cell types through immunocytochemistry (ICC), where it commonly involves obtaining a low-dimensional representation of the high-dimensional data set (dimensionality reduction) and partitioning single cells into clusters based on their chemical similarity (clustering). Often, upon the direct application of unsupervised methods the results may be obscured and difficult to interpret without any prior cell-type information making this method sensitive to instrumental noise and unwanted experimental variations. Supervised analysis is applied when biological priors (target labels) defined by either cell types or phenotypes are available. Specifically, differential analysis can be performed using traditional statistical testing such as rank-sum test, or machine learning to model a classification problem. Interfacing with the aforementioned preprocessing pipeline, DATSIGMA encompasses efficient implementation of dimensionality reduction, machine learning, and feature selection algorithms from existing libraries (see Methods), capable of analyzing data acquired from >150,000 cells in less than 20 minutes.
Figure 1. The overview of DATSIGMA.
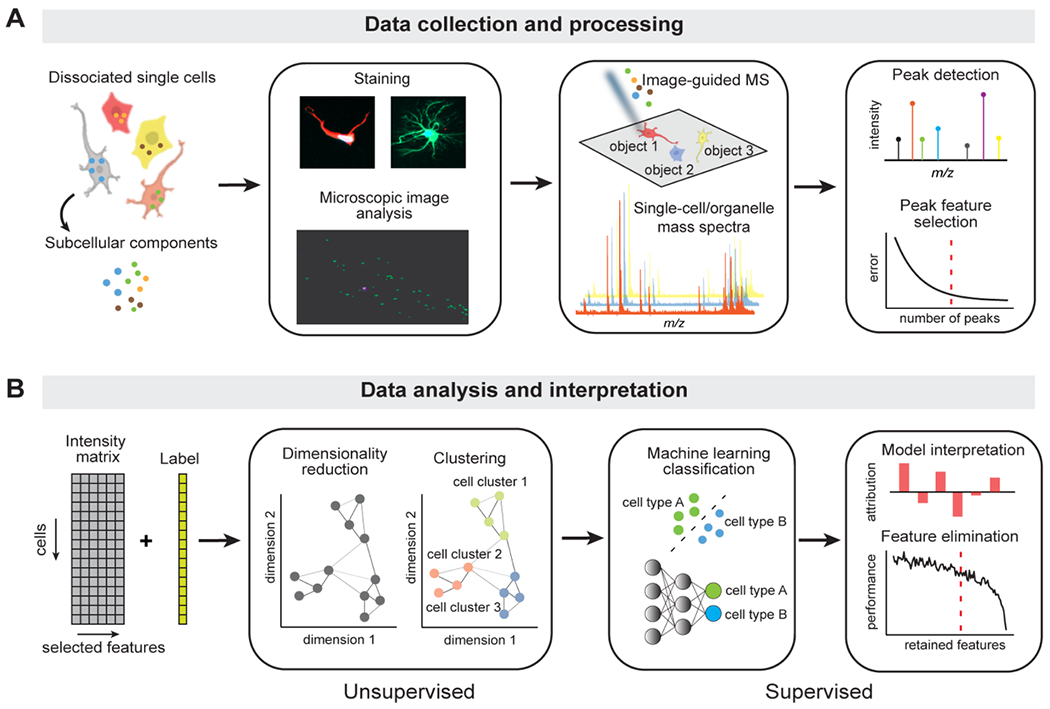
(A) The workflow of the data collection and processing steps. Populations of isolated single cells or organelles are deposited on a glass slide. Brightfield or fluorescence microscopy is used to generate images used in guiding of the MS acquisition. Since the resulting high-resolution MS spectra have a large size, a subset of features is selected from the raw data for the optimized downstream analysis. (B) Illustration of the methods for analyzing and interpreting preprocessed single-cell or single-organelle MS data. Depending on the cell labels, exploratory unsupervised methods (dimensionality reduction and clustering) are used when no biological priors (labels) are given, and supervised methods (ML classification) to differentiate cells or organelles when ground truth labels are acquired. We can interpret the trained models through feature attributions and selections that are important to class predictions.
Microscopic image processing.
We used microMS,19 an image-guided single-cell MS platform to identify the locations of dispersed cells. The cell coordinates and the whole-slide microscopic images were then fed to our pipeline, which cropped single-cell image patches with a 64-pixel crop size. We then extracted the average fluorescent intensities from the multichannel images, and filtered the cells based on their intensity profiles for downstream analysis.
Single-cell MS data handling and preprocessing.
High-resolution single-cell data were acquired on a solariX 7T FT-ICR mass spectrometer (Bruker Corp., Billerica, MA) and the raw transient for each cell was stored in the .d folder. Single-cell TOF data were acquired on a ultrafleXtreme MALDI-TOF mass spectrometer (Bruker Copr.).
Demo code 1.
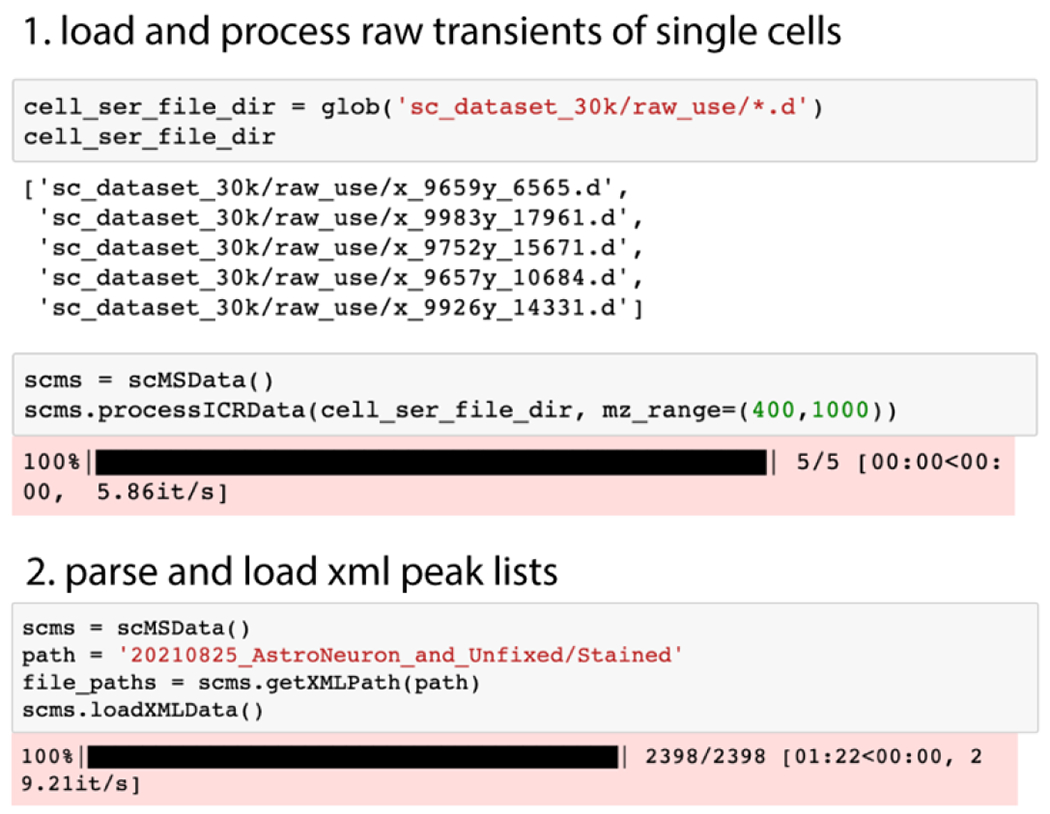
The demonstration code shows processing of a few single-cell transients, which returns mass spectra in full mass resolution as well as peak feature intensity profiles through peak detection. The scMSData() class handles MS data produced from raw transients as well as parsing the peak lists files (.xml) generated by Bruker DataAnalysis software. We used Spike33 as the main dependency of raw transient analysis for various signal processing methods such as windowing, baseline correction, and zero filling.
Demo code 2.
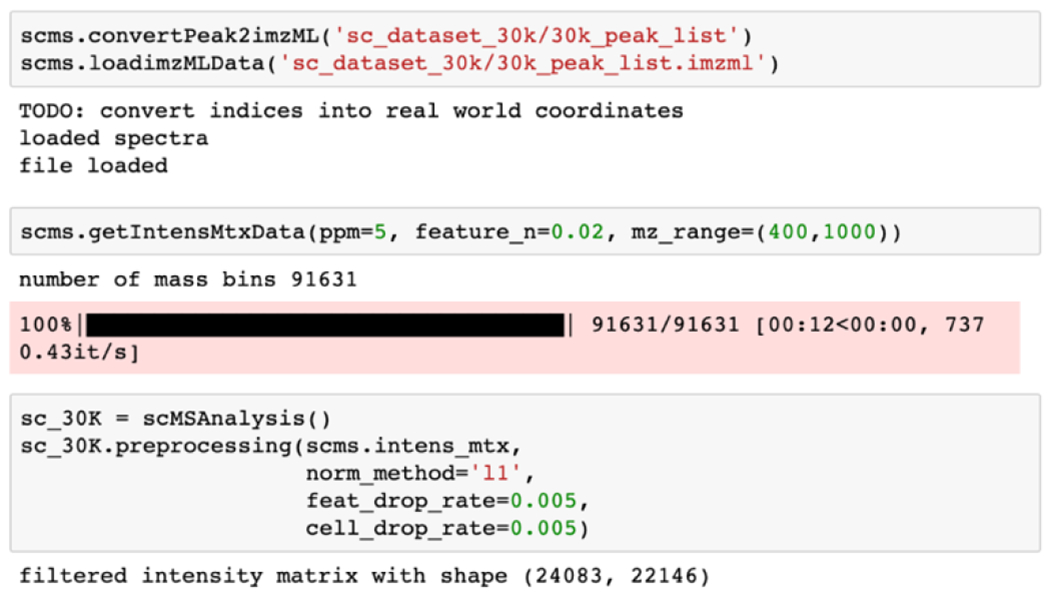
The above code converts the obtained peak lists of single cells into an imzML file,34 which is a common format for mass spectrometry imaging to facilitate the public sharing and reproducibility of data. We then extracted an intensity matrix through scms.getIntensMtxData() with a defined ppm window and a simple frequency-based m/z feature filter. The intensity matrix was then passed down to the scMSAnalysis() object for downstream analysis.
Unsupervised methods implementation.
For unsupervised feature selection, we implemented CX decomposition to obtain a low-rank approximation of the data.35 Given an m × n intensity matrix A, it is decomposed into an m × c matrix C and a c × n matrix X, where C is expressed by c number of column vectors of the original data. The statistical leverage scores are used to rank and select the columns of C from A, which can be obtained by
where lj is the leverage score for the jth column/feature, vi is the right singular vectors obtained by the singular value decomposition, and k is the rank to be selected. X is then determined by minimizing the error:
In DATSIGMA, running scMSAnalysis().svd_error_analysis and scMSAnalysis().CX performs reconstruction analysis and returns a list of m/z features ranked by their statistical leverage scores.
Demo code 3.
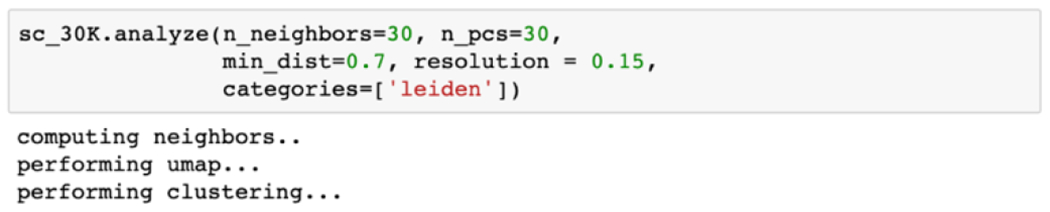
The code demonstrates running the unsupervised pipeline on the single-cell intensity matrix for Uniform Manifold Approximation and Projection (UMAP) and Leiden clustering. A nonlinear dimensionality reduction technique, UMAP embeds local and global structure of data into a low-dimensional space,36 and has been extensively used for visualization and interpretation of single-cell data sets.24 This technique assumes that the data is evenly distributed across a manifold (topological space) and can be approximated and projected to a lower dimensional space. Leiden clustering is a community detection algorithm to uncover the substructure of the data,37 suitable to examine how cells form subpopulations based on their chemical profiles. Given the cluster assignments, cells in each cluster are tested against cells outside of the cluster to identify cluster-specific differential m/z features. We used Scanpy38 for the majority of the unsupervised analysis, which is wrapped around by the scMSAnalysis() object.
Machine learning and supervised methods implementation.
Machine learning classification is a supervised learning approach utilized to structure our data given biological priors. Such biological prior information may be cell types, sizes, or even functional data (e.g. cells that are normal or affected by a disease). The goal is to use predictive modeling to approximate a mapping function from input to output variables that maximizes the accuracy to classify single cells based on our goals and samples. DATSIGMA contains six different machine learning models: logistic regression (LR), linear discriminant analysis (LDA), support vector machine (SVM), random forest (RF), gradient boosted trees (GBT) and deep neural networks (DNN). Using a variety of models also helps us later evaluate the model performance and select the best performing one. F1 score is used as an evaluation metric for both binary and multiclass classification accuracy:
where TP, FP, and FN stand for true positive, false positive, and false negative respectively.
Demo code 4.
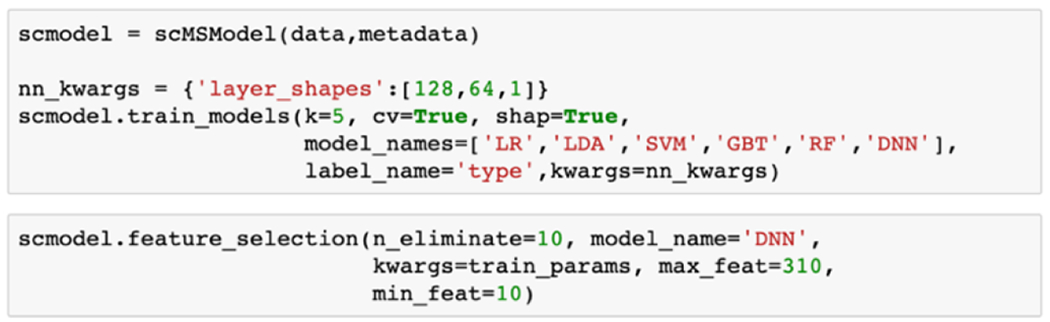
The scMSModel() class is initialized with the processed intensity matrix and the metadata that compiles the ground truth labels for each cell. All models were then evaluated using cross validation by splitting the data into k portions as training and test sets.
Besides cell classification, it is often important to understand which mass spectral features drive the classification, which is often a major goal of MS-based single cell analyses. Thus, we also computed Shapley Additive Explanations (SHAP) values by setting shap=True. SHAP is a model interpretation framework that locally assigns feature importance for each sample,39 and in our case, each single-cell spectrum. SHAP values of the cell represent how m/z features contribute toward predicting a certain biological prior, whereas the mean absolute SHAP values of all cells indicate global impact toward the model predictions. In scMSModel().feature_selection, we implemented a feature elimination procedure that iteratively retains the top features scored by SHAP values and retrains the model until reaching a minimal feature set without lowering performance. For supervised clustering and UMAP, we replaced the original intensity matrix with SHAP values obtained from the model and followed the unsupervised pipeline.
RESULTS AND DISCUSSION
Use case 1a: End-to-end processing for single-cell high-resolution FT-ICR MS data.
With low limits of detection and high mass resolution, Fourier-transform based mass spectrometers have become a transformative instrument to study individual cells or organelles by resolving the chemical heterogeneity with high precision. 40,41 To utilize the full spectrum of the raw data, we implemented DATSIGMA to allow end-to-end handling and processing of FTMS data with fully customizable tools that are free from the constraints of most vendor commercial software. Utilizing open-source software developed by the FTMS community, 33 our tool enables offline signal processing of the FTMS transients to obtain the full mass spectra and return the detected peaks, which was demonstrated on the 30k rat cerebellar dissociates data set (Figure 2A, Figure S2). Offline processing can then be conveniently parallelized on high-performance computing clusters, accelerating the analysis of large data sets consisting of hundreds to thousands of cells. Depending on the sensitivity of the peak detection algorithm (tunable in DATSIGMA), the numbers of the detected peaks can easily go above a thousand in each cell with a low signal-to-noise ratio (SNR) threshold. Thus, the resulting intensity matrix grows very sparse (features with zero values) with undesirably high dimensionality if one wishes to include low-intensity peaks that may represent biologically important molecules that are found at low abundance. Instead of filtering by peak intensity or SNRs, DATSIGMA alternatively provides an unsupervised and unbiased data-driven method to robustly select features based on their statistical leverage scores to reduce the dimensionality in the feature space (Methods). Assuming a low-rank approximation of the original data matrix (k=200), the reconstruction errors at different numbers of features ranked by their scores were evaluated and heuristically selected at the convergence point for further analysis (Figure 2B, C). The fraction of features with zero values in each cell may cause the largest source of variability, with a zero rate of 0.95±0.01 and 0.73±0.06 for data matrix prior and post unsupervised feature selection correspondingly. Highly sparse matrix (with a large zero rate) may induce biases in algorithms for dimensionality reduction due to sparsity but were alleviated through selecting a subset of statistically important features for an improved outcome (Figure 2D, E).
Figure 2. Fast and reproducible preprocessing of large high-resolution single-cell data sets.
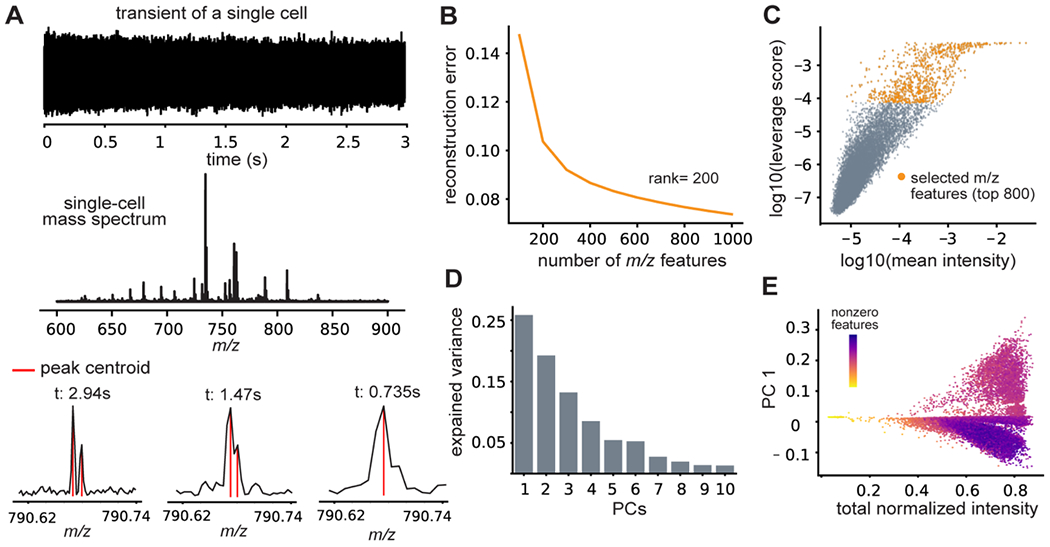
(A) Offline visualization and processing of a raw Fourier-transform ion cyclotron resonance transient signal of a single cell provides the mass spectrum with full resolution for enhanced peak detection. (B) Low-rank reconstruction of the data set with m/z features ranked by statistical leverage scores allows (C) selection of a subset of important features and removal of less variable and noise-related artefacts without the use of intensity thresholding. (D) Explained variance for the first 10 principal components. (E) First principal component plotted against the total normalized signal intensity per cell, colored by the fraction of nonzero features.
Use case 1b: Comparing single-cell FT-ICR and TOF/TOF MS data.
In contrast to FT-ICR, TOF/TOF mass analyzer are advantageous in its higher throughput, extended mass range for detecting larger molecular weight molecules, and wider accessibility in research labs. However, when applied to single-cell analysis, the wide m/z range TOF/TOF MS suffers relatively lower mass accuracy and mass resolution and is unable to produce high-quality spectral features for confident peak assignments. We compared the TOF and FT-ICR data of 500 neurons from the ICC labeled data sets (Figure S3A). Within mass range m/z 500 to 1000, the disparity between the number of detected peaks (> SNR=5) per mass spectra is striking, with two orders of magnitude higher in the FT-ICR MS than TOF/TOF MS analyses. This can be attributed to the increased mass resolution and enhanced SNR level provided by FT-ICR MS (Figure S3B, C). Thus, FT-ICR is a powerful instrument for single-cell analysis by resolving the fine details in single cells via enriched features and confident analyte identification.
Use case 2: Exploring single-cell chemical heterogeneity through unsupervised analysis.
The ability to detect various biomolecules and probe the chemical heterogeneity with high sensitivity places single-cell MS in a unique position that is complementary to single-cell transcriptomics. DATSIGMA incorporates essential unsupervised methods to characterize cell-to-cell variations, without biological priors as input. After batch correction, we analyzed the cerebellar cell data set28 using UMAP and Leiden clustering (Figure S4), as well as identified top differential features in each cluster (Figure S5). All analysis can be done in an interactive fashion by following the pipeline provided in the Jupyter Notebook. To further demonstrate the exploratory use case, we investigated the lipid heterogeneity within the labeled neuronal cell population. We applied an optimized ICC procedure prior to MS in order to minimize cell loss and improve the success rate of cell typing, and ensure the mass spectra data quality for optimal lipid detection (Supporting Methods). We first parsed single cell images, extracted the fluorescent intensity profiles using DATSIGMA, and manually set a threshold for cell selection (Figure 3A). Among the included neuronal cells, we observed diverse morphology that may possibly be a result of the differences in the lipid compositions of the cell membrane (Figure 3B).
Figure 3. Exploratory analysis of neuronal cell heterogeneity with DATSIGMA.
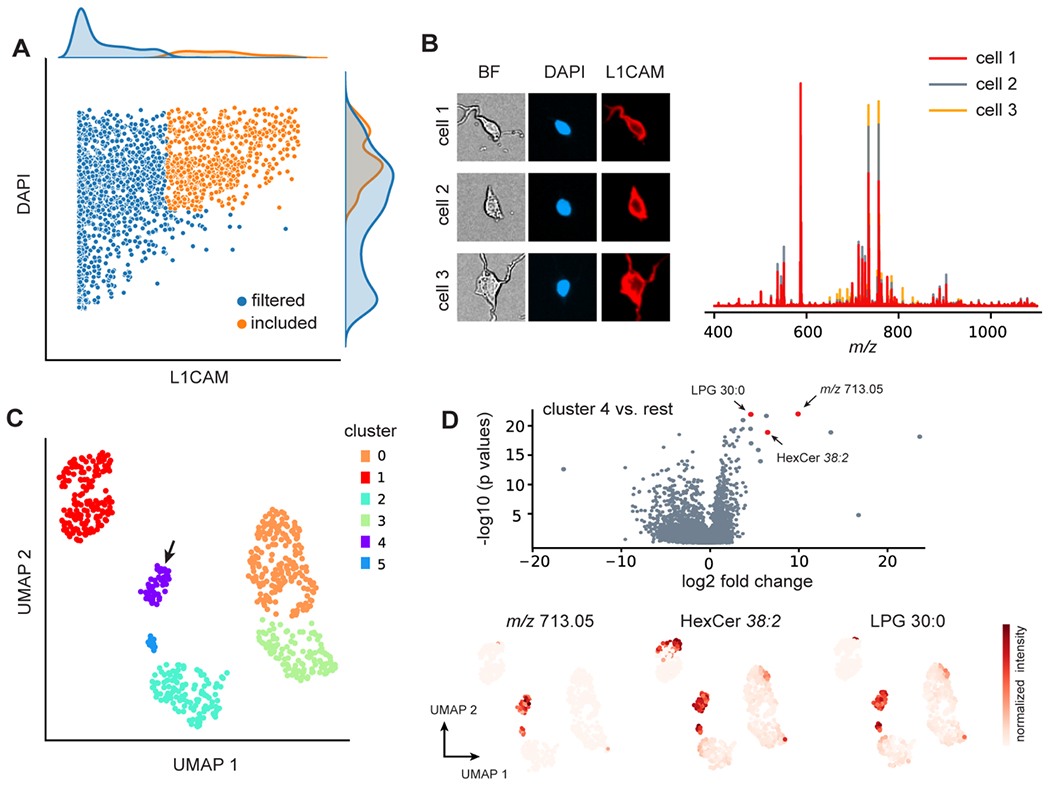
(A) Cells were filtered based on the fluorescent intensity levels of the markers to only include the neuronal cell populations for further analysis. (B) Microscopic images of the included cells display clear neuronal morphology, while the corresponding mass spectra are notably different. (C) UMAP and Leiden clustering of the mass spectral profiles from 600 selected neuronal cells encapsulates the cell-to-cell differences of probable neuronal subpopulations. (D) Volcano plot of the differential analysis identifies features that are highly specific to cluster 4, with some putatively assigned to lipids with a 3 ppm error threshold.
UMAP and Leiden clustering unveiled 6 clusters (Figure 3C), suggesting a heterogeneous lipid landscape that might be related to distinct populations of neurons. 42–44 The volcano plot shows features that are highly specific to cells in cluster 4, as shown in Figure 3D for the distribution of m/z 713.05, putatively assigned lipid HexCer 32:8, and LPG 30:0 at the single neuron level. Although correlating lipid heterogeneity with neuronal cell biology is challenging, we do possess the framework for neuronal subtyping. Strong clustering observations within the UMAP space convey the possibility that lipids have a strong variation within neuronal cell populations. This knowledge can help identify lipids for neuronal subtypes, which still needs further validation through other measurement metrics such as expression of subtype markers. While unsupervised analysis finds structure in the unlabeled data without biological priors, the lack of supervised constraints often hinders biological interpretation of data, which may require the data to be mapped back to known knowledge such as cell type. In the next section, we demonstrate the application of the supervised analysis workflow enabled by DATSIGMA on several data sets by specifically using machine learning classification as the supervised task. From the feature space, it is desirable to find a feature subset that contributes to the target variables. Statistical testing can be applied to determine the significance.
Use case 3: Supervised feature selection and interpretable machine learning.
The objective of the supervised analysis is to map the MS data onto known biological priors represented as the distributional differences and selected features by ranking p-values. With the increasing size and complexity of biological data, machine learning has become a more frequently used approach for classification and feature selection, especially when the feature space is complicated and high-dimensional. DATSIGMA includes common machine learning models such as linear models (LR, LDA, linear-SVM), tree-based models (GBT, RF), and deep-neural network (DNN), which were benchmarked on our single-cell and single-vesicle type classification tasks using cross-validation (Figure 4A). Next, we obtained average SHAP values as the global feature importance scores (see Methods) from the trained models as the metric for supervised feature selection. This is an iterative process by eliminating several features from the feature space and retraining the model in each step until a minimal set of features that marginally change (or even improve) model performance is found. Using DNN as the model for feature selection, we retained a minimal set of 50 features for neuron versus astrocyte classification,29 and 56 features for dense-core versus lucent vesicle classification (Figure 4B).20 Notice the selected m/z features do not always correlate with the average intensity differences between the targets (Figure 4C), thus supplying complementary solutions to statistical testing such as the Wilcoxon rank-sum test that compares the means of two distributions. Because SHAP values allow local feature attributions to the model prediction for each cell, we adapted the unsupervised approach to take SHAP values instead of the m/z feature values as the input. Specifically, the goal is to obtain a structured representation pertaining to target variables with supervision. For this purpose, we trained a machine learning model to predict neurons from 6 major types of Aplysia ganglia30 and acquired SHAP values for each cell. Neurons can be accurately classified based on the peptide content (Figure 5A), consistent with previous studies on peptide localizations in Aplysia central nervous system. 45,46 UMAP and Leiden clustering on the SHAP values reveal distinct clusters of neurons with respect to ganglion types (Figure 5B). Clustering with supervision enabled us to inspect how each individual ganglion neuron collectively and differently (due to heterogeneity) contributes to ganglion physiology (Figure 5B). Following the same strategy, we analyzed the developing brain data set32 consisting of cells sampled from the developing human cortex. Besides predicting cortical areas where the cells were from, we also trained a separate model supervised by five developmental ages (Figure S6A). With supervision on different priors, the model revealed contrasting structured patterns related to brain anatomy and age (Figure S6B).
Figure 4. Classification of cell or organelle types and feature elimination using machine learning.
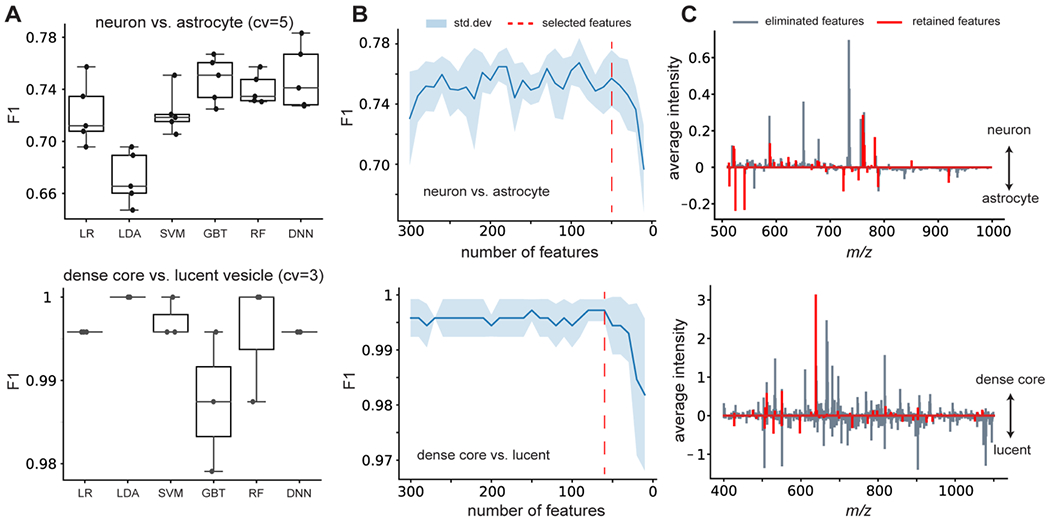
(A) We evaluated the performance (F1 score) of different machine learning models through cross-validation for the neuron vs. astrocyte (top) and dense-core vs. lucent vesicle (bottom) classification. (B) Model performances as the input features ranked by their importance scores are iteratively eliminated for training. When performance drops, we heuristically selected the retained features as the minimal feature set. (C) Intensity difference of the average spectra between cell or organelle types, with retained m/z features highlighted in red.
Figure 5. Supervised UMAP and clustering of the Aplysia ganglion neuron data set.
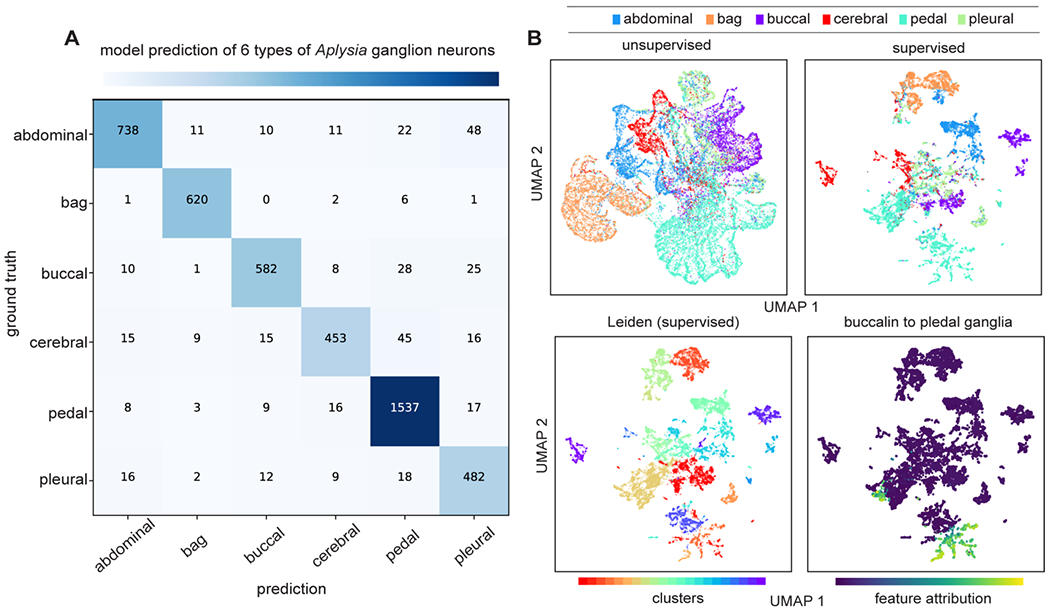
(A) Confusion matrix of the model prediction on the test set. (B) Unsupervised UMAP of the 19,244 Aplysia neurons collected from 6 ganglia and UMAP of the SHAP values obtained from the model to predict the ganglion neuron types. Leiden clustering on the SHAP values shows 21 clusters. From the supervised clustering, we identified a particular cluster of neurons that have the feature contribution of buccalin toward model prediction of pedal ganglia.
CONCLUSION
We have demonstrated the implementation and application of DATSIGMA on six vastly different experimental single-cell data sets and provided the suggested analysis pipelines depending on the motivation behind the experiments. While we could apply many of these steps in a manual fashion, for the first time, we implemented these workflows through automatic pipelines and interactive environments. As data generated by image-guided MS protocols grow larger and more complex, this data analysis workflow will help extract and share biological findings in a more standardized manner. Our tool can also be extended to single-cell data acquired by imaging-based and spatially-resolved MS methods with minimal change of input format. Moreover, being open-source and modular, DATSIGMA can be easily modified and developed further for more advanced implementations free from the constraint of the proprietary commercial software. Such extendibility can be important when adapting the framework to new instrumentation, such as MALDI instruments with ion-mobility capability,47 and combining the single-cell data with tissue MSI data with multimodal integration.
Supplementary Material
ACKNOWLEDGEMENT.
This project was supported by the National Institute on Drug Abuse under Award No. P30DA018310, the National Institute on Aging under Award No. 1R01AG078797 and the National Human Genome Research Institute under award No. RM1HG010023. The content is solely the responsibility of the authors and does not necessarily represent the official views of the awarding agencies.
Footnotes
Supporting Methods: Optimized immunocytochemistry, brightfield and fluorescent microscopy, and single-cell MS analysis; supporting Figures S1–S6 as noted in the text.
CONFLICT OF INTEREST.
The authors declare no competing financial interest.
DATA AND CODE AVAILABILITY.
The DATSIGMA code repository and analysis pipelines provided in Jupyter Notebooks are available: https://github.com/richardxie1119/DATSIGMA. All six data sets are available on Illinois Data Bank: https://doi.org/10.13012/B2IDB-7302959_V1
REFERENCE.
- (1).Zenobi R Single-Cell Metabolomics: Analytical and Biological Perspectives. Science 2013, 342 (6163). 10.1126/science.1243259. [DOI] [PubMed] [Google Scholar]
- (2).Oomen PE; Aref MA; Kaya I; Phan NTN; Ewing AG Chemical Analysis of Single Cells. Anal. Chem 2019, 91 (1), 588–621. 10.1021/acs.analchem.8b04732. [DOI] [PubMed] [Google Scholar]
- (3).Neumann EK; Do TD; Comi TJ; Sweedler JV Exploring the Fundamental Structures of Life: Non-Targeted, Chemical Analysis of Single Cells and Subcellular Structures. Angewandte Chemie International Edition 2019, 58 (28), 9348–9364. 10.1002/anie.201811951. [DOI] [PMC free article] [PubMed] [Google Scholar]
- (4).Rubakhin SS; Romanova EV; Nemes P; Sweedler JV Profiling Metabolites and Peptides in Single Cells. Nat Methods 2011, 8 (4), S20–S29. 10.1038/nmeth.1549. [DOI] [PMC free article] [PubMed] [Google Scholar]
- (5).Tajik M; Baharfar M; Donald WA Single-Cell Mass Spectrometry. Trends in Biotechnology 2022, 0 (0). 10.1016/j.tibtech.2022.04.004. [DOI] [PubMed] [Google Scholar]
- (6).Comi TJ; Do TD; Rubakhin SS; Sweedler JV Categorizing Cells on the Basis of Their Chemical Profiles: Progress in Single-Cell Mass Spectrometry. J. Am. Chem. Soc 2017, 139 (11), 3920–3929. 10.1021/jacs.6b12822. [DOI] [PMC free article] [PubMed] [Google Scholar]
- (7).Zhang L; Vertes A Single-Cell Mass Spectrometry Approaches to Explore Cellular Heterogeneity. Angewandte Chemie International Edition 2018, 57 (17), 4466–4477. 10.1002/anie.201709719. [DOI] [PubMed] [Google Scholar]
- (8).Budnik B; Levy E; Harmange G; Slavov N SCoPE-MS: Mass Spectrometry of Single Mammalian Cells Quantifies Proteome Heterogeneity during Cell Differentiation. Genome Biology 2018, 19 (1), 161. 10.1186/s13059-018-1547-5. [DOI] [PMC free article] [PubMed] [Google Scholar]
- (9).Brunner A-D; Thielert M; Vasilopoulou C; Ammar C; Coscia F; Mund A; Hoerning OB; Bache N; Apalategui A; Lubeck M; Richter S; Fischer DS; Raether O; Park MA; Meier F; Theis FJ; Mann M Ultra-High Sensitivity Mass Spectrometry Quantifies Single-Cell Proteome Changes upon Perturbation. Molecular Systems Biology 2022, 18 (3), e10798. 10.15252/msb.202110798. [DOI] [PMC free article] [PubMed] [Google Scholar]
- (10).Lombard-Banek C; Moody SA; Nemes P Single-Cell Mass Spectrometry for Discovery Proteomics: Quantifying Translational Cell Heterogeneity in the 16-Cell Frog (Xenopus) Embryo. Angewandte Chemie International Edition 2016, 55 (7), 2454–2458. 10.1002/anie.201510411. [DOI] [PMC free article] [PubMed] [Google Scholar]
- (11).Zhu Y; Piehowski PD; Zhao R; Chen J; Shen Y; Moore RJ; Shukla AK; Petyuk VA; Campbell-Thompson M; Mathews CE; Smith RD; Qian W-J; Kelly RT Nanodroplet Processing Platform for Deep and Quantitative Proteome Profiling of 10–100 Mammalian Cells. Nat Commun 2018, 9 (1), 882. 10.1038/s41467-018-03367-w. [DOI] [PMC free article] [PubMed] [Google Scholar]
- (12).Cong Y; Motamedchaboki K; Misal SA; Liang Y; Guise AJ; Truong T; Huguet R; Plowey ED; Zhu Y; Lopez-Ferrer D; Kelly RT Ultrasensitive Single-Cell Proteomics Workflow Identifies >1000 Protein Groups per Mammalian Cell. Chem. Sci 2021, 12 (3), 1001–1006. 10.1039/D0SC03636F. [DOI] [PMC free article] [PubMed] [Google Scholar]
- (13).Wang T; Cheng X; Xu H; Meng Y; Yin Z; Li X; Hang W Perspective on Advances in Laser-Based High-Resolution Mass Spectrometry Imaging. Anal. Chem 2020, 92 (1), 543–553. 10.1021/acs.analchem.9b04067. [DOI] [PubMed] [Google Scholar]
- (14).Keren L; Bosse M; Thompson S; Risom T; Vijayaragavan K; McCaffrey E; Marquez D; Angoshtari R; Greenwald NF; Fienberg H; Wang J; Kambham N; Kirkwood D; Nolan G; Montine TJ; Galli SJ; West R; Bendall SC; Angelo M MIBI-TOF: A Multiplexed Imaging Platform Relates Cellular Phenotypes and Tissue Structure. Science Advances 2019, 5 (10), eaax5851. 10.1126/sciadv.aax5851. [DOI] [PMC free article] [PubMed] [Google Scholar]
- (15).Yuan Z; Zhou Q; Cai L; Pan L; Sun W; Qumu S; Yu S; Feng J; Zhao H; Zheng Y; Shi M; Li S; Chen Y; Zhang X; Zhang MQ SEAM Is a Spatial Single Nuclear Metabolomics Method for Dissecting Tissue Microenvironment. Nat Methods 2021, 18 (10), 1223–1232. 10.1038/s41592-021-01276-3. [DOI] [PubMed] [Google Scholar]
- (16).Hickey JW; Neumann EK; Radtke AJ; Camarillo JM; Beuschel RT; Albanese A; McDonough E; Hatler J; Wiblin AE; Fisher J; Croteau J; Small EC; Sood A; Caprioli RM; Angelo RM; Nolan GP; Chung K; Hewitt SM; Germain RN; Spraggins JM; Lundberg E; Snyder MP; Kelleher NL; Saka SK Spatial Mapping of Protein Composition and Tissue Organization: A Primer for Multiplexed Antibody-Based Imaging. Nat Methods 2022, 19 (3), 284–295. 10.1038/s41592-021-01316-y. [DOI] [PMC free article] [PubMed] [Google Scholar]
- (17).Rappez L; Stadler M; Triana S; Gathungu RM; Ovchinnikova K; Phapale P; Heikenwalder M; Alexandrov T SpaceM Reveals Metabolic States of Single Cells. Nat Methods 2021, 1–7. 10.1038/s41592-021-01198-0. [DOI] [PMC free article] [PubMed] [Google Scholar]
- (18).Capolupo L; Khven I; Lederer AR; Mazzeo L; Glousker G; Ho S; Russo F; Montoya JP; Bhandari DR; Bowman AP; Ellis SR; Guiet R; Burri O; Detzner J; Muthing J; Homicsko K; Kuonen F; Gilliet M; Spengler B; Heeren RMA; Dotto GP; Manno GL; D’Angelo G Sphingolipids Control Dermal Fibroblast Heterogeneity. Science 2022. 10.1126/science.abh1623. [DOI] [PubMed] [Google Scholar]
- (19).Comi TJ; Neumann EK; Do TD; Sweedler JV MicroMS: A Python Platform for Image-Guided Mass Spectrometry Profiling. J. Am. Soc. Mass Spectrom 2017, 28 (9), 1919–1928. 10.1007/s13361-017-1704-1. [DOI] [PMC free article] [PubMed] [Google Scholar]
- (20).Castro DC; Xie YR; Rubakhin SS; Romanova EV; Sweedler JV Image-Guided MALDI Mass Spectrometry for High-Throughput Single-Organelle Characterization. Nature Methods 2021. 10.1038/s41592-021-01277-2. [DOI] [PMC free article] [PubMed] [Google Scholar]
- (21).Chen G; Ning B; Shi T Single-Cell RNA-Seq Technologies and Related Computational Data Analysis. Frontiers in Genetics 2019, 10. [DOI] [PMC free article] [PubMed] [Google Scholar]
- (22).Argelaguet R; Cuomo ASE; Stegle O; Marioni JC Computational Principles and Challenges in Single-Cell Data Integration. Nat Biotechnol 2021, 39 (10), 1202–1215. 10.1038/s41587-021-00895-7. [DOI] [PubMed] [Google Scholar]
- (23).Bacher R; Kendziorski C Design and Computational Analysis of Single-Cell RNA-Sequencing Experiments. Genome Biology 2016, 17 (1), 63. 10.1186/s13059-016-0927-y. [DOI] [PMC free article] [PubMed] [Google Scholar]
- (24).Becht E; McInnes L; Healy J; Dutertre C-A; Kwok IWH; Ng LG; Ginhoux F; Newell EW Dimensionality Reduction for Visualizing Single-Cell Data Using UMAP. Nat Biotechnol 2019, 37 (1), 38–44. 10.1038/nbt.4314. [DOI] [PubMed] [Google Scholar]
- (25).Kiselev VY; Andrews TS; Hemberg M Challenges in Unsupervised Clustering of Single-Cell RNA-Seq Data. Nat Rev Genet 2019, 20 (5), 273–282. 10.1038/s41576-018-0088-9. [DOI] [PubMed] [Google Scholar]
- (26).Zhang AW; O’Flanagan C; Chavez EA; Lim JLP; Ceglia N; McPherson A; Wiens M; Walters P; Chan T; Hewitson B; Lai D; Mottok A; Sarkozy C; Chong L; Aoki T; Wang X; Weng AP; McAlpine JN; Aparicio S; Steidl C; Campbell KR; Shah SP Probabilistic Cell-Type Assignment of Single-Cell RNA-Seq for Tumor Microenvironment Profiling. Nat Methods 2019, 16 (10), 1007–1015. 10.1038/s41592-019-0529-1. [DOI] [PMC free article] [PubMed] [Google Scholar]
- (27).Pliner HA; Shendure J; Trapnell C Supervised Classification Enables Rapid Annotation of Cell Atlases. Nat Methods 2019, 16 (10), 983–986. 10.1038/s41592-019-0535-3. [DOI] [PMC free article] [PubMed] [Google Scholar]
- (28).Neumann EK; Ellis JF; Triplett AE; Rubakhin SS; Sweedler JV Lipid Analysis of 30 000 Individual Rodent Cerebellar Cells Using High-Resolution Mass Spectrometry. Anal. Chem 2019, 91 (12), 7871–7878. 10.1021/acs.analchem.9b01689. [DOI] [PMC free article] [PubMed] [Google Scholar]
- (29).Neumann EK; Comi TJ; Rubakhin SS; Sweedler JV Lipid Heterogeneity between Astrocytes and Neurons Revealed by Single-Cell MALDI-MS Combined with Immunocytochemical Classification. Angewandte Chemie International Edition 2019, 58 (18), 5910–5914. 10.1002/anie.201812892. [DOI] [PMC free article] [PubMed] [Google Scholar]
- (30).Chan-Andersen PC; Romanova EV; Rubakhin SS; Sweedler JV Profiling 26,000 Aplysia Californica Neurons by Single Cell Mass Spectrometry Reveals Neuronal Populations with Distinct Neuropeptide Profiles. Journal of Biological Chemistry 2022, 298 (8), 102254. 10.1016/j.jbc.2022.102254. [DOI] [PMC free article] [PubMed] [Google Scholar]
- (31).Xie YR; Castro DC; Bell SE; Rubakhin SS; Sweedler JV Single-Cell Classification Using Mass Spectrometry through Interpretable Machine Learning. Anal. Chem 2020, 92 (13), 9338–9347. 10.1021/acs.analchem.0c01660. [DOI] [PMC free article] [PubMed] [Google Scholar]
- (32).Bhaduri A; Neumann EK; Kriegstein AR; Sweedler JV Identification of Lipid Heterogeneity and Diversity in the Developing Human Brain. JACS Au 2021. 10.1021/jacsau.1c00393. [DOI] [PMC free article] [PubMed] [Google Scholar]
- (33).Chiron L; Coutouly M-A; Starck J-P; Rolando C; Delsuc M-A SPIKE a Processing Software Dedicated to Fourier Spectroscopies. arXiv:1608.06777 [physics] 2016. [Google Scholar]
- (34).Römpp A; Schramm T; Hester A; Klinkert I; Both J-P; Heeren RMA; Stöckli M; Spengler B ImzML: Imaging Mass Spectrometry Markup Language: A Common Data Format for Mass Spectrometry Imaging. In Data Mining in Proteomics: From Standards to Applications; Hamacher M, Eisenacher M, Stephan C, Eds.; Methods in Molecular Biology; Humana Press: Totowa, NJ, 2011; pp 205–224. 10.1007/978-1-60761-987-1_12. [DOI] [PubMed] [Google Scholar]
- (35).Yang J; Rübel O; Prabhat; Mahoney MW; Bowen BP Identifying Important Ions and Positions in Mass Spectrometry Imaging Data Using CUR Matrix Decompositions. Anal. Chem 2015, 87 (9), 4658–4666. 10.1021/ac5040264. [DOI] [PubMed] [Google Scholar]
- (36).McInnes L; Healy J; Melville J UMAP: Uniform Manifold Approximation and Projection for Dimension Reduction. arXiv September 17, 2020. 10.48550/arXiv.1802.03426. [DOI] [Google Scholar]
- (37).Traag VA; Waltman L; van Eck NJ From Louvain to Leiden: Guaranteeing Well-Connected Communities. Sci Rep 2019, 9 (1), 5233. 10.1038/s41598-019-41695-z. [DOI] [PMC free article] [PubMed] [Google Scholar]
- (38).Wolf FA; Angerer P; Theis FJ SCANPY: Large-Scale Single-Cell Gene Expression Data Analysis. Genome Biology 2018, 19 (1), 15. 10.1186/s13059-017-1382-0. [DOI] [PMC free article] [PubMed] [Google Scholar]
- (39).Lundberg SM; Lee S-I A Unified Approach to Interpreting Model Predictions. In Advances in Neural Information Processing Systems 30; Guyon I, Luxburg UV, Bengio S, Wallach H, Fergus R, Vishwanathan S, Garnett R, Eds.; Curran Associates, Inc., 2017; pp 4765–4774. [Google Scholar]
- (40).Scigelova M; Hornshaw M; Giannakopulos A; Makarov A Fourier Transform Mass Spectrometry. Mol Cell Proteomics 2011, 10 (7). 10.1074/mcp.M111.009431. [DOI] [PMC free article] [PubMed] [Google Scholar]
- (41).Shaw JB; Lin T-Y; Leach FE; Tolmachev AV; Tolić N; Robinson EW; Koppenaal DW; Paša-Tolić L 21 Tesla Fourier Transform Ion Cyclotron Resonance Mass Spectrometer Greatly Expands Mass Spectrometry Toolbox. J. Am. Soc. Mass Spectrom 2016, 27 (12), 1929–1936. 10.1007/s13361-016-1507-9. [DOI] [PubMed] [Google Scholar]
- (42).Peng H; Xie P; Liu L; Kuang X; Wang Y; Qu L; Gong H; Jiang S; Li A; Ruan Z; Ding L; Yao Z; Chen C; Chen M; Daigle TL; Dalley R; Ding Z; Duan Y; Feiner A; He P; Hill C; Hirokawa KE; Hong G; Huang L; Kebede S; Kuo H-C; Larsen R; Lesnar P; Li L; Li Q; Li X; Li Y; Li Y; Liu A; Lu D; Mok S; Ng L; Nguyen TN; Ouyang Q; Pan J; Shen E; Song Y; Sunkin SM; Tasic B; Veldman MB; Wakeman W; Wan W; Wang P; Wang Q; Wang T; Wang Y; Xiong F; Xiong W; Xu W; Ye M; Yin L; Yu Y; Yuan J; Yuan J; Yun Z; Zeng S; Zhang S; Zhao S; Zhao Z; Zhou Z; Huang ZJ; Esposito L; Hawrylycz MJ; Sorensen SA; Yang XW; Zheng Y; Gu Z; Xie W; Koch C; Luo Q; Harris JA; Wang Y; Zeng H Morphological Diversity of Single Neurons in Molecularly Defined Cell Types. Nature 2021, 598 (7879), 174–181. 10.1038/s41586-021-03941-1. [DOI] [PMC free article] [PubMed] [Google Scholar]
- (43).Lake BB; Ai R; Kaeser GE; Salathia NS; Yung YC; Liu R; Wildberg A; Gao D; Fung H-L; Chen S; Vijayaraghavan R; Wong J; Chen A; Sheng X; Kaper F; Shen R; Ronaghi M; Fan J-B; Wang W; Chun J; Zhang K Neuronal Subtypes and Diversity Revealed by Single-Nucleus RNA Sequencing of the Human Brain. Science 2016, 352 (6293), 1586–1590. 10.1126/science.aaf1204. [DOI] [PMC free article] [PubMed] [Google Scholar]
- (44).Molyneaux BJ; Arlotta P; Menezes JRL; Macklis JD Neuronal Subtype Specification in the Cerebral Cortex. Nat Rev Neurosci 2007, 8 (6), 427–437. 10.1038/nrn2151. [DOI] [PubMed] [Google Scholar]
- (45).Phares GA; Lloyd PE Purification, Primary Structure, and Neuronal Localization of Cerebral Peptide 1 from Aplysia. Peptides 1996, 17 (5), 753–761. 10.1016/0196-9781(96)00081–2. [DOI] [PubMed] [Google Scholar]
- (46).Newcomb R; Scheller RH Proteolytic Processing of the Aplysia Egg-Laying Hormone and R3–14 Neuropeptide Precursors. J. Neurosci 1987, 7 (3), 854–863. 10.1523/JNEUROSCI.07-03-00854.1987. [DOI] [PMC free article] [PubMed] [Google Scholar]
- (47).Spraggins JM; Djambazova KV; Rivera ES; Migas LG; Neumann EK; Fuetterer A; Suetering J; Goedecke N; Ly A; Van de Plas R; Caprioli RM High-Performance Molecular Imaging with MALDI Trapped Ion-Mobility Time-of-Flight (TimsTOF) Mass Spectrometry. Anal. Chem 2019, 91 (22), 14552–14560. 10.1021/acs.analchem.9b03612. [DOI] [PMC free article] [PubMed] [Google Scholar]
Associated Data
This section collects any data citations, data availability statements, or supplementary materials included in this article.
Supplementary Materials
Data Availability Statement
The DATSIGMA code repository and analysis pipelines provided in Jupyter Notebooks are available: https://github.com/richardxie1119/DATSIGMA. All six data sets are available on Illinois Data Bank: https://doi.org/10.13012/B2IDB-7302959_V1