

Abstract
World Health Organization’s aim to eliminate malaria from developing/ resource-limited economies requires easy access to low-cost, highly sensitive, and specific screening. We present a handheld nucleic acid testing device with on-chip automated sample preparation to detect malaria (Plasmodium falciparum) infection from a whole blood sample as a feasibility study. We used a simple two-reagent-based purification-free protocol to prepare the whole blood sample on a piezo pump pressure-driven microfluidic cartridge. The cartridge includes a unique mixing chamber for sample preparation and metering structures to dispense a pre-determined volume of the sample lysate mixture into four chambers containing a reaction mix. The parasite genomic DNA concentration can be estimated by monitoring the fluorescence generated from the loop-mediated isothermal amplification reaction in real-time. We achieved a sensitivity of ~0.42 parasite/μl of whole blood, sufficient for detecting asymptomatic malaria parasite carriers.
Keywords: purification-free, nucleic acid testing (NAT), loop-mediated isothermal amplification (LAMP), malaria, microfluidics, point-of-need
Graphical Abstract

Malaria parasites transmitted via female Anopheles mosquito bites can cause high fevers, shaking chills, and flu-like symptoms. Four main kinds of parasites are Plasmodium falciparum (Pf), P. vivax (Pv), P. ovale (Po), and P. malariae (Pm), of which Pf is considered the deadliest. World Health Organization (WHO) reported that 241 million clinical malaria cases occurred in 2020, resulting in 627,000 deaths, a high portion from Africa1. The complex disease poses challenges due to the highly adaptable nature of the vector and parasites involved. The different species of the Plasmodium genus respond to medications differently and develop drug resistance in different mechanisms, which makes the development of a fool-proof vaccine difficult2. Timely treatment of an infection with correct species-specific drugs can clear the patient’s body of all parasites3. Hence, to enable prompt diagnosis and control of the spread, specific, sensitive, rapid, accurate, and low-cost tests that can be performed at the point-of-need (PON) are imperative.
Conventional malaria rapid diagnostic tests (RDTs) typically target a specific protein, for example, histidine-rich protein II (HRP-II) or lactate dehydrogenase (LDH), with a typical detection limit of 100–200 parasites/μl4. NxTek™ Eliminate Malaria Pf from Abbott5, FalciVax - Rapid test for malaria Pv/Pf from Zephyr Biomedicals6, Paracheck Pf from Orchid7 are just some of the currently available RDTs. Lee et al. suggest that false-positive results due to nonspecific biomolecules reacting with the test antigens limit the effective use of RDTs8. Additionally, HRP-II and/or III deleted Pf parasites have emerged in several African and South American countries, as well as India9, presenting challenges to malaria control and elimination efforts. Feleke et al. estimated that HRP-II-based RDTs would miss 9.7% Pf malaria cases owing to HRP-II deletion10. Thus, on the one hand, RDTs that exclusively rely on HRP-II detection may completely miss the infection (i.e., false negative), leading to further spread of this mutated parasite, and, on the other hand, a combination RDTs that use HRP-II and LDH may misclassify the infection as non-Pf leading to incorrect diagnosis and treatment. Moreover, RDTs fall short of measuring the degree of infection and often need to be followed up by microscopic examination by experts who can typically detect an infection with more than 50 parasites/μl11. Malaria detection using microscopic evaluation remains the gold standard. Briefly, a blood specimen collected from the patient is spread as a thick or thin blood smear, stained with a Romanovsky stain (most often Giemsa), and examined with a 100X oil immersion objective12. Visual criteria are used to detect the presence of malaria parasites in the thick smear, followed by species identification and quantitation of parasitemia in the thin smear. Berzosa et al. report that among 1724 samples tested by microscopy, 335 (19.4%) were false negatives13. Thus, the accuracy of microscopic detection relies heavily on the technician’s skill and quality control. Auxiliary clinics in remote rural settings seldom offer advanced microscopy setups delaying the precise detection or even misdiagnosing of the infection resulting in negligent treatment or excessive use of anti-malarial drugs, which invariably contributes to malaria morbidity and the development of resistance14. In general, microscopy and RDTs in field settings are prone to false negatives due to low parasitemia, which may result in undetected asymptomatic infections. However, timely treatment can completely cure a malaria infection if diagnosed when parasitemia concentration is low. In addition, malaria elimination efforts also require identifying these asymptomatic carriers, which tests with significantly improved detection limits will facilitate.
Nucleic acid tests (NATs) can achieve a limit of detection as low as 0.1 parasite/μl for malaria15, making them strong candidates to replace microscopic detection of malaria parasites. Since the first application of polymerase chain reaction (PCR) for Plasmodium detection16, numerous efforts have been made to develop nested17 and multiplexed PCR18 tests warranting its widespread use for identifying infections. However, PCR often requires bulky thermal cyclers, costly logistics, skilled technicians, and purified samples, limiting its use at the PON. Loop-mediated Isothermal Amplification (LAMP) is a promising molecular replication technique that requires only a constant temperature between 55 °C and 65 °C and can be easily implemented in a PON format due to its simplicity and robustness19, 20. LoopAmp malaria (Pan/Pf) detection kit (Eiken Chemical Company, Tokyo, Japan)21, 22 and Illumigene malaria LAMP assay (Meridian Biosciences, Cincinnati, OH)23, 24 are examples of commercially available LAMP kits.
Our previous work reported the development of a palm-sized instrument capable of quadruplex parallel LAMP reactions from sample to answer on a single closed microfluidic disc using a magnetic bead-based extraction protocol25. We achieved a detection limit of 0.5 parasite/μl from the whole blood sample within 50 minutes. Xu et al. reported a paper-based origami device that vertically processed the blood sample to extract, amplify (using LAMP) and detect specific malaria sequences on a lateral flow detection platform26. Thus, most microfluidics-based platforms that have been developed fall into three categories: pump-based, paper-based, and centrifugal force-based. Paper-based devices that rely on capillary action for sample transport often demonstrate variability in capillary transport due to surface evaporation sacrificing adequate sensitivity and accurate quantitation27. Lab-on-a-disk platforms that rely on centrifugal force to drive liquid to the desired location in the microfluidic disc are often energy-hungry. Pump-based approaches have traditionally used benchtop syringe pumps along with multiple tubes and complex valving, making the system bulky and difficult to be integrated for PON applications.
So far, most PON tests require elaborate sample preparation steps such as cell lysis, DNA/RNA isolation, purification, washing, concentration, and elution that may be performed using magnetic beads28, paper-based spin columns29, or salt precipitation30. QIAamp DNA Blood Mini Kit (Qiagen, Hilden, Germany) and PURE (Eiken Chemical Company, Tokyo, Japan)31 are examples of commercially available extraction kits. P.F. Mens et al. presented a direct-on-blood PCR test that adds blood directly to the PCR mix32. The endpoint result was visualized using a nucleic acid lateral flow immunoassay (NALFIA). Thus, although there are multiple examples of commercialized PCR and LAMP assays based on extracted and purified DNA from infected whole blood, their adoption for direct-on-blood tests remains complicated because contamination from human carryover components such as proteins, lipids, hemoglobin, hematin, and immunoglobulin G, can cause interference in optical detection methods, and inhibit amplification33. As a result, malaria DNA extraction and purification steps are often required before downstream processing. A test that can be done with whole blood but without complicated sample preparation steps while limiting the inhibitory effects is highly desirable for PON testing (PONT).
This work presents an automated nucleic acid testing device relying on the unique reagent-based Arcis sample preparation chemistry and a continuous flow microfluidic chip assay that can run direct-on-blood LAMP and demonstrates reliable and sensitive malaria detection. This PON testing platform has a continuous-flow pressure-driven on-chip sample preparation protocol to combine the blood lysate with Arcis reagents utilizing an ellipsoid-shaped structure coupled with the contact angle hysteresis of a hydrophilic surface and vertically dispense a pre-determined mixture volume into four chambers with a preloaded LAMP mix utilizing a semi-circular metering structure. It also has built-in optics to monitor the fluorescence emitted by the LAMP reaction in real-time and can reliably detect the presence of 0.42 parasite/μl of malaria (Pf) in a whole human blood sample.
Results and Discussion
Validation of the purification-free sample preparation
Nucleic acid (NA) extraction is the first step in molecular diagnosis and is crucial to ensure the results are reliable and clinically relevant34. It has the following objectives: to ensure the integrity of the primary structure of nucleic acid molecules is preserved, to exclude other molecular contaminants, and to optimize yield35. It is also essential to evaluate whether the quality of sample preparation varies with the concentration of the infection-causing agent since it is desirable to have highly efficient NA extraction to detect a sample with low NA concentration. We use the Arcis Sample Prep Kit, a commercial NA extraction kit from Arcis Biotechnology, UK, consisting of two reagents. Arcis Reagent 1 (Arcis 1 hereafter) works as a lysis agent to release NAs in the blood, chelate them and stabilize the DNA. Arcis Reagent 2 (Arcis 2 hereafter) removes the NA chelation and relaxes the DNA while binding any PCR or LAMP inhibitors present in the blood that may prevent DNA amplification. Although Arcis 2 is a proprietary mixture, the key components include additives such as bovine serum albumin (BSA), dimethyl sulfoxide (DMSO), and T4 bacteriophage gene 32 product (gp32) that reportedly improve DNA - polymerase interaction and benefit PCR amplification36. Together, these allow blood to be processed for a molecular diagnostic test in approximately three minutes without any DNA isolation or purification steps. Since the protocol does not isolate the DNA extracted from whole blood, certain other blood components may be carried over to downstream analyses, making spectrophotometric approaches such as nanodrop inaccurate in quantifying the extracted DNA. We performed Pf DNA extraction from whole blood and investigated the extraction efficiency by performing downstream PCR analysis based on a standard qPCR curve.
A contrived blood sample was prepared by spiking 9 μl of negative whole blood with 1 μl of Pf gDNA (3D7, stock concentration 50 ng/μl). Nine such blood samples were prepared by serially diluting the gDNA 2-fold. Figure 1a outlines the Arcis sample preparation steps performed on the contrived blood samples manually in micro-centrifuge tubes. Each 10 μl blood sample was subjected to DNA extraction by incubating it with 30 μl of Arcis 1 for one minute and then mixing 20 μl of the resulting lysate with 20 μl of Arcis 2. Figure 1b shows the qPCR (reaction volume: 25 μl) amplification curves for one μl 2-fold serially diluted purified gDNA (black) and one μl processed contrived blood (colored) as samples. Average Ct values of the gDNA triplicates were used to generate a standard qPCR curve by plotting the Ct values versus the DNA concentration (Figure 1c). Average Ct values of the blood sample triplicates were placed on this standard curve (colored crosses) to determine the resulting DNA concentration (colored dashed lines). Figure 1d shows the plot of the resulting measured gDNA concentration versus the theoretically calculated gDNA concentration in the spiked blood sample based on dilution. The higher the input gDNA concentration, the higher is the measured gDNA concentration with a linear relationship for 2-fold serially diluted gDNA as input (the highest concentration was 50 ng/μl). It must be noted that after the extraction procedure, blood samples spiked with 0.39 ng/μl and 0.19 ng/μl diluted gDNA did not show any amplification within 55 cycles indicating dilution of the blood sample beyond the detection limits of the assay. This validates that the Arcis sample preparation protocol does not vary with gDNA concentration and preserves the gDNA quality for detection using downstream analysis.
Figure 1.
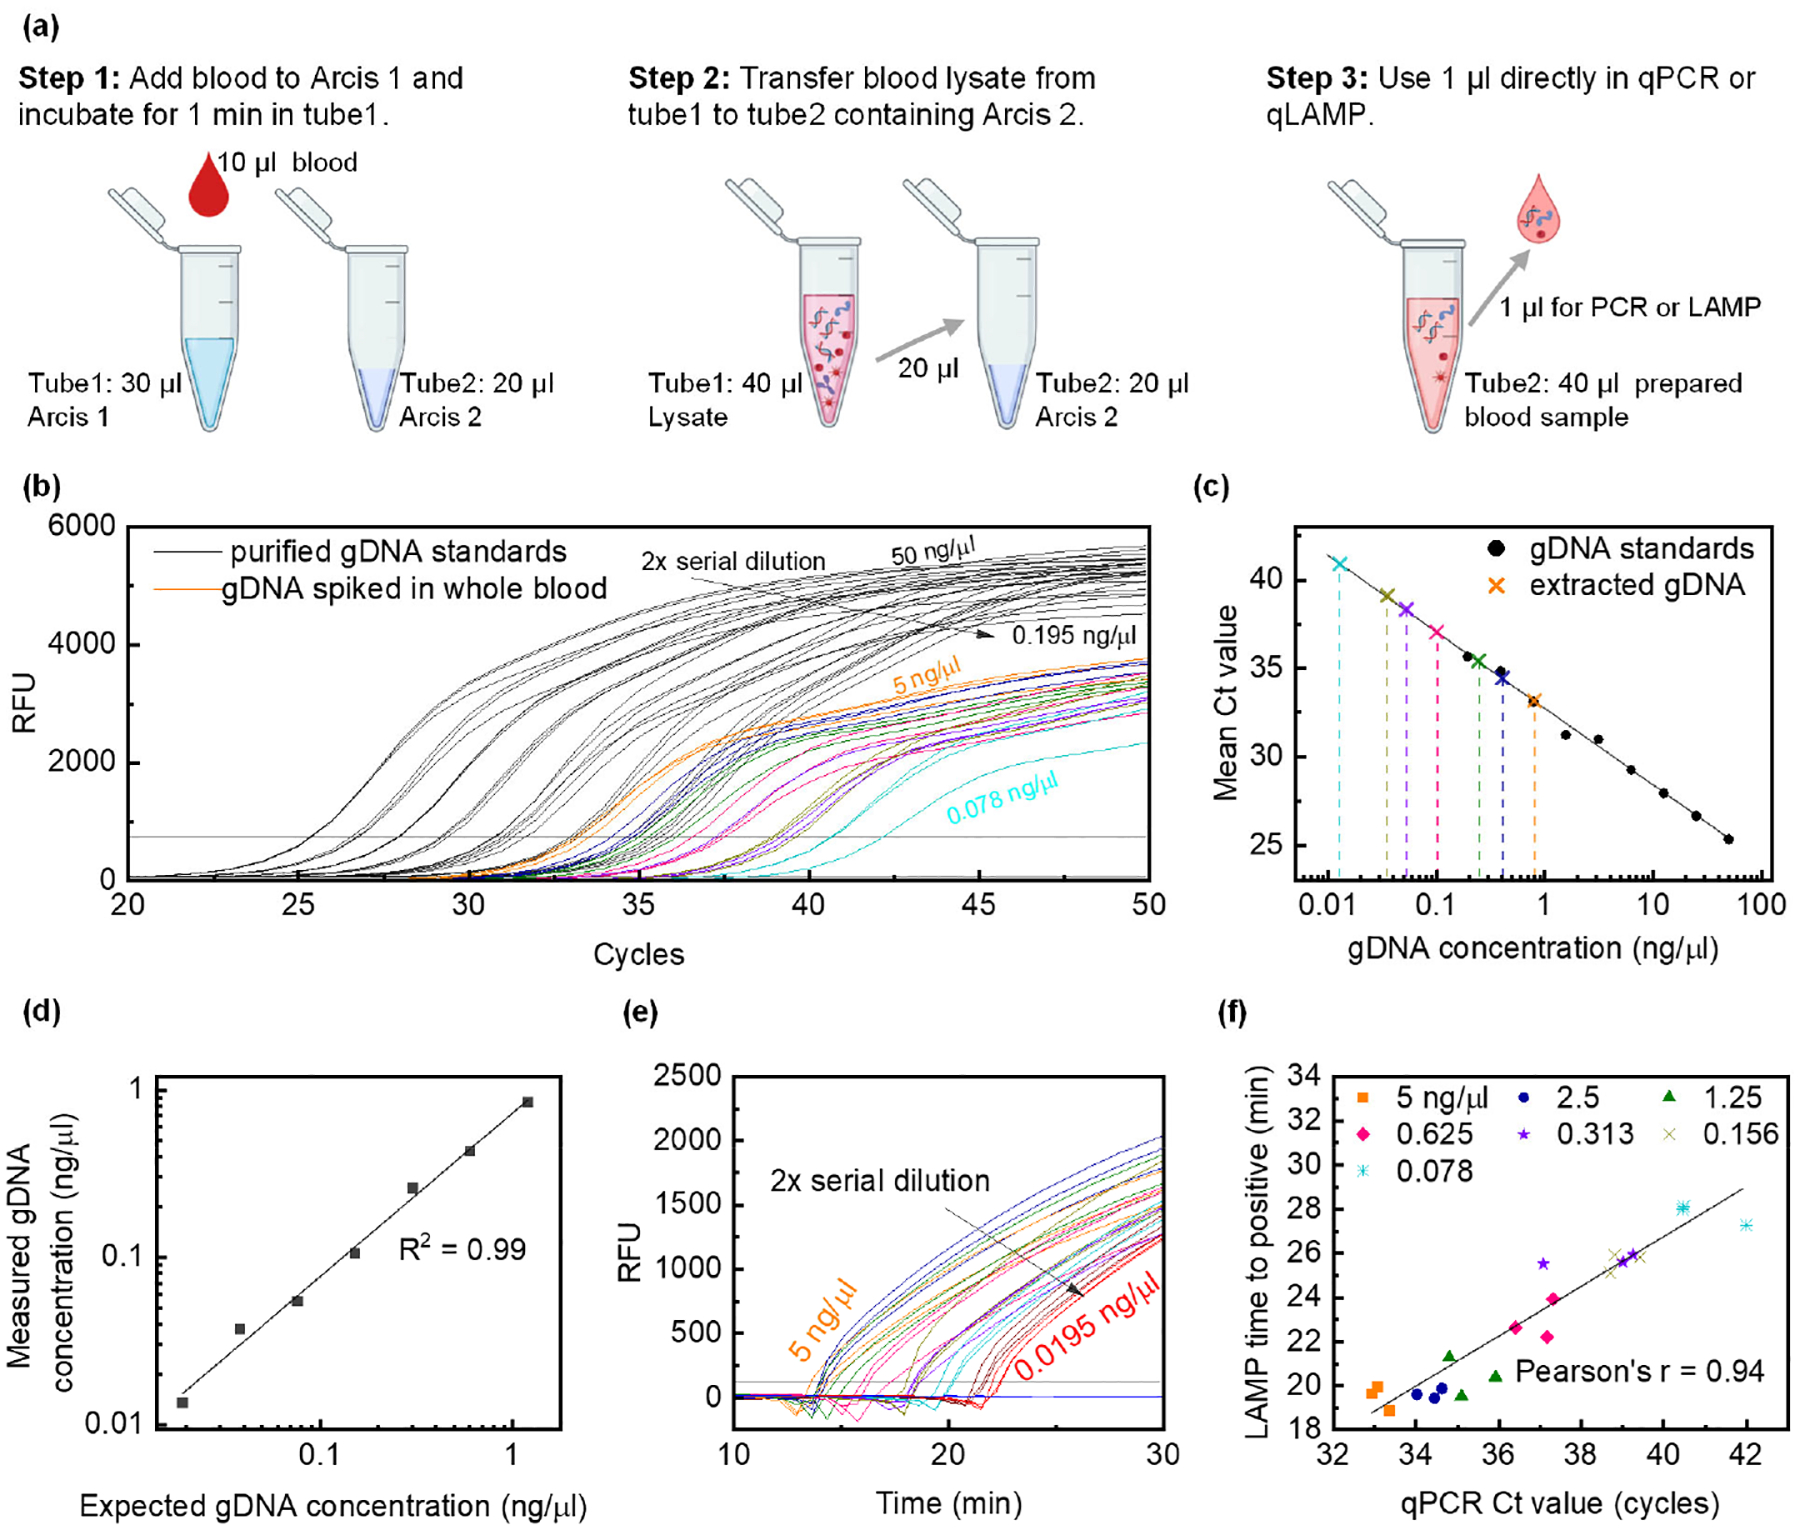
a) Extraction and purification-free Arcis sample preparation protocol performed in tubes. Step 1: Add Pf positive blood to Arcis 1 (1:3 v/v), step 2: Add blood lysate from step 1 to Arcis 2 (1:1 v/v), and step 3: use 1 μl of the mixture from step 2 in a 25 μl amplification reaction. b) Black curves represent the qPCR amplification curves (triplicates) with 1 μl 2-fold serially diluted Pf gDNA (stock concentration 50 ng/ μl) as standards in 25 μl total reaction volume. Ct values are used to generate the qPCR standard curve in c. Colored curves represent the qPCR amplification curves (triplicates) with 1 μl Arcis prepared Pf gDNA spiked whole blood. c) qPCR standard curve. Black circles represent mean Ct values for gDNA samples and are used to construct the standard curve. Colored crosses represent mean Ct values for prepared spiked whole blood samples and are used to determine the resulting gDNA concentration after ‘extraction’ or sample preparation. d) Measured gDNA concentration versus expected gDNA concentration in whole blood as a result of dilution. 0.039 ng/μl and 0.019 ng/μl gDNA in spiked whole blood are not amplified within 55 cycles due to dilution. e) LAMP curves (triplicates) for Arcis prepared Pf gDNA spiked whole blood samples, identical to those used in b. 0.039 ng/μl and 0.019 ng/μl gDNA in spiked whole blood are amplified by the LAMP assay. f) The correlation between LAMP times to positive and qPCR cycle thresholds for Arcis prepared Pf gDNA spiked whole blood samples.
To validate the LAMP assay, we performed real-time LAMP on the same samples used for qPCR. The LAMP curves are shown in Figure 1e, and the co-relation between LAMP times to positive and qPCR cycle threshold values is shown in Figure 1f. A Pearson’s coefficient of 0.94 suggests that the purification-free sample preparation is valid for both PCR and LAMP downstream analyses. These results confirmed the Arcis Sample Prep Kit as an acceptable sample preparation protocol with minimal background interference.
A continuous flow microfluidic cartridge for automated test
One of the significant challenges for NATs at the PON is related to the front end of the assays, NA extraction from raw samples37. The ideal sample preparation for malaria mass screening applications should be simple, scalable, and easy to operate. In this work, we have developed a disposable Poly(methyl methacrylate) (PMMA) microfluidic cartridge to perform the previously described blood sample preparation and DNA amplification in a safe, hassle-free, and automated manner. The microfluidic cartridge consists of five PMMA layers and measures 10 × 4.5 × 1.2 cm (Figure 2a). Figure 2b is a picture of the assembled PMMA cartridge and highlights the various chambers using colored water. The Top layer seals the cartridge and has inlet holes for each chamber, described further. The Microchannel layer features two octagonal chambers (150 μl) for loading the blood lysate (red) and holding the Arcis 2 (blue), an ellipsoid-shaped mixing chamber, and a serpentine structure to induce an incubation delay. The Metering layer features semi-circular traps to isolate the mixture and generate a droplet of tunable volume that will combine with the LAMP master mix preloaded in the four reaction chambers (volume ~70 μl, yellow) in the Reservoir layer. The undeposited mixture is drained into the waste chamber of the Reservoir layer. The waste chamber also has an outlet to release the pressure exerted by the pump. To avoid the mixing of reagents during a fall or any other vibration, a passive check valve is employed by sandwiching an air-filled chamber between two teeth-shaped structures. Structural pinning is enabled by the tooth’s sharp bending angle (α) and radically increases the liquid/vapor interface area and raises the activation energy, thus preventing the fluid from overcoming the barrier. These passive valves are present on either side of the octagonal reagent chambers in the Microchannel layer.
Figure 2.
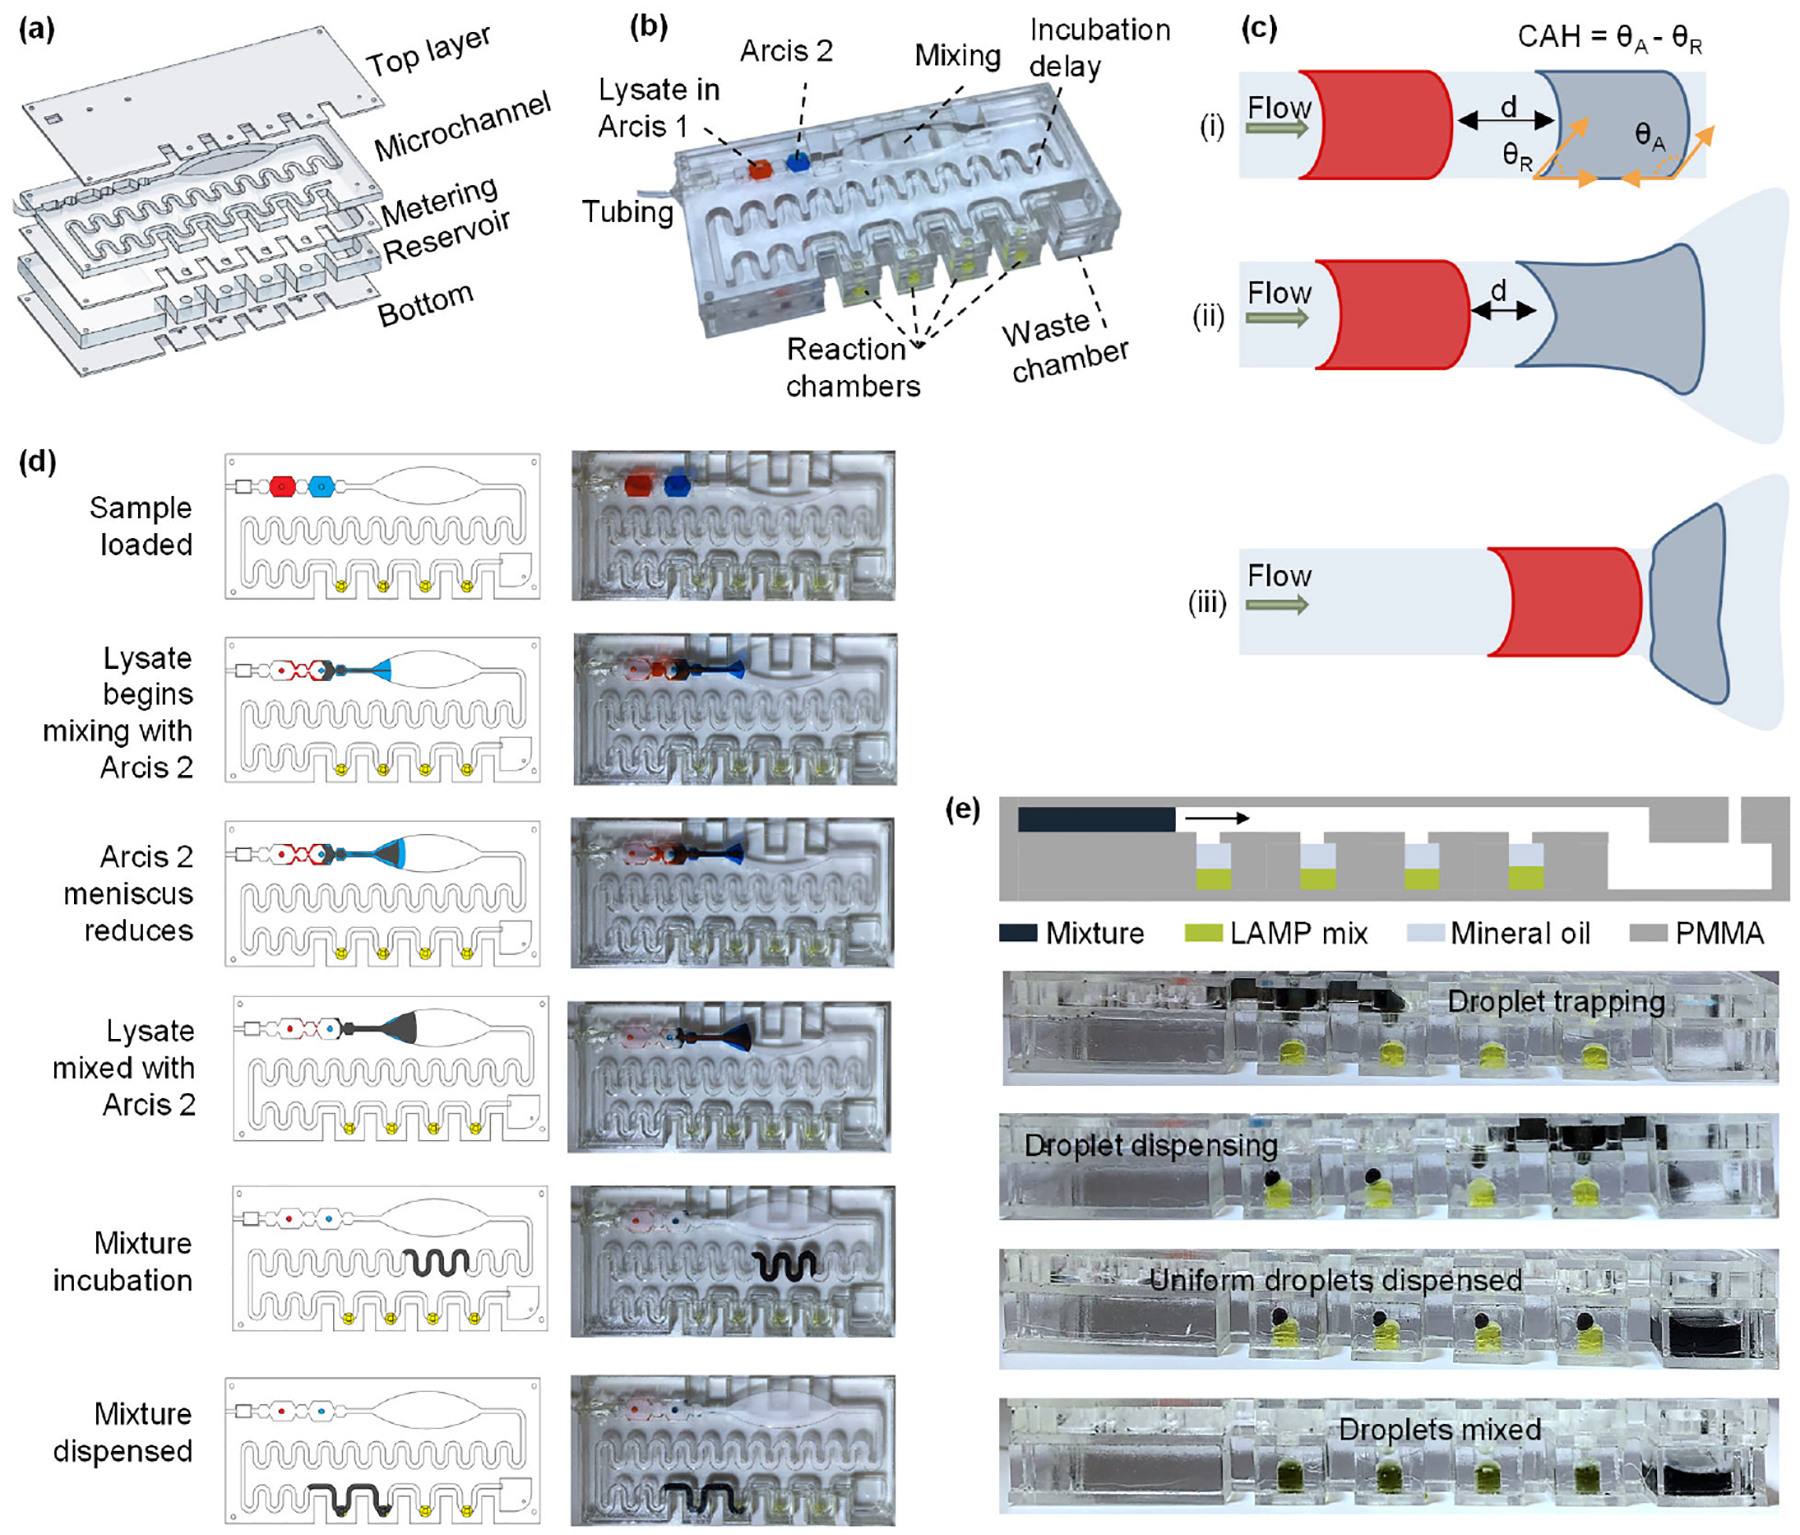
a) Details of each layer of the PMMA cartridge: The Top, Metering, and Bottom layers are 1 mm thick, the Microchannel layer is 3.17 mm thick, and the Reservoir layer is 5.65 mm thick. b) Assembled cartridge along with details of each chamber. Chambers for Lysate in Arcis 1 and Arcis 2 have a volume of 150 μl, reaction chambers have a volume of ~70 μl, and semi-circular metering chambers have a volume of ~4 μl. c) Use of elliptical structure to mix two sequentially loaded liquids. d) Top view of the sample preparation process on the microfluidic cartridge. e) Front view of the microfluidic cartridge showing various stages of the mixture dispensing step.
First, the blood sample is mixed with the Arcis 1 reagent off the cartridge in a micro-centrifuge tube, and then this lysate is loaded into the cartridge. All other necessary components, such as Arcis 2, LAMP mix, and mineral oil, are loaded in the cartridge prior to the test or could be preloaded (although not tested in the present study). A small piezo pump drives the lysate and the Arcis 2 in the next chamber through the cartridge. A challenge in continuous flow microfluidics is mixing two sequentially loaded liquids due to laminar flow in the channel. However, they may mix in a sufficiently long channel while relying on diffusive mixing, an inherently slow process38. We exploit a hydrophilic surface’s inherent contact angle hysteresis to speed up the mixing process. Contact angle hysteresis (CAH) is the difference between the advancing (θA) and receding (θR) angles39, which causes the droplet to elongate along the hydrophilic surface since the liquid is pinned at the receding point. In a uniform, straight channel, despite the contact angle hysteresis, the pressure built up between the two liquid volumes is higher than the pinning force at the receding point, not allowing them to mix (Figure 2c– i). As Arcis 2 approaches the ellipsoid-shaped structure, it prefers to flow closer to the edges and is pinned due to the hydrophilic nature of the laser-cut edge. Thus, its meniscus reduces, allowing the lysate mixture to compress the air and reduce the distance (d) it must travel to meet Arcis 2. The ellipsoid-shaped structure increases the contact area and contact time between the lysate and Arcis 2, beginning the mixing process. This mechanism is highlighted in Figures 2c– ii and iii. Figure 2d depicts the top views of the blood sample preparation instances. The serpentine structure also facilitates the mixing by generating chaotic advection40, thus improving the mixing efficiency.
Finally, the mixed fluid encounters the semi-circular metering structure lined vertically above the LAMP chamber. It is used to dispense fixed amounts of the mixed fluid into the chamber by first isolating the fluid and then letting the four μl droplet sink through the mineral oil layer to combine with the LAMP master mix. The straight edge of the semi-circular trap blocks any isolated fluid from being carried over to the next chamber. An equal amount of mixed fluid is isolated and dispensed by ensuring that the exact amount of mineral oil is loaded into each LAMP chamber. A surfactant added to the mineral oil assists the droplet in breaking the surface barrier between the mineral oil and the LAMP master mix. The cylindrical LAMP reaction chambers are loaded with 21 μl LAMP mix and covered by 45 μl mineral oil (with Span-80 as surfactant). The metering trap process and droplet dispensing instances are depicted in Figure 2e. The remaining volume of mixed fluid travels further, is deposited in subsequent LAMP reaction chambers, and the rest is flushed into the waste chamber. Although colored dyes were used to depict the process, the Supplementary Video shows the top and front view of the sample preparation process with a blood sample, Arcis 2, and LAMP mix.
Instrument design and validation
Figures 3a and b depict the developed instrument with a microfluidic cartridge. The palm-held instrument measures 12 (l) × 7.5 (w) × 5 cm (h). It is designed to perform automated blood sample preparation followed by LAMP seamlessly on a microfluidic cartridge. A commercially available 23000 mAh Li-ion battery pack powers the instrument for ~65-minute long tests. The instrument consists of a piezo pump to drive the reagents through the cartridge, an aluminum heating block to provide the heat required for the LAMP reaction, an optics assembly to monitor the fluorescence emitted from the reaction in real-time, a press button to start the test, and a LED bar for user feedback. The real-time amplification values are recorded as RFU and stored on a computer which can be plotted later. However, the built-in LED bar provides intermediate updates during the test and displays the endpoint results allowing the instrument’s independent use. Figure 3c shows the disassembled view of the instrument highlighting all the comprising modules (described ahead), and Supplementary Figure S1 shows a simplified block diagram. Supplementary Figure S2 estimates that the instrument consumes 3.087 Wh over ~65 minutes; this translates to 343 mAh at 9 V. Since the 23000 mAh Li-ion battery pack uses cells with a nominal voltage of 3.7 V, some energy is lost in upconversion to 9V (the operating voltage of the instrument). This leaves us with ~7565 mAh at 9 V, enough to perform ~20 tests on one charge.
Figure 3.
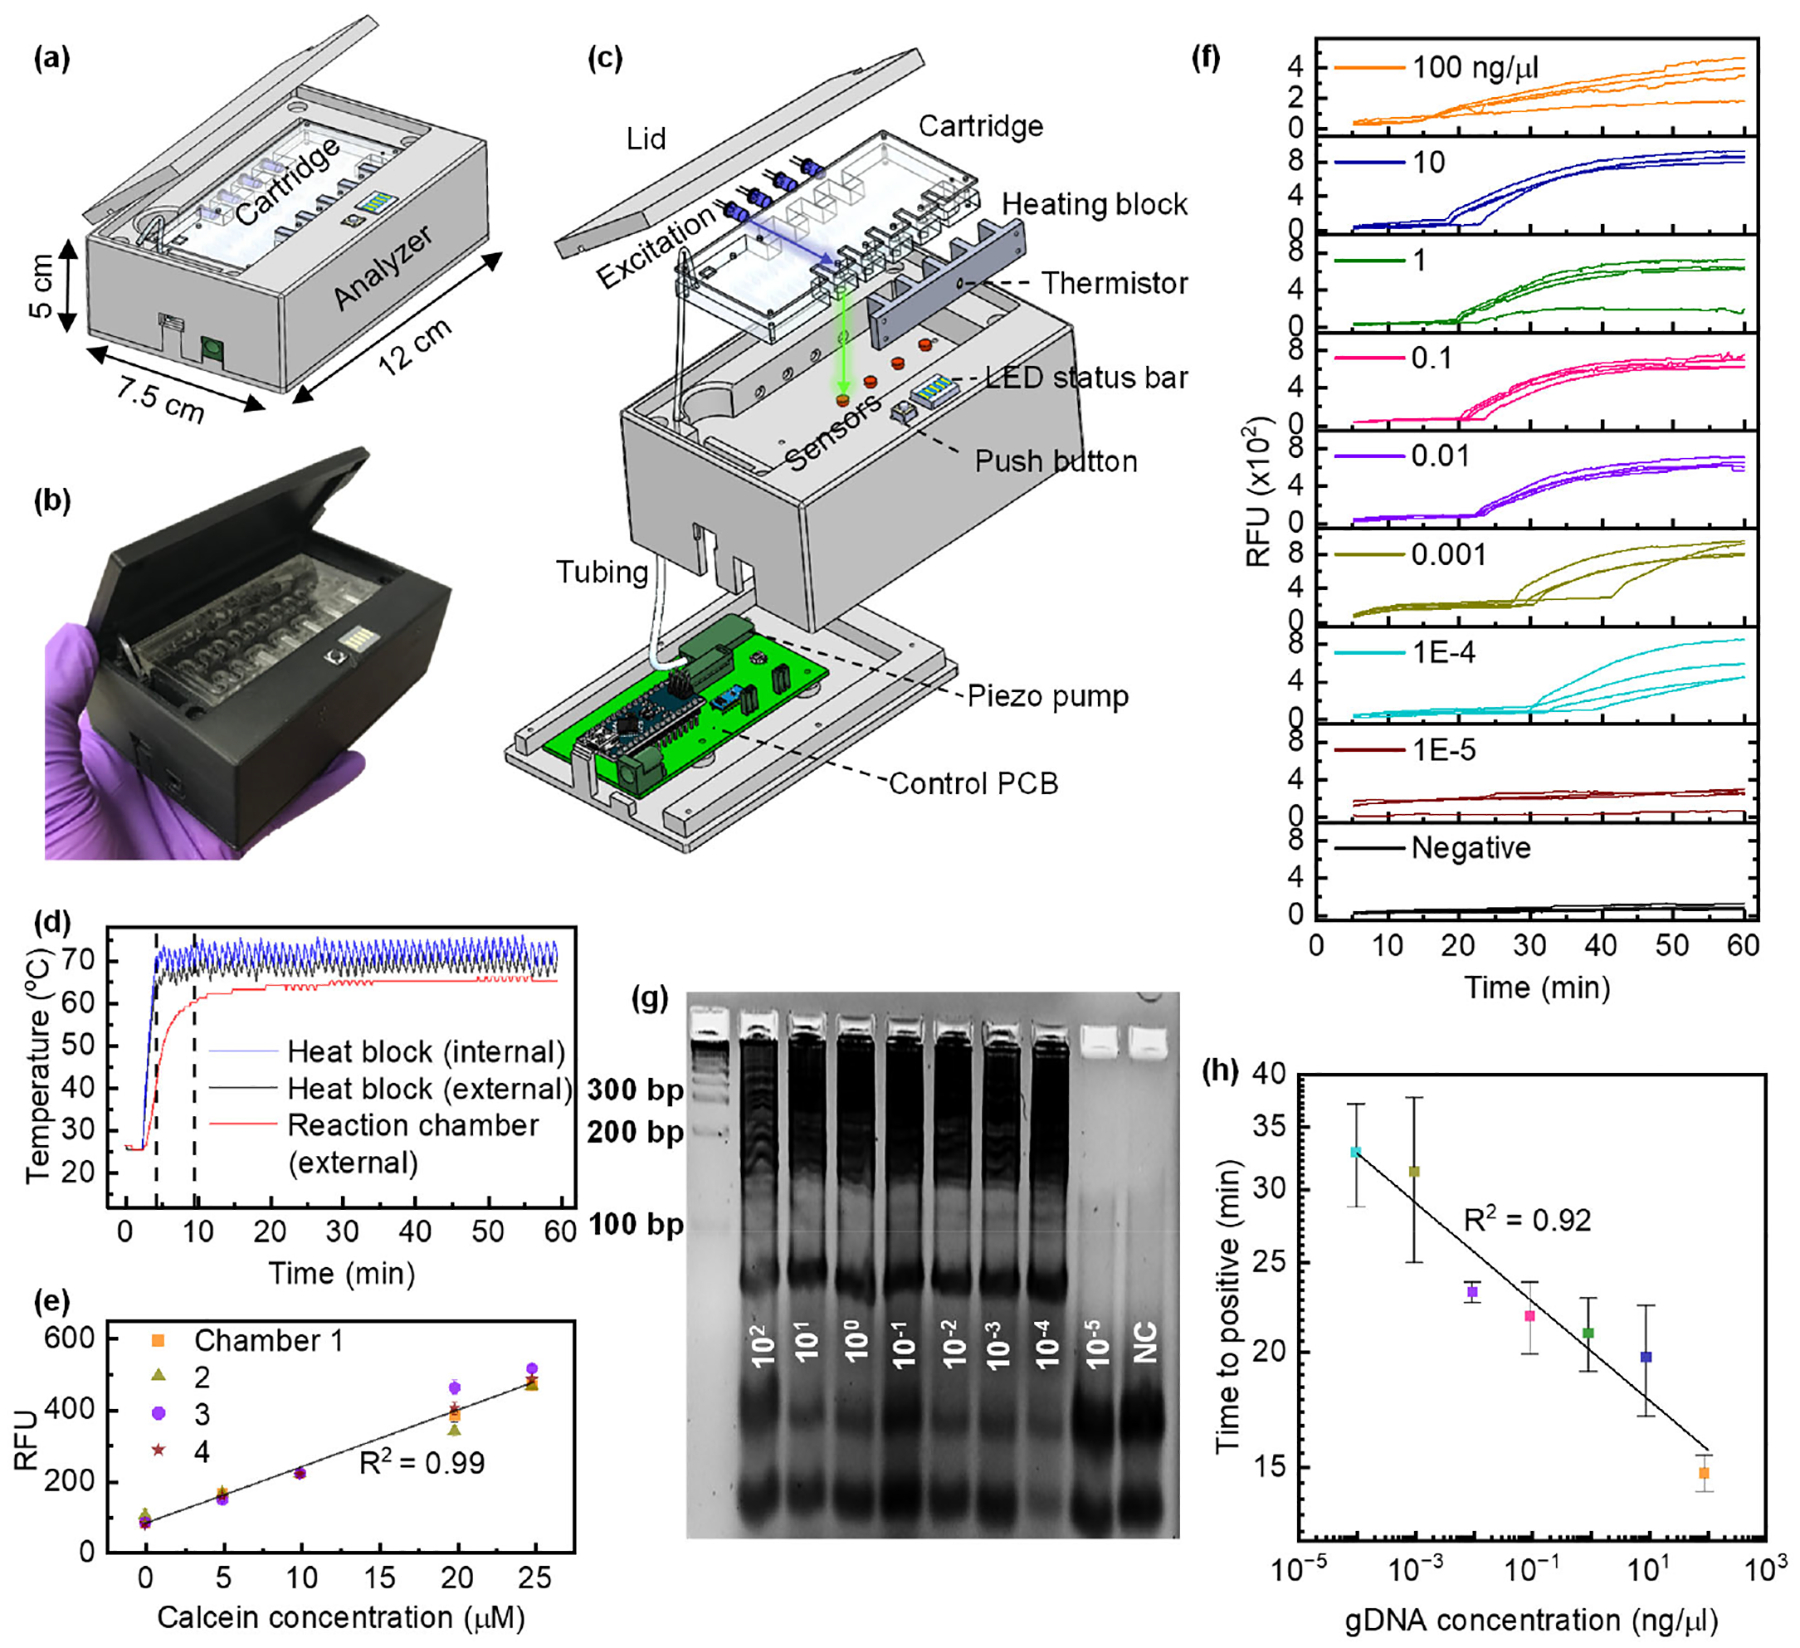
a) Schematic of the instrument developed for streamlined, automated pressure-driven blood sample preparation for LAMP analysis on a microfluidic cartridge. b) Image of the assembled instrument along with the PMMA microfluidic cartridge. c) Detailed view of various modules of the instrument. d) Heating kinetics. 25 μl H2O and 45 μl mineral oil were pipetted into the microfluidic cartridge’s LAMP reaction chambers. The heating block’s temperature is regulated to 71 °C by the onboard Arduino nano within five min. An external sensor was used to measure the temperature of the water by placing the thermistor inside the LAMP chamber. The LAMP chamber contents take another five minutes to reach ~62 °C and remain within the required LAMP temperature range at 64.61 +/− 0.83 °C. e) Color sensor characterization. 25 μl fluorescence (calcein) of varying concentrations was pipetted into all four chambers of the cartridge, and RFU (red channel counts) were recorded for five min. A linear relationship with increasing concentration and consistency among all four chambers is seen. The error bars represent the variation of one channel over five minutes. f) Pf gDNA amplification on the instrument. 10-fold serially diluted Pf gDNA (102 ng/ μl to 10−5 ng/μl) and LAMP mix were manually pipetted into all four cartridge chambers and amplified. g) Gel electrophoresis image of the amplicons confirms gDNA amplification on the instrument. The smear and banding pattern around the 200 bp rung confirm the LAMP amplification of Pf gDNA. As expected, the smear pattern is not seen for 10−5 ng/μl concentration and NC (water). The bands seen below 100 bp rung are due to the LAMP primers. h) Times to positive for each gDNA concentration. Error bars represent the standard deviation among the four chambers.
Thermal module:
A custom fin-structured heating block is designed to heat the reaction contents to a LAMP conducive temperature. ~1.08 A current at 9 V is driven across four two-ohm power resistors (connected in series) attached to the aluminum heating block using a thermally conductive adhesive. A thermistor integrated into the heating block is used as internal feedback to regulate the desired temperature. As shown in Figure 3d, it takes ~3.5 minutes for the aluminum heat block to reach ~70 °C while the instrument sits in a room-temperature environment. The LAMP reaction chamber contents (25 μl H2O with 45 μl Mineral oil) take another five minutes to reach ~62 °C and remains within the required LAMP temperature range after that, with a mean of 64.61 +/− 0.83 °C. Although this characterization experiment was performed at room temperature, we opine that the instrument would need slightly more or less time in lower or higher temperature environments, respectively. However, this would not have a significant effect on power consumption.
Optical module:
A blue (λ=465 nm) excitation LED and a CMOS-based TCS 34725 color sensor pair is used as an optical readout to monitor the fluorescence emitted from a reaction chamber in real-time. The excitation light from the LED is directed perpendicular to the optical sensor’s field of view to minimize the excitation interference (refer to Figure 3c). Figure 3e shows a linear relationship between the concentration of fluorescent calcein (0 to 25 μM) loaded into the LAMP reaction chambers and the measured RFUs or photon counts. This validates the color sensor’s use to distinguish the real-time fluorescence increase of the LAMP reaction. Red counts from the sensor were used as RFU as they are least affected by the blue excitation light (data not shown). The error bars represent the variation of one channel over five minutes. Since the simplified optical assembly does not use any filters, some excitation light leaks into the color sensor while illuminating the reaction chamber; hence, it is essential to model the signal to differentiate the fluorescence from the background excitation. The signal (number of photons) captured by the color sensor is given by Si, where i denotes the color sensor number (one through four).
| (1) |
where Ii is the LEDs output power, βi is the coupling factor between a reaction chamber’s emission and the sensor, hν is the emitted photon’s energy, α is the absorption coefficient, Ci is the fluorescence concentration that is unquenched as the LAMP reaction proceeds, ϕF is the fluorescence quantum yield, NBi is the background signal (not dependent on fluorescence concentration and contributed by the leaked excitation), ϕB is the background signal quantum yield. Ti is the integration time (a changeable parameter of the sensor). For simplicity, we consider Ti is multiplied instead of convolved with the other parameters. The excitation light coupled to each reaction chamber may not be the same due to the chamber’s distance from the LED and the overall arrangement. Moreover, the fluorescence coupled to each color sensor may not be the same, resulting in non-uniformity among the reaction chambers.
At t = 0, the fluorescence concentration Ci = 0. Thus, the signal is given as,
| (2) |
To make chamber 2’s signal similar to chamber 1, each reading must be divided by a scaling factor (SF) which is given by the ratio of S2(t=0) and S1(t=0). Subsequently, the background signal must be subtracted, S2(t) – S2(0). Thus, every new signal is given as,
| (3) |
Thus, at t=0, all chamber sensors must not have any signal due to fluorescence, and the background/baseline must be subtracted from the color sensor reading to represent true amplification RFUs. This is accommodated in two stages, explained further in the Methods section.
Pneumatic module:
The Arcis sample preparation protocol is implemented on the microfluidic cartridge by using a piezo pump from Bartels Mikrotechnik, Germany. It is a miniaturized double diaphragm pump with passive check valves, measuring 30 × 15 × 3.8 mm and weighing two grams. The piezo pump is interfaced with a microcontroller (MCU) via a driver circuit also manufactured by Bartels Mikrotechnik. The driver circuit allows us to control the pump’s flow rate in real-time between zero and seven ml/minute by adjusting the operating voltage and frequency. Such use of the piezo pump avoids the need for any rotational element/ moving part, like in centrifugal force-based platforms that may need large amounts of electrical power to achieve high rotational speeds for the desired non-linear centrifugal forces. The pump is connected to the microfluidic cartridge by a Tygon tube.
Instrument validation:
To evaluate the quantitative testing ability of this diagnostic platform, we subjected a series of 10-fold dilutions of purified Pf gDNA in Tris-EDTA buffer to LAMP reactions in the instrument. For each concentration, a set of four identical reactions were prepared by manually pipetting 24 μl LAMP master mix and a 1 μl gDNA sample into each of the four reaction chambers on the cartridge. Figure 3f shows real-time amplification curves (one replicate in each reaction chamber of the cartridge) of tests carried out for each concentration and water as a negative control (NC). 10−5 ng/μl and NC (water) were not amplified within 65 minutes. A trend of delayed pick-up times for decreasing concentration is seen in these amplification curves and the variation in times to positive increases for concentrations below 0.01 ng/μl. At low gDNA concentrations (0.001 and 1E-4 ng/μl), the amplification curves have slight dissimilarity, possibly due to any LAMP assay’s highly efficient but semi-quantitative amplification mechanism. The amplified products of each starting concentration were extracted from the cartridge and subjected to gel electrophoresis (5% agarose gel), and the image is shown in Figure 3g. The smear and banding pattern around the 200 bp rung confirm the LAMP amplification of Pf gDNA. As expected, the smear pattern is not seen for 10−5 ng/μl concentration and NC (water). The bands seen below 100 bp rung are due to the LAMP primers (F3, B3, LB, and LB: ~20 bp, BIP: 40 bp, and FIP: 50 bp). Figure 3h shows the mean times to positive for each concentration along with the standard deviation. A clear linear relationship (R2 = 0.92) is observed between time to positive and the Pf gDNA concentration between 102 ng/μl and 10−4 ng/μl, which could be used as a reference curve for quantification.
Detection of Pf gDNA in contrived whole blood samples
Figure 4a describes the proposed workflow of the blood sample to answer molecular diagnostic test, (i) a 40 μl finger-prick blood sample is added into a micro-centrifuge tube containing 120 μl Arcis 1 reagent, shaken, and incubated at room temperature for one minute. Arcis 1 works as a lysis agent to release DNA in the blood. It simultaneously chelates the other NAs and stabilizes the DNA. (ii) 150 μl of this lysate is loaded into the first octagonal chamber of the microfluidic cartridge, and the inlet hole is sealed (shown by red dye). (iii) the cartridge is then placed into the instrument, and a Tygon tube attached to the cartridge is connected to the piezo pump. Upon pressing the button, the instrument begins the test by preparing the sample by mixing the blood lysate with Arcis 2 (piezo pump driven), which removes the NA chelation and relaxes the DNA while binding any LAMP inhibitors present in the blood that may prevent amplification of the DNA. Mixing is seamlessly followed by automated dispensing of the sample into LAMP reaction chambers preloaded with the LAMP master mix. The heating block surrounding the LAMP reaction chamber from three sides heats up the mixture inside to ~64 °C to start the amplification reaction, which is monitored in real-time using the color sensors. The sample preparation takes about three minutes, followed by the amplification process, which takes up to 60 minutes. (iv) the real-time amplification can be plotted on a connected computer, and the final test result (positive or negative) can be displayed on the built-in status LED bar. A test is reported positive if the majority of reaction chambers (three of the four) show amplification of the Pf gDNA in the blood sample, allowing us to be confident of the positive/negative call.
Figure 4.

a) Proposed test workflow: i) Collect 40 μl of the blood sample into a tube containing 120 μl of Arcis 1 reagent, shake well, and incubate for 1 min. ii) Transfer 150 μl of the blood lysate (denoted by red) to the microfluidic cartridge that is preloaded with Arcis reagent 2 (denoted by blue) and LAMP master mix (denoted by yellowish-green) topped with mineral oil. iii) Connect the microfluidic cartridge’s tubing to the piezo pump, place it in the recess and close the lid. Once the start button is pressed, autonomous sample preparation begins by mixing the lysate and Arcis reagent 2 and dispensing the mixture into the four LAMP reaction chambers, followed by LAMP for 60 min. iv) Real-time LAMP results can be plotted on a computer screen, or endpoint results can be displayed on the status LED bar. The numbers 1 through 4 represent the LAMP chambers. b) Amplification curves for contrived blood samples prepared by spiking 36 μl whole blood with 4 μl 10-fold serially diluted Pf gDNA (102 ng/μl to 10−4 ng/μl). Lysis with Arcis 1 was performed in a tube, followed by further autonomous processing of the resulting mixture in the cartridge on the analyzer. A quick evaluation warrants setting the threshold at 50 RFU. c) Times to positive vs. gDNA concentration in contrived blood samples. Parasite concentration was determined using the relation 1 parasite = 2.35×10⁻⁵ ng. A quick investigation suggests a sensitivity of 0.42 parasites/μl. d) The Pearson correlation between times to positive seen on the instrument using automated sample preparation and detection on the cartridge and benchtop thermal cycler using manual sample preparation steps (same as Figure 1e). e) Analytical specificity test using other Plasmodium gDNA spiked in whole blood. Contrived blood samples were processed with Arcis 1 and Arcis 2 in tubes, and LAMP was performed on the cartridge in the instrument simultaneously. Only the Pf gDNA spiked blood sample (102 ng/μl) was amplified, while the Pv and Po gDNA spiked blood samples, and the non-spiked blood remained negative.
To evaluate our instrument’s performance for a whole blood sample in a lab, we used mock blood samples spiked with extracted gDNA. Briefly, we spiked 36 μl of whole blood with 4 μl 10-fold serially diluted Pf gDNA (102 ng/μl to 10−4 ng/μl) to create mock samples. After lysing the blood sample with Arcis 1 in a tube, the resulting mixture was processed on a microfluidic cartridge and subjected to LAMP on the instrument. Figure 4b shows amplification curves for each spiked whole blood sample. Since 10−5 ng/μl purified Pf gDNA was not amplified, we did not attempt amplifying any 10−5 ng/μl spiked blood samples. Although estimation of the limit of detection requires the times to positive be expressed as a probability with confidence intervals, we use the relation, 1 parasite = 23×106 bp = 0.0235 pg gDNA41, to suggest the whole blood sensitivity. 4×10⁻⁴ ng/μl gDNA in 40 μl blood corresponding to 10−5 ng/μl of whole blood is reproducibly detected on the instrument. Thus, we estimate the sensitivity as 0.42 parasite/μl. This is agreeable with WHO’s analytical sensitivity estimate to be lower than two parasites/μl for identifying low-level infection in a pre-elimination setting. One may notice that for 0.01 ng/μl, only three out of the four reaction chambers showed amplification; this could be due to the low amount of sample dispensed into that particular reaction chamber. Additionally, the variation in times to positive increases for concentrations below 0.1 ng/μl, which could be attributed to the semi-quantitative ability of any LAMP assay compared to a PCR assay42. Figure 4c shows the linear (R2 = 0.80) and inversely proportional relationship between the time to positive and parasite concentration. As expected, the standard deviation between the times to positive increases as the parasite concentration decreases. However, the strong linear relationship can be exploited to quantify parasitemia in whole blood samples.
To further benchmark our instrument with a benchtop thermal cycler, we used mock blood samples spiked with 102 to 10−4 ng/μl gDNA (10x serially diluted) that were subject to Arcis reagent-based sample preparation in traditional micro-centrifuge tubes for LAMP analysis on a benchtop thermal cycler (triplicates). This process is the same as that described in Figure 1e. Figure 4d shows the correlation between times to positive seen on the instrument using automated sample preparation along with detection on the cartridge and benchtop thermal cycler using manual sample preparation steps. A Pearson’s R=0.97 indicates a good agreement between the automated instrument and manual setup. The amplification curves and times to positive of the LAMP reactions performed on the benchtop thermal cycler are given in Supplementary Figure S3.
To confirm the analytical specificity of the test, we prepared four separate whole blood samples, three spiked with Pf, Pv, and Po gDNA, as explained earlier, and a non-spiked one. Since the microfluidic cartridge is designed to dispense the same blood sample into the four reaction chambers, the Arcis sample preparation protocol was carried out in tubes, as explained earlier. The four products and the LAMP master mix were manually pipetted into the four cartridge chambers to simultaneously run an amplification experiment on all samples. As seen in Figure 4e, only the Pf gDNA spiked blood sample was amplified, while the Pv and Po gDNA spiked blood samples and the non-spiked blood sample remained negative for 65 minutes.
The readers should note that the LAMP assay used to test the instrument’s performance for a whole blood sample has been previously evaluated for thermostability25. Briefly, enzymes and reagents retained sufficient activity to achieve successful DNA amplification when stored at 4 °C for a week, and there was no significant shift in the average threshold time. However, when stored at 25 °C, the enzymes and reagents were active for 3 days (no activity afterward), and the threshold time needed to obtain the positive/negative results were delayed. Although not evaluated, the PMMA cartridge used in the current study could interact with the reagents differently when compared to Eppendorf tubes used to test the thermostability in the previous study. Being aware of the critical need for field deployable PON NATs, we are diligently working to develop a protocol for lyophilized LAMP assay, a more user-friendly and transport-friendly industry standard. We aim to lyophilize the regents directly in a cartridge and then test the long-term stability and shelf-life over a seven-week interval. When tested with a relevant cartridge design, these results will be published in a future study.
Another point to be noted is that the first step of sample preparation (lysis) is also performed off-chip in a micro-centrifuge tube containing Arcis 1. It has been designed to be analogous to the step of blood sample collection in a tube containing an anticoagulant (for example, EDTA). Thus, it does not add any significant complexity to the proposed test workflow despite the manual lysis step.
Conclusion
A handheld malaria testing device capable of running four parallel reactions was developed and validated using contrived whole blood samples. The automated reagent-based sample preparation and the real-time LAMP reaction have been seamlessly integrated into a single-use continuous-flow microfluidic cartridge. Although the microfluidic cartridge is configured to run four identical reactions, it can be scaled up and modified to run a blood sample while comparing with internal controls (high parasitemia, medium parasitemia, and negative sample). This, along with a quantitative ability, will enable the estimation of parasite load in an infected blood sample. We report an analytical sensitivity of ~0.42 parasite/μl, apt to identify asymptomatic infected carriers. Alternatively, the microfluidic cartridge could be configured to run species-specific LAMP assays in the four reaction chambers to identify whether the sample is infected with Pf, Pv, Po, or Pm, similar to our previous work25. This portable, low-cost, sensitive, specific, and real-time LAMP PON test would prove to be very useful in remote and resource-limited settings for screening purposes toward malaria elimination. Some modification to the microfluidic cartridge seems necessary to make the test truly fit for PON applications. The lysis process of combining whole blood with Arcis 1 could be moved to the cartridge for ‘sample in’ – ‘answer-out’ analysis. Although our platform promises more sensitive screening than antigen tests, rigorous testing with clinical samples is needed before on-field deployment.
Methods
Instrument design and fabrication
The instrument comprises 3D-printed structural parts, a machined aluminum heating block, a piezo pump, electronics such as Arduino Nano (MCU), excitation LEDs, and color sensors for fluorescence detection. 3D printed structural parts, and the machined aluminum heating block were designed in Solidworks CAD software. 3D printed structural parts were fabricated using MakerBot MethodX 3D printer (Brooklyn, NY) with MakerBot ABS (acrylonitrile butadiene styrene) material. The thermal module uses four two-ohm power resistors (MP725–2.00) mounted on the aluminum heating block using a thermally conductive adhesive paste (Arctic Alumina), and an MC65F103A 10 k-ohm thermistor (Amphenol Thermometrics, St. Mary’s, PA) mounted in a small recess in the heating block. PCBs were designed in AutoDesk Eagle CAD software and fabricated by OSH Park LLC (Lake Oswego, OR). The optical module PCB consists of four blue excitation LEDs (04R6674, Cree LED) purchased from Adafruit Industries (New York, NY) and four color sensors (TCS 34725, AMS AG, Premstaetten, Austria) purchased from DigiKey.com. The main body houses the thermal, optical, and pumping modules, while the motherboard PCB is mounted on the bottom of the enclosure.
Microfluidic cartridge fabrication
The microfluidic cartridge consists of five PMMA layers of varying thicknesses and is designed in AutoDesk AutoCAD software. The Top, Metering, and Bottom layers are 1 mm thick, the Microchannel layer is 3.17 mm thick, and the Reservoir layer is 5.65 mm thick. A pressure-sensitive adhesive (PSA) tape from 3M was applied to each PMMA sheet, and then structures were patterned using a VLS3.60DT CO2 Laser cutter (Universal Laser Systems, Scottsdale, AZ). All layers are aligned by inserting dowel pins into alignment holes designed on all four corners of the PMMA layers and assembled by pressing them together.
Human whole blood
Single donor human whole blood with K2 EDTA anticoagulant (Lot#: HMN696957) was purchased from Innovative Research. It was collected at an FDA-approved collection center, tested for standard FDA-required viral markers, and found negative for HBsAg, HCV, HIV-1, HIV-2, HIV-1Ag or HIV-1 NAT, ALT, West Nile Virus NAT, Zika NAT, and syphilis using FDA-approved methods by the vendor.
qPCR assay
As shown in Supplementary Tables S1 and S2, we used PrimeTime Gene Expression Master Mix (1X), 0.3 μM forward and reverse primers along with 0.2 μM probe with Express PrimeTime 5’ HEX™ as a reporter and /ZEN™/3’ IBFQ as a dual quencher, and 1 μl sample in a 25 μl reaction. The primer and probe design was adapted from43 and manufactured by IDT, Coralville, USA. The reaction steps included heating at 95 °C for three minutes to activate the polymerase, followed by 55 cycles of heating to 95 °C for 15 sec and cooling down to 60 °C for one minute, as per the PCR master mix’s manufacturer (Supplementary Table S3). To mimic an infected blood sample, 9 μl of negative whole blood was spiked with 1 μl of Pf gDNA (3D7 stage, stock concentration 50 ng/μl. Nine such blood samples were prepared by serially diluting the gDNA 2-fold. Each blood sample was subjected to DNA extraction by incubating it with 30 μl of Arcis reagent 1 for one minute and then mixing 20 μl of the resulting lysate with 20 μl of Arcis reagent 2. A non-spiked blood sample was also prepared in the same manner. One μl of this mixture was used in the final PCR amplification analysis. Triplicates of each blood sample and serially diluted purified gDNA were subjected to PCR on the same 96-well plate in a BioRad CFX96 benchtop thermal cycler.
LAMP assay
Refer to Supplementary Tables S4 and S5 for the LAMP reaction mix, which consists of isothermal buffer (20 mM Tris-HCl, 10 mM (NH4)2SO4, 50 mM KCl, two mM MgSO4, 0.1% Tween 20, pH 8.8), Pf-specific primer set (5 pmol F3 and B3, 40 pmol FIP and BIP, 20 pmol LF and LB) manufactured by IDT, MgSO4, calcein, MnCl2, deoxyribonucleotide triphosphates (dNTPs), Bst 2.0 DNA polymerase, DNA template, and PCR grade H2O. The LAMP assay was performed at a constant temperature of ~64°C. The primer set was first reported by44 and used in our previous studies25, 45.
Data processing to generate uniform curves and identify the time to positive
As explained in the Results and Discussion, raw data collected from the color sensors must be processed to generate uniform amplification curves since excitation signals may be inherently different. The raw data as collected is shown in Supplementary Figure S4a. Step 1 is scaling the amplification signals of the 2nd, 3rd, and 4th chambers to the 1st chamber signal as reference (Supplementary Figure S4b). It must be noted that the values collected over the first five minutes have been ignored since the temperature of the LAMP reaction chamber contents is rising over this period. Step 2 is subtracting the background signal acquired within the first five minutes from every subsequent value (Supplementary Figure S4c). This approach is similar to our previous work46. Although a receiver operating characteristic (ROC) curve must be plotted to statistically determine a threshold to classify an amplification curve as positive or negative, a quick evaluation warrants setting a threshold of 50 RFU for testing blood samples. The times to positive are obtained when the amplification curves intersect/ cross the 50 RFU threshold line.
Supplementary Material
Acknowledgments
This work was partially supported by the Defense Threat Reduction Agency (CWMD 1907), National Science Foundation (1902503, 1912410), and the National Institute of Health (R61AI147419). Any opinions, findings, conclusions, or recommendations expressed in this work are those of the authors and do not necessarily reflect the views of the DTRA, National Science Foundation, and National Institutes of Health.
Footnotes
The supporting information includes the instrument’s system diagram, an estimation of the power consumption per test, the methodology used for data processing and multiple tables detailing the LAMP and PCR primer sets, the recipe for LAMP and PCR master mixes, and the bill of materials for the instrument development. A supplementary video depicting the pressure-driven microfluidic sample preparation of a whole blood sample is also submitted.
Declarations of interests
The authors declare that they have no known competing financial interests or personal relationships that could have appeared to influence the work reported in this paper.
References
- (1).World Health Organization. World malaria report 2020: 20 years of global progress and challenges; World Health Organization, 2020. [Google Scholar]
- (2).Crompton PD; Pierce SK; Miller LH Advances and challenges in malaria vaccine development. The Journal of Clinical Investigation 2010, 120 (12), 4168–4178. [DOI] [PMC free article] [PubMed] [Google Scholar]
- (3).Edwin GT; Korsik M; Todd MH The past, present and future of anti-malarial medicines. Malaria journal 2019, 18 (1), 1–21. [DOI] [PMC free article] [PubMed] [Google Scholar]
- (4).Wu L; van den Hoogen LL; Slater H; Walker PGT; Ghani AC; Drakeley CJ; Okell LC Comparison of diagnostics for the detection of asymptomatic Plasmodium falciparum infections to inform control and elimination strategies. Nature 2015, 528 (7580), S86–S93. [DOI] [PubMed] [Google Scholar]
- (5).Galatas B; Mayor A; Gupta H; Balanza N; Jang IK; Nhamussua L; Simone W; Cisteró P; Chidimatembue A; Munguambe H Field performance of ultrasensitive and conventional malaria rapid diagnostic tests in southern Mozambique. Malaria journal 2020, 19 (1), 1–15. [DOI] [PMC free article] [PubMed] [Google Scholar]
- (6).Zephyr Biomedicals. FalciVax - Rapid test for Malaria. 2021. www.tulipgroup.com/Zephyr_New/html/product_specs/1_falcivax_B.htm (accessed April 20, 2022).
- (7).Swarthout TD; Counihan H; Senga RKK; Van den Broek I Paracheck-Pf accuracy and recently treated Plasmodium falciparum infections: is there a risk of over-diagnosis? Malaria journal 2007, 6 (1), 1–6. [DOI] [PMC free article] [PubMed] [Google Scholar]
- (8).Lee J-H; Jang JW; Cho CH; Kim JY; Han ET; Yun SG; Lim CS; Loeffelholz MJ False-Positive Results for Rapid Diagnostic Tests for Malaria in Patients with Rheumatoid Factor. Journal of Clinical Microbiology 2014, 52 (10), 3784–3787. [DOI] [PMC free article] [PubMed] [Google Scholar]
- (9).Gatton ML; Chaudhry A; Glenn J; Wilson S; Ah Y; Kong A; Ord RL; Rees-Channer RR; Chiodini P; Incardona S; et al. Impact of Plasmodium falciparum gene deletions on malaria rapid diagnostic test performance. Malaria Journal 2020, 19 (1), 392. [DOI] [PMC free article] [PubMed] [Google Scholar]
- (10).Feleke SM; Reichert EN; Mohammed H; Brhane BG; Mekete K; Mamo H; Petros B; Solomon H; Abate E; Hennelly C; et al. Plasmodium falciparum is evolving to escape malaria rapid diagnostic tests in Ethiopia. Nature Microbiology 2021, 6 (10), 1289–1299. [DOI] [PMC free article] [PubMed] [Google Scholar]
- (11).Joanny F; Löhr SJ; Engleitner T; Lell B; Mordmüller B Limit of blank and limit of detection of Plasmodium falciparum thick blood smear microscopy in a routine setting in Central Africa. Malaria journal 2014, 13 (1), 1–7. [DOI] [PMC free article] [PubMed] [Google Scholar]
- (12).Centers for Disease Control and Prevention, Malaria Diagnostic Tests. 2020. https://www.cdc.gov/malaria/diagnosis_treatment/diagnostic_tools.html#tabs-1-1 (accessed November 18, 2022).
- (13).Berzosa P; de Lucio A; Romay-Barja M; Herrador Z; González V; García L; Fernández-Martínez A; Santana-Morales M; Ncogo P; Valladares B; et al. Comparison of three diagnostic methods (microscopy, RDT, and PCR) for the detection of malaria parasites in representative samples from Equatorial Guinea. Malaria Journal 2018, 17 (1), 333. [DOI] [PMC free article] [PubMed] [Google Scholar]
- (14).Ugah UI; Alo MN; Owolabi JO; Okata-Nwali OD; Ekejindu IM; Ibeh N; Elom MO Evaluation of the utility value of three diagnostic methods in the detection of malaria parasites in endemic area. Malaria Journal 2017, 16 (1), 189. [DOI] [PMC free article] [PubMed] [Google Scholar]
- (15).Cordray MS; Richards-Kortum RR Emerging nucleic acid-based tests for point-of-care detection of malaria. The American journal of tropical medicine and hygiene 2012, 87 (2), 223–230. [DOI] [PMC free article] [PubMed] [Google Scholar]
- (16).Snounou G; Viriyakosol S; Jarra W; Thaithong S; Brown KN Identification of the four human malaria parasite species in field samples by the polymerase chain reaction and detection of a high prevalence of mixed infections. Molecular and Biochemical Parasitology 1993, 58 (2), 283292. [DOI] [PubMed] [Google Scholar]
- (17).Snounou G; Viriyakosol S; Xin Ping Z; Jarra W; Pinheiro L; do Rosario VE; Thaithong S; Brown KN High sensitivity of detection of human malaria parasites by the use of nested polymerase chain reaction. Molecular and Biochemical Parasitology 1993, 61 (2), 315–320. [DOI] [PubMed] [Google Scholar]
- (18).Rougemont M; Saanen MV; Sahli R; Hinrikson HP; Bille J; Jaton K Detection of Four Plasmodium Species in Blood from Humans by 18S rRNA Gene Subunit-Based and Species-Specific Real-Time PCR Assays. Journal of Clinical Microbiology 2004, 42 (12), 5636–5643. [DOI] [PMC free article] [PubMed] [Google Scholar]
- (19).Lucchi NW; Demas A; Narayanan J; Sumari D; Kabanywanyi A; Kachur SP; Barnwell JW; Udhayakumar V Real-time fluorescence loop mediated isothermal amplification for the diagnosis of malaria. PloS one 2010, 5 (10), e13733. [DOI] [PMC free article] [PubMed] [Google Scholar]
- (20).Surabattula R; Vejandla MP; Mallepaddi PC; Faulstich K; Polavarapu R Simple, rapid, inexpensive platform for the diagnosis of malaria by loop mediated isothermal amplification (LAMP). Experimental Parasitology 2013, 134 (3), 333–340. [DOI] [PMC free article] [PubMed] [Google Scholar]
- (21).Hopkins H; González IJ; Polley SD; Angutoko P; Ategeka J; Asiimwe C; Agaba B; Kyabayinze DJ; Sutherland CJ; Perkins MD; et al. Highly Sensitive Detection of Malaria Parasitemia in a Malaria-Endemic Setting: Performance of a New Loop-Mediated Isothermal Amplification Kit in a Remote Clinic in Uganda. The Journal of Infectious Diseases 2013, 208 (4), 645–652. [DOI] [PMC free article] [PubMed] [Google Scholar]
- (22).Mohon AN; Lee LD-Y; Bayih AG; Folefoc A; Guelig D; Burton RA; LaBarre P; Chan W; Meatherall B; Pillai DR NINA-LAMP compared to microscopy, RDT, and nested PCR for the detection of imported malaria. Diagnostic Microbiology and Infectious Disease 2016, 85 (2), 149–153. [DOI] [PMC free article] [PubMed] [Google Scholar]
- (23).Lucchi NW; Gaye M; Diallo MA; Goldman IF; Ljolje D; Deme AB; Badiane A; Ndiaye YD; Barnwell JW; Udhayakumar V Evaluation of the illumigene malaria LAMP: a robust molecular diagnostic tool for malaria parasites. Scientific reports 2016, 6 (1), 1–8. [DOI] [PMC free article] [PubMed] [Google Scholar]
- (24).Rypien C; Chow B; Chan WW; Church DL; Pillai DR; Gilligan P Detection of Plasmodium Infection by the illumigene Malaria Assay Compared to Reference Microscopy and Real-Time PCR. Journal of Clinical Microbiology 2017, 55 (10), 3037–3045. [DOI] [PMC free article] [PubMed] [Google Scholar]
- (25).Choi G; Prince T; Miao J; Cui L; Guan W Sample-to-answer palm-sized nucleic acid testing device towards low-cost malaria mass screening. Biosensors and Bioelectronics 2018, 115, 83–90. [DOI] [PMC free article] [PubMed] [Google Scholar]
- (26).Xu G; Nolder D; Reboud J; Oguike MC; van Schalkwyk DA; Sutherland CJ; Cooper JM Paper-Origami-Based Multiplexed Malaria Diagnostics from Whole Blood. Angewandte Chemie International Edition 2016, 55 (49), 15250–15253. [DOI] [PMC free article] [PubMed] [Google Scholar]
- (27).Chiu DT; deMello AJ; Di Carlo D; Doyle PS; Hansen C; Maceiczyk RM; Wootton RCR Small but Perfectly Formed? Successes, Challenges, and Opportunities for Microfluidics in the Chemical and Biological Sciences. Chem 2017, 2 (2), 201–223. [Google Scholar]
- (28).Liu T; Choi G; Tang Z; Kshirsagar A; Politza AJ; Guan W Fingerpick Blood-Based Nucleic Acid Testing on A USB Interfaced Device towards HIV self-testing. Biosensors and Bioelectronics 2022, 114255. [DOI] [PMC free article] [PubMed] [Google Scholar]
- (29).Shi R; Lewis RS; Panthee DR Filter paper-based spin column method for cost-efficient DNA or RNA purification. Plos one 2018, 13 (12), e0203011. [DOI] [PMC free article] [PubMed] [Google Scholar]
- (30).Poh J-J; Gan Samuel K.-E. Comparison of customized spin-column and salt-precipitation finger-prick blood DNA extraction. Bioscience Reports 2014, 34 (5). [DOI] [PMC free article] [PubMed] [Google Scholar]
- (31).Vincent JP; Komaki-Yasuda K; Iwagami M; Kawai S; Kano S Combination of PURE-DNA extraction and LAMP-DNA amplification methods for accurate malaria diagnosis on dried blood spots. Malaria journal 2018, 17 (1), 373–373. [DOI] [PMC free article] [PubMed] [Google Scholar]
- (32).Mens PF; de Bes HM; Sondo P; Laochan N; Keereecharoen L; van Amerongen A; Flint J; Sak JRS; Proux S; Tinto H; et al. Direct Blood PCR in Combination with Nucleic Acid Lateral Flow Immunoassay for Detection of Plasmodium Species in Settings Where Malaria Is Endemic. Journal of Clinical Microbiology 2012, 50 (11), 3520–3525. [DOI] [PMC free article] [PubMed] [Google Scholar]
- (33).Sidstedt M; Hedman J; Romsos EL; Waitara L; Wadsö L; Steffen CR; Vallone PM; Rådström P Inhibition mechanisms of hemoglobin, immunoglobulin G, and whole blood in digital and real-time PCR. Analytical and Bioanalytical Chemistry 2018, 410 (10), 2569–2583. [DOI] [PMC free article] [PubMed] [Google Scholar]
- (34).Shin JH Nucleic Acid Extraction and Enrichment. In Advanced Techniques in Diagnostic Microbiology: Volume 1: Techniques, Tang Y-W, Stratton CW Eds.; Springer International Publishing, 2018; pp 273–292. [Google Scholar]
- (35).Yin J; Suo Y; Zou Z; Sun J; Zhang S; Wang B; Xu Y; Darland D; Zhao JX; Mu Y Integrated microfluidic systems with sample preparation and nucleic acid amplification. Lab on a Chip 2019, 19 (17), 2769–2785, 10.1039/C9LC00389D. [DOI] [PMC free article] [PubMed] [Google Scholar]
- (36).Schrader C; Schielke A; Ellerbroek L; Johne R PCR inhibitors – occurrence, properties and removal. Journal of Applied Microbiology 2012, 113 (5), 1014–1026. [DOI] [PubMed] [Google Scholar]
- (37).Dineva MA; Mahilum-Tapay L; Lee H Sample preparation: a challenge in the development of point-of-care nucleic acid-based assays for resource-limited settings. The Analyst 2007, 132 (12), 1193–1199. [DOI] [PubMed] [Google Scholar]
- (38).Lee CY; Chang CL; Wang YN; Fu LM Microfluidic mixing: a review. Int J Mol Sci 2011, 12 (5), 3263–3287. [DOI] [PMC free article] [PubMed] [Google Scholar]
- (39).Gao L; McCarthy TJ Contact angle hysteresis explained. Langmuir 2006, 22 (14), 6234–6237. [DOI] [PubMed] [Google Scholar]
- (40).Clark J; Kaufman M; Fodor PS Mixing Enhancement in Serpentine Micromixers with a Non-Rectangular Cross-Section. Micromachines 2018, 9 (3), 107. [DOI] [PMC free article] [PubMed] [Google Scholar]
- (41).Modak SS; Barber CA; Geva E; Abrams WR; Malamud D; Ongagna YSY Rapid Point-of-Care Isothermal Amplification Assay for the Detection of Malaria without Nucleic Acid Purification. Infectious diseases 2016, 9, 1–9. [DOI] [PMC free article] [PubMed] [Google Scholar]
- (42).Hardinge P; Murray JAH Full Dynamic Range Quantification using Loop-mediated Amplification (LAMP) by Combining Analysis of Amplification Timing and Variance between Replicates at Low Copy Number. Scientific Reports 2020, 10 (1), 916. [DOI] [PMC free article] [PubMed] [Google Scholar]
- (43).Perandin F; Manca N; Calderaro A; Piccolo G; Galati L; Ricci L; Medici M; Arcangeletti M; Snounou G; Dettori G Development of a real-time PCR assay for detection of Plasmodium falciparum, Plasmodium vivax, and Plasmodium ovale for routine clinical diagnosis. Journal of Clinical Microbiology 2004, 42 (3), 1214–1219. [DOI] [PMC free article] [PubMed] [Google Scholar]
- (44).Polley SD; Mori Y; Watson J; Perkins MD; González IJ; Notomi T; Chiodini PL; Sutherland CJ Mitochondrial DNA targets increase sensitivity of malaria detection using loop-mediated isothermal amplification. Journal of Clinical Microbiology 2010, 48 (8), 2866–2871. [DOI] [PMC free article] [PubMed] [Google Scholar]
- (45).Choi G; Song D; Shrestha S; Miao J; Cui L; Guan W A field-deployable mobile molecular diagnostic system for malaria at the point of need. Lab on a Chip 2016, 16 (22), 4341–4349, 10.1039/C6LC01078D. [DOI] [PMC free article] [PubMed] [Google Scholar]
- (46).He X; Tang Z; Liang S; Liu M; Guan W Confocal scanning photoluminescence for mapping electron and photon beam-induced microscopic changes in SiNx during nanopore fabrication. Nanotechnology 2020, 31 (395202), 11pp. [DOI] [PubMed] [Google Scholar]
Associated Data
This section collects any data citations, data availability statements, or supplementary materials included in this article.