Abstract

The conventional quality control techniques for identifying the denaturation of biopharmaceuticals includes sodium dodecyl sulfate-polyacrylamide gel electrophoresis for identifying fragmentation, ion exchange chromatography and isoelectric focusing for identifying deamidation, reverse-phase high-performance liquid chromatography (HPLC) for identifying oxidation, and size-exclusion HPLC for identifying aggregation. These stability assessments require essential processes that are destructive to the product tested. All these techniques are lab based and require sample removal from a sealed storage vial, which can breach the sterility. In this work, we investigate the heat- and surfactant-induced denaturation of an in-vial-stored model protein, bovine serum albumin (BSA), by analyzing its intrinsic fluorescence without removing the sample from the vial. A lab-based bespoke setup which can do the measurement in vial is used to demonstrate the change in fluorescence polarization of the protein to determine the denaturation level. The results obtained are compared to circular dichroism and size-exclusion HPLC measurements. The results prove that in-vial fluorescence measurements can be performed to monitor protein denaturation. A cost-effective portable solution to provide a top-level overview of biopharmaceutical product stability from manufacture to the point of patient administration can be further developed using the same technique.
1. Introduction
Most biopharmaceutical products, particularly vaccines, still rely on refrigeration or freezing for storage and transport to maintain stability. Due to poor conditions in some countries, maintaining the cold chain has become difficult, especially after COVID-19.1−3 Instances of disruption could be undetectable, leading to deleterious effects such as immunogenic reactions or inefficacy upon administration due to protein instability.4 Therefore, an essential part of the cold chain supply process is to establish the protein structure and stability state. As degradation can follow multiple pathways, often concurrently, a combination of lab-based techniques are employed to assess the different aspects of protein stability.
Techniques employed for detecting denaturation include sodium dodecyl sulfate-polyacrylamide gel electrophoresis for fragmentation, ion exchange chromatography, isoelectric focusing, reverse-phase high-performance liquid chromatography (HPLC) for chemical degradation, and size-exclusion HPLC for aggregation.5 These require the removal of the sample from its vial. Regulatory authorities have stringent requirements on sample removal from storage vials since it may breach the parental drug sterility.6−8 In addition, the limitation of techniques currently used for assessing protein stability requires sample manipulation, such as dilution into a suitable concentration range or exposure to chromatography phases. These manipulations can alter the conformational state of the protein samples.9 A closed vial measurement would allow the measurement of the protein conformational status and denaturation levels without breaking the seal or changing the local environment. Such a technique could provide biopharmaceutical stability data from a manufacturer to a patient along the product journey. An ideal technique would perform non-destructive product analysis and be portable and easy to use in underdeveloped countries with high clinical needs. One possible solution to developing such a technique to monitor a sample’s degradation would be to use a sensitive technique such as intrinsic fluorescence polarization.
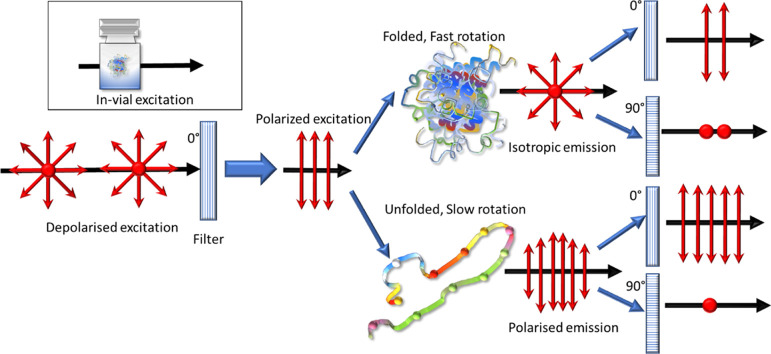
Fluorescence polarization happens when a molecule excited by linearly polarized light emits light, preserving the polarization direction.10−13 If linearly polarized light is used to excite the molecule, it will preferentially select molecules with an absorption transition moment parallel to the direction of light polarization (Figure 1). The light thus emitted by each molecule has its polarization in a plane parallel to that of the absorption transition moment. It has been well established that this tendency can be used to measure structural changes in large molecules.12,14,15 If the measurements are done in solution, the molecules probed are free to rotate. Hence, the polarization of the emitted light depends on the fluorescence lifetime of the molecule and its extent of rotation in the solution. The molecule’s rotation depends on the solution viscosity, absolute temperature, molecular volume, and gas constant. If the viscosity and temperature of the solution are constant, then the molecular volume is the critical variable determining the rotational speed difference. Hence, if polarization is monitored, the kinetics of proteins which involve a volume change, such as protein folding and unfolding, can be monitored in real time. Typically, the anisotropy is measured using a fluorophore as a label, such as laser dyes (fluorescein or rhodamine), by linking them to peptides or nucleic acids. Intrinsic fluorescence allows measurement without needing fluorescent labeling or modifying the protein structure.
Figure 1.
Principle of intrinsic fluorescence polarization: a significant difference in the total intensity is detected between the orthogonal polarization directions if the luminescence emitted from the molecule retains the polarization.
Utilizing intrinsic fluorescence anisotropy of fluorophores like tryptophan enables a broader view of protein stability to understand the conformational structure of a protein in solution. Intrinsic fluorescence has been used to study protein denaturation16 for open lab samples. Single-molecule Förster resonance energy transfer (smFRET) and fluorescence correlation spectroscopy (FCS) have been used before to understand the denaturation level but not for in-vial formulations.17 The unavailability of suitable excitation sources that are transparent to commonly used vials and can invoke intrinsic fluorescence has also prevented in-vial measurements until recently.18
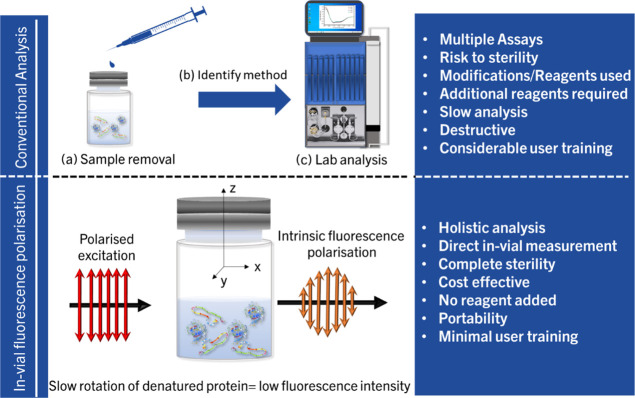
The study mentioned in this article aims to investigate intrinsic fluorescence polarization as a method for developing handheld devices that can quantify the denaturation/unfolding of in-vial protein formulations (Figure 2). The authors have attempted in-vial measurements for identifying accurate protein reconstitution times before,18 using the excitation at the absorption tail of bovine serum albumin (BSA) at 365 nm. The same excitation wavelength can be used to develop a fluorescence polarization setup to identify the denaturation level in a closed vial. The emission of BSA at 460 nm upon excitation at 365 nm has not been extensively studied and has not been used for applications dealing with fluorescence polarization before. The setup can be further developed into a handheld system that can judge the level of denaturation among a group of samples by just switching the sample, which would form the commercial aspect of the work. The setup is a modified version of the one in the authors’ previous work,18 with polarization elements attached. Samples of solutions of a model protein, BSA, with different denaturation levels are measured with the setup and compared with circular dichroism measurements. Since size changes caused by aggregation can also bring slower rotation and thus an increase in anisotropy, it is also essential to check if the contribution from aggregation can be understood using the same technique.
Figure 2.
Schematic comparison of in-vial UV excited intrinsic fluorescence polarization to traditional lab-based methods. For conventional methods, sample removal is a must, and an ideal method should be developed and identified; in addition, lab downtime should be considered to identify if the vial is denatured. The exact process is to be repeated for multiple vials. If in-vial direct measurements are employed, this downtime can be reduced to a minimum.
Hence, two sets of samples were used in the study: (1) one set prepared by inducing stress by varying temperatures (and varying aggregation) and (2) a second set (with low or no aggregation) prepared by diluting the protein samples with a surfactant (SDS driven). The first set of samples will have contributions from agglomerated and unfolded molecules, while the second one will solely have variations originating due to unfolding. Recent advances in biopharmaceuticals have led to an increase in the ubiquity of high-concentration protein formulations. A recent publication by Gervasi et al.19 outlines the current state of monoclonal antibody (Mab) parenteral formulations on the market. According to the metanalysis, 50% of the market’s Mab parenteral formulations are formulated at 50–200 mg/mL concentrations. The high protein concentrations allow sub-cutaneous administration and thereby reduce the required volumes. Hence, this study investigated a high protein concentration of 100 mg/mL.
2. Materials
All raw materials were obtained from Sigma-Aldrich, Ireland. BSA stock solutions (20% w/v) were prepared using sodium phosphate buffer (pH 7.2) and 40 mM NaCl and were filtered under aseptic conditions using 0.2 μm syringe filters. After the preparation of each sample, the pH was measured and was ensured to have a constant pH of 7.2. A single stock was used to prepare all formulations for each experiment. Samples were individually diluted with sodium phosphate buffer to reach 100 mg/mL protein concentration. A final volume of 2 mL was aliquoted into 10 mL glass vials (FIOLAX Clear neutral glass Type I Class B, Schott, Germany) under aseptic conditions. Vials were fully stoppered and crimped (20 mm gray stoppers, Adelphi Healthcare Packaging, UK). Samples were placed on a rocking platform for 30 min before any measurement to ensure homogeneity.
3. Methods
3.1. Protein Degradation Methods
The methods below were used to induce instabilities in the protein solution.
3.1.1. Temperature-Driven Aggregation
The samples were incubated at 75 °C for varying periods (1, 2, and 4 h) to induce aggregation. The incubation time was selected based on previous experiments to maximize aggregation while minimizing unfolding and destruction of the protein. The numbers and labels of the samples studied are shown in Table 1. After incubation, samples were air-cooled and stored at 6 °C before analysis. The final solutions were not filtered.
Table 1. Temperature-Driven Aggregation Samples Used in the Studya.
| sample | temperature (°C) | BSA concentration (mg/mL) | incubation time (h) | number of samples |
|---|---|---|---|---|
| BSA ref | NA | 100 | 0 | 3 × 3 |
| 1 h | 75 | 100 | 1 | 3 × 3 |
| 2 h | 75 | 100 | 2 | 3 × 3 |
| 4 h | 75 | 100 | 4 | 3 × 3 |
Each sample is measured in triplicate.
3.1.2. Surfactant-Driven Unfolding
SDS stock solution was prepared at 690 mM. The SDS stock solution was added to the protein vials during preparation and diluted with phosphate buffer to 25, 50, and 75 mM concentrations, as indicated in Table 2. Samples were incubated at 6 °C for 12 h before all measurements. The final solutions were not filtered.
Table 2. Chemically Driven Unfolding Samples Used in the Studya.
| sample | SDS concentration (mM) | BSA concentration (mg/mL) | incubation time (h) | number of samples |
|---|---|---|---|---|
| BSA ref | 0 | 100 | 12 | 3 × 3 |
| S25 | 25 | 100 | 12 | 3 × 3 |
| S50 | 50 | 100 | 12 | 3 × 3 |
| S75 | 75 | 100 | 12 | 3 × 3 |
Each sample is measured in triplicate.
3.2. Size Exclusion Chromatography
Samples were diluted 100-fold before analysis. Analysis was performed using HPLC (Agilent Technologies 1260 Infinity) equipped with a UV detector (detection wavelength 280 nm) and a BioSep-S-3000. Measurements were performed using sodium phosphate 100 mM at pH 7.2 mobile phase, at a flow rate of 1.0 mL/min. The injection volume was 100 μL, and the total run time was 15 min.
3.3. Dynamic Light Scattering
The Z-average hydrodynamic diameter, polydispersity index (PDI), was measured by dynamic light scattering (DLS) using a Zetasizer Nano ZS instrument (Malvern Instruments, Worcestershire, UK). An equilibration time of 120 s was followed by the measurements totaling 11 runs of 10 s performed in triplicate for each sample.
3.4. Circular Dichroism
Samples were diluted 100-fold (to approx. 1 mg/mL BSA) in 100 mM phosphate buffer (pH 7.2). The optical activity was measured with a Chirascan CD spectrometer (Applied Photophysics Ltd., UK) using a 0.1 mm pathlength quartz cuvette. Spectra were recorded in triplicate, and the solvent spectrum was subtracted from each. Samples were measured from 260 to 190 nm at 0.5 nm intervals and 1 nm bandwidth. All measurements were performed at room temperature (20° C). Protein conformational information was quantified using a circular dichroism neural networking (CD secondary structure analysis) software to assess the degree of unfolding.
3.5. Fluorescence Polarization Measurements
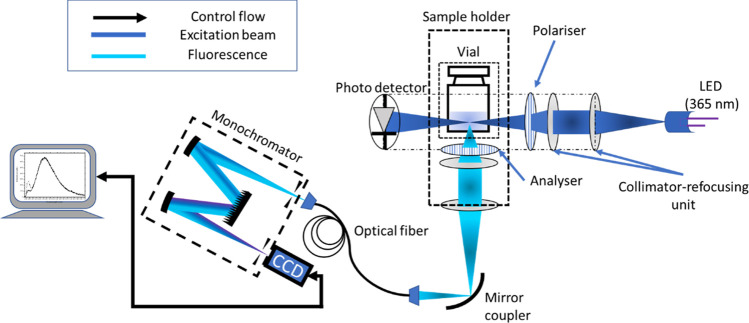
Samples were measured using a bespoke apparatus (Figure 3), with all measurements performed in vial without breaking the crimped seal. The details of the fluorescence emission used for detecting denaturation in this study can be found in the authors’ previous work (ElKassas et al.18). Additional details on the fluorescence emission, including in-vial fluorescence response and the lifetime of the emission used in the study, are given in the Supporting Information, Section S2(d). The excitation source is a diode with an emission wavelength of 365 nm, and the emission for BSA is obtained at ≈460 nm. The excitation beam passes through the sides of the vial, and the fluorescence collection is via the bottom of the vial to reduce the loss of light induced by the curvature of the vial. The fluorescence spectra were generated by keeping the initial polarizer constant at 0° polarization (polarizer in Figure 3) and the second polarizer (shown as an analyzer in Figure 3) in two orthogonal polarization directions (0 and 90° polarization directions). It must be noted that the collection plane is perpendicular to the excitation plane; hence, the polarizer and analyzer are orthogonal to each other. This would mean that the analyzer on the collection side is to be kept at 90° to the angle of the polarizer for them to have similar polarization directions. Hereafter, the configuration with the polarizer at 0° and analyzer at 90° is considered the horizontal polarization direction on the detection side, and the other configuration (polarizer and analyzer at 0° polarization directions) is the vertical polarization direction. A description of the optical geometry of the setup is explained in the Supporting Information, Section S1(b).
Figure 3.
Simple schematic of the bespoke setup used for measurement: light from the 365 nm UV LED is focused onto the sample via a collimator-refocusing unit. The light passing through the polarizer produces fluorescence isotropically, and the fluorescence is detected via the bottom of the vial through an analyzer. The light collected is fed to the spectrometer via a fiber.
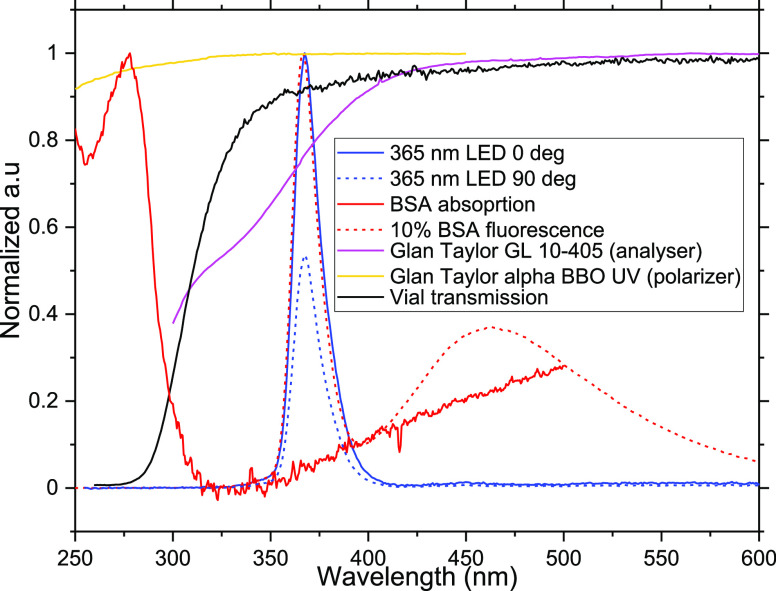
The polarizers are chosen according to their transmission in the UV range. A Glan-Laser alpha-BBO polarizer with the maximum transmission between 210 and 450 nm (GLB10-UV, Thorlabs, MgF2 SLAR coating) was used. Another Glan-Laser alpha-BBO polarizer with the maximum transmission at 405 nm (GLB10-405, Thorlabs) was used as an analyzer on the collection side. The fluorescence was collected using an Ocean Insight QE pro spectrometer via an optical fiber (UM 22-600 custom patch cable, Thorlabs). Following the collection of the spectra, the difference between the area under the curve for each spectrum and its oppositely polarized partner was calculated. The polarizer transmission spectra, the vial transmission spectrum, and the absorption spectrum of BSA are shown in Figure 4. The reference measurement of an empty vial in horizontal and vertical polarization directions is also shown. The fluorescence obtained from 10% BSA solution in water is also included as a reference.
Figure 4.
Transmission spectra of the closed quartz vial, polarizer, analyzer, and the emission spectrum of the source LED at 365. The LED spectra in orthogonal polarization directions shown are obtained using the setup by measuring the empty vial and recording the corresponding reflection and Rayleigh scattering. The absorption spectra and emission spectra upon excitation at 365 nm for BSA are also indicated in dotted lines. All spectra are normalized or scaled to enable a comparison between them. Further details are provided in the Supporting Information, Section S1(a), regarding the choice of excitation wavelength.
The minute changes in the curvature of the vial bottom can bring changes in reflection and hence changes in the transmitted polarized light intensity. But for most of the sample vial types attempted, the change in fluorescence transmission through the bottom of the vial proved minimal. If the vial glass type used has low transmission in the UV (e.g., amber glass vials), the LED output power has to be increased within the UV denaturation limit (refer to the Supporting Information, Section S1(c) for UV denaturation limit) to get a sufficient signal-to-noise ratio (SNR). All the measurements are done with the empty vial transmission spectra as a reference. Hence, any possible changes occurring due to the shape, size, or type of the vials are already accounted for when the data is processed.
The other possible LED sources that can be used in the UV are shown in the Supporting Information, Section S1(a), explaining the choice of excitation wavelength. Lower laser drive currents in the range of 30–40 mA were used in the study to eliminate any possible non-linear behavior from the closed vial. The vial transmission at 365 nm for different power for diode drive currents is shown in the Supporting Information, Section S1(c). Exposure to deep UV radiation can induce denaturation in proteins; hence, the denaturant effect of the UV-LED excitation source was also characterized for the same power levels using a standard photodiode power sensor (Thorlabs S120 VC). The characterization proved that minimal effect is produced upon UV exposure for the power levels used in the study. The details of the characterization are also provided in the Supporting Information, Section S1(c). The degree of anisotropy resulting from the depolarization of the emitted light is described by fluorescence anisotropy, r, and is given by eq 1
| 1 |
where I∥ is the emission intensity in the direction of polarization of the excitation light, and I⊥ is the emission intensity in a perpendicular direction. ΔF is the difference in fluorescence intensities in orthogonal directions. The denominator is proportional to the total intensity and is used for normalization.
4. Results and Discussion
The experiments were designed to demonstrate the capability of our in-vial intrinsic fluorescence polarization setup as a standard analytical technique for protein stability analysis. Variations in the fluorescence of replicate samples can result from slight variations in individual compositions or pH. Considering this variability, the shift in fluorescence for the individual samples used in the study was characterized and was found to be minimal. Still, this factor is accounted for, and the area under the curve is considered a measure of fluorescence intensities rather than the intensity value at the emission maximum. A comparison between the fluorescence spectra of individual samples is given in the Supporting Information, Section S2(a), to demonstrate the minimal shift in fluorescence. The in-vial fluorescence response with an increase in concentration is also included.
4.1. Thermally Stressed Samples
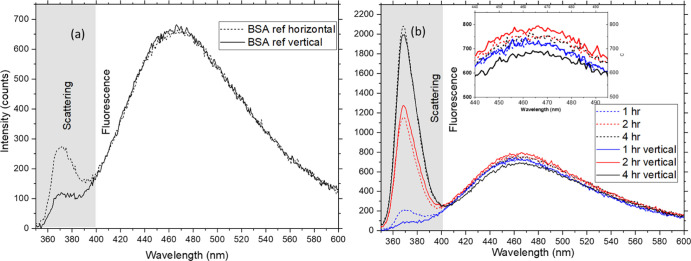
Figure 5 shows the raw data fluorescence spectra of thermally stressed samples at 100 mg/mL concentration of BSA mentioned in Table 1. Only one set of samples is shown in the plot for ease of demonstration. Figure 5a shows the reference measurement for the same concentration as the denatured samples. If the samples had the same denaturation level, then the emission intensities in horizontal and vertical polarizations for them would have been the same as in the case of the BSA reference sample. The spectra have two regions contributing to information: (1) the Rayleigh scattering source peak denoting agglomeration and (2) the total fluorescence intensity denoting denaturation. The scattering part is as expected as the reference scattering curves in Figure 4: the analyzer transmits only half of the Rayleigh scattered light’s intensity when placed orthogonally to the polarizer. If the molecules are small and freely rotate in solution, then the fluorescence generated is isotropic, and hence, the same intensity is detected in both polarization directions.
Figure 5.
Raw data. (a) Reference spectrum measured for the sample set 1. (b) Fluorescence spectra for orthogonal polarization directions for the thermally stressed sample set 1. The dotted lines are horizontal polarization directions, and the solid lines are vertical polarization directions. The inset shows the same intensities zoomed. All sample sets are at 100 mg/mL concentration. The samples are kept at 75 °C for periods of 1 to 4 h.
On the contrary, if a sample with the same concentration has undergone thermal denaturation (Figure 5b), the agglomeration resulting from the thermally induced stress will increase the Rayleigh scattering. The aggregation can occur through multiple mechanisms, unfolding intermediates, or linkages between protein moieties. All aggregation reactions are accelerated by excess kinetic energies imparted by the increased temperatures.20 The increase in size caused by the protein unfolding (typically between 50 and 100 nm for BSA)21 can also cause an increase in Rayleigh scattering intensity detected, but this would be significantly less compared to the contribution from agglomeration. The fluorescence detected in the vertical direction (solid line) for different denaturation levels shows a significant difference if the thermal stress induced is higher. In Figure 5b, a higher difference in fluorescence intensity is observed between the orthogonal polarization directions as the time for which the thermal stress is induced increases. All the measurements are done on triplicate samples (n = 3), and the repeatability of the results is ensured.
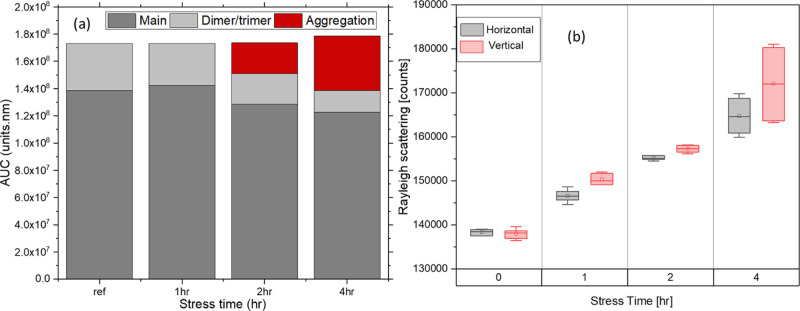
The size exclusion chromatography (SEC) results shown indicate the formation of high molecular weight aggregates at 2–4 h of thermal stress 75 °C for a 100 mg/mL BSA solution. The scattering obtained after calculating the area under the curve for both vertical and horizontal directions for all samples is shown in Figure 6. Both results follow the previously reported trends.22,23
Figure 6.
(a) SEC peak areas for 100 mg/mL BSA under different temperature-induced stress levels. Each sample is kept at 75 °C for periods of 1, 2, and 4 h. The decrease in the monomer peak area is accompanied by the appearance and increase of an aggregation peak that elutes slightly earlier than the main peak conglomerate. (b) The area under the curve for Rayleigh scattering was observed for the same samples. All the measurements are done in triplicate (n = 3).
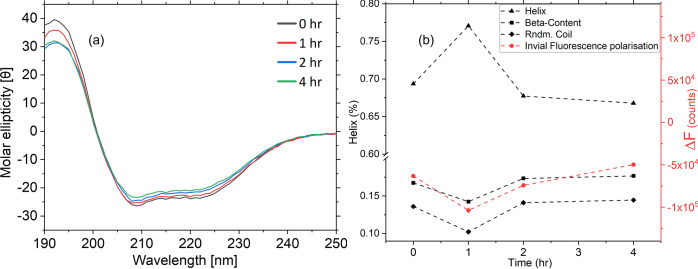
Circular dichroism measurements of the same samples confirm the observations on the fluorescence side of the spectrum (Figure 7). The CD spectra obtained after analyzing 100 mg/mL BSA samples indicate a change in molar ellipticity for all conformationally relevant peaks (222, 209, and 189 nm). This may be explained by the increase in random coil percentages in the samples.24 Secondary structure analysis shows an initial increase of alpha-helical content for samples stressed at 75 °C for 1 h. However, after 2 h, there is a recovery in alpha content with a slight increase in random coil percentages (Figure 7b).
Figure 7.
(a) Molar ellipticity values for 100 mg/mL BSA samples thermally stressed at 75 °C for 1, 2, and 4 h. (b) Comparison between CD secondary structure analysis and fluorescence analysis. Although there is a sharp spike at 1 h, the BSA structure refolds for the remaining observation period. Fluorescence measurements show a similar trend to beta-sheet content as measured using CD (n = 3 for all).
The difference in fluorescence emission intensity between the horizontal and vertical directions, ΔF = I∥ – I⊥, is proportional to the anisotropy of the sample. The emission fluorescence intensity is found by integrating the area under the curve for each fluorescence emission after normalization to the Rayleigh scattering peak. ΔF obtained is compared to the CD secondary structure analysis, and a good correlation can be observed between both. The trend in CD is a sharp decrease followed by recovery after 4 h of stress at 75 °C for the beta helix. A correlation analysis was performed for the data obtained from CD secondary structure and photoluminescence analyses. The data in Table 3 indicates a strong correlation between the photoluminescence results and both beta content and random coil values obtained via CD as well as an inverse relationship between the alpha helix content and the fluorescence area. The statistical analysis follows the literature and suggests that the beta content correlation is most likely.
Table 3. Correlation Matrix for CD Secondary Structure Analysis of Conformation Components of Thermally Stressed 100 mg/mL BSA vs the Analysis of Photoluminescence Technique Described Above.
| helix | beta-content | random coil | photoluminescence | |
|---|---|---|---|---|
| Helix | 1 | |||
| beta-content | –0.99981 | 1 | ||
| random coil | –0.99885 | 0.997723 | 1 | |
| Photoluminescence | –0.91799 | 0.916233 | 0.921403 | 1 |
4.2. Chemically Stressed Samples
Sodium dodecyl sulfate (SDS) is an anionic surfactant capable of denaturing proteins through binding interactions with specific sites. The binding process proceeds over multiple steps, with denaturation occurring after the saturation of specific binding sites. The surfactant molecules act as traditional ligands at lower molar ratios, stabilizing the structure. Due to the functional nature of BSA as a plasma transporter of amphiphilic molecules, its structure includes 12 sulfonate half-ester binding sites.25 After saturation, at higher molar ratios (above 1:12 for BSA), protein unfolding proceeds. At intermediate SDS concentrations (10–100 mM), micellar binding to protein monomer structures leads to a change in the Tryptophan environment and an apparent decline in fluorescence emission.26
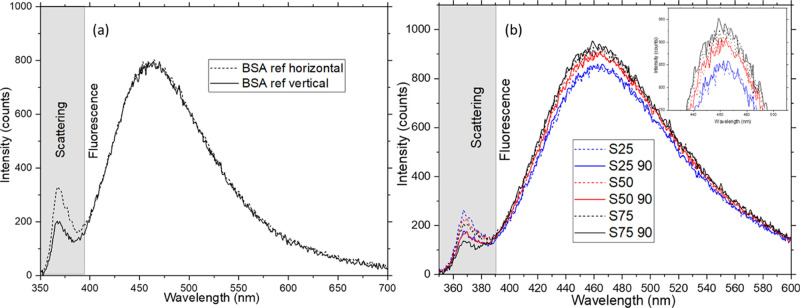
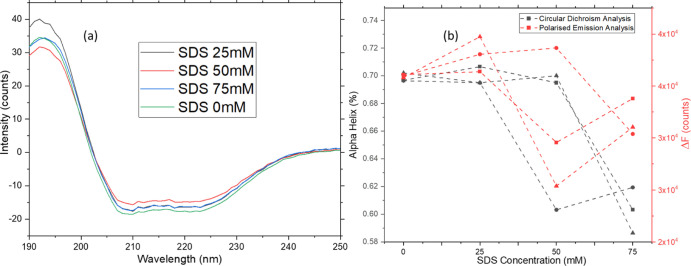
Figure 8 shows the fluorescence spectra in orthogonal polarization directions for chemically stressed samples. Spectra for only one set of samples are shown for ease of interpretation. As for the thermally stressed samples, one would expect the fluorescence emission of the reference sample to be the same in both polarization directions since the fluorescence emission is isotropic (Figure 8a). But as the concentration of the surfactant increases, the fluorescence detected in the vertical polarization direction decreases as the fluorescence preserves polarization upon slow rotation of the proteins. A significant change in emission intensities can be observed between the orthogonal polarization directions if the concentration of the surfactant is increased further (plots for surfactant concentration up to 300 mM are shown in the Supporting Information, Section S2(b)). Only lower concentrations of the surfactant (up to 75 mM of SDS) are used for the data analysis to check if the technique has enough sensitivity for comparison with CD. As can be seen in Figure 8b, differences in intensities in orthogonal directions can be observed in the raw data. Even though the change in intensity seems minimal from the raw data, it is enough for comparison with CD if the area under the curve is integrated (Figure 9). The agglomeration, in this case, seems to be minimal since the difference in intensity in scattering seems linear compared to the reference.
Figure 8.
Raw data. (a) Reference spectrum measured for the sample set 1. (b) Fluorescence spectra for orthogonal polarization directions for the chemically stressed sample set 1. The dotted lines are horizontal polarization directions, and the solid lines are vertical polarization directions. The inset shows the same intensities zoomed. All sample sets are at 100 mg/mL concentration.
Figure 9.
(a) Molar ellipticity values for 100 mg/mL BSA samples chemically stressed at 25, 50, and 100 mM SDS concentrations. (b) Comparison between CD secondary structure analysis and fluorescence: the primary structure of BSA 100 mg/mL samples obtained by CD secondary structure analysis vs the conformational changes detected by fluorescence polarization. SDS unfolding proceeds via electrostatic and hydrophobic interactions on multiple states on the protein structure, leading to various unfolded states (n = 3 for all).
Studies by Xu et al.27 indicate that a secondary structure is initially lost upon adding SDS at concentrations below the critical micellar concentrations (CMC). The electrostatic interactions caused by the amphiphilic moieties are the leading cause for unfolding. Upon reaching CMC, any further addition of SDS (up to a maximum of 20 mM SDS) does not cause additional unfolding but instead leads to the coiling of the protein in and around the micellar structure. Another study by Winogradoff et al.28 indicates that the interaction of the protein with SDS micelles takes shape in the form of a necklace-and-bead structure that alters the protein conformation. Further attachment of SDS micelles leads to global structural changes. The change in pH also bring changes in fluorescence emission, but since all the samples were ensured to have the same pH (7.2), this variable can be neglected.
All the reports above indicate many possible unfolded states upon adding SDS for concentrations above 25 mM. A large number of possible unfolded states29 make it impossible to determine the relationship between unfolding and SDS concentration quantitatively. However, CD secondary structure analysis results reveal a qualitative relationship between the protein conformational states detected on both instruments (Figure 9). The changes in structure do not occur consistently due to the numerous mechanisms and sites of attack on the protein. Since the fluorescence anisotropy induced and the difference in fluorescence detected are also a collective phenomenon, it would indicate only an increase or decrease in denaturation. This is satisfactory output for a handheld instrument that identifies if the denaturation has occurred.
4.3. Anisotropy Behavior of Thermally and Chemically Stressed Samples
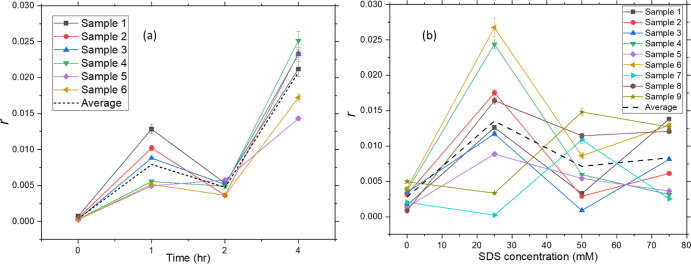
The changes in the polarization of the fluorescence due to rotational diffusion are in turn due to the rotation of the BSA molecule in general and the rotation of the chromophore (tryptophan) relative to its surroundings owing to dipole-orientational relaxation of the chromophore after excitation. The contribution from the rotation of the domain containing the tryptophan group with respect to the nearby surroundings is considered negligible.16Figure 10 shows r, the degree of polarization calculated from the intensities in orthogonal directions.
Figure 10.
Degree of anisotropy measured for (a) thermally stressed and (b) chemically stressed samples. The data shown for (a) is for 6 sample sets, and that for (b) is for 9 sample sets. The dotted black curve shows the average response from all the samples. The error bars show the variations occurring for the repetition of the measurements for individual samples.
For thermally treated samples, the r values indicate the average response from the sample’s beta- and alpha-helical content. A better match of the r value trend is with the beta content, indicative of the presence of higher beta content with time. The increase in anisotropy for chemically treated samples before their descent is much higher than that for thermally treated samples. This apparent increase in SDS-treated samples is most likely due to the unfolding intermediates causing an aggregation chain reaction, a phenomenon well discussed in the literature.27−29 The pattern of evolution of tryptophan fluorescence with increasing SDS concentration differs below and above the isoelectric point, pI, of BSA (pI = 4.9 for BSA).30,31 The samples chosen in this study are of pH above the pI value (pH = 7.5). Studies indicate that the anisotropy r for pH values higher than pI would increase to a maximum value initially, after which it drops down and reach a value after which further addition of SDS would not have an effect, indicating a complete denaturation of BSA molecules.30 The same trend can be observed for the r values obtained using the in-vial fluorescence anisotropy measurements.
5. Conclusions
The intrinsic fluorescence of a protein has been used to study the denaturation of an in-vial sample caused by two different methods: (1) thermal and (2) chemical. The method designed, discussed, and used in this research has been shown to identify key stability indicators for in-vial biopharmaceutical samples. The protein’s denaturation level can be monitored by analyzing fluorescence intensities in orthogonal polarization directions. In addition, the protein aggregation was monitored by observing the scattering effects on the spectrum. The wavelength and intensity for excitation are chosen at which both the vial and sample would have a minimal unwanted effect like non-linear behavior or UV denaturation. The results demonstrate significant differences in the measurements obtained from the reference BSA solutions after preparation and the denatured formulations.
The technique can further develop handheld devices that can provide an approach to monitoring biopharmaceutical product stability from the point of manufacture to patient administration. The technique is customisable to the user, which means that in addition to handheld systems, the same technique can be used to develop in-line systems in pharma and biopharma industrial settings for rapid, non-destructive, 100% quality control inspection of product release, thereby providing a product quality overview during stability screening.
Acknowledgments
This publication has emanated from research supported in part by a research grant from Science Foundation Ireland (SFI) and is co-funded under the European Regional Development Fund [grant numbers 12/RC/2275(P2) and 18/EPSRC-CDT/3587] and the Engineering and Physical Sciences Research Council UK [grant number EP/S023054/1]. The authors thank all the help provided by Alexander Zhdanov and Dmitri Papkovsky from the School of Biochemistry and Cell Biology, University College Cork, for the lifetime measurements done for the study.
Supporting Information Available
The Supporting Information is available free of charge at https://pubs.acs.org/doi/10.1021/acs.analchem.2c03912.
Details of the instrumentation, including the choice of wavelength, optical geometry of the setup, power characterization, and fluorescence measurement details, including all individual fluorescence spectra, the shift of fluorescence with concentration, and fluorescence lifetime (PDF)
Author Contributions
§ K.C. and K.E. contributed equally to the work.
The authors declare no competing financial interest.
Supplementary Material
References
- Tirivangani T.; Alpo B.; Kibuule D.; Gaeseb J.; Adenuga B. A. Impact of COVID-19 pandemic on pharmaceutical systems and supply chain—a phenomenological study. Explor. Res. Clin. Soc. Pharm. 2021, 2, 100037. 10.1016/j.rcsop.2021.100037. [DOI] [PMC free article] [PubMed] [Google Scholar]
- Brenner V.Causes of Supply Chain Disruptions: An Empirical Analysis in Cold Chains for Food and Pharmaceuticals, 2015, pp 21–85. [Google Scholar]
- Khan S. A. R.; Razzaq A.; Yu Z.; Shah A.; Sharif A.; Janjua L. Disruption in Food Supply Chain and Undernourishment Challenges: An Empirical Study in the Context of Asian Countries. Soc. Econ. Plann. Sci. 2022, 82, 101033. 10.1016/j.seps.2021.101033. [DOI] [Google Scholar]
- Matthias D. M.; Robertson J.; Garrison M. M.; Newland S.; Nelson C. Freezing Temperatures in the Vaccine Cold Chain: A Systematic Literature Review. Vaccine 2007, 25, 3980–3986. 10.1016/j.vaccine.2007.02.052. [DOI] [PubMed] [Google Scholar]
- Federici M. M. The Quality Control of Biotechnology Products. Biologicals 1994, 22, 151–159. 10.1006/biol.1994.1021. [DOI] [PubMed] [Google Scholar]
- Davis K.Biopharmaceutical Manufacturing: The Challenge of Global Regulatory Compliance. Pharmaceutical Technology; Advanstar Communications Inc., 2008. [Google Scholar]
- Polen T. Enhanced Packaging and Reformulations Give New Life to Biologics. Biopharm Int. 2006, 19, 60–66. [Google Scholar]
- Food and Drug Administration Compliance Program Guidance Manual; Food and Drug Administration: Rockville, MD, USA, 2005.
- Wang W.; Roberts C. J. Protein aggregation—Mechanisms, detection, and control. Int. J. Pharm. 2018, 550, 251–268. 10.1016/j.ijpharm.2018.08.043. [DOI] [PubMed] [Google Scholar]
- Lakowicz J. R.Fluorescence Anisotropy. Principles of Fluorescence Spectroscopy; Springer, 1999, pp 291–319. [Google Scholar]
- Lakowicz J. R.Principles of Fluorescence Spectroscopy; Springer, 2006. [Google Scholar]
- Mann T. L.; Krull U. J. Fluorescence Polarization Spectroscopy in Protein Analysis. Analyst 2003, 128, 313–317. 10.1039/b300873h. [DOI] [PubMed] [Google Scholar]
- Jain S.; Heiser A.; Venter A. R. Spray Desorption Collection: An Alternative to Swabbing for Pharmaceutical Cleaning Validation. Analyst 2011, 136, 1298–1301. 10.1039/c0an00728e. [DOI] [PubMed] [Google Scholar]
- Grossman S. H. Fluorescence Analysis of Denaturation and Reassembly of Dansylated Creatine Kinase. Biochim. Biophys. Acta Protein Struct. Mol. Enzymol. 1984, 785, 61–67. 10.1016/0167-4838(84)90234-6. [DOI] [PubMed] [Google Scholar]
- Poklar N.; Vesnaver G.; Lapanje S. Denaturation behavior of α-chymotrypsinogen A in urea and alkylurea solutions: Fluorescence studies. J. Protein Chem. 1994, 13, 323–331. 10.1007/BF01901565. [DOI] [PubMed] [Google Scholar]
- Vlasova I. M.; Saletsky A. M. Study of the Denaturation of Human Serum Albumin by Sodium Dodecyl Sulfate Using the Intrinsic Fluorescence of Albumin. J. Appl. Spectrosc. 2009, 76, 536–541. 10.1007/s10812-009-9227-6. [DOI] [Google Scholar]
- Chen H.; Rhoades E. Fluorescence Characterization of Denatured Proteins. Curr. Opin. Struct. Biol. 2008, 18, 516–524. 10.1016/j.sbi.2008.06.008. [DOI] [PMC free article] [PubMed] [Google Scholar]
- ElKassas K.; Chullipalliyalil K.; McAuliffe M.; Vucen S.; Crean A. Fluorescence Spectroscopy for the Determination of Reconstitution Time of an In-Vial Lyophilised Product. Int. J. Pharm. 2021, 597, 120368. 10.1016/j.ijpharm.2021.120368. [DOI] [PubMed] [Google Scholar]
- Gervasi V.; Dall Agnol R.; Cullen S.; McCoy T.; Vucen S.; Crean A. Parenteral Protein Formulations: An Overview of Approved Products within the European Union. Eur. J. Pharm. Biopharm. 2018, 131, 8–24. 10.1016/j.ejpb.2018.07.011. [DOI] [PubMed] [Google Scholar]
- Wang W.; Nema S.; Teagarden D. Protein aggregation-Pathways and influencing factors. Int. J. Pharm. 2010, 390, 89–99. 10.1016/j.ijpharm.2010.02.025. [DOI] [PubMed] [Google Scholar]
- Park J. H.; Jackman J. A.; Ferhan A. R.; Ma G. J.; Yoon B. K.; Cho N. J. Temperature-Induced Denaturation of BSA Protein Molecules for Improved Surface Passivation Coatings. ACS Appl. Mater. Interfaces 2018, 10, 32047–32057. 10.1021/acsami.8b13749. [DOI] [PubMed] [Google Scholar]
- Canet D.; Doering K.; Dobson C. M.; Dupont Y. High-Sensitivity Fluorescence Anisotropy Detection of Protein-Folding Events: Application to α-Lactalbumin. Biophys. J. 2001, 80, 1996–2003. 10.1016/s0006-3495(01)76169-3. [DOI] [PMC free article] [PubMed] [Google Scholar]
- Grigolato F.; Arosio P. Sensitivity Analysis of the Variability of Amyloid aggregation Profiles. Phys. Chem. Chem. Phys. 2019, 21, 1435–1442. 10.1039/C8CP05904G. [DOI] [PubMed] [Google Scholar]
- Kelly S. M.; Jess T. J.; Price N. C. How to Study Proteins by Circular Dichroism. Biochim. Biophys. Acta, Proteins Proteomics 2005, 1751, 119–139. 10.1016/j.bbapap.2005.06.005. [DOI] [PubMed] [Google Scholar]
- Otzen D. Protein-Surfactant Interactions: A Tale of Many States. Biochim. Biophys. Acta, Proteins Proteomics 2011, 1814, 562–591. 10.1016/j.bbapap.2011.03.003. [DOI] [PubMed] [Google Scholar]
- Otzen D. E. Protein Unfolding in Detergents: Effect of Micelle Structure, Ionic Strength, PH, and Temperature. Biophys. J. 2002, 83, 2219–2239. 10.1016/S0006-3495(02)73982-9. [DOI] [PMC free article] [PubMed] [Google Scholar]
- Xu Q.; Keiderling T. A. Effect of Sodium Dodecyl Sulfate on Folding and Thermal Stability of Acid-Denatured Cytochrome c: A Spectroscopic Approach. Protein Sci. 2004, 13, 2949–2959. 10.1110/PS.04827604. [DOI] [PMC free article] [PubMed] [Google Scholar]
- Winogradoff D.; John S.; Aksimentiev A. Protein Unfolding by SDS: The Microscopic Mechanisms and the Properties of the SDS-Protein Assembly. Nanoscale 2020, 12, 5422–5434. 10.1039/c9nr09135a. [DOI] [PMC free article] [PubMed] [Google Scholar]
- Otzen D. E.; Christiansen L.; Schülein M. A Comparative Study of the Unfolding of the Endoglucanase Cel45 from Humicola Insolens in Denaturant and Surfactant. Protein Sci. 1999, 8, 1878. 10.1110/PS.8.9.1878. [DOI] [PMC free article] [PubMed] [Google Scholar]
- Kopac T.; Bozgeyik K.; Yener J. Effect of PH and Temperature on the Adsorption of Bovine Serum Albumin onto Titanium Dioxide. Colloids Surf. A Physicochem. Eng. Asp. 2008, 322, 19–28. 10.1016/j.colsurfa.2008.02.010. [DOI] [Google Scholar]
- Yohannes G.; Wiedmer S. K.; Elomaa M.; Jussila M.; Aseyev V.; Riekkola M. L. Thermal Aggregation of Bovine Serum Albumin Studied by Asymmetrical Flow Field-Flow Fractionation. Anal. Chim. Acta 2010, 675, 191–198. 10.1016/j.aca.2010.07.016. [DOI] [PubMed] [Google Scholar]
Associated Data
This section collects any data citations, data availability statements, or supplementary materials included in this article.


