

Abstract
Prolonged high-fat diet (HFD) exposure is associated with hyperphagia, excess caloric intake, and weight gain. After initial exposure to a HFD, a brief (24–48hr) period of hyperphagia is followed by the regulation of caloric intake and restoration of energy balance within an acute (3–5 day) period. Previous studies have demonstrated this occurs via a vagally-mediated signaling cascade that increases glutamatergic transmission via activation of NMDA receptors located on gastric-projecting neurons of the dorsal motor nucleus of the vagus (DMV). The present study used electrophysiological recordings from thin brainstem slice preparations, in vivo recordings of gastric motility and tone, measurement of gastric emptying rates, and food intake studies to investigate the hypothesis that activation of brainstem astrocytes in response to acute HFD exposure is responsible for the increased glutamatergic drive to DMV neurons and the restoration of caloric balance. Pharmacological and chemogenetic inhibition of brainstem astrocytes reduced glutamatergic signaling and DMV excitability, dysregulated gastric tone and motility, attenuated the homeostatic delay in gastric emptying, and prevented the decrease in food intake that is observed during the period of energy regulation following initial exposure to HFD. Understanding the mechanisms involved in caloric regulation may provide critical insights into energy balance as well as into the hyperphagia that develops as these mechanisms are overcome.
Keywords: Astrocyte, high fat diet, obesity, neuroplasticity, neurophysiology, NMDA receptor, gastroenterology, feeding
Graphical Abstract

Under normal dietary conditions, glutamatergic signaling to DMV neurons occurs via activation of AMPA receptors only. Activation of brainstem astrocytes in response to high fat diet exposure causes release of the gliotransmitters glutamate and ATP which activate group I metabotropic glutamate receptors and P2X receptors, respectively, on DMV neurons. This causes subsequent activation of extrasynaptic NMDA receptors and, in turn, synaptic NMDA receptors. The altered excitatory transmission to vagal efferent DMV neurons dysregulates gastric motility and tone, delays gastric emptying and regulates food intake allowing restoration of caloric balance.
Introduction
The recent dramatic increase in the national and global rates of obesity and its common comorbid disorders, including cardiovascular disease, Type II diabetes, and hypertension, has emphasized the importance of understanding the neural mechanisms that regulate autonomic processes such as feeding and digestion (Hammond & Levine, 2010; Collaborators et al., 2017). Although several factors are involved in the development of obesity, including genetic, environmental, and behavioral influences and predispositions, ultimately obesity occurs when energy intake exceeds energy expenditure (Sivarao et al., 1998; Levin, 2006, 2010a, b). The ready accessibility of calorically dense foods, as well as increased fat consumption, are most often associated with increased caloric intake and eventual weight gain (Levin, 2006, 2010a).
While prolonged HFD exposure leads to hyperphagia and the development of obesity (Daly et al., 2011; de Lartigue et al., 2011; Kentish et al., 2012; Troy et al., 2016), caloric intake is regulated in the short term (Berthoud, 2004; Bhagat et al., 2015; Clyburn et al., 2018). Upon initial exposure to HFD, rodents exhibit a brief (24–48hr) period of hyperphagia before calorie consumption is restored to the levels observed while on a standard diet (within 3–5 days of initial exposure). This homeostatic regulation suggests that acute HFD exposure uncovers a neural mechanism that is capable of regulating caloric intake and maintaining energy balance.
Previous studies have shown that this period of energy homeostasis is associated with increased excitatory glutamatergic transmission in vagally-dependent neurocircuits that control gastric functions (Clyburn et al., 2018). Briefly, sensory inputs from the stomach and upper gastrointestinal (GI) tract are relayed centrally through vagal afferent fibers via the tractus solitarius (TS) to the nucleus of the tractus solitarius (NTS) (Browning et al., 1999; Travagli & Anselmi, 2016). The NTS integrates these sensory inputs with several other signals from the brainstem and hypothalamus involved in autonomic control, and sends glutamatergic, GABAergic, or catecholaminergic projections to the neurons of the dorsal motor nucleus of the vagus (DMV) (Browning & Travagli, 2014; Travagli & Anselmi, 2016). The DMV projects parasympathetic efferent (motor) signals to the stomach and upper GI tract to coordinate gastric functions, including motility, tone and emptying, with subsequent regulation of food intake and energy homeostasis (Browning & Travagli, 2014; Travagli & Anselmi, 2016). Together with the area postrema (AP), the NTS and DMV form the dorsal vagal complex (DVC). Previously, we have demonstrated that increased NTS-DMV glutamatergic drive via the activation of synaptic and extrasynaptic NMDA receptors contributes to the homeostatic regulation of caloric intake following acute HFD exposure (Clyburn et al., 2018; Clyburn et al., 2021). The mechanisms responsible for this glutamatergic neuroplasticity, however, remain unknown.
Before chronic inflammation develops peripherally in response to increased adiposity, short periods of HFD exposure are associated with an acute, central inflammation in the brainstem and hypothalamus (Thaler et al., 2012; Buckman et al., 2015; Kalin et al., 2015; Waise et al., 2015; Guillemot-Legris et al., 2016; Astiz et al., 2017; Belegri et al., 2018) along with the activation of local astrocytes and microglia (Cartier et al., 2005; Thaler et al., 2012; Clyburn & Browning, 2019). Within the adjacent NTS, morphological changes have been observed in response to acute HFD exposure and chemogenetic activation of DVC astrocytes reduces food intake significantly (MacDonald et al., 2020). Furthermore, astrocytes and DVC neurons express leptin (Stein et al., 2020) and GLP-1 (Reiner et al., 2016) receptors that may be important in energy balance. However, the mechanism that allows astrocytes to regulate neural activity remain unclear. While historically thought of as passive support cells for nearby neurons, astrocytes and glia are now well known for playing critical and dynamic roles in neuromodulation and neurosignaling (Angulo et al., 2004; Agulhon et al., 2008; Theodosis et al., 2008; Bonansco et al., 2011; Zorec et al., 2012; Araque et al., 2014; Buckman et al., 2015; Beltran-Castillo et al., 2017; Brancaccio et al., 2017; Um, 2017), including the modulation of synaptic structure and efficacy (Angulo et al., 2004; Agulhon et al., 2008; Bonansco et al., 2011; Takata et al., 2011; Potapenko et al., 2013; Beltran-Castillo et al., 2017; Scofield, 2018). While there are many mechanisms by which astrocytes can modulate the excitability of nearby neurons, the release of gliotransmitters, such as glutamate, D-serine, and ATP into the extrasynaptic space has been shown to permit the activation of pre- and post-synaptic receptors, including extrasynaptic NMDA receptors (Stern & Filosa, 2013; Araque et al., 2014; Bang et al., 2016; Rose et al., 2017; Covelo & Araque, 2018; Clyburn & Browning, 2019). The aim of the present study, therefore, was to test the hypothesis that activation of DVC astrocytes is necessary for NMDA receptor activation on DMV neurons and is responsible for homeostatic regulation of caloric intake following acute HFD exposure.
Methods
Ethical Approval
All experiments were performed with the approval of the Penn State University College of Medicine Institutional Animal Care and Use Committee, and in accordance with the National Institute of Health regulations. Reporting of animal experiments conforms to the principles and regulations for animal experiment reporting and ethics and conforms with the ARRIVE guidelines.
Animals
Male and virgin female SD rats (N=205; N =133 males, 72 females; Charles River, Kingston, NY) were used for in vitro electrophysiological (N=59), immunohistochemical (N=52), and food intake (N=30) studies. Sex as a biological variable was considered in data analysis and only when statistical analyses demonstrated the lack of a sex-dependent effect were data from male and female rats combined. Only male SD rats were used for in vivo gastric motility (N=12) and gastric emptying (N=20) recordings, due to the estrus cycle-dependent modulation of vagally-dependent gastric functions in females (Jiang et al., 2019; Littlejohn et al., 2019). All rats were housed in Penn State College of Medicine’s humidity (30–70%) and temperature (20–26°C)-regulated Central Animal Quarters with an artificial 12hr light/dark cycle. All rats were group housed in plastic open-top cages with wire lids and corn cob bedding, unless otherwise stated. Rats had ad libitum access to water and normal chow (fat, protein, carbohydrate content 14:27:59% kcal Purina Mills, Gray Summit, MO) or HFD (60:20:20% D12492; Envigo, New Brunswick, NJ), which was provided for up to 14 days prior to experimentation, unless otherwise stated. All rats were 4–10wks of age at the time at which in vitro and in vivo experiments commenced. All experiments started within 2 hours of the lights on cycle.
Immunofluorescent Staining
Rats (N=52) were exposed to a control or a HFD for 1, 3, 5, or 14d (CTL N=3,3,3,4 males and 3,3,3,3 females; HFD: N=4,3,3,4 males, and N= 3,3,3,4 females, respectively). Rats were anesthetized with Inactin (125–150mg/kg, i.p.) then euthanized and perfused transcardially with saline followed by 4% paraformaldehyde in PBS (0.1M PBS: in mM: 115 NaCl, 75 Na2HPO4, 7.5 KH2PO4). The brainstems were removed and post-fixed for 3 days in 4% paraformaldehyde + 20% sucrose. The brainstems were then frozen and cut in 50μm sections throughout the rostro-caudal extent of the DVC using a freezing microtome. Brainstem slices were stored in long term storage buffer (0.1M PBS, 30% sucrose, 30% ethylene glycol) at −20°C until immunohistochemical processing. Control and HFD brainstems were collected and processed at the same day and time under the same experimental conditions.
Every 4th brainstem slice from each rat was rinsed thoroughly in 0.1M PBS and incubated in Immunobuffer (IB; 0.1M PBS with 1% normal donkey serum (NDS) and 0.3% Triton X-100) for 1hr. Slices were then incubated with the primary antibodies goat anti-ChAT (AB144p; 1:500 dilution, EMD Millipore, Burlington, MA) and rabbit anti-GFAP (AB5804; 1:500 dilution, EMD Millipore) diluted in IB for 3d at room temperature. Following thorough washing in PBS-Triton X, slices were incubated overnight in secondary antibodies (donkey anti-rabbit Alexa Fluor 488 A21206 and donkey anti-goat Alexa Fluor 568 A11057; 1:500 dilution in IB for both, Invitrogen/ThermoFisher Scientific). Slices were then rinsed again with PBS and mounted in Fluoromount G (Southern Biotechnology, Birmingham, AL) on subbed glass slides.
Image analysis
Immunohistochemical tissues were examined using an Olympus Fluoview FV1000 confocal laser scanning microscope equipped with a Krypton/Argon laser with filters for the selective visualization of Alexa 488 and Alexa 568. (Center Valley, PA). Confocal images throughout the depth of the 50μm slice were taken at a total magnification of 40X, 400X, or 800X and compiled into a z-stack.
Sequential scanning and adjustment of the appropriate High-Low settings allowed for optimal intensities. All images were taken at the same settings to allow for direct comparison between samples. The intensity of glial staining within the DMV or NTS was analyzed using ImageJ software (https://imagej.nih.gov/ij/). To determine the intensity of GFAP-IR, the DMV or NTS were outlined background staining was normalized, and mean pixel intensity was calculated. Mean pixel density was calculated in both the left and right DMV or NTS for comparison. For each rat, an image was at the intermediate (Bregma −13.9mm) level of the brainstem.
Chemogenetic DREADD Vector Transfection
Rats 3–4wks of age (N=64; N= 47 males, 17 females) were anesthetized with rodent cocktail (ketamine: 80mg/kg, acepromazine: 1mg/kg, xylazine: 10mg/kg, i.m.) to a deep plane of anesthesia. Rats were given carprofen (5mg/kg s.c.) peri-operatively, and at 24hr intervals post-operatively for 3d for analgesia, and Baytril (5mg/kg i.m.) as a post-operative antibiotic for 5d. Core body temperature was maintained at 37°C with a heating pad. Rats were placed on a stereotaxic frame (Kopf Instruments, Tujunga, CA) and the brainstem was exposed via blunt dissection. A borosilicate micropipette (~20μm tip diameter) was used to inject the adeno-associated virus expressing the inhibitory DREADD (designer receptors exclusively activated by designer drugs), pAAV-GFAP-hM4D(Gi)-mCherry (“GFAP-hM4DGi”; a gift from Bryan Roth; Addgene viral prep # 50479-AAV5; titer: 1×10¹³ diluted 1:10 in PBS at the time of use), or AAV-GFAP104-mCherry; (“empty vector”; UNC vector core, Chapel Hill, NC, titer: 2.7×10¹² diluted 1:10 in PBS at the time of use). Unilateral or bilateral injections (100nl volume) were made into the DMV at the coordinates (in mm) +0.4–0.5 rostro-caudal from calamus scriptorius, ±0.2–0.4 medio-lateral from midline, and −0.6–0.65 dorso-ventral from the brainstem surface. The rats used for food intake and gastric emptying studies received bilateral injections of either the empty vector (N=12, 8 males, 4 females) or the inhibitory DREADD (N=26, 14 males, 12 females). Rats used for electrophysiological recordings received the GFAP-hM4DGi in the left DMV and the empty vector in the right DMV (N=14, 6 males, 8 females), to allow for inter-animal comparisons. Rats used for in vivo gastric recordings received unilateral (left) DMV injections of either GFAP-hM4DGi (N=7 males) or the empty vector (N=5 males), as recordings are made from strain gauges sewn onto the ventral (left) surface of the stomach. After suturing and recovery from anesthesia, rats were returned to their home cage and were allowed a 4wk recovery period sufficient for viral expression prior to subsequent HFD exposure and in vitro or in vivo experimentation.
4th Ventricular Cannula Placement
Rats (N=7males, 5 females) were anesthetized with rodent cocktail (ketamine: 80mg/kg, xylazine: 1.6mg/kg, acepromazine: 5mg/kg intramuscular (i.m.)) until a deep plane of anesthesia was achieved and the foot pinch reflex was abolished. Rats were given carprofen (5mg/kg s.c.) peri-operatively, and at 24hr intervals post-operatively for 3d for analgesia, and given Baytril (5mg/kg i.m.) as a post-operative antibiotic for 5d. Rats were then placed on a stereotaxic frame and the skull was exposed via blunt dissection. Guide cannulae (7.9mm length, 22 gauge, Plastics One, Roanoke, VA) were placed above the 4th ventricle, 2.5mm anterior to the occipital suture, on the midline, 6.0mm below the skull surface. The cannulae were affixed to the skull with 3 screws (0-80X3-32, Plastics One, Roanoke, VA) and dental cement (Stoelting Co., Wood Dale IL) and closed with obturators (0.014–0.36mm, Plastics One, Roanoke, VA) after suturing. Rats were returned to their home cage and single housed prior to food intake studies. Rats were allowed a minimum of 4d of recovery prior to experimentation and food intake and body weight were measured daily to monitor surgical recovery.
Food Intake Measurements
Following the appropriate surgical recovery period (either placement of 4th ventricular cannulae or chemogenetic injections), food intake and body weight were measured twice daily, within 1hr of lights on-off. To allow acclimation to handling and injection and to maintain cannula patency, rats fitted with 4th ventricular cannulae received daily 4th ventricular PBS (2μl) injections once daily 1hr before lights off, while chemogenetic rats (N=18) received saline injections (0.9%; 1ml/kg intraperitoneal (i.p.)) morning and evening within 1hr of lights on/off. Following 4d of baseline measurements, all rats were exposed to HFD. On the day of HFD exposure, one group of rats fitted with 4th ventricular cannulae (N=6, 4 males, 2 females) began daily 4th ventricular administration of the astrocyte-selective citric acid cycle inhibitor, fluoroacetate (FA; 100μM/2μl) while the remainder (N=6, 3 males 3 females) continued to receive PBS. Rats transfected with the GFAP-hM4DGi (N=6, 3 males 3 females) received twice daily CNO injections (3mg/kg i.p). To exclude the possibility that AAV injection and neuronal transfection alone is responsible for experimental outcomes, control experiments were carried out in which rats that received empty vector injection (N=6, 3 males 3 females) also received twice daily CNO injections. An additional set of control experiments was carried out in which the remaining group of GFAP-hM4DGi rats received twice daily clozapine injections (1mg/kg, N=6, 3 males 3 females) in order to confirm the specificity of CNO effects and exclude potential actions via back-metabolism to clozapine.
Caloric intake was normalized to body weight, and expressed as percent of baseline, (average caloric intake measured over 3d of control diet intake). Data is expressed as daily (24hr) and total (area under the curve; AUC; 1–5d of HFD) caloric intake.
At the conclusion of the food intake studies, rats were anesthetized (Inactin, 150mg/kg i.p.) and euthanized via bilateral pneumothorax. The placement of 4th ventricular cannulae were verified via cresyl violet injection and visual inspection. Chemogenetic rats were anesthetized and euthanized via transcardial perfusion with saline followed by 4% paraformaldehyde in PBS. The brainstems were removed and post-fixed for 3 days in 4% paraformaldehyde + 20% sucrose. The brainstems were then frozen and cut in 50μm sections throughout the rostro-caudal extent of the DVC using a freezing microtome for post hoc verification of viral transfection using a Nikon E400 microscope. Vector expression was never observed within the more ventrally located hypoglossal nucleus and was contained within the DMV and, on occasion, also within the area of NTS immediately dorsal to the DMV.
Gastric Emptying Measurement
The gastric emptying rate for a solid meal was measured in male rats (N=20) using the 13C octanoic acid breath test. Following 3d of acclimation to the testing chamber (one rat per chamber) and a pancake meal, rats were fasted overnight with ad libitum access to water before placement in the testing chamber. Testing chambers had a controlled air flow rate with CO2 levels maintained between 1000 and 3000ppm. After 60min of baseline recordings, rats were given 1g of pancake (Pillsbury Homestyle Pancakes, General Mills, Minneapolis, MN) treated with 4μl of [13C]-octanoic acid (Cambridge Isotope Laboratories, Inc. Tewksbury, MA). Rats that did not consume the entire pancake within 5min were removed from the study. Air from testing chambers was sampled automatically, one chamber at a time, for 30s each at a sample rate of 1Hz for a total period of 8hrs. The air sample was analyzed by Off-Axis Integrated Cavity Output Spectroscopy (OA-ICOS) using a multiple input unit and carbon dioxide carbon isotope analyzer (Los Gatos Research, Mountain View, CA).
For each 30s period of data, the first 10s were removed to ensure a complete flush of the previous air sample from the tubing. The remaining 20s of data were averaged for a single data point at a given time. The concentration of 13CO2 was then calculated and expressed as a change over the baseline. The change of concentration of 13CO2 vs time (t) was fitted by a non-linear regression curve with the following equation:
where y is the percentage of the 13C excretion in the breath per hour (t) and a, b, and c are regression constants estimated for each breath vs. time curve. The gastric half emptying time (T1/2) was calculated from a numerical integration procedure using an inverse gamma function (Miller et al., 2018).
Rats were acclimated to daily i.p. injections (0.9% saline; 1ml/kg). Three baseline measurements were taken (at 5d intervals) before rats were placed onto a HFD from which point rats received either CNO (GFAP-hM4DGi N=7 males, empty vector N=6 males) or clozapine (GFAP-hM4DGi N=7 males) injections. Gastric emptying was measured at baseline, 1, 4, and 9d of HFD exposure.
In vivo Recordings of Gastric Tone and Motility
Male rats (N=12) were anesthetized with Inactin (Thiobutabarbital 125–150mg/kg, i.p.) to a deep plane of anesthesia (abolition of the foot pinch reflex). A tracheal cannula was fitted and an abdominal laparotomy was performed to expose the anterior stomach. Miniaturized strain gauges (Modern Scientific Research LLC, Roaring Spring, PA) were sutured to the ventral surface of the corpus and antrum in alignment with the circular smooth muscle, as described previously (Clyburn et al., 2018; McMenamin et al., 2018). The strain gauge leads were exteriorized before the abdominal incision as closed. Rats were then placed in a stereotaxic frame and body temperature was maintained with a heating pad at 37°C. The strain gauge signal was filtered (AT Engineering, Hershey, PA; low pass cutoff 0.5Hz), amplified (QuantaMetrics EXP CLSG-2, Newton, PA) and recorded on a computer using Axotape 10 software (Molecular Devices). Briefly, strain gauges were calibrated prior to use and drug-induced effects on gastric motility and tone were extrapolated from the average calibration value. While basal gastric tone was not adjusted to a fixed value, the gastric circular muscle provided a basal tension of approximately 500mg. Due to individual variation in animal size and surgical placement of the strain gauges which may lead to minor variations in absolute values, corpus and antrum tone are reported as absolute values relative to baseline. Each rat served as its own control and corpus and antrum motility were calculated using the following formula:
Where Nx = the number of motility peaks in each force range and t = time period over which motility was measured. With the assumption that the absence of motility produced a 0mV signal, the peak-to-peak motility waves reflected N1 = 25–50mg, N2 = 51–100mg, N3 = 101–200mg, and N4 = >201mg.
Following placement on the stereotaxic frame, the brainstem was exposed via blunt dissection, the meningeal membranes above the vagal trigone were removed, and the exposed brainstem was covered with warm saline during a 90min recovery period. A borosilicate micropipette (~20μm tip diameter) was lowered into the left DVC at the coordinates (in mm) +0.4–0.5 rostro-caudal from calamus scriptorius, +0.2–0.4 medio-lateral from midline, and −0.6–0.65 dorso-ventral from the brainstem surface. Kynurenic acid (KynA; 100pmol/60nl) was prepared fresh daily and dissolved in phosphate buffered saline (PBS; in mM: 115 NaCl, 75 Na2HPO4, and 7.5 KH2PO4) and microinjected in 60nl volumes using a picospritzer (Toohey Co., Fairfield, IL) over a period of approximately 60s. CNO (20nmol/2μl) and clozapine (0.2nmol/2μl) were both applied to the 4th ventricle in 2μl volumes. The effects of drug application on corpus and antrum motility and tone were measured as described previously (Clyburn et al., 2018; McMenamin et al., 2018).
Identification of Gastric-Projecting DMV Neurons
Gastric-projecting DMV neurons of rats were identified prior to electrophysiological experiments through retrograde tracing and application of the retrograde tracer DiI (dioctadecyl (C18) indocarbycyanine; Life Technologies, Grand Island, NY) to either the antrum or the corpus of the stomach, as described previously (Clyburn et al., 2018; Clyburn et al., 2021). Briefly, rats were anesthetized to a deep plane of anesthesia determined by loss of the foot pinch reflex with isoflurane (2.5% in 100% O2). An abdominal laparotomy was performed and the stomach was exposed. DiI was applied to either the corpus or the antrum/pylorus and secured in place with a fast-hardening epoxy resin. All rats were allowed a 2wk recovery period sufficient to allow the tracer to reach and fluorescently label the gastric-projecting DMV neurons.
Brainstem Preparation
Two weeks following the labelling of gastric-projecting DMV neurons (N=45, 20 males, 25 females) or 4wk following viral injections, rats (N=14, 6 males, 8 females) were anesthetized with isoflurane before euthanasia via administration of a bilateral pneumothorax. The brainstem was removed and sliced quickly as described previously (McMenamin et al., 2016, 2018). Briefly, the brainstem was removed and submerged rapidly in cold (~5°C) oxygenated Krebs’ solution (in mM: 126 NaCl, 25 NaHCO3, 2.5 KCl, 1.2 MgCl2, 2.4 CaCl2, 1.2 NaH2PO4, and 10 d-glucose, maintained at pH 7.4 by bubbling with 95% O2/5% CO2). The brainstem was then mounted on a vibratome, and coronal sections sliced (300μm) throughout the rostro-caudal extent of the DVC. Slices were placed in warm (30°C) oxygenated Krebs’ solution for at least 90min before recording. The brainstems from rats that had received viral injections were cut in a high sucrose Krebs’ solution (in mM: 87.0 NaCl, 2.5 KCl, 0.5 CaCl2, 7.0 MgCl2, 1.25 NaH2PO4, 25.0 NaHCO3, 25.0 d-glucose, and 75.0 sucrose) for best viability. After 30min incubation in the high sucrose Krebs’ solution, slices were transferred to a 50:50 solution of warm, oxygenated normal Krebs’ and high sucrose Krebs’ for another 30min, before being transferred to normal Krebs’ solution for a further 30min prior to recording.
Electrophysiological Recordings from Brainstem Slices
A single brainstem slice was placed in a perfusion chamber (volume 500μl) fitted on the stage of a Nikon E600FN microscope equipped with tetramethylrhodamine isothiocynate (TRITC) epifluorescent filters. Slices were perfused at a rate of 2.0–2.5ml/min with warmed Krebs’ solution maintained at 32°C. Viral injection sites were confirmed based of the presence of fluorescent mCherry-labeled astrocytes, while gastric-projecting DMV neurons were identified based on their DiI fluorescence. Electrophysiological recordings were then made from identified gastric-projecting neurons or from medial DMV neurons surrounded by mCherry-labeled astrocytes, under bright-field illumination using patch pipettes of 2–4MΩ filled with a potassium gluconate intracellular solution (in mM: 128 potassium gluconate, 10 KCl, 0.3 CaCl2, 1 MgCl2, 10 HEPES, 1 EGTA, 1 NaATP, and 0.25 NaGTP adjusted to pH 7.35) and a single electrode voltage clamp amplifier (Axopatch 200B; Molecular Devices, Union City, CA). Data were filtered at 2kHz, digitized via a Digidata 1440 Interface, and stored and analyzed on a PC with pClamp 10 software (Molecular Devices). Recordings with a series resistance of >20MΩ were excluded from the study.
Glutamatergic mEPSCs were examined by voltage clamping neurons at −50mV in the presence of tetrodotoxin (TTX; 0.3μM) and bicuculline (30μM). The amplitude, frequency, and charge transfer of mEPSCs in response to perfusion with (2R)-amino-5-phosphonopentanoic acid (AP5; 25μM) were examined following both acute (20min) perfusion with fluoroacetate (FA; 100μM) as well as prolonged (1–2hrs) FA preincubation, using MiniAnalysis (Synaptosoft, Leonia, NJ). For chemogenetic experiments, the effect of AP5 on mEPSC amplitude, frequency, and charge transfer of mEPSCs were assessed following perfusion CNO (10μM) or clozapine (10μM).
Glutamatergic eEPSCS were examined by voltage clamping neurons at −50mV in the presence of bicuculline (30μM). A bipolar stimulating electrode (tip separation 50μm; WPI Inc., Sarasota, FL) was placed in the adjacent NTS and used to evoke glutamatergic transmission. The amplitude of eEPSCs were assessed following perfusion with the following: AP5 (25μM), DNQX (30μM), FA (100μM), MK801 (5μM), AIDA (300μM), PPADS (20μM), DHPG (20μM), or ATP (100μM). Agonists were applied for a period of time sufficient for the response to reach plateau, or at least 5min if a response was not observed. Antagonists were applied for at least 10min prior to reapplication of an agonist.
To characterize the effects of astrocytes and NMDA receptor activation on neuronal excitability and action potential firing rate, neurons were current clamped at a holding potential which allowed a firing rate of ~1 pulse per second (p.p.s.), prior to AP5 (25μM), FA (100μM), CNO (10μM) or clozapine (10μM) application. Antagonists were applied for a period of time sufficient for the response to reach plateau, or at least 5min if a response was not observed. If a significant change in action potential firing rate was observed in response to FA, CNO, or clozapine, the holding potential was re-adjusted to restore AP firing rate of ~1Hz prior to AP5 application.
Statistical Analysis
Statistical analysis was conducted using SPSS software package (IBM). When multivariate or two-way repeated measures ANOVAs were used, subsequent targeted contrasts (one-way ANOVAs or two-tailed Student’s T-Tests) were used to identify specific differences. Mauchly’s test was used confirm sphericity assumptions. If the ANOVA failed to adhere to sphericity assumptions, the Greenhouse-Geisser correction was used on the degrees of freedom, although departures from sphericity were not observed. Paired two-tailed Student’s T-Tests and one-way ANOVAs with post-hoc Bonferroni multiple comparison tests were used to compare normally distributed repeated measures and two-tail unpaired Student’s T-Tests were used to compare measures from distinct groups. Pearson χ2-test for independence were used to examine differences in group proportions. A physiologically significant response was considered to be a change >25%. Results were expressed as mean ± SD of the indicated sample size (N; cells or rats) with significance defined as P<0.05.
For immunofluorescent results, a multivariate ANOVA was conducted to investigate the effects of time on HFD (1, 3, 5, and 14d) and side (left or right DMV) on GFAP mean fluorescence intensity in control and HFD rats. No significant main effect was observed between the left and right DMV, therefore the results were pooled for further analysis. Targeted contrasts (one-way ANOVA and two-tailed unpaired Student’s T-Tests) were used to identify differences throughout time points and between control and HFD groups.
For studies measuring caloric intake, the effects of pharmacological inhibition of DVC astrocytes on total caloric intake were assessed with two-tailed unpaired Student’s T-Test and the effects of chemogenetic astrocyte inhibition were assessed with one-way ANOVA with post-hoc Bonferroni multiple comparison test.
Gastric emptying is expressed as time (min) or as percent of baseline, with baseline defined as the average half-emptying (T1/2) time of 3 baseline measurements. Results were analyzed using a two-way repeated-measures ANOVA and post-hoc Bonferroni multiple comparison test.targeted contrasts (one-way ANOVAs) were used to identify differences throughout time points and between control and HFD groups.
For in vivo recordings of gastric motility and tone, each rat served as its own control and the gastric responses were assessed before and after DVC injections using a paired Students T-Test. Inter-group comparisons were made using the unpaired Students T-Test or one-way ANOVA with post-hoc Bonferroni multiple comparison test. KynA was used to confirm an accurate microinjection site, and only those rats that demonstrated a decrease in gastric tone and motility in response to KynA microinjection were included in the statistical analyses. A physiologically significant response was considered a change in motility of at least >25%.
For electrophysiological results, the response of any neuron was assessed before and after drug application using a paired Students T-Test, such that each neuron served as its own control. The magnitude of response to an individual drug was compared across groups with an unpaired Students T-Test or one-way ANOVA with post-hoc Bonferroni test, or two-way repeated measures ANOVA with targeted contrasts. Neurons were categorized as responsive or non-responsive based on their pharmacological phenotype where a responsive neuron was one in which a drug induced a change in action potential firing rate >25% or a change in mEPSC frequency or charge transfer of >25%. All electrophysiological recordings were replicated in at least 3 rats.
Chemicals and Drugs
MK801, AIDA, PPADS, and DHPG were purchased from Tocris Bioscience; TTX was purchased from Cayman Chemical Company, CNO was purchased from Chemspecial.org; all other chemicals were purchased from Millipore Sigma
Results
Acute HFD activates brainstem astrocytes
Astrocyte activation within both the NTS and DMV was assessed during acute HFD exposure with immunofluorescent imaging. Astrocyte staining was assessed using glial fibrillary acid protein (GFAP) while choline acetyltransferase (ChAT) was used to identify cholinergic vagal motoneurons within the DMV of male and female Sprague-Dawley rats exposed to 1, 3, 5, and 14 days of HFD or standard chow (Figure 1A). A multivariate ANOVA was conducted to investigate the effects of time (1, 3, 5, and 14d time points) and side (left or right DMV or NTS) on GFAP mean fluorescence intensity in control and HFD rats. Time had a significant main effect on GFAP mean fluorescence intensity in the HFD group (DMV; control: F(3,46)=3.132, p=0.36, HFD: F(3,46)=15.969, p=<0.001; NTS; control: F(3,46)=2.814, p=0.051, HFD: F(3,46)=11.688, p<0.001). However, the side (left vs. right DMV or NTS) had no significant main effect on either GFAP mean fluorescence intensity in the HFD group or time-matched controls (DMV; control: F(1,46)=0.046, p=0.831, HFD: F(1,46)=0.005, p=0.942. NTS; control: F(1,46)=0.128, p=0.722 vs HFD: F(1,46)=0.002, p=0.965). As there was no significant main effect of side on GFAP fluorescence, results from the left and right DMV or NTS were pooled in the subsequent targeted contrast analyses. A one-way ANOVA confirmed a significant effect across time in HFD rats and the post-hoc Bonferroni multiple comparison test found that GFAP mean fluorescence intensity was significantly increased at day 3 compared to day 1 of HFD exposure in both the DMV and the NTS (Table 1, Figure 1 C–E; DMV p=0.002, 95% C.I.=1.362, 8.071;. NTS: p<0.001, 95% C.I.=6.085, 20.101 N=5 and 8 rats per time point, respectively) and day 14 (DMV p=0.017, 95% C.I.=0.412, 3.929;. NTS: p=0.006, 95% C.I.=1.985, 16.531, N=6 rats per time point). Similarly, GFAP mean fluorescence intensity in the HFD group was also significantly increased at day 5 compared to day 1 (Table 1: DMV: p=<0.001, 95% C.I.=4.511, 10.867; NTS: p<0.001, 95% C.I=4.107,18.123) and day 14 (Table 1 DMV: p=<0.001, 95% C.I.=1.951, 8.746. NTS: p=0.050, 95% C.I.=0.007, 14.553). GFAP mean fluorescence intensity was significantly increased in HFD rats compared to time-matched controls at day 3 (DMV: p=<0.001, t(20)=−7.309, 95% C.I. =−8.002, −4.449, via two-tailed unpaired Student’s T-Test,; NTS: p<0.001, t(22)=4.166, 95% C.I.=4.693, 14.00 N=6 and 5, respectively) and day 5 (DMV p=<0.001, t(22)=−8.479, 95% C.I.=−12.112, −7.352;. NTS: p<0.001, t(22)=8.431, 95% C.I.= 8.172, 13.50 via two-tailed unpaired Student’s T-Test, N=6 for each). There was no significant difference in GFAP mean fluorescence intensity between HFD and time-matched control groups at day 1, however, prior to the restoration of caloric balance (DMV: p=0.118, t(28)=2.608, 95% C.I.=−1.887, 1.325;. NTS: p=0.723, t(28)=0.3580, 95% C.I.= −1.886, 1.325 via two-tailed unpaired Student’s T-Test, N=8 and 7, respectively). Furthermore, by 14d of HFD exposure, when previous studies have shown that caloric balance is lost and rats become hyperphagic, the intensity of GFAP staining returned to baseline and was not significantly different from controls (DMV p=0.943, t(22)=0.005, 95% C.I.=−4.523, 1.166;. NTS: p=0.0855, t(24)=1.794, 95% C.I. =−0.8051, 11.49via two-tailed unpaired Student’s T-Test, N=6–7 for each).
Figure 1: Acute HFD modulates the neurochemical phenotype of brainstem astrocytes.

A. A schematic diagram illustrating the experimental timeline. Rats (N=5–8 per time point) were exposed to a HFD for 1, 3, 5, and 14d prior to tissue fixation and processing for immunohistochemical localization of GFAP-immunoreactivity (-IR; green; labelling activated astrocytes) or ChAT-IR (magenta; labelling cholinergic neurons). Brainstems were harvested from rats on a control diet at each time point at the same time as the HFD samples (N=6–8 per time point). B. Representative higher magnification images of the DVC in control (upper) and following 3d of acute HFD exposure (lower) illustrating GFAP (left) and GFAP+ChAT co-localization (right). Scale bar = 50μm. C. Graphical representation of GFAP-IR in the left and right DMV of control and HFD rats at 1, 3, 5, and 14d of HFD exposure. In the HFD group, GFAP mean fluorescence intensity was significantly increased at 3 and 5d compared to 1 or 14d. In addition, there was a significant difference in GFAP mean fluorescence intensity between control and HFD rats at day 3 and day 5 (multivariate ANOVA with targeted contrasts: *p<0.05, one-way ANOVA with post-hoc Bonferroni multiple comparison test, N=5–8 per time point. Data are represented as mean±SD). D. Graphical representation of GFAP-IR in the left and right NTS of control and HFD rats at 1, 3, 5, and 14d of HFD exposure. (*p<0.05, one way ANOVA with post-hoc Bonferroni multiple comparison test). E. Representative images of GFAP and GFAP+ChAT (left and right image in each set, respectively) DVC in control (left) and time matched HFD (right) rats at 1, 3, and 14d (top to bottom, respectively). Images were taken at the same confocal settings for comparison between groups. White scale bar = 150μm.
AP = area postrema, CC = central canal, NTS = nucleus tractus solitarius, DMV = dorsal motor nucleus of the vagus
Table 1:
Effects of acute HFD on GFAP-IR in the DMV
| Control (pixels/mm2) | Acute HFD (pixels/mm2) | |||||
|---|---|---|---|---|---|---|
| Left DMV | Right DMV | Total DMV | Left DMV | Right DMV | Total DMV | |
| 1 day | 3.903±1.587 | 4.061±4.061 | 3.982±1.652 | 4.014±2.722 | 4.511±2.473 | 4.263±2.525 |
| 3 days | 2.967±1.637 | 2.541±1.210 | 2.754±1.390 | 10.280±2.107 | 7.677±2.407 | 12.10±2.536* |
| 5 days | 1.457±0.836 | 2.981±2.119 | 1.114±1.729 | 10.410±1.293 | 13.500±4.560 | 11.95±3.580* |
| 14 days | 5.781±3.020 | 4.068±3.723 | 4.925±3.354 | 6.666±3.690 | 6.540±3.359 | 6.603±3.365 |
| Left NTS | Right NTS | Total NTS | Left NTS | Right NTS | Total NTS | |
| 1 day | 11.281±3.539 | 11.378±3.681 | 11.329±3.418 | 8.960±2.536 | 9.445±3.019 | 9.204±2.679 |
| 3 days | 9.038±1.516 | 9.443±1.752 | 9,240±1.429 | 18.145±7.875 | 22.230±10.323 | 20.223±8.634* |
| 5 days | 9.943±3.990 | 9.919±3.776 | 9.931±3.870 | 18.739±8.288 | 18.737±6.237 | 18.738±6.177* |
| 14 days | 10.894±2.594 | 11.269±2.513 | 11.081±2.536 | 13.210±7.390 | 12.662±7.334 | 12.935±7.194 |
Multivariate ANOVA uncovered significant main effect of time (days on HFD) in the acute HFD group in both the DMV and the NTS.
Data are reported as Mean ±SD. SD
p<0.05, one-way ANOVA with post-hoc Bonferroni multiple comparison test.
These data suggest that acute (3–5 days) HFD exposure causes astrocyte activation within the DMV and NTS and that this activation is lost following continued HFD exposure.
Regulation of caloric intake is dependent upon activation of DVC astrocytes.
To investigate whether activated DVC astrocytes are responsible for regulating caloric intake following acute HFD exposure, food intake was assessed following pharmacological and chemogenetic inhibition of DVC astrocytes.
Astrocyte activity was inhibited pharmacologically using the astrocyte-selective citric acid cycle inhibitor, fluoroacetate (FA), administered via chronic indwelling 4th ventricular cannulae (Figure 2A). After surgical recovery, brainstem application of FA significantly increased caloric intake during acute (3–5d) of HFD exposure compared to vehicle (PBS) treatment. Total caloric intake (AUC) in 1–5d of HFD exposure was significantly increased following 4th ventricular application of FA compared to PBS controls (965.10±97.64 vs. 866.47±45.41, t(10)=−2.242, 95% C.I.=−196.64, −0.632, p=0.0488, N=6 rats each: two-tailed unpaired Student’s T-Test; Figure 2B).
Figure 2: The acute HFD-induced regulation of caloric intake is dependent upon activation of DVC astrocytes.

A. A schematic diagram illustrating the experimental timeline investigating the effects of pharmacological inhibition of astrocytes on food intake B. 4th ventricular application of FA (N=6 rats) attenuated the homeostatic regulation of daily caloric intake (left) and total caloric intake (right). Total caloric intake (area under the curve: AUC) in 1–5d of HFD exposure was significantly increased following 4th ventricular application of FA compared to PBS controls (N=6 rats). p<0.05, two-tailed unpaired Student’s T-Test. Data are represented as mean ± SEM. C. A schematic diagram illustrating the experimental timeline for the chemogenetic food intake study. D. CNO treatment in GFAP-hM4DGi transfected rats (N=6) inhibited the homeostatic regulation of daily caloric intake (left) and total caloric intake (AUC; right) compared to empty vector rats treated with CNO (N=6) and GFAP-hM4DGi rats treated with clozapine (N=6) *p<0.05, one-way ANOVA with post-hoc Bonferroni multiple comparison test. Data are represented as mean ± SD. E. Representative images of GFAP (left) GFAP-hM4DGi (middle) and their co-localization (right) in the DMV of a rat after 3dd of HFD exposure. Scale bar = 50μm.
Astrocyte activity was also inhibited with a chemogenetic strategy following transfection of brainstem astrocytes via bilateral stereotaxic microinjection of an inhibitory DREADD under the GFAP promoter (pAAV-GFAP-hM4D(Gi)-mCherry; “GFAP-hM4DGi”; Figure 2C). After 3wk of recovery, daily administration of the DREADD agonist, clozapine-N-oxide (CNO), significantly increased caloric intake during acute HFD exposure compared to control groups (CNO administration to rats after transfection with an empty vector (AAV-GFAP104-mCherry), or clozapine administration to GFAP-hM4DGi transfected rats). A one-way ANOVA detected a significant effect between groups (F(2,15)=10.981, p=0.0012). CNO treatment in GFAP-hM4DGi rats significantly increased caloric intake compared to empty vector (Total caloric intake: 963.9±84.16 vs. 843.3±35.15, p=0.008, 95% C.I.=29.73, 211.47; post-hoc Bonferroni multiple comparison test) and clozapine controls (815.17±43.87, p=0.002, 95% C.I.=57.96, 239.71; post-hoc Bonferroni multiple comparison test, Figure 2D).
Together, these data show that astrocyte inhibition attenuates the homeostatic regulation of caloric intake and suggests activated astrocytes are responsible for the restoration of energy balance following acute HFD exposure.
Acute HFD-induced delay in gastric emptying is dependent upon activation of DVC astrocytes
Previous studies demonstrated that the acute HFD-induced regulation of caloric intake is associated with a significant delay in gastric emptying (Clyburn et al., 2021). To investigate whether activated DVC astrocytes are responsible for this delay, gastric emptying rates were assessed in male rats using the 13C octanoic acid breath test following chemogenetic inhibition of DVC astrocytes (Figure 3A). Female rats were not used in this experiment because of the estrus cycle-dependent modulation of gastric functions (Jiang et al., 2019; Littlejohn et al., 2019).
Figure 3: Acute HFD-induced delay in gastric emptying is dependent upon activation of DVC astrocytes.

A. A schematic diagram illustrating the experimental timeline in which the 13C octanoic acid breath test technique was used to assess the acute HFD-mediated delay in gastric emptying following chemogenetic inhibition of DVC astrocytes (GFAP-hM4DGi + CNO, N=7 rats, empty vector + CNO = 6 rats, GFAP-hM4DGi + clozapine, N=7 rats). Gastric emptying measurements were made at 1, 4, and 9d of HFD exposure. B. Representative gastric emptying curves of empty vector+CNO (left) and GFAP-hM4DGi+clozapine (middle) rats (middle) as well as GFAP-hM4DGi+CNO rats (right) at 1 (black) 4 (purple) and 9d (grey) of HFD exposure. Vertical lines indicate T1/2. C. Graphical representation of gastric emptying time (T1/2) at 1 (closed), 4 (check), and 9d (open)of HFD exposure in empty vector+CNO (left; N=6), GFAP-hM4DGi+clozapine (middle; N=7), and in GFAP-hM4DGi+CNO rats (right; N=7). Gastric emptying rates at day 4 of HFD exposure were significantly delayed in empty vector+CNO and GFAP-hM4DGi+clozapine rats compared to 1d of HFD exposure. In contrast, there was no difference in gastric emptying time in GFAP-hM4DGi+CNO rats. Dashed line indicates 125% of baseline. Two-way ANOVA with targeted contrasts: *p<0.05, one-way ANOVA with post-hoc Bonferroni multiple comparison test. Data are represented as mean±SD. D. Graphical representation of the proportion of rats that exhibited a significant delay in gastric emptying after 4d of HFD exposure. The proportion (%) of GFAP-hM4DGi +CNO rats that exhibited a significant delay in gastric emptying at 4d of HFD exposure (>25% of baseline) was significantly decreased compared to empty vector+CNO and GFAP-hM4DGi+clozapine rats. *p<0.05, Pearson χ2-test for independence
A two-way repeated measures ANOVA was used to assess the effects of time (i.e. days of HFD exposure; within subject’s variable) on gastric emptying rates (T1/2) in GFAP-hM4DGi+CNO, empty vector+CNO, and GFAP-hM4DGi+clozapine rats (between subject’s variable) and a significant main effect was observed F(2,34)=10.966, p=<0.001; Figure 3B,C). Targeted contrasts via a one-way ANOVA compared the gastric emptying rates at day 4 of HFD exposure across groups and detected a significant effect between groups (F(2,17)=10.544, p=0.0011). A post-hoc Bonferroni multiple comparison test determined that gastric emptying rates at day 4 of HFD exposure were significantly reduced in GFAP-hM4DGi+CNO rats compared to empty vector+CNO (p=0.032, 95% C.I.=−47.34, −2.41) and GFAP-hM4DGi+clozapine rats (p<0.001, 95% C.I.=−68.53, −25.37). As observed previously, gastric emptying in the control groups was significantly delayed at 4d of HFD exposure compared to 1d (empty vector+CNO: day 1 mean: T1/2=119.3±25.64min vs. day 4 mean: T1/2=143.5±16.31min, t(5)=2.822, p=0.037, 95% C.I.=−50.53, −9.59; GFAP-hm4DGi+clozapine: day 1 mean: T1/2=113.4±20.26min vs. day 4 mean: T1/2=165.6±19.50min, t(6)=−6.557, p=<0.001, 95% C.I.=−71.61, −32.69 from a two-tailed paired Student’s T-Test). However, there was no significant difference in gastric emptying rates at day 1 and day 4 of HFD in GFAP-hM4DGi+CNO rats (day 1 mean: T1/2=105.5±23.91min vs. day 4 mean: T1/2 =118.6±20.87min, t(6)=−0.998, p<0.888, 95% C.I.=−45.36, 19.07; two-tailed paired Student’s T-Test). In addition, the proportion (%) of GFAP-hM4DGi+CNO rats that exhibited a significant delay in gastric emptying at 4d of HFD exposure (>25% of baseline) was significantly decreased compared to empty vector+CNO and GFAP-hM4DGi+clozapine rats (Pearson χ2(2,20)=9.23, p=0.010; Pearson χ2-test for independence; Figure 3D). No significant difference in gastric emptying was observed between groups at 1 or 9d of HFD exposure, when caloric intake is dysregulated (1d: F(2,17)=0.582, p=0.570, 9d: F(2,17)=0.491, p=0.620; one-way ANOVA).
Together, these data show that inhibition of DVC astrocytes attenuates the homeostatic delay in gastric emptying and suggests that activated astrocytes are responsible for this delay following acute HFD exposure.
Acute HFD-induced modulation of gastric tone and motility is dependent upon activation of DVC astrocytes
Following acute HFD exposure, enhanced glutamatergic signaling to DMV neurons has been shown to restore gastric tone and motility to baseline levels (Clyburn et al., 2018; Clyburn et al., 2021). In anesthetized male rats, miniaturized strain gauges were used to measure the in vivo tone and motility of the gastric antrum and corpus in response to pharmacological manipulation of brainstem neurocircuits. Under control conditions, brainstem microinjection of the ionotropic glutamate antagonist, KynA has no effect on gastric functions. Following acute HFD, however, DVC microinjection of KynA decreases motility and tone of the corpus and antrum, suggesting an upregulation of glutamatergic tone in vagal efferent neurocircuits regulating gastric functions (Clyburn et al., 2018). The effects of chemogenetic inhibition of DVC astrocytes on the KynA-mediated decrease in tone and motility of the antrum and corpus in GFAP-hM4DGi and empty vector rats were assessed (Figure 4A).
Figure 4: Acute HFD-induced modulation of gastric tone and motility is dependent upon activation of DVC astrocytes.

A. A schematic diagram illustrating the experimental timeline in which the effects of chemogenetic inhibition of DVC astrocytes to modulate gastric motility and tone were assessed. B. Micrograph illustrating post-hoc identification of microinjection site. C. Representative traces illustrating the effects of KynA on gastric tone and motility following acute HFD exposure in the antrum (left) and corpus (right) in GFAP-hM4DGi rats. Note that 4th ventricular application of CNO attenuated the KynA-mediated decrease in gastric motility and while clozapine had no effect. D. Graphical representation of the effects of DVC microinjection of KynA following 4th ventricular application of CNO or clozapine in GFAP-hM4DGi rats (N=7). CNO significantly attenuated the KynA-mediated decrease in all gastric measures compared to KynA alone while clozapine had no significant effect. *p<0.05, one-way ANOVA with post-hoc Bonferroni multiple comparison test. Data are represented as mean ± SD. E. Representative traces of the effects of KynA on gastric tone and motility following acute HFD exposure in the antrum (left) and corpus (right) in empty vector rats. Note that 4th ventricular application of CNO had no effect on the KynA-mediated decrease in gastric motility and tone. F. Graphical representation of the effects of KynA following 4th ventricular application of CNO in empty vector control rats (N=5). Following acute HFD exposure, DVC microinjection of KynA produced a significant decrease in antrum (top) and corpus (bottom) motility (left) and tone (right). No significant differences were observed between CNO and KynA and KynA alone in any gastric measure. *p<0.05, two-tailed paired Student’s T-Tests. Data are represented as mean ± SD.
In GFAP-hM4DGi rats exposed to an acute HFD, 4th ventricular application of CNO significantly attenuated the KynA-mediated decrease in tone and motility in the antrum and corpus while clozapine had no effect (Figure 4C,D; Table 2). Significant main effects were observed in antrum motility, antrum tone, corpus motility, and corpus tone with a one-way ANOVA (antrum motility: F(2,13)=34.311, p=<0.001, antrum tone: F(2,13)=5.607, p=0.018, corpus motility: F(2,16)=15.984, p=<0.001, corpus tone: F(2,16)=5.442, p=0.016). Subsequent targeted contrast analyses determined that CNO significantly attenuated the KynA-mediated decrease in all gastric measures compared to KynA alone (antrum motility: −3.0±20.3% vs. −75.0±12.2%, p<0.001, 95% C.I.=−98.95, −42.04, antrum tone: −27.8±48.3mg vs. −134.4±81.4mg, p=0.023, 95% C.I.=−118.45, −13.60, corpus motility: −17.3±8.3% vs. −80.0±17.4%, p<0.001, 95% C.I.=−94.68, −30.72, corpus tone:−27.6±126.3mg vs. −137.8±68.2mg, p=0.046, 95% C.I.=−218.87, −1.46: via post-hoc Bonferroni multiple comparison test). Clozapine had no significant effect on the KynA-mediated decrease in all gastric measures compared to KynA alone (antrum motility: −73.5±18.2% vs. −75.0±12.2%, p=1.000, 95% C.I.=−31.10, 28.08, antrum tone: −119.8±30.0mg vs. −134.4±81.4mg, p=1.000, 95% C.I.=−118.45, 89.25, corpus motility: −73.4±31.4% vs. −80.0±17.4%, p=1.000, 95% C.I.=−41.64, 28.43, corpus tone: −157.4±12.8mg vs. −137.8±68.2mg, p=1.000, 95% C.I. =−99.53, 138.64; via post-hoc Bonferroni multiple comparison test, Figure 4C,D, Table 2).
Table 2:
Effects of chemogenetic astrocyte inhibition on gastric tone and motility
| Antrum | Corpus | ||||
|---|---|---|---|---|---|
| Condition | Treatment | Motility | Tone | Motility | Tone |
| GFAP-hM4DGi | KynA Alone | −75±12.2% | −134±81.4mg | −80±17.4% | −138±68.2mg |
| CNO+KynA | −3±20.3%* | −28±48.3mg* | −17±8.3%* | −28±126.3mg* | |
| Clozapine+KynA | −73±18.2% | −120±30.0mg | −73±31.4% | −157±12.8mg | |
| empty vector | KynA Alone | −73±15.7% | −61±30.8mg | −82±12.4% | −118±53.2mg |
| CNO+KynA | −70±11.9% | −100±48.2mg | −75±16.0% | −153±110.4mg | |
p<0.05, one-way ANOVA with post-hoc Bonferroni multiple comparison test
In rats transfected with the empty vector, two-tailed paired Student’s T-Tests were used to examine the effects of CNO on the KynA-mediated decrease in tone and motility of the antrum and corpus compared to KynA alone. No significant differences were observed between CNO + KynA and KynA alone in any gastric measure (antrum motility: −69.8±11.9% vs. −73.0±15.7%, t(8)=−0.358, p=0.730, 95% C.I.=−23.46, 17.16, antrum tone: −100.2±48.2mg vs. −60.8±30.8mg, t(8)=1.541, p=0.162, 95% C.I.=−19.56, 98.38, corpus motility: −74.73±16.0% vs. −81.7±12.4, t(8)=−0.766, p=0.465, 95% C.I.=−27.82, 13.94, corpus tone: −153.3±110.4mg vs. −117.7±53.2mg, t(8)=0.649, p=0.534, 95% C.I.=−90.77, 161.89: Figure 4E,F, Table 2).
These results indicate that, following acute HFD exposure, astrocyte activity drives the glutamate-mediated increase in gastric tone and motility.
Pharmacological inhibition of astrocytes attenuates NMDA-receptor mediated signaling
Acute HFD exposure uncovers the activation of synaptic NMDA receptors (Clyburn et al., 2018). Under control conditions, glutamatergic transmission from NTS-DMV neurons is mediated by activation of AMPA receptors only, and the NMDA receptor antagonist, AP5, has no significant effect on the frequency or charge transfer of miniature excitatory postsynaptic currents (mEPSCs; i.e. action potential independent release of neurotransmitter; frequency: 99.1±3.84% of baseline; charge transfer: 99.2±9.61% of baseline, N=12 neurons from 4 rats; Figure 5B,D,E). Following acute HFD, however, AP5 significantly inhibits glutamatergic transmission, with the majority of glutamatergic current mediated via NMDA receptor activation (Clyburn et al., 2018; Clyburn et al., 2021) (acute HFD frequency: 71.4±9.30% of baseline, t(28)=7.244, p=<0.001, 95% C.I.=22.422, 40.849; acute HFD charge transfer: 73.4±18.42% of baseline, t(28)=4.663, p=<0.001, 95% C.I.=15.686, 41.605; N=20 neurons from 8 rats; two-tailed unpaired Student’s T-Test: Figure 5C,D,E).
Figure 5: Effects of FA and AP5 on mEPSCs from gastric-projecting DMV neurons.

A. A schematic diagram illustrating the experimental design for experiments in which the effects of pharmacological inhibition of astrocytes was assessed on DMV neurons. B. AP5 had no effect on mEPSC frequency in a control DMV neuron voltage clamped at −50mV (summarized in the cumulative fraction graph to the right). C. AP5 decreased mEPSC frequency in an acute HFD DMV neuron (summarized in the cumulative fraction graph to the right). D, E. Graphical summary of the effects of AP5 on mEPSCs frequency (D) and charge transfer (E) in control (black) and acute HFD (blue) DMV neurons. AP5 had no effect on mEPSC frequency and charge transfer in control DMV neurons (N=12 neurons from 4 rats), but decreased mEPSC frequency and charge transfer in acute HFD DMV neurons (N=20 neurons from 8 rats; *p<0.05, two-tailed unpaired Student’s T-Test. Data are represented as mean ± SD. F. Acute perfusion with FA decreased mEPSC frequency and occluded the inhibitory effect of subsequent perfusion with AP5 in an acute HFD DMV neuron (summarized in the sample cumulative fraction graph, right). G. In contrast, acute perfusion with FA had no effect on mEPSC frequency in a control DMV neuron (summarized a sample cumulative fraction graph, right). H. Graphical summary of the time-dependent effects of acute perfusion with FA to decrease mEPSC frequency in acute HFD (N=8 neurons from 3 rats), but not control DMV neurons (N=6 neurons from 4 rats). Note that FA perfusion occluded the effects of subsequent application of AP5 to inhibit mEPSCs in acute HFD neurons. I, J, Graphical summary of the effects of FA to reduce mEPSC frequency (I) and charge transfer (J) in acute HFD (N=8 from 4 rats) but not control (N=6 from 3 rats) DMV neurons. FA also occluded the effects of subsequent AP5 application to reduce mEPSC frequency and charge transfer in HFD DMV neurons. *p<0.05, one-way ANOVA with post-hoc Bonferroni multiple comparison test. Data are represented as mean ± SD. K, L, Graphical summary of the effects of AP5 to decrease mEPSC frequency (K) and charge transfer (L) in acute HFD neurons following pharmacological inhibition of brainstem astrocytes. Following both acute (20min; light blue) and long-term (1–2hr pre-incubation; dark blue) perfusion with FA, AP5 was no longer able to inhibit mEPSC frequency and charge transfer; there was no significant difference between acute FA and FA pre-incubation (acute FA, N=8 neurons from 4 rats. FA pre-incubation, N=8 neurons from 3 rats). M, N, Graphical summary of the effects of FA to inhibit NMDA mEPSC frequency (M) and charge transfer (N). Following perfusion with DNQX which itself decreased mEPSC frequency and charge transfer, perfusion with FA decreased the frequency and charge transfer of NMDA mEPSCs (*p<0.05, two-tailed unpaired Student’s T-Test. Data are represented as mean ± SD).
To determine if astrocyte activity is responsible for this synaptic plasticity following acute HFD exposure, the AP5-mediated decrease in miniature excitatory postsynaptic current (mEPSC) frequency and charge transfer was assessed after pharmacological brainstem astrocyte inhibition (Figure 5F). In acute HFD DMV neurons, inhibition of brainstem astrocytes decreased mEPSC frequency and charge transfer with maximum inhibition observed within 10min, and subsequent application of AP5 had no additional effect to inhibit glutamatergic transmission (Figure 5H). Pre-incubation (1–2hrs) of brainstem slices with FA prevented AP5 from decreasing glutamatergic transmission (Figure 5I,J). In contrast, in control conditions, neither AP5 nor FA had a significant effect on mEPSC frequency and charge transfer (Figure 5G–J) The effects of FA and AP5 on mEPSC frequency and charge transfer were assessed in control and acute HFD DMV neurons with a one-way ANOVA and a significant effect was observed (frequency: F(2,23)=63.795, p=<0.001, charge transfer: F(2,23)=22.708, p=<0.001). Post-hoc Bonferroni multiple comparison tests identified a significant difference in the effects of FA on mEPSC frequency and charge transfer between control and HFD DMV neurons (frequency: 106.3±25.10% of baseline vs. 42.7±16.65% of baseline, p=<0.001, 95% C.I.=41.025, 72.647, charge transfer: 104.5±27.94 of baseline vs. 50.0±20.17% of baseline, p=<0.001, 95% C.I.=26.458, 70.684). There was no significant difference between the effects of FA and FA+AP5 on mEPSC frequency and charge transfer in HFD DMV neurons (frequency: 42.7±16.65% of baseline vs. 40.3±15.75% of baseline, p=1.000, 95% C.I.=−12.931, 20.401, charge transfer: 50.0±20.17% of baseline vs. 52.90±11.48% of baseline, p=1.000, 95% C.I.=−24.254, 22.365: post-hoc Bonferroni multiple comparison test; Figure 5I,J).
To confirm the involvement of activated astrocytes in the upregulation of glutamatergic transmission, the effects FA on electrically evoked EPSCs (eEPSCs) were assessed on synaptic NMDA-mediated currents specifically at the NTS-DMV synapse (Figure 6). As shown previously (Clyburn et al., 2018), application of AP5 significantly decreased the amplitude of eEPSCs following acute HFD, whereas AP5 had no effect in control DMV neurons (Figure 6A–C). A two-way repeated measures ANOVA was used to assess the effects of AP5 and DNQX (within group variables) in control and HFD neurons (between group variables) and a significant main effect was observed (F(1,10)=211.214, p=<0.001). In control neurons, AP5 had no effect on eEPSC amplitude (92.9±3.80% of baseline) but subsequent addition of DNQX significantly reduced the evoked glutamatergic transmission (18.8±15.96% of baseline, t(5)=12.449, p=<0.001, 95% C.I.=58.757, 89.337, two-tailed paired Student’s T-Test). In acute HFD DMV neurons, AP5 significantly decreased eEPSC amplitude (50.6±14.81% of baseline) and further addition of DNQX abolished evoked glutamatergic transmission (17.1±7.37% of baseline, t(5)=7.608, p=<0.001, 95% C.I.=22.159, 44.774, two-tailed paired Student’s T-Test). The effects of AP5 on eEPSC amplitude were significantly larger in HFD neurons compared to controls (50.6±14.81% of baseline vs. 92.9±3.79% of baseline, t(10)=6.771, p=<0.001, 95% C.I.=28.364, 56.185; two-tailed unpaired Student’s T-Test). FA application also significantly decreased the amplitude of NMDA-mediated eEPSCs following acute HFD exposure. DNQX decreased eEPSC amplitude (71.4±32.65% of baseline) and subsequent application of FA further inhibited the remaining evoked NMDA mediated current, but had no effect in controls (38.5±17.73% of baseline vs. 71.4±32.65% of baseline, t(5)=4.081, p=0.010: two-tailed paired Student’s T-Test, N=6 neurons from 3 rats; Figure 6D,E). Of note, when analyzing the eEPSC decay kinetics, a one-way ANOVA detected a difference between baseline vs DNQX vs DNQX+FA where DNQX increased the kinetics of evoked current decay (131±11.0% of baseline; 3.80±1.55 vs 4.99±2.15ms) which is to be expected as NMDA currents are typically slower than AMPA mediated currents, while subsequent perfusion with FA decreased evoked NMDA current decay (78±13.09% of currents in the presence of DNQX; 3.85±01.67ms; F(2,17)=29.50 p=0.014) again suggesting that FA is selectively blocking NMDA-receptor mediated currents.
Figure 6: Pharmacological inhibition of astrocytes attenuates evoked activation of NMDA receptors in acute HFD DMV neurons.

A. Electrical stimulation of the adjacent NTS was used to evoke EPSCs (eEPSCs) in control DMV neurons voltage clamped at =−50mV. Perfusion with AP5 had no effect on eEPSC amplitude, but further addition of DNQX abolished evoked glutamatergic transmission. B. In an acute HFD DMV neuron, perfusion with AP5 significantly inhibited eEPSC amplitude, which was abolished completely by further addition of DNQX. C. Graphical summary of the effects of AP5 and DNQX to inhibit glutamatergic transmission in control and acute HFD DMV neurons. Two-way ANOVA with targeted contrasts: *p<0.05, two-tailed paired Student’s T-Test. Data are represented as mean±SD. D. In an acute HFD DMV neuron, perfusion with DNQX decreased, but did not abolish, eEPSC amplitude (middle). Subsequent perfusion with FA decreased the amplitude of the remaining NMDA-receptor mediated eEPSC (right). E. Graphical summary of the effects of FA to inhibit NMDA receptor mediated currents in acute HFD DMV neurons (N=6 neurons from 3 rats). *p<0.05, two-tailed unpaired Student’s T-Test. Data are represented as mean±SD
To the assess whether the effects of acute HFD to activate astrocytes modulates the DMV neuronal excitability, current clamp recordings were carried out in which the effects of FA on spontaneous action potential firing rate in DMV neurons were assessed (Figure 7). Perfusion with AP5 and FA decreased spontaneous action potential firing in acute HFD DMV neurons (Baseline 1.19±0.24 vs AP5 0.22±0.35 pulse per second (pps) t(14)=5.840, p<0.0001, N=7 neurons from 3 rats; Baseline 1.15±0.33 vs FA 0.13±0.14pps, t(12)=7.628, P<0.0001, N=7 neurons from 3 rats, two-tailed paired Student’s T-Test; Figure 7A,B,D). Perfusion with FA also occluded the ability of AP5 to decrease action potential firing rate (FA 1.22±0.27 vs FA+AP5 1.21±0.37pps, t(12)=0.03251, p=0.9746, N= 7 from 3 rats two-tailed paired Student’s T-Test; Figure 7C,D). Together, these data indicate that inhibition of brainstem astrocytes attenuates the synaptic NMDA-mediated currents observed in DMV neurons following acute HFD and that DVC astrocytes regulate DMV neuronal excitability.
Figure 7: Pharmacological inhibition of astrocytes attenuates the NMDA-mediated effects to increase DMV neuronal excitability following acute HFD.

A. In an acute HFD neuron current clamped at a membrane potential to allow spontaneous action potential (AP) firing frequency of approximately 1 pulse per second (pps), perfusion with AP5 caused a reversible decrease in AP firing rate. B. Perfusion with FA decreased AP firing frequency in an acute HFD DMV neuron. C. In the presence of FA, and after readjustment of the membrane potential to restore AP firing rate, subsequent perfusion with AP5 had no effect on AP firing rate. D. Graphical summary illustrating the effects of AP5 and FA to decrease AP firing rate (N=7 neurons from 3 rats for each); FA occluded the ability of subsequent application of AP5 to decreased AP firing rate (N=6 neurons from 3 rats). *p<0.05, two-tailed paired Students T-test. Data are represented as mean ± SD. E. FA microinjection into the left DMV decreased astrocyte activation in the DMV as assessed by GFAP-IR (left, magenta) and GFAP + ChAT (right, green) in the rostral (upper) and intermediate (lower) DMV. Scale bar = 150μm. F. After electrophysiological recording, Neurobiotin was injected into DMV neurons to allow post-hoc localization of neuronal morphology (green) relative to astrocytes (GFAP-IR, magenta). Note the dense network of astrocytes surrounding the recorded neurons. Scale bare = 50μm.
To substantiate the actions of FA to inhibit brainstem astrocytes, FA (100pmol/60nl) was microinjected into the left DMV (PBS injected into the right DMV) of an anesthetized rat 2hrs prior to fixation of the brainstem and processing for immunohistochemical localization of GFAP (Figure 7D). Finally, to confirm the close association of astrocytes and DMV neurons, at the conclusion of electrophysiological recording, Neurobiotin was injected into the DMV neuron to allow post-hoc confirmation of neuronal morphology and association with GFAP-IR astrocytes (Figure 7E).
These data suggest that, following acute HFD exposure, activation of brainstem astrocytes increases the efficacy of NTS-DMV glutamatergic transmission via activation of synaptic NMDA receptors on gastric-projecting DMV neurons, which has a significant effect to increase the excitability of gastric projecting vagal efferent motoneurons.
Chemogenetic inhibition of astrocytes attenuates the activation of NMDA receptors
The involvement of DMV astrocyte activity in the upregulation of NMDA-receptor mediated glutamatergic transmission following acute HFD was also assessed using chemogenetic strategies. Electrophysiological recordings were made in brainstem slices from rats that had previously undergone unilateral viral transfection of GFAP-hM4DGi (left side) and the empty vector (right side). Subsequent recordings from acute HFD DMV neurons in the proximity of mCherry labeled astrocytes revealed that neither perfusion of CNO in the empty vector DMV, nor perfusion with clozapine in the GFAP-hM4DGi DMV had any effect on glutamatergic transmission and did not affect the subsequent decrease in mEPSC frequency and charge transfer observed in response to AP5 application (Figure 8A,B). In contrast, bath application of CNO decreased mEPSC frequency and charge transfer in GFAP-hM4DGi DMV neurons, and occluded any further effects from AP5 application (Figure 8C).
Figure 8: Chemogenetic inhibition of astrocytes attenuates the acute HFD-induced activation of NMDA receptors.

A. Perfusion with CNO had no effect on mEPSC frequency, and did not attenuate the actions of AP5 to decrease glutamatergic transmission (summarized cumulative fraction graph below), in an acute HFD DMV neuron following transfection with the empty DREADD vector. B. Perfusion with clozapine had no effect on mEPSC frequency, and did not attenuate the actions of AP5 to decrease glutamatergic transmission (summarized cumulative fraction graph below), in an acute HFD DMV neuron following GFAP-hM4DGi transfection. C. In contrast, in the GFAP-hM4DGi transfected DMV of an acute HFD rat, perfusion with CNO decreased mEPSC frequency, and occluded subsequent inhibitory actions of AP5 (summarized in the cumulative fraction graph below). D. Perfusion with the selective synaptic NMDA receptor antagonist, MK801 decreased mEPSC frequency and occluded the effects of subsequent application of CNO to decrease glutamatergic transmission (summarized in the cumulative fraction graph below) in an acute HFD DMV neuron from a GFAP-hM4DGi transfected rat F. G. Graphical summary of the effects of chemogenetic inhibition of astrocytes and AP to inhibit mEPSC frequency (F) and charge transfer (G) in acute HFD DMV neurons from empty vector+CNO (N=9 neurons from 4 rats), GFAP-hM4DGi+clozapine (N= 9 neurons from 4 rats), GFAP-hM4DGi+CNO transfected rats (N=8 neurons from 6 rats) as well as the effects of MK801 to occlude subsequent actions of CNO in GFAP-hM4DGi transfected rats (N= 8 neurons from 6 rats). Two-way ANOVA with targeted contrasts: #p<0.05, one-way ANOVA with post-hoc Bonferroni multiple comparison test, *p<0.05, two-tailed unpaired Student’s T-Test. Data are represented as mean±SD. G. In an empty vector transfected acute HFD rat, a DMV neuron was current clamped at a potential that allowed spontaneous action potential (AP) firing of approximately 1 pulse per second (p.p.s). CNO perfusion had no effect on AP firing rate and did not prevent subsequent application of AP5 to inhibit firing. H Similarly, in a GFAP-hM4DGi transfected acute HFD DMV neuron, clozapine perfusion had no effect on AP firing rate and did not affect the ability of AP5 to decrease firing frequency. I. In contrast, in a GFAP-hM4DGi transfected rat, perfusion with CNO decreased AP firing; following adjustment of the membrane potential to restore action potential firing rate (arrow), subsequent application of AP5 had no effect on firing rate. J. Graphical summary of the effects of chemogenetic inhibition of DVC astrocytes on AP firing in acute HFD DMV neurons from empty vector+CNO (N=7 neurons from 4 rats), GFAP-hM4DGi+clozapine (N=6 neurons from 5 rats), and GFAP-hM4DGi+CNO transfected rats (N=6 neurons from 4 rats). Two-way ANOVA with targeted contrasts: #p<0.05, one-way ANOVA with post-hoc Bonferroni multiple comparison test, *p<0.05, two-tailed unpaired Student’s T-Test. Data are represented as mean±SD).
A two-way repeated measures ANOVA was used to assess the effects of AP5 and CNO or clozapine (within group variable) on mEPSC frequency and charge transfer in DMV neurons from rats transfected with the empty vector (left side) and GFAP-hM4DGi construct (right side; between group variable) and a significant main effect was observed (frequency: F(1,23)=25.668, p=<0.001, charge transfer: F(1,23)=12.413, p=0.002; Figure 8E,F). Targeted contrasts with one-way ANOVAs revealed a significant difference between the GFAP-hM4DGi+CNO group and the empty vector+CNO (frequency: p=0.008, 95% C.I.=−29.373, −3.851, charge transfer: p=0.002, 95% C.I.=−37.89, −9.689) and GFAP-hM4DGi+clozapine groups (frequency: p=0.021, 95% C.I.=−27.408, −1.886, charge transfer: p=0.018, 95% C.I.=−31.483, −3.281). CNO significantly reduced mEPSC frequency and charge transfer in DMV neurons from GFAP-hM4DGi rats while clozapine had no effect (frequency: 61.7±10.65% of baseline vs. 96.7±7.08% of baseline, p=<0.001, 95% C.I.=−52.759, −17.057, charge transfer: 58.3±13.92% of baseline vs. 95.3±12.62% of baseline, p=<0.001, 95% C.I.=−56.291, −17.700). CNO administration to empty vector rats was similarly without effect (frequency: 95.6±19.83% of baseline, p=<0.001, 95% C.I.=−51.714, −16.012, charge transfer: 102.5±21.801% of baseline, p=<0.001, 95% C.I.=−59.427,−20.836).
To confirm that the astrocyte-mediated upregulation of NMDA receptor mediated glutamatergic transmission modulates DMV neuronal excitability, the effects of chemogenetic inhibition of astrocytes on action potential firing rate were assessed. A two-way repeated measures ANOVA was used to assess the effects of CNO or clozapine (within group variable) on AP firing rate in DMV neurons from rats transfected with the empty vector (left side) and GFAP-hM4DGi construct (right side; between group variable) and a significant main effect was observed (F(1,18)=11.25, p=0.004, Figure 8J). Targeted contrasts with one-way ANOVAs revealed a significant decrease in AP firing rate between the GFAP-hM4DGi with perfusion of CNO and empty vector controls with CNO (p<0.001, 95% C.I.=0.3128, 1.040) as well as GFAP-hM4DGi with clozapine perfusion (p=0.011, 95% C.I.=0.089, 0.816). Targeted contrasts with one-way ANOVAs also revealed that neither perfusion with CNO in empty vector rats (N=7 neurons from 4 rats) nor perfusion with clozapine in GFAP-hM4DGi rats (N= 6 neurons from 5 rats) altered action potential firing rate in acute HFD DMV neurons (empty vector and CNO: 1.05±0.26 vs 1.01±0.26pps, p=0.950, 95% C.I.= −0.2831, 0.3593, GFAP-hM4DGi and clozapine: 0.91±0.27 vs 0.79±0.18pps, p=0.512, 95% C.I.=−0.1584, 0.4060), and did not altered the ability of AP5 to decrease firing rate (empty vector and CNO: 1.05±0.26 vs 0.10±0.16pps, p<0.001, 95% C.I.=0.6181, 1.287 GFAP-hM4DGi and clozapine: 0.84±0.12 vs 0.07±0.12pps, p<0.001, 95% C.I.=0.5483, 1.136 Figure 7 G,H,J). In contrast, perfusion of GFAP-hM4DGi rats with CNO 9 N=7 neurons from 4 rats) decreased action potential firing rate (0.91±0.26 vs 0.34±0.26pps t(6)=3.773 p=0.009, 95% C.I.= −0.9420, −0.2009, Figure 7I,J). After readjusting the injected current to restore baseline action potential firing, perfusion with AP5 no longer had any effect on action potential firing (0.89±0.19 vs 0.99±0.24pps t(6)=2.818, p=0.037, 95% C.I.=0.0088, 0.1912, Figure 7I,J).
These data confirm that acute HFD exposure causes the activation of brainstem astrocytes resulting in activation of synaptic NMDA receptors on gastric projecting DMV neurons and the resulting modulation of vagal efferent neuronal excitability.
Acute HFD-induced activation of NMDA receptors is dependent upon activation of metabotropic glutamate and purinergic receptors.
In order to identify the potential gliotransmitters that may be involved in the acute HFD-dependent activation of synaptic NMDA receptors on DMV neurons, the effects of AP5 on mEPSC frequency and charge transfer in HFD neurons were assessed after perfusion with the group 1 metabotropic glutamate receptor (mGluR) antagonist, AIDA, or the purinergic P2X receptor antagonist, PPADS. Neither AIDA nor PPADS had any effect on mEPSC frequency or charge transfer, but both prevented the ability of AP5 to decrease glutamatergic transmission in acute HFD DMV neurons (Figure 9A–D). A two-way repeated measures ANOVA was used to assess the effects of AIDA or PPADs and subsequent AP5 application (within group variable) on mEPSC frequency and charge transfer in HFD DMV neurons (between group variable is between ATP groups and mGluR groups). No significant effects were found on mEPSC frequency or charge transfer (frequency: F(1,16)=1.970, p=0.180, charge transfer: F(1,16)=1.54, p=0.234). Perfusion with the group I mGluR antagonist, AIDA, had no effect on mEPSC frequency and charge transfer (frequency: 108.6±21.92% of baseline, charge transfer: 101.2±27.93% of baseline) but prevented subsequent perfusion with AP5 from decreasing mEPSC frequency and charge transfer (frequency: 92.66±25.37% of baseline, t(9)=−.073, p=0.431, 95% C.I.=−22.679, 21.319, charge transfer: 89.4±33.36% of baseline, t(9)=1.546, p=0.157, 95% C.I.=−5.445, 28.949; two-tailed paired Student’s T-Test, N = 10 neurons from 6 rats). Similarly, perfusion with the P2X receptor antagonist, PPADS, had no effect on mEPSC frequency and charge transfer (frequency: 104.6±13.72% of baseline, charge transfer: 104.2±26.4% of baseline) but prevented subsequent perfusion with AP5 from decreasing mEPSC frequency and charge transfer (frequency: 104.2±26.4% of baseline, t(7)=−.835, p=0.944, 95% C.I.=−47.143, 22.533, charge transfer: 98.1±28.40% of baseline, t(7)=1.721, p =0.129, 95% C.I.=−4.368, 27.718; two-tailed paired Student’s T-Test, N = 8 neurons from 3 rats).
Figure 9: Acute HFD-induced activation of NMDA receptors is dependent upon activation of metabotropic glutamate and purinergic receptors.
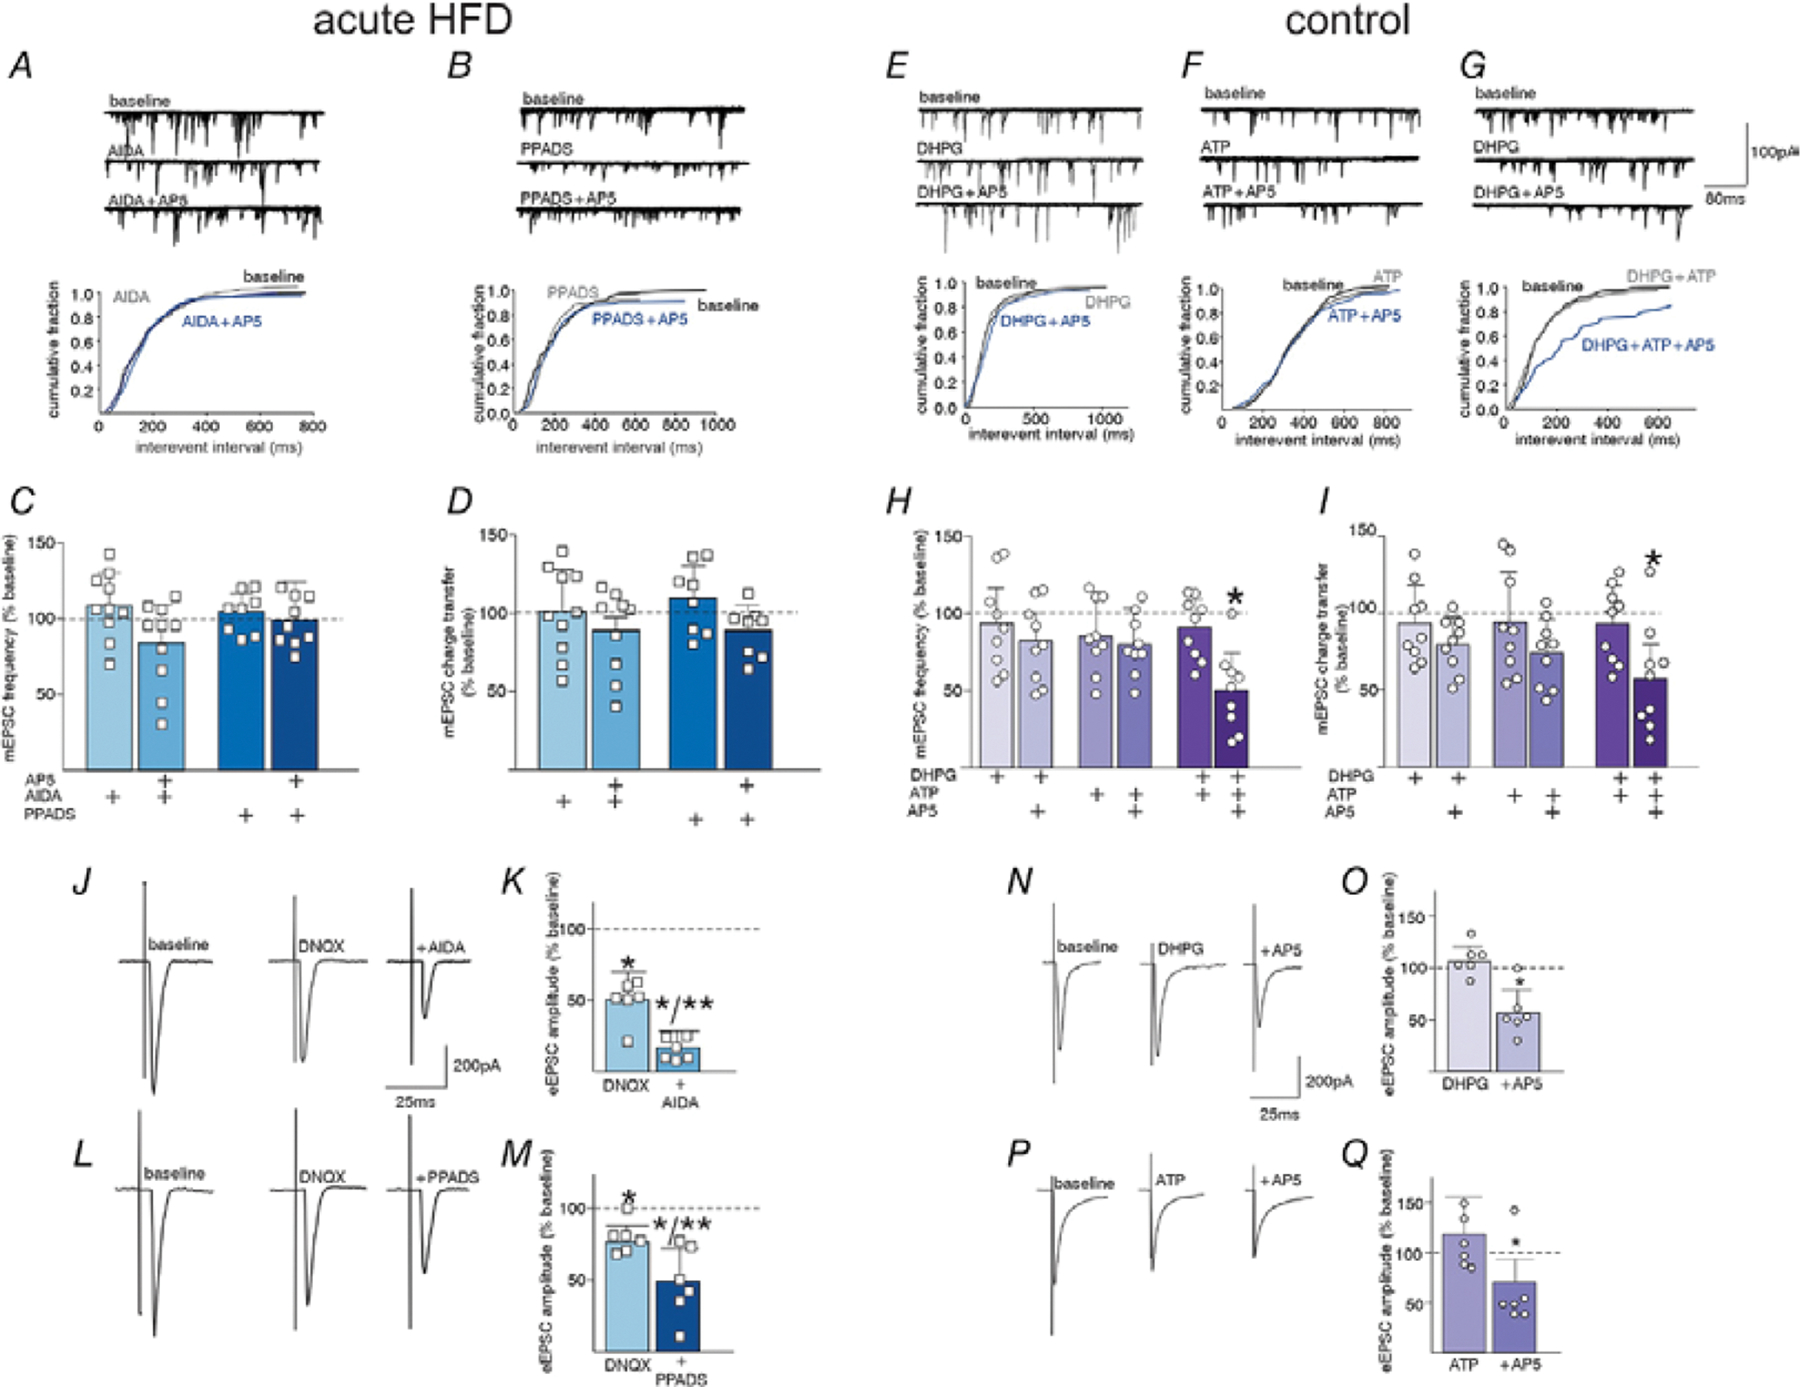
A. In an acute HFD DMV neuron, perfusion with the group I mGluR receptor antagonist, AIDA, prevented AP5 from decreasing mEPSC frequency (summarized by the cumulative fraction graph below). B. Similarly, perfusion with the P2X receptor antagonist, PPADS prevented the ability of AP5 to decease mEPSC frequency (summarized in the cumulative fraction graph below). C, D. Graphical summary of the effects of antagonists to block AP5 mediated effects on mEPSC frequency (C.) and charge transfer (D.) (N=10 neurons from 6 rats and N=8 neurons from 3 rats for AIDA and PPADS, respectively; two-way ANOVA with targeted contrasts: *p<0.05, one-way ANOVA with post-hoc Bonferroni multiple comparison test or two-tailed paired Student’s T-Test. Data are represented as mean±SD). E. In a control DMV neuron, perfusion with DHPG did not uncover any AP5-mediated decrease in mEPSC frequency (cumulative fraction graph below). F. Similarly, perfusion with the ATP did not uncover any AP5-mediated decrease in mEPSC frequency (cumulative fraction graph below). G. In contrast, perfusion both DHPG and ATP uncovered inhibitory effects of AP5 (cumulative fraction graph below). H. I. Graphical summary of the effects of agonists perfusion to uncover AP5 mediated inhibition of mEPSC frequency (H.) and charge transfer (I.) (DHPG, 3/9 neurons from 3 rats; ATP, 5/9 neurons from 3 rats; DHPG+ATP 8/9 neurons from 3 rats. Two-way ANOVA with targeted contrasts: *p<0.05, one-way ANOVA with post-hoc Bonferroni multiple comparison test or two-tailed paired Student’s T-Test. Data are represented as mean±SD). J. In an acute HFD DMV neuron, perfusion with DNQX was used to isolate an NMDA receptor mediated glutamate current, which was inhibited by subsequent perfusion with AIDA. K. Graphical summary of the effects of a AiDA to block NMDA receptor mediated eEPSCs. (N=6 neurons from 4 rats) L. Perfusion with DNQX decreased eEPSC amplitude and subsequent perfusion with PPADS inhibited the remaining evoked NMDA current. M. Graphical summary of the effects of PPADS to block NMDA receptor mediated eEPSCs (N=6 neurons from 3 rats). N. In a control DMV neuron, perfusion with DHPG uncovered the ability of AP5 to inhibit NMDA receptor mediated eEPSCs. O. Graphical summary of the effects of the DHPG, to uncover NMDA receptor mediated transmission in control DMV neurons (N=6 neurons from 3 rats; *p<0.05, two-tailed paired Student’s T-Test. Data are represented as mean±SD). P. In a control DMV neuron, perfusion with ATP uncovered the ability of AP5 to inhibit NMDA receptor mediated eEPSCs. Q. Graphical summary of the effects of ATP, to uncover NMDA receptor mediated transmission in control DMV neurons. (N=6 neurons from 3 rats) *p<0.05, two-tailed paired Student’s T-Test. Data are represented as mean±SD
To determine if the effects of AP5 can be uncovered in rats on a control diet, the effects of the receptor agonists were assessed. The group 1 mGluR receptor agonist, DHPG and the P2X receptor agonist, ATP uncovered the ability of AP5 to decrease synaptic NMDA mediated responses in only a minority of control DMV neurons. Simultaneous perfusion with both agonists, however, uncovered the AP5-mediated decreased mEPSC frequency and charge transfer in the majority of neurons (Figure 9E–I). A two-way repeated measures ANOVA was used to assess the effects of effects of DHPG, ATP or both DHPG and ATP and subsequent AP5 application (within subjects variable) on mEPSC frequency and charge transfer in control DMV neurons (between subjects variables are between ATP alone, DHPG alone, and ATP + DHPG) and a significant main effect was observed (frequency: F(1,24)=6.895, p=0.015, charge transfer: F(1,24)=12.013, p=0.002). Targeted contrast analyses with a one-way ANOVA and post-hoc Bonferroni multiple comparison test uncovered a significant difference in the effects of AP5 after ATP + DHPG compared to ATP alone (frequency: 51.2±25.91% of baseline vs. 82.3±25.85% of baseline, p=0.027, 95% C.I.=−61.203,−3.040, charge transfer: 49.6±23.13% of baseline vs. 73.9±22/33% of baseline, p=0.023, 95% C.I.=−44.921, 31.402) and DHPG alone (frequency: 51.2±25.91% of baseline vs. 80.3±19.51% of baseline, p=0.041, 95% C.I.=−59.133, −1.030, charge transfer: 49.6±23.13% of baseline vs. 79.6.3±17.85% of baseline, p=0.006, 95% C.I.=−50.564, −9.251). Perfusion with DHPG or ATP alone uncovered the inhibitory effects of AP5 only in a minority of neurons (DHPG frequency: 3/9 neurons from 3 rats; group mean=80.3±19.51% of baseline; ATP frequency: 3/9 neurons from 3 rats; group mean=82.34±25.85% of baseline, respectively, DHPG charge transfer: 3/9 neurons from 3 rats; group mean=79.6±17.84% of baseline; ATP charge transfer: 5/9 neurons from 3 rats; group mean=73.9±22.33% of baseline, respectively) with no significant group effect (DHPG frequency: t(8)=0.481, p=0.643, 95% C.I.=−18.917, 28.900 and ATP frequency: t(8)=0.748, p=0.476, 95% C.I.=−23.704, 46.453, DHPG charge transfer: t(8)=1.916, p=0.092, 95% C.I.=−2.806, 30.401 and ATP charge transfer: t(8)=1.392, p=0.201, 95% C.I.=−17.318, 70.084; two-tailed paired Student’s T-Test). Perfusion with both DHPG and ATP, however, uncovered inhibitory effects of AP5 in the majority of control DMV neurons (frequency: 8/9 neurons from 3 rats; 49.6±23.13% of baseline t(8)=3.514, p=0.008, 95% C.I.=14.0157, 67.542, charge transfer: 49.65±23.13% of baseline, t(8)=3,330, p=0.010, 95% C.I.=13.311, 73.267).
The involvement of group 1 mGluR and P2X receptors in specifically NTS-DMV mediated NMDA-dependent glutamatergic transmission were confirmed in a further series of experiments in which their effects on eEPSCs were examined. After isolation of NMDA currents via perfusion with DNQX, application of either AIDA or PPADS significantly decreased the amplitude of evoked NMDA currents in acute HFD neurons (Figure 9J,L). Perfusion with DNQX decreased eEPSC amplitude (68.1±20.19% of baseline) and subsequent perfusion with AIDA inhibited the remaining evoked NMDA current (19.0±13.49% of baseline, t(5)=6.060, p=0.002, 95% C.I.=28.244, 69.862: N=6 neurons from 4 rats; two-tailed paired Student’s T-Test). Similarly, perfusion with DNQX decreased eEPSC amplitude (77.8±11.82% of baseline) and subsequent perfusion with PPADS inhibited the remaining evoked NMDA current (48.4±24.87% of baseline, t(5)=2.045, p=0.048, 95% C.I.=7.550, 66.303: N=6 neurons from 3 rats; two-tailed paired Student’s T-Test; Figure 9K.M).
In neurons from rats on a control diet, perfusion with DHPG or ATP uncovered the AP5-mediated decrease in evoked glutamate currents. Following perfusion with DHPG (which itself had no effect on eEPSC amplitude: 106.8±16.45% of baseline) application of AP5 decreased eEPSC amplitude (56.9±23.51% of baseline, t(10)=4.255, p=0.002, 95% C.I.=23.747, 75.951; N=6 neurons from 3 rats; two-tailed paired Student’s T-Test; Figure 9N,O). Similarly, following perfusion with ATP, (which itself had no effect on eEPSC amplitude: 116.69±39.43% of baseline) application of AP5 decreased eEPSC amplitude (55.5±22.04% of baseline; t(5)=4.051, p=0.010; N=6 neurons from 3 rats; two-tailed paired Student’s T-Test Figure 9P,Q).
These results suggest that, following acute HFD, the resulting increase in NTS-DMV glutamatergic transmission via activation of synaptic NMDA receptors occurs following release of the gliotransmitters glutamate and ATP and the subsequent activation of group I mGluR and P2X receptors on gastric projecting DMV neurons.
Discussion
The results from the present study suggest that, following acute HFD exposure, astrocyte activation (i) is required for NMDA receptor activation (ii) increases the excitability of gastric-projecting DMV neurons, (iii) is responsible for the glutamate-dependent increase in gastric tone and motility, as well as (iv) the delay in gastric emptying, and (v) is required for the homeostatic regulation of caloric intake. Furthermore, these results indicate DVC astrocytes may (vi) release glutamatergic and purinergic gliotransmitters that activate group 1 mGluR and P2X receptors on DMV neurons.
Under basal conditions, glutamatergic transmission at NTS-DMV synapses is mediated by AMPA receptors with very little, if any, contribution from NMDA receptors due, most likely, to the voltage-dependent Mg2+ block of the NMDA ion channel pore at resting membrane potential (Fellin & Carmignoto, 2004; Jourdain et al., 2007; Lee et al., 2007; Lee et al., 2010; Clyburn et al., 2018). Following acute HFD exposure, however, glutamatergic transmission at NTS-DMV synapses, involves activation of both AMPA and NMDA receptors, even at resting membrane potentials (Clyburn et al., 2018; Clyburn et al., 2021). Furthermore, the activation of synaptic NMDA receptors appears to require the activation of extrasynaptic NMDA receptors¸ which is presumed to cause a local depolarization of sufficient magnitude to relieve the Mg2+ dependent block of the synaptic receptors (Clyburn et al., 2021).
Extrasynaptic NMDA receptors may also display a voltage-dependent Mg2+ block, although the extent of this block may depend upon the receptor subunit composition (Jourdain et al., 2007; Lee et al., 2007; Lee et al., 2010). In search of a mechanistic explanation of how acute HFD exposure enables activation of extrasynaptic NMDA receptors, the current study suggests that the gliotransmitters ATP (allowing activation of DMV purinergic receptors) and glutamate (allowing activation of DMV group I metabotropic glutamate receptors) may be a critical component of this postsynaptic signaling cascade (Jourdain et al., 2007; Clyburn & Browning, 2019). In control DMV neurons, application of either agonist alone is sufficient to uncover the activation of synaptic NMDA receptors in response to evoked glutamate release, suggesting either gliotransmitter alone is enough. In contrast, when measuring mEPSC frequency, co-application of both agonists is required to uncover significant activation of synaptic NMDA receptors. Such a discrepancy may reflect the ease to which synaptic NMDA receptor activation can be observed following the co-ordinated (evoked) release of glutamate and/or may reflect more complex neuron-astrocyte signaling cascades. Notably, application of either antagonist to acute HFD neurons is sufficient to block the synaptic NMDA mediated currents when measuring both mEPSCs and eEPSCs, again suggesting the importance of both gliotransmitters. While physically retracting from the synapse or modulating the concentration of extracellular ions cannot be discounted as a means by which astrocytes may be responsible for increased glutamate spillover into the extrasynaptic space (Agulhon et al., 2008; Clyburn & Browning, 2019), gliotransmitter release appears to be a more likely mechanism by which glutamatergic neuroplasticity at the NTS-DMV synapse occurs.
The immunohistochemical outcomes of the present study support our in vitro and in vivo results, confirming that acute (3–5d) of HFD exposure increases astrocyte activation, as assessed via GFAP-immunoreactivity within the DVC. The mechanisms by which HFD exposure initiates DVC astrocyte activation is still, however, unclear. As a circumventricular organ, DVC astrocytes may certainly detect and respond to circulating peripheral factors such as fatty acids, resulting in neuroinflammation and astrocyte activation (Borison, 1989; Lafontan, 2005; Penicaud et al., 2006; Avalos et al., 2018). Changes in circulating factors may also disrupt DVC microglia which, in turn, may then activate local astrocytes (Carson et al., 2006; Lu et al., 2014; Kalin et al., 2015; Gzielo et al., 2017; Avalos et al., 2018; Clyburn & Browning, 2019). Astrocyte-neuron signaling is also known to be bidirectional (Angulo et al., 2004; Penicaud et al., 2006; Jourdain et al., 2007), however, and the activity and responsiveness of vagal afferent neurons and nerve terminals is disrupted after relatively short periods of dietary alterations (Nefti et al., 2009; de Lartigue et al., 2011; Kentish et al., 2012; Waise et al., 2015), suggesting that altered vagal afferent signaling may itself affect brainstem astrocyte function. Of note, the present immunohistochemical results suggest that astrocyte activation is lost after 2wk of HFD exposure and gastric emptying rates return to baseline after 9d of HFD exposure, a time period that corresponds with the loss of caloric regulation and hyperphagia (Buckman et al., 2015; Clyburn et al., 2018; Clyburn et al., 2021).
In the present study, we did not detect any significant astrocyte activation after 1d of HFD exposure when the rats were hyperphagic, a significant difference from that reported previously in which GFAP-IR in the NTS was increased after 12hr (overnight) HFD feeding in mice (MacDonald et al., 2020). While the reasons for these differences are not immediately apparently, and species difference may exist in astrocyte reactivity it is notable that the current study measured GFAP-IR density rather than astrocyte cell number of morphological complexity, which may potentially underestimate HFD-induced changes. Further, MacDonald et al., specifically noted a greater complexity and number of processes of GFAP-IR astrocytes in the postremal NTS, whereas the current study measured GFAP-IR in the NTS and excluded the subpostremal zone.
Of note, our previous studies did not find any significant NMDA receptor activation in DMV neurons at the 1d time point (Clyburn et al., 2018) and, taken together, these results uncover a significant temporal association between astrocyte activation, NMDA receptor activation, and the homeostatic regulation of caloric intake following acute HFD exposure.
Further investigations will be required to determine loss of NMDA mediated signaling is responsible for this loss of energy balance and whether re-activation of DVC astrocytes can re-establish regulation of caloric intake to attenuate, or even prevent the development of hyperphagia and obesity. Of note, chemogenetic activation of brainstem astrocytes has been shown to decrease food intake and induce c-Fos activity in neighboring neurons (MacDonald et al., 2020). Furthermore, the anorectic effects of leptin and GLP-1 may be mediated, at least in part, via activation of DVC astrocytes (Reiner et al., 2016; Stein et al., 2020). In contrast, astrocyte activation (as measured by live cell calcium imaging) is increased by glucoprivation with activity levels restored following restoration of normal glucose levels (McDougal et al., 2013) implying a dynamic role for brainstem astrocytes in food intake and energy balance,
The current study used chemogenetic approaches, both in vivo and in vitro, to study the effects of DMV astrocyte inhibition, an approach that is not without controversy (Shen et al., 2021), given chemogenetic inhibition may have bidirectional effects on astrocytes, with previous studies showing either an increase (Durkee et al., 2019), an attenuation (Kim et al., 2021), or no change (Van Den Herrewegen et al., 2021) in astrocyte calcium transients. There is notable diversity in the type and time course of calcium responses of astrocytes that are mediated via distinct mechanisms, however, (Khakh & Sofroniew, 2015; Paniccia et al., 2022) and astrocyte activity and gliotransmission may be modulated by additional mechanisms, including alterations in gap junctions, transporters, and ion channels (Mazaud et al., 2021; Shen et al., 2021).
As further confirmation that the outcomes observed in this current study were due to DMV astrocyte inhibition, key experiments were replicated using fluoroacetate as a pharmacological inhibitor of astrocyte metabolism. Importantly, these in vivo and in vitro results were qualitatively and quantitatively similar to those obtained using chemogenetic approaches. While the specificity of fluoroacetate (and fluorocitrate) for astrocytes and glial cells is dependent upon the dose and duration of exposure (Hassel et al., 1992; Fonnum et al., 1997), we did not observe any alterations in DMV biophysical or synaptic properties in our experiments following FA perfusion, and the dose and concentration used in the current study are similar or less than those shown elsewhere to have selective astroglial actions (Accorsi-Mendonca et al., 2019; Stein et al., 2020).
Clearly, astrocytes are critically important for plasticity within glutamatergic signaling in the brainstem in response to dietary challenge. Understanding these complex central mechanisms responsible for autonomic homeostasis will be fundamental to understanding and developing novel therapeutic strategies for the treatment of obesity.
Supplementary Material
Key Points.
Initial exposure to a high fat diet is associated with a brief period of hyperphagia before caloric intake and energy balance is restored
This period of homeostatic regulation is associated with a vagally-mediated signaling cascade that increases glutamatergic transmission to dorsal motor nucleus of the vagus (DMV) neurons via activation of synaptic NMDA receptors.
The present study demonstrates that pharmacologic and chemogenetic inhibition of brainstem astrocytes reduced glutamatergic signaling and DMV neuronal excitability, dysregulated gastric motility and tone and emptying, and prevented the regulation of food intake following high fat diet exposure
Astrocyte regulation of glutamatergic transmission to DMV neurons appears to involve release of the gliotransmitters glutamate and ATP
Understanding the mechanisms involved in caloric regulation may provide critical insights into energy balance as well as into the hyperphagia that develops as these mechanisms are overcome.
Acknowledgements
Supported by NIH grant DK 111667 (KNB) and NIH grant DK118833 (CC)
Graphical abstract was created with BioRender.com. We would like to thank F. Holly Coleman for her technical support, particularly with the labeling of gastric-projecting neurons. We would also like to thank W. Nairn Browning as well as Cesare M. and Zoraide Travagli for support and encouragement.
Biography

Dr Courtney Clyburn received her Bachelor’s degree in Biology and Chemistry from Arcadia University before completing her graduate studies in Neuroscience at Penn State College of Medicine in the laboratory of Dr Kirsteen Browning. Her graduate research investigated the mechanistic basis of adaptive neuroplasticity within brainstem circuits in response to acute high fat diet challenge. Currently, she is a postdoctoral research fellow in the laboratory of Dr Beth Habecker at Oregon Health and Sciences University where she is studying neuroplasticity within the stellate ganglion following myocardial infarction.
Footnotes
Declaration of Interests
The authors declare no competing interests
Data Availability
All data will be made available by the corresponding author upon request.
References
- Accorsi-Mendonca D, Bonagamba LGH & Machado BH. (2019). Astrocytic modulation of glutamatergic synaptic transmission is reduced in NTS of rats submitted to short-term sustained hypoxia. J Neurophysiol 121, 1822–1830. [DOI] [PubMed] [Google Scholar]
- Agulhon C, Petravicz J, McMullen AB, Sweger EJ, Minton SK, Taves SR, Casper KB, Fiacco TA & McCarthy KD. (2008). What is the role of astrocyte calcium in neurophysiology? Neuron 59, 932–946. [DOI] [PMC free article] [PubMed] [Google Scholar]
- Angulo MC, Kozlov AS, Charpak S & Audinat E. (2004). Glutamate released from glial cells synchronizes neuronal activity in the hippocampus. J Neurosci 24, 6920–6927. [DOI] [PMC free article] [PubMed] [Google Scholar]
- Araque A, Carmignoto G, Haydon PG, Oliet SH, Robitaille R & Volterra A. (2014). Gliotransmitters travel in time and space. Neuron 81, 728–739. [DOI] [PMC free article] [PubMed] [Google Scholar]
- Astiz M, Pernia O, Barrios V, Garcia-Segura LM & Diz-Chaves Y. (2017). Short-Term High-Fat Diet Feeding Provides Hypothalamic but Not Hippocampal Protection against Acute Infection in Male Mice. Neuroendocrinology 104, 40–50. [DOI] [PubMed] [Google Scholar]
- Avalos Y, Kerr B, Maliqueo M & Dorfman M. (2018). Cell and molecular mechanisms behind diet-induced hypothalamic inflammation and obesity. J Neuroendocrinol 30, e12598. [DOI] [PubMed] [Google Scholar]
- Bang J, Kim HY & Lee H. (2016). Optogenetic and Chemogenetic Approaches for Studying Astrocytes and Gliotransmitters. Exp Neurobiol 25, 205–221. [DOI] [PMC free article] [PubMed] [Google Scholar]
- Belegri E, Eggels L, Unmehopa UA, Mul JD, Boelen A & la Fleur SE. (2018). The effects of overnight nutrient intake on hypothalamic inflammation in a free-choice diet-induced obesity rat model. Appetite 120, 527–535. [DOI] [PubMed] [Google Scholar]
- Beltran-Castillo S, Olivares MJ, Contreras RA, Zuniga G, Llona I, von Bernhardi R & Eugenin JL. (2017). D-serine released by astrocytes in brainstem regulates breathing response to CO2 levels. Nat Commun 8, 838. [DOI] [PMC free article] [PubMed] [Google Scholar]
- Berthoud HR. (2004). Mind versus metabolism in the control of food intake and energy balance. Physiol Behav 81, 781–793. [DOI] [PubMed] [Google Scholar]
- Bhagat R, Fortna SR & Browning KN. (2015). Exposure to a high fat diet during the perinatal period alters vagal motoneurone excitability, even in the absence of obesity. J Physiol 593, 285–303. [DOI] [PMC free article] [PubMed] [Google Scholar]
- Bonansco C, Couve A, Perea G, Ferradas CA, Roncagliolo M & Fuenzalida M. (2011). Glutamate released spontaneously from astrocytes sets the threshold for synaptic plasticity. Eur J Neurosci 33, 1483–1492. [DOI] [PubMed] [Google Scholar]
- Borison HL. (1989). Area postrema: chemoreceptor circumventricular organ of the medulla oblongata. Prog Neurobiol 32, 351–390. [DOI] [PubMed] [Google Scholar]
- Brancaccio M, Patton AP, Chesham JE, Maywood ES & Hastings MH. (2017). Astrocytes Control Circadian Timekeeping in the Suprachiasmatic Nucleus via Glutamatergic Signaling. Neuron 93, 1420–1435 e1425. [DOI] [PMC free article] [PubMed] [Google Scholar]
- Browning KN, Cunningham SM, Duncan L, Timmermans J & Lees GM. (1999). Regional differences in the sympathetic innervation of the guinea pig large intestine by neuropeptide Y- and tyrosine hydroxylase-immunoreactive nerves of divergent extrinsic origin. J Comp Neurol 410, 515–530. [PubMed] [Google Scholar]
- Browning KN & Travagli RA. (2014). Central nervous system control of gastrointestinal motility and secretion and modulation of gastrointestinal functions. Compr Physiol 4, 1339–1368. [DOI] [PMC free article] [PubMed] [Google Scholar]
- Buckman LB, Thompson MM, Lippert RN, Blackwell TS, Yull FE & Ellacott KL. (2015). Evidence for a novel functional role of astrocytes in the acute homeostatic response to high-fat diet intake in mice. Mol Metab 4, 58–63. [DOI] [PMC free article] [PubMed] [Google Scholar]
- Carson MJ, Thrash JC & Walter B. (2006). The cellular response in neuroinflammation: The role of leukocytes, microglia and astrocytes in neuronal death and survival. Clin Neurosci Res 6, 237–245. [DOI] [PMC free article] [PubMed] [Google Scholar]
- Cartier L, Hartley O, Dubois-Dauphin M & Krause KH. (2005). Chemokine receptors in the central nervous system: role in brain inflammation and neurodegenerative diseases. Brain Res Brain Res Rev 48, 16–42. [DOI] [PubMed] [Google Scholar]
- Clyburn C & Browning KN. (2019). Role of astroglia in diet-induced central neuroplasticity. J Neurophysiol 121, 1195–1206. [DOI] [PMC free article] [PubMed] [Google Scholar]
- Clyburn C, Travagli RA, Arnold AC & Browning KN. (2021). DMV Extrasynaptic NMDA Receptors Regulate Caloric Intake in Rats. JCI Insight 6, e139785. [DOI] [PMC free article] [PubMed] [Google Scholar]
- Clyburn C, Travagli RA & Browning KN. (2018). Acute high-fat diet upregulates glutamatergic signaling in the dorsal motor nucleus of the vagus. Am J Physiol Gastrointest Liver Physiol 314, G623–G634. [DOI] [PMC free article] [PubMed] [Google Scholar]
- Collaborators GBDO, Afshin A, Forouzanfar MH, Reitsma MB, Sur P, Estep K, Lee A, Marczak L, Mokdad AH, Moradi-Lakeh M, Naghavi M, Salama JS, Vos T, Abate KH, Abbafati C, Ahmed MB, Al-Aly Z, Alkerwi A, Al-Raddadi R, Amare AT, Amberbir A, Amegah AK, Amini E, Amrock SM, Anjana RM, Arnlov J, Asayesh H, Banerjee A, Barac A, Baye E, Bennett DA, Beyene AS, Biadgilign S, Biryukov S, Bjertness E, Boneya DJ, Campos-Nonato I, Carrero JJ, Cecilio P, Cercy K, Ciobanu LG, Cornaby L, Damtew SA, Dandona L, Dandona R, Dharmaratne SD, Duncan BB, Eshrati B, Esteghamati A, Feigin VL, Fernandes JC, Furst T, Gebrehiwot TT, Gold A, Gona PN, Goto A, Habtewold TD, Hadush KT, Hafezi-Nejad N, Hay SI, Horino M, Islami F, Kamal R, Kasaeian A, Katikireddi SV, Kengne AP, Kesavachandran CN, Khader YS, Khang YH, Khubchandani J, Kim D, Kim YJ, Kinfu Y, Kosen S, Ku T, Defo BK, Kumar GA, Larson HJ, Leinsalu M, Liang X, Lim SS, Liu P, Lopez AD, Lozano R, Majeed A, Malekzadeh R, Malta DC, Mazidi M, McAlinden C, McGarvey ST, Mengistu DT, Mensah GA, Mensink GBM, Mezgebe HB, Mirrakhimov EM, Mueller UO, Noubiap JJ, Obermeyer CM, Ogbo FA, Owolabi MO, Patton GC, Pourmalek F, Qorbani M, Rafay A, Rai RK, Ranabhat CL, Reinig N, Safiri S, Salomon JA, Sanabria JR, Santos IS, Sartorius B, Sawhney M, Schmidhuber J, Schutte AE, Schmidt MI, Sepanlou SG, Shamsizadeh M, Sheikhbahaei S, Shin MJ, Shiri R, Shiue I, Roba HS, Silva DAS, Silverberg JI, Singh JA, Stranges S, Swaminathan S, Tabares-Seisdedos R, Tadese F, Tedla BA, Tegegne BS, Terkawi AS, Thakur JS, Tonelli M, Topor-Madry R, Tyrovolas S, Ukwaja KN, Uthman OA, Vaezghasemi M, Vasankari T, Vlassov VV, Vollset SE, Weiderpass E, Werdecker A, Wesana J, Westerman R, Yano Y, Yonemoto N, Yonga G, Zaidi Z, Zenebe ZM, Zipkin B & Murray CJL. (2017). Health Effects of Overweight and Obesity in 195 Countries over 25 Years. N Engl J Med 377, 13–27. [DOI] [PMC free article] [PubMed] [Google Scholar]
- Covelo A & Araque A. (2018). Neuronal activity determines distinct gliotransmitter release from a single astrocyte. Elife 7, e32237. [DOI] [PMC free article] [PubMed] [Google Scholar]
- Daly DM, Park SJ, Valinsky WC & Beyak MJ. (2011). Impaired intestinal afferent nerve satiety signalling and vagal afferent excitability in diet induced obesity in the mouse. J Physiol 589, 2857–2870. [DOI] [PMC free article] [PubMed] [Google Scholar]
- de Lartigue G, de La Serre CB & Raybould HE. (2011). Vagal afferent neurons in high fat diet-induced obesity; intestinal microflora, gut inflammation and cholecystokinin. Physiol Behav 105, 100–105. [DOI] [PMC free article] [PubMed] [Google Scholar]
- Durkee CA, Covelo A, Lines J, Kofuji P, Aguilar J & Araque A. (2019). Gi/o protein-coupled receptors inhibit neurons but activate astrocytes and stimulate gliotransmission. Glia 67, 1076–1093. [DOI] [PMC free article] [PubMed] [Google Scholar]
- Fellin T & Carmignoto G. (2004). Neurone-to-astrocyte signalling in the brain represents a distinct multifunctional unit. J Physiol 559, 3–15. [DOI] [PMC free article] [PubMed] [Google Scholar]
- Fonnum F, Johnsen A & Hassel B. (1997). Use of fluorocitrate and fluoroacetate in the study of brain metabolism. Glia 21, 106–113. [PubMed] [Google Scholar]
- Guillemot-Legris O, Masquelier J, Everard A, Cani PD, Alhouayek M & Muccioli GG. (2016). High-fat diet feeding differentially affects the development of inflammation in the central nervous system. J Neuroinflammation 13, 206. [DOI] [PMC free article] [PubMed] [Google Scholar]
- Gzielo K, Kielbinski M, Ploszaj J, Janeczko K, Gazdzinski SP & Setkowicz Z. (2017). Long-Term Consumption of High-Fat Diet in Rats: Effects on Microglial and Astrocytic Morphology and Neuronal Nitric Oxide Synthase Expression. Cell Mol Neurobiol 37, 783–789. [DOI] [PMC free article] [PubMed] [Google Scholar]
- Hammond RA & Levine R. (2010). The economic impact of obesity in the United States. Diabetes Metab Syndr Obes 3, 285–295. [DOI] [PMC free article] [PubMed] [Google Scholar]
- Hassel B, Paulsen RE, Johnsen A & Fonnum F. (1992). Selective inhibition of glial cell metabolism in vivo by fluorocitrate. Brain Res 576, 120–124. [DOI] [PubMed] [Google Scholar]
- Jiang Y, Babic T & Travagli RA. (2019). Sex differences in GABAergic neurotransmission to rat DMV neurons. Am J Physiol Gastrointest Liver Physiol 317, G476–G483. [DOI] [PMC free article] [PubMed] [Google Scholar]
- Jourdain P, Bergersen LH, Bhaukaurally K, Bezzi P, Santello M, Domercq M, Matute C, Tonello F, Gundersen V & Volterra A. (2007). Glutamate exocytosis from astrocytes controls synaptic strength. Nat Neurosci 10, 331–339. [DOI] [PubMed] [Google Scholar]
- Kalin S, Heppner FL, Bechmann I, Prinz M, Tschop MH & Yi CX. (2015). Hypothalamic innate immune reaction in obesity. Nat Rev Endocrinol 11, 339–351. [DOI] [PubMed] [Google Scholar]
- Kentish S, Li H, Philp LK, O’Donnell TA, Isaacs NJ, Young RL, Wittert GA, Blackshaw LA & Page AJ. (2012). Diet-induced adaptation of vagal afferent function. J Physiol 590, 209–221. [DOI] [PMC free article] [PubMed] [Google Scholar]
- Khakh BS & Sofroniew MV. (2015). Diversity of astrocyte functions and phenotypes in neural circuits. Nat Neurosci 18, 942–952. [DOI] [PMC free article] [PubMed] [Google Scholar]
- Kim JH, Rahman MH, Lee WH & Suk K. (2021). Chemogenetic stimulation of the Gi pathway in astrocytes suppresses neuroinflammation. Pharmacol Res Perspect 9, e00822. [DOI] [PMC free article] [PubMed] [Google Scholar]
- Lafontan M (2005). Fat cells: afferent and efferent messages define new approaches to treat obesity. Annu Rev Pharmacol Toxicol 45, 119–146. [DOI] [PubMed] [Google Scholar]
- Lee CJ, Mannaioni G, Yuan H, Woo DH, Gingrich MB & Traynelis SF. (2007). Astrocytic control of synaptic NMDA receptors. J Physiol 581, 1057–1081. [DOI] [PMC free article] [PubMed] [Google Scholar]
- Lee MC, Yasuda R & Ehlers MD. (2010). Metaplasticity at single glutamatergic synapses. Neuron 66, 859–870. [DOI] [PMC free article] [PubMed] [Google Scholar]
- Levin BE. (2006). Metabolic imprinting: critical impact of the perinatal environment on the regulation of energy homeostasis. Philos Trans R Soc Lond B Biol Sci 361, 1107–1121. [DOI] [PMC free article] [PubMed] [Google Scholar]
- Levin BE. (2010a). Developmental gene x environment interactions affecting systems regulating energy homeostasis and obesity. Front Neuroendocrinol 31, 270–283. [DOI] [PMC free article] [PubMed] [Google Scholar]
- Levin BE. (2010b). Interaction of perinatal and pre-pubertal factors with genetic predisposition in the development of neural pathways involved in the regulation of energy homeostasis. Brain Res 1350, 10–17. [DOI] [PMC free article] [PubMed] [Google Scholar]
- Littlejohn EL, Espinoza L, Lopez MM, Smith BN & Boychuk CR. (2019). GABAA receptor currents in the dorsal motor nucleus of the vagus in females: influence of ovarian cycle and 5alpha-reductase inhibition. J Neurophysiol 122, 2130–2141. [DOI] [PMC free article] [PubMed] [Google Scholar]
- Lu Y, He M, Zhang Y, Xu S, Zhang L, He Y, Chen C, Liu C, Pi H, Yu Z & Zhou Z. (2014). Differential pro-inflammatory responses of astrocytes and microglia involve STAT3 activation in response to 1800 MHz radiofrequency fields. PLoS One 9, e108318. [DOI] [PMC free article] [PubMed] [Google Scholar]
- MacDonald AJ, Holmes FE, Beall C, Pickering AE & Ellacott KLJ. (2020). Regulation of food intake by astrocytes in the brainstem dorsal vagal complex. Glia 68, 1241–1254. [DOI] [PMC free article] [PubMed] [Google Scholar]
- Mazaud D, Capano A & Rouach N. (2021). The many ways astroglial connexins regulate neurotransmission and behavior. Glia 69, 2527–2545. [DOI] [PubMed] [Google Scholar]
- McDougal DH, Viard E, Hermann GE & Rogers RC. (2013). Astrocytes in the hindbrain detect glucoprivation and regulate gastric motility. Auton Neurosci 175, 61–69. [DOI] [PMC free article] [PubMed] [Google Scholar]
- McMenamin CA, Travagli RA & Browning KN. (2016). Inhibitory neurotransmission regulates vagal efferent activity and gastric motility. Exp Biol Med (Maywood) 241, 1343–1350. [DOI] [PMC free article] [PubMed] [Google Scholar]
- McMenamin CA, Travagli RA & Browning KN. (2018). Perinatal high fat diet increases inhibition of dorsal motor nucleus of the vagus neurons regulating gastric functions. Neurogastroenterol Motil 30. [DOI] [PMC free article] [PubMed] [Google Scholar]
- Miller KE, Bajzer Z, Hein SS, Phillips JE, Syed S, Wright AM, Cipriani G, Gibbons SJ, Szurszewski JH, Farrugia G, Ordog T & Linden DR. (2018). High temporal resolution gastric emptying breath tests in mice. Neurogastroenterol Motil, e13333. [DOI] [PMC free article] [PubMed] [Google Scholar]
- Nefti W, Chaumontet C, Fromentin G, Tome D & Darcel N. (2009). A high-fat diet attenuates the central response to within-meal satiation signals and modifies the receptor expression of vagal afferents in mice. Am J Physiol Regul Integr Comp Physiol 296, R1681–1686. [DOI] [PubMed] [Google Scholar]
- Paniccia JE, Otis JM & Scofield MD. (2022). Looking to the stars for answers: Strategies for determining how astrocytes influence neuronal activity. Comput Struct Biotechnol J 20, 4146–4156. [DOI] [PMC free article] [PubMed] [Google Scholar]
- Penicaud L, Leloup C, Fioramonti X, Lorsignol A & Benani A. (2006). Brain glucose sensing: a subtle mechanism. Curr Opin Clin Nutr Metab Care 9, 458–462. [DOI] [PubMed] [Google Scholar]
- Potapenko ES, Biancardi VC, Zhou Y & Stern JE. (2013). Astrocytes modulate a postsynaptic NMDA-GABAA-receptor crosstalk in hypothalamic neurosecretory neurons. J Neurosci 33, 631–640. [DOI] [PMC free article] [PubMed] [Google Scholar]
- Reiner DJ, Mietlicki-Baase EG, McGrath LE, Zimmer DJ, Bence KK, Sousa GL, Konanur VR, Krawczyk J, Burk DH, Kanoski SE, Hermann GE, Rogers RC & Hayes MR. (2016). Astrocytes Regulate GLP-1 Receptor-Mediated Effects on Energy Balance. J Neurosci 36, 3531–3540. [DOI] [PMC free article] [PubMed] [Google Scholar]
- Rose CR, Felix L, Zeug A, Dietrich D, Reiner A & Henneberger C. (2017). Astroglial Glutamate Signaling and Uptake in the Hippocampus. Front Mol Neurosci 10, 451. [DOI] [PMC free article] [PubMed] [Google Scholar]
- Scofield MD. (2018). Exploring the Role of Astroglial Glutamate Release and Association With Synapses in Neuronal Function and Behavior. Biol Psychiatry 84, 778–786. [DOI] [PMC free article] [PubMed] [Google Scholar]
- Shen W, Chen S, Liu Y, Han P, Ma T & Zeng LH. (2021). Chemogenetic manipulation of astrocytic activity: Is it possible to reveal the roles of astrocytes? Biochem Pharmacol 186, 114457. [DOI] [PubMed] [Google Scholar]
- Sivarao DV, Krowicki ZK & Hornby PJ. (1998). Role of GABAA receptors in rat hindbrain nuclei controlling gastric motor function. Neurogastroenterol Motil 10, 305–313. [DOI] [PubMed] [Google Scholar]
- Stein LM, Lhamo R, Cao A, Workinger J, Tinsley I, Doyle RP, Grill HJ, Hermann GE, Rogers RC & Hayes MR. (2020). Dorsal vagal complex and hypothalamic glia differentially respond to leptin and energy balance dysregulation. Transl Psychiatry 10, 90. [DOI] [PMC free article] [PubMed] [Google Scholar]
- Stern JE & Filosa JA. (2013). Bidirectional neuro-glial signaling modalities in the hypothalamus: role in neurohumoral regulation. Auton Neurosci 175, 51–60. [DOI] [PMC free article] [PubMed] [Google Scholar]
- Takata N, Mishima T, Hisatsune C, Nagai T, Ebisui E, Mikoshiba K & Hirase H. (2011). Astrocyte calcium signaling transforms cholinergic modulation to cortical plasticity in vivo. J Neurosci 31, 18155–18165. [DOI] [PMC free article] [PubMed] [Google Scholar]
- Thaler JP, Yi CX, Schur EA, Guyenet SJ, Hwang BH, Dietrich MO, Zhao X, Sarruf DA, Izgur V, Maravilla KR, Nguyen HT, Fischer JD, Matsen ME, Wisse BE, Morton GJ, Horvath TL, Baskin DG, Tschop MH & Schwartz MW. (2012). Obesity is associated with hypothalamic injury in rodents and humans. J Clin Invest 122, 153–162. [DOI] [PMC free article] [PubMed] [Google Scholar]
- Theodosis DT, Poulain DA & Oliet SH. (2008). Activity-dependent structural and functional plasticity of astrocyte-neuron interactions. Physiol Rev 88, 983–1008. [DOI] [PubMed] [Google Scholar]
- Travagli RA & Anselmi L. (2016). Vagal neurocircuitry and its influence on gastric motility. Nat Rev Gastroenterol Hepatol 13, 389–401. [DOI] [PMC free article] [PubMed] [Google Scholar]
- Troy AE, Simmonds SS, Stocker SD & Browning KN. (2016). High fat diet attenuates glucose-dependent facilitation of 5-HT3-mediated responses in rat gastric vagal afferents. J Physiol 594, 99–114. [DOI] [PMC free article] [PubMed] [Google Scholar]
- Um JW. (2017). Roles of Glial Cells in Sculpting Inhibitory Synapses and Neural Circuits. Front Mol Neurosci 10, 381. [DOI] [PMC free article] [PubMed] [Google Scholar]
- Van Den Herrewegen Y, Sanderson TM, Sahu S, De Bundel D, Bortolotto ZA & Smolders I. (2021). Side-by-side comparison of the effects of Gq- and Gi-DREADD-mediated astrocyte modulation on intracellular calcium dynamics and synaptic plasticity in the hippocampal CA1. Mol Brain 14, 144. [DOI] [PMC free article] [PubMed] [Google Scholar]
- Waise TMZ, Toshinai K, Naznin F, NamKoong C, Md Moin AS, Sakoda H & Nakazato M. (2015). One-day high-fat diet induces inflammation in the nodose ganglion and hypothalamus of mice. Biochem Biophys Res Commun 464, 1157–1162. [DOI] [PubMed] [Google Scholar]
- Zorec R, Araque A, Carmignoto G, Haydon PG, Verkhratsky A & Parpura V. (2012). Astroglial excitability and gliotransmission: an appraisal of Ca2+ as a signalling route. ASN Neuro 4, e00080. [DOI] [PMC free article] [PubMed] [Google Scholar]
Associated Data
This section collects any data citations, data availability statements, or supplementary materials included in this article.
Supplementary Materials
Data Availability Statement
All data will be made available by the corresponding author upon request.