

Abstract
Status epilepticus (SE) is a life-threatening medical emergency with significant morbidity and mortality. SE is associated with a robust and sustained increase in serum glucocorticoids, reaching concentrations sufficient to activate the dense population of glucocorticoid receptors (GRs) expressed among hippocampal excitatory neurons. Glucocorticoid exposure can increase hippocampal neuron excitability; however, whether activation of hippocampal GRs during SE exacerbates seizure severity remains unknown. To test this, a viral strategy was used to delete GRs from a subset of hippocampal excitatory neurons in adult male and female mice, producing hippocampal GR knockdown mice. Two weeks after GR knockdown, mice were challenged with the convulsant drug pilocarpine to induce SE. GR knockdown had opposing effects on early vs late seizure behaviors, with sex influencing responses. For both male and female mice, the onset of mild behavioral seizures was accelerated by GR knockdown. In contrast, GR knockdown delayed the onset of more severe convulsive seizures and death in male mice. Concordantly, GR knockdown also blunted the SE-induced rise in serum corticosterone in male mice. GR knockdown did not alter survival times or serum corticosterone in females. To assess whether loss of GR affected susceptibility to SE-induced cell death, within-animal analyses were conducted comparing local GR knockdown rates to local cell loss. GR knockdown did not affect the degree of localized neuronal loss, suggesting cell-intrinsic GR signaling neither protects nor sensitizes neurons to acute SE-induced death. Overall, the findings reveal that hippocampal GRs exert an anti-convulsant role in both males and females in the early stages of SE, followed by a switch to a pro-convulsive role for males only. Findings reveal an unexpected complexity in the interaction between hippocampal GR activation and the progression of SE.
Keywords: Sex differences, Pilocarpine, Fluoro-Jade B, Dentate gyrus, Seizure threshold, Hypothalamic-pituitary adrenal axis, Epilepsy
1. Introduction
Status epilepticus (SE) is defined by the International League Against Epilepsy (ILAE) as >5 min of continuous seizure activity, or two or more sequential seizures between which there is an incomplete recovery of consciousness (Trinka et al., 2015). This sustained seizure activity is a life-threatening medical emergency with a mortality rate that can reach up to 30%, depending on SE etiology and patient age (Dham et al., 2014). Current treatments rely on the emergent administration of benzodiazepine and non-benzodiazepine antiseizure medications, but even when successfully administered seizures remain refractory to treatment in up to a third of patients. Estimated mortality rates for super-refractory SE can reach as high as 50% (Kirmani et al., 2021; Ascoli et al., 2021).
Proper function and regulation of the stress response is crucial to healthy development and survival, from performing activities of daily living to meeting the demands of a novel challenge. As a life-threatening disturbance to homeostasis, however, SE is associated with robust and persistent activation of the hypothalamic-pituitary adrenal (HPA) axis and release of corticosterone (CORT) into the circulation. Elevated CORT may exacerbate cellular toxicity associated with SE (Abbott et al., 1980; O’toole et al., 2014; Wulsin et al., 2018). Stressor-associated elevations in CORT preferentially activate glucocorticoid receptors (GRs) which are highly expressed in hippocampal neurons (Ahima and Harlan, 1990; Herman, 1993; Herman et al., 1989; Reul and De Kloet, 1985; Wang et al., 2013). Pharmacological studies demonstrate that glucocorticoids lower seizure thresholds and exacerbate evoked seizures in healthy animals (Lee et al., 1989; Lee et al., 1987; Ehlers and Killam, 1979; O’toole et al., 2014), accelerate kindling rates (Karst et al., 1999; Taher et al., 2005; Kumar et al., 2007; Koe et al., 2014), enhance SE-induced neuronal damage (Garcia-Garcia et al., 2017) and increase epileptiform activity in epileptic animals (Castro et al., 2012).
Pharmacological evidence supporting a pro-convulsant role for CORT, however, is limited by the systemic nature of drug treatments and the multisystemic – and often opposing – effect of glucocorticoids (Jaszczyk and Juszczak, 2021). Furthermore, the cellular targets by which exogenous glucocorticoids modulate seizure susceptibility are largely unknown. Single cell recording studies showing that CORT can increase the activity of hippocampal excitatory neurons (Joëls, 2018), combined with the noted proconvulsant effects of CORT in temporal lobe seizure models, support the interpretation that these neurons are a key target, but direct evidence is lacking.
For the present study, we sought to determine whether CORT activation of hippocampal excitatory neurons contributes to the severity of SE. To achieve cell-type specific control over CORT responses, we combined viral and transgenic mouse model approaches to selectively delete glucocorticoid receptors (GRs) from a subset of hippocampal excitatory neurons prior to pilocarpine-induced SE.
2. Methods
2.1. Animals
GR floxed (GRfl/fl) (B6.Cg-Nr3c1tm1.1Jda/J, Stock #: 021021) mice were obtained from Jackson Laboratory and maintained in-house on a C57BL/6 background. GRfl/fl mice possess loxP sites flanking exon 3 of the nuclear receptor subfamily 3, group C, member 1 (Nr3c1) gene which codes for the glucocorticoid receptor (GR). Male and female mice were housed in sterile barrier conditions at 72 ± 2 °F on a 14/10 h light/dark cycle. Study animals were generated using high-yield homozygous GRfl/fl x GRfl/fl crosses and low-yield heterozygous GRfl/wt x GRfl/wt crosses, the latter to produce littermate GRwt/wt (wild-type) controls. Pups were weaned between P21 and P28 and housed as same-sex littermates (3–4 per cage) with ad libitum access to water and standard autoclaved rodent chow. Adult male and female mice (10–17 weeks of age) underwent stereotaxic surgery, receiving bilateral ventral hippocampal infusion of AAV9 viral constructs to label cells with mCherry and delete the Nr3c1 (GR) gene. Following surgery, mice were singly housed with two types of environmental enrichment (nestlet and house). Study mice were acclimated to the testing environment and researcher by daily 10-min handling for one week prior to the collection of baseline corticosterone levels. All experimental protocols and procedures were designed to minimize discomfort and were conducted as approved by the Cincinnati Children’s Hospital Institutional Animal Care and Use Committee (IACUC) in accordance with NIH guidelines for the care and use of animals.
2.2. Stereotaxic surgery and viral constructs
Adult male and female GRfl/fl or GRwt/wt mice (19-32 g) underwent bilateral stereotaxic injection two weeks prior to SE. Briefly, mice were induced with 4% isoflurane in oxygen (1.5 L/min) and maintained at 0.8–1.5% isoflurane anesthesia delivered by a KOPF stereotaxic frame nose cone throughout the procedure. The scalp was shaved and sterilized with alternating application of antiseptic solution and 70% ethanol before anesthetization with 2% lidocaine (50–100 μL, s.c.). A 1–2 cm midline incision was made to expose the surface of the skull and bilateral 1 mm holes were drilled over the ventral hippocampus to expose the surface of the dura. The needle of a 5 μL Hamilton syringe was slowly lowered into the brain parenchyma and left at the injection coordinates (A/P: −3.1 mm, M/L: ±3.0 mm, D/V: −3.0 mm) for 3 min before virus infusion. Animals were injected with AAV9-Camk2a_-short>mCherry:WPRE (VectorBuilder, VB200219-1152uvn) or AAV9-Camk2a_short>mCherry(ns):T2A: Cre:WPRE (VectorBuilder, VB200130-1243kmp). Each viral construct was received at a titer of 1013 viral particles/mL and diluted in sterile 1XPBS, pH 7.2, to achieve a working solution titer of 3.5 × 10¹¹ viral particles/mL. One microliter of the working solution was infused into the parenchyma at a rate of 200 nL/min, resulting in a hemispheric load of 3.5 × 10⁹ viral particles. After infusion, the needle was left at the coordinates for an additional 3 min before slow withdrawal. The drill holes were sealed with bone wax and the scalp was closed by 4–5 interrupted stitches with absorbable sutures and a small amount of Gluture. While still under anesthesia, mice were given 1 mL warmed saline subcutaneously, carprofen (5 mg/kg, i.p.) and a heating pad for recovery before transfer to single housing. Mice received a second carprofen dose 24 h post-surgery and were rehydrated to maintain pre-surgical body weight if necessary.
2.3. Pilocarpine status epilepticus
To induce SE, mice were first injected with methyl scopolamine nitrate (1 mg/kg, s.c.) dissolved in sterile saline. Thirty minutes later, mice received an injection of pilocarpine (400 mg/kg, s.c.) dissolved in sterile saline. In our hands, this protocol – with a dose range of 380–420 mg/kg pilocarpine – consistently induces the development of SE and subsequent epilepsy (Hester et al., 2016; Castro et al., 2012; Hester and Danzer, 2013; McAuliffe et al., 2011; Santos et al., 2011; Walter et al., 2007). To control for diurnal stress rhythms, SE was induced between 9 am and 11 am. Mice were video recorded and monitored for 75 min post-pilocarpine injection. SE was treated after 75 min with two doses of diazepam (10 mg/kg, i.p.), spaced 15 min apart. Survivors were rehydrated to pretreatment weight with sterile saline and given a heating pad for recovery overnight. Health was monitored every 6–12 h and mice were rehydrated with warmed sterile saline to pretreatment weight as needed.
2.4. Behavioral seizure scoring
SE was defined behaviorally as the appearance of continuous seizures following pilocarpine treatment, the absence of normal behaviors and a lack of responsiveness to external stimuli. A modified Racine scale (Racine, 1972) was used to score seizure behaviors during SE, as follows: Class 1: sudden behavioral arrest with motionless staring. Class 2: orofacial automatisms and head bobbing. Class 3: unilateral forelimb clonus. Class 4: bilateral forelimb clonus and/or rearing. Class 5: rearing and falling. Class 6: wild running and bouncing “popcorn-like” seizures. Class 7: tonic extension and rigidity. Class 8: death. To generate seizure progression curves for each mouse, behaviors following pilocarpine injection were scored by two independent observers blind to treatment group using video recordings. Scores reflect the highest class during each minute of the recording.
2.5. Blood sampling and serum corticosterone (CORT) assessment
To determine corticosterone (CORT) serum concentrations, samples were read against a standardized curve using 125I radioimmunoassay kits (MP Biomedicals Inc., Orangeburg NY). To collect morning baseline CORT concentrations, mice were quickly tail bled (< 3 min) between 9 am and 11 am on the day before SE, prior to the last daily acclimation. Briefly, blood was collected using a razor blade to clip the distal tip of the tail of a freely moving mouse. An EDTA capillary tube was used to collect ~50 μL of blood within 3 min of cage disturbance. Samples were stored on ice and centrifuged at 6000 RPM (4 °C) for 15 min. Plasma supernatant (~10 μL) was collected, diluted in steroid diluent, and stored at −80 °C until processing by radioimmunoassay as previously described (Wulsin et al., 2016b). Subsequent blood samples were taken on the day of SE, either at the time of death or 75 min after pilocarpine injection, by gentle removal of the tail clot and rebleed.
2.6. Tissue collection
Mice that died during SE were quickly taken to a separate room and transcardially perfused with 10 mL of ice-cold 1xPBS + 0.1% heparin. Brains were removed and immersion fixed overnight in ice-cold 2.5% PFA + 4% sucrose dissolved in 1XPBS. Mice which survived SE were euthanized with an overdose of sodium pentobarbital (250 mg/kg, i.p.) within 10 min of cage disturbance on the second day after pilocarpine and transcardially perfused with 50–75 mL of ice-cold 1XPBS + 0.1% heparin followed by 100 mL of 2.5% paraformaldehyde (PFA) + 4% sucrose dissolved in 1XPBS. Brains were post-fixed for 12–18 h in 2.5% PFA + 4% sucrose in 1XPBS. Following fixation, all brains were transferred through increasing sucrose concentrations (10%, 20%, 30%) for cryoprotection. Brains were frozen in isopentane at −35 to −45 °C and stored at −80 °C before cryosectioning. Forty-micron coronal sections were cut on a cryostat (22–24 °C), mounted on gelatin-coated slides and stored at −80 °C.
2.7. Confocal imaging
All images within a dataset meant for comparison were collected with identical laser power and gain settings using the same confocal microscope and NIS-Elements AR software 5.20.02 (RRID:SCR_014329).
2.8. Viral spread
To quantify the spread of the virus in each animal, a coronal section spaced every 240 μm along the dorso-ventral axis (from −0.90 to −4.5 mm posterior to bregma) was imaged for mCherry. Images were obtained with an inverted Nikon Ti-2 Widefield microscope with a Spectra-X light source and 4× Plan Apo air objective (NA: 0.2). Using a tiled scan, images of mCherry expression in the hippocampus and subiculum were captured at a single focal plane for each slice.
Confocal images of mCherry labeling were imported into ImageJ (RRID:SCR_003070) to quantify viral spread as the area of a region covered by mCherry fluorescence at each bregma level. Gross observation of the tissue revealed that mCherry expression was primarily localized to the dentate gyrus and CA1, so analyses focused on these regions. To quantify mCherry expression, regions of interest (ROIs) were drawn around the dentate gyrus and CA1 using the nuclear blue counterstain. The thresholding tool was then applied to capture the area covered by mCherry fluorescence in each ROI.
2.9. Glucocorticoid receptor (GR) immunohistochemistry
For GR immunohistochemistry, slide-mounted tissue was thawed for 10 min at room temperature in 1XPBS before being permeabilized in 3% Triton-X + 0.75% glycine in 1XPBS overnight under agitation at room temperature. Sections were blocked (1.5% Triton-X, 5% normal goat serum [NGS], 0.75% glycine, 0.2% bovine serum albumin [BSA]) overnight at 4 °C under agitation. The next day, coronal sections were incubated with polyclonal IgG rabbit anti-glucocorticoid receptor (GR) antibodies (1:800; Thermo Fisher Scientific, Cat# PA5–21341, RRID:AB_11152512) diluted in blocking solution for 72 h at 4 °C under agitation. Tissue was washed with blocking solution for 4 × 10 min and incubated with highly cross-adsorbed Alexa-Fluor goat anti-rabbit 647 secondary antibodies (1:1000, diluted in 1XPBS). Slices were washed with 1XPBS, mounted with ProLong Glass Antifade gel mountant with Nuclear Blue (Thermo Fisher Scientific, Cat# P36981) and coverslipped with Fisherbrand No. 1.5 cover glass. Gel-mounted slides were sealed with clear nail polish and stored flat at 4 °C.
GR immunolabeling was imaged as confocal z stacks with a Nikon AXR upright microscope using a 25× silicone objective (NA 1.05) and galvanometric scanner (471x471x15 μm in the XYZ plane with a 1.0 μm step size). Confocal z stacks were collected starting 2 μm below the tissue surface. Images were collected from two slices/mouse from three wild-type (2 female, 1 male) and three hippocampal glucocorticoid receptor knockdown (hGRKD; 2 female, 1 male) mice. Four to six z stacks were collected from each mouse to capture mCherry+ CA1 pyramidal cells, and mCherry+ excitatory cells in the dentate (granule cells and hilar mossy cells).
Confocal z stacks were imported into Imaris 9.8.0 (Oxford Instruments, RRID: SCR_007370) and converted to .IMS file format to quantify GR immunoreactivity among mCherry+ cells. Fluorescence intensity of the GR (647) channel was collected from a total of 46 mCherry+ CA1 pyramidal cells and 486 mCherry+ dentate excitatory cells from wild-type mice and 74 mCherry+ CA1 pyramidal cells and 413 dentate excitatory cells from hGRKD mice. A masked analysis was used in Imaris to quantify the mean fluorescence intensity. Fluorescence intensity was used to determine the percentage of GR immunoreactive neurons in each group. GR immunopositive cells were defined as being 2× background fluorescence intensity (Kraus et al., 2022). Background intensity was set as the mean fluorescence intensity of mCherry+ cells in no-primary control slices (GR antibody left out).
2.10. Cell death analysis
Slide-mounted tissue was thawed in 1XPBS for 10 minutes, dehydrated by immersion in 100% ethanol for 3 min, 70% ethanol for 1 min, and rehydrated in dH2O for 30 s. Hydrated tissue was incubated in 0.06% potassium permanganate at room temperature under agitation for 15 min, rinsed, then incubated in a light-protected glass chamber with 0.0001% Fluoro-Jade B (FJB) diluted in 0.1% acetic acid. Slides were rinsed with dH2O, air-dried overnight at room temperature, and coverslipped the next day with Krystalon mounting media and Fisherbrand No. 1.5 cover glass after a 2-min xylene rinse. Slides were stored flat in the dark at room temperature.
Sections stained with FJB were imaged as confocal z stacks through the full thickness of the tissue with tile scans encompassing the entire hippocampal formation. Images were captured with a Nikon AXR upright microscope using a 25× silicone objective (NA 1.05) and resonant scanner (500x500x10 μm in the XYZ plane with a 0.25 μm step). Images taken with the resonant scanner were denoised using NIS-Elements Denoise.ai.
Confocal z stack tile scans from a full stereological set (9–12 sections per mouse spaced at 240 μm increments) were imported into Imaris 9.8.0 and converted into .IMS file format to quantify the number of FJB+ cells among the structures of interest through the spots function. Because FJB staining permeates the full extent of the tissue, spots were quantified through the full extent of the z axis. After spot detection (average size: 3 μm, quality filter over 100–300 in the 488 channel), ROIs were drawn around the full extent of the CA1 pyramidal cell body layer and the hilus of the dentate gyrus to quantify the number of spots within each region. Because the staining process for FJB shrinks the tissue, actual z depths tend to be about 25% of the original tissue thickness (~7-11 μm compared to original 40 μm). Thus, the number of FJB+ cells for a region was divided by the ROI volume (total area of the ROI multiplied by the original tissue thickness) to generate the density of dead cells (# cells/ μm3) at each bregma level. For regions of missing or folded tissue that disallowed quantification, the number of cells and volumes from adjacent sections were averaged to produce an estimate for the missing section.
To estimate the total number of FJB+ cells per animal and region, stereological sections were used to provide systematic and uniform random sampling every 240 μm along the dorso-ventral axis of the hippocampus. Total FJB+ cell numbers were determined using the optical dissector method modified for exhaustive cell counts (OLESEN et al., 2017). To provide a measure of sampling variance, the coefficient of error (CE) was calculated for each animal (Gundersen and Jensen, 1987). The average CE for the SE survivors was 0.103 for wild-type mice and 0.0756 for hGRKD mice, indicating that the brains of both groups were adequately (CE < 0.10) and equally (p = 0.343) sampled to provide accurate estimates of total FJB+ cells.
2.11. Statistical analysis
All datasets were assessed for normality with the Shapiro-Wilk test and equal variance using the Brown-Forsythe test in SigmaPlot 14.0 (RRID: SCR_003210). When comparing group averages, normally distributed data with equal variance were analyzed by Student’s t-test. Normally distributed data with unequal variance were analyzed by Welch’s t-test. Data which were not normally distributed were analyzed by Mann-Whitney Rank Sum test. When comparing group averages with a second factor, data were analyzed by two-way ANOVA. Survival curves for individual seizure behaviors were analyzed by Kaplan-Meier survival (log rank) analysis. A Cox Proportional Hazard analysis was used to assess hazard ratio risks for viral structural coverage on seizure behaviors and mixed effects models were used to examine the relationship between viral coverage and cell loss. For all statistical tests, alpha was set at 0.05. Wild-type groups (Table 1) did not significantly differ from each other (data not shown) and were pooled for all analyses.
Table 1.
Experimental groups, animal genotypes and viral constructs injected into the hippocampus are detailed. All study mice underwent pilocarpine treatment.
| Group | Genotype | Viral Construct | Treatment (SE) | Total N |
|---|---|---|---|---|
| Wild-type | GRfl/fl | AAV9.CamKII-mCherry | Pilocarpine | 15 (4 M, 11F) |
| Wild-type | GRwt/wt | AAV9.CamKII-mCherry-Cre | Pilocarpine | 8 (4 M, 4F) |
| Wild-type* | GRfl/fl | AAV9.CamKII-mCherry-Cre | Pilocarpine | 3 (1 M, 2F) |
| hGRKD | GRfl/fl | AAV9.CamKII-mCherry-Cre | Pilocarpine | 26 (9 M, 17F) |
Three mice (*) were reassigned from the hGRKD to the wild-type group after post-hoc analysis revealed no mCherry expression (0% KD) in these animals.
Abbreviations: GR, glucocorticoid receptor. hGRKD, hippocampal glucocorticoid receptor knockdown, fl, floxed. wt, wildtype. AAV, adeno-associated virus. CaMKII, calcium-calmodulin dependent kinase II. M, male. F, female. Cre, cre recombinase.
2.12. Figure preparation
Graphs were created in GraphPad Prism (9.1.1, RRID: SCR_002798). Representative micrographs were cropped and adjusted for contrast and brightness using NIS-Elements AR 5.20.02 (RRID:SCR_014329) and Adobe Photoshop CS9 22.5.1 (RRID:SCR_014199). Identical adjustments were made to all images meant for comparison. Graphs of data with normal distribution represent mean +/− SEM, whereas graphs of data with non-normal distribution represent median +/− 95% CI.
3. Results
3.1. Glucocorticoid receptor knockdown from hippocampal excitatory neurons
To determine whether glucocorticoid receptor (GR) knockdown from hippocampal excitatory neurons can modulate the severity of status epilepticus, adult male and female GRfl/fl mice underwent bilateral stereotactic injection of AAV9.CaMKII-mCherry-Cre into the ventral hippocampus (Table 1). This approach leads to mCherry labeling and Cre-dependent excision of exon 3 from the Nr3c1 gene coding for GR in infected neurons expressing calcium/calmodulin-dependent protein kinase II (CaMKII). Animals, therefore, exhibit loss of GRs from a subset of hippocampal excitatory neurons and are termed hippocampal glucocorticoid receptor knockdowns (hGRKD). To generate wild-type control animals, GRwt/wt mice were injected with the same AAV9.CaMKII-mCherry-Cre virus (Table 1) and GRfl/fl mice were injected with a AAV9.CaMKII-mCherry virus that drives mCherry expression but lacks cre-recombinase (Table 1). In addition to these controls, three GRfl/fl mice injected with the Cre-expressing virus were found to completely lack mCherry labeling in a stereological series through the brain. The lack of labeling is the likely result of a syringe clog during surgery, a known issue identified in pilot experiments. These animals were reassigned to the wild-type group as sham-injected controls for all subsequent analyses. Statistical conclusions (significant/non-significant) were identical with these animals included or excluded from the study.
3.2. GR knockdown was effective in study animals
To confirm the efficacy of viral-mediated GR knockdown, GR immunostaining was conducted in three wild-type and three hGRKD mice. Qualitative analysis revealed the absence of GR protein within mCherry-labeled CA1 pyramidal cells, granule cells and hilar mossy cells in hGRKD mice (Fig. 1A,B). By contrast, robust GR immunoreactivity was evident in mCherry-labeled cells in wild-type mice. To quantify this effect, mean fluorescence intensity within the GR channel of mCherry-labeled cells was collected. GR immunofluorescence intensity was significantly lower among mCherry+ CA1 pyramidal cells from hGRKD mice compared to cells from wild-type mice (Fig. 1C; Mann-Whitney, Wild-type n = 46 cells, hGRKD n = 74 cells, p < 0.0001) and the dentate gyrus (Fig. 1D; Mann-Whitney, Wild-type n = 486 cells, hGRKD n = 413 cells; p < 0.0001). Similar patterns of GR immunoreactivity were observed within pyramidal cells of the CA3 region and subiculum (data not shown). To quantify the knockout rate among mCherry+ cells, GR-immunoreactive neurons were defined as cells with signal intensity >2× background. While the mean percentage of mCherry+ cells immunopositive for GR was 94.3% among wild-type mice, only 10.0% of mCherry-labeled cells among hGRKD mice were GR-positive (Fig. 1E; Student’s t-test, Wild-type n = 3 mice, hGRKD n = 3 mice, p < 0.0001). Small numbers of mCherry-labeled, GR-positive cells in hGRKD mice are consistent with the plasmid design, with mCherry located upstream of the T2A linked cre-recombinase. The upstream gene in T2A-linked sequences often shows better expression (Liu et al., 2017). Overall, findings demonstrate high fidelity between mCherry expression and cellular GR knockout in hGRKD animals, supporting the use of mCherry fluorescence as a surrogate marker for the extent of GR knockdown.
Fig. 1.
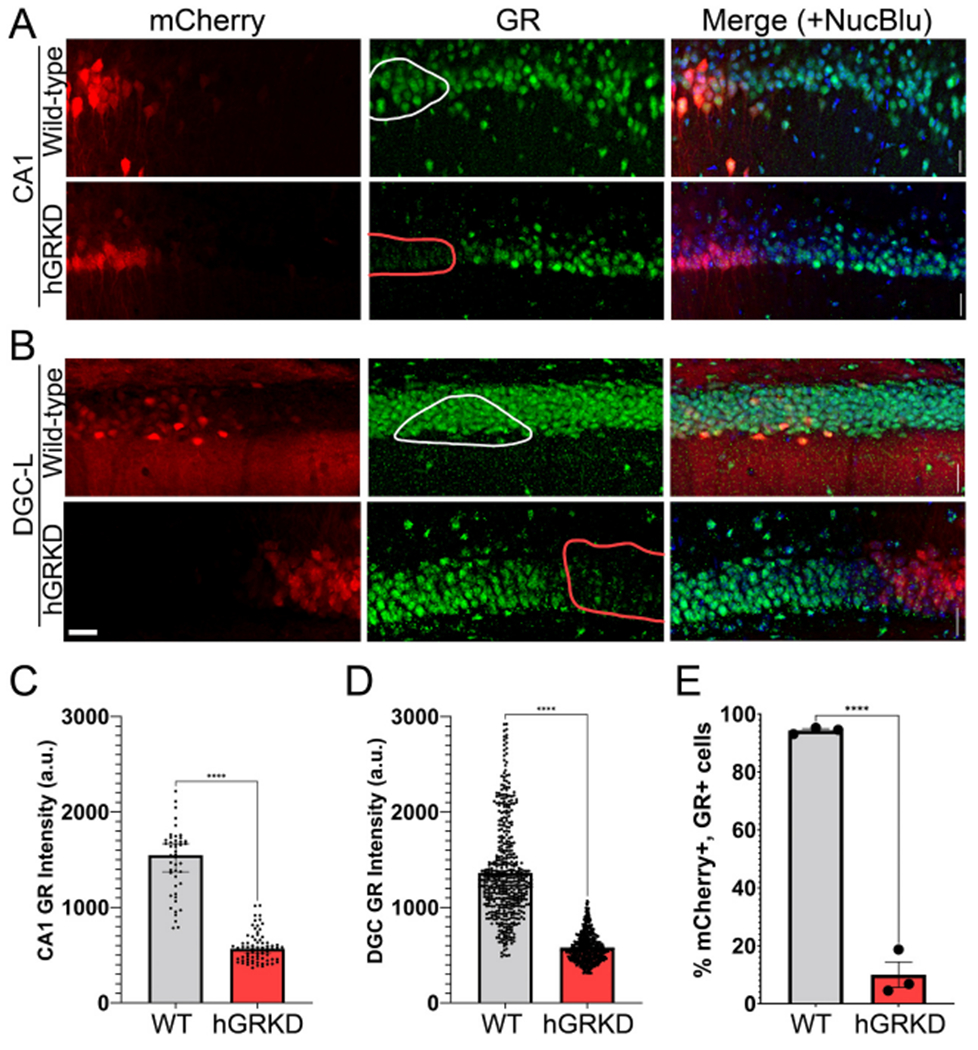
Representative micrographs of mCherry labeling (red) and GR immunostaining (green) among CA1 pyramidal cells (A) and dentate granule cells (B) in wild-type and hGRKD mice. The merged images include a nuclear blue fluorescent counterstain. Outlines in the middle (GR) panels show mCherry+ regions in wild-type mice with intact GRs (white lines), and mCherry+ regions in hGRKDs devoid of GR immunofluorescence (red lines). Scale bar = 25 μm. C, D: Mean fluorescence intensity in arbitrary units (a.u.) within the GR channel of the somas of mCherry+ cells from wild-type and hGRKD mice. Fluorescence intensity was significantly higher among mCherry+ CA1 pyramidal cells (C) and dentate granule cells (D) from wild-type mice relative to cells from hGRKD mice. E: The percentage of mCherry+ cells meeting criteria as GR-immunopositive (2× background) was significantly reduced in hGRKD mice relative to wild-type mice. Dots = individual cells in C and D, and individual mice in E. ****p < 0.0001. (For interpretation of the references to colour in this figure legend, the reader is referred to the web version of this article.)
3.3. GR knockdown did not alter key baseline measures
GR loss from hippocampal neurons could impact general measures of health or hypothalamic-pituitary-adrenal (HPA) axis function, so we queried whether GR knockdown altered any baseline measures in the animals. hGRKD mice did not exhibit overt symptoms of poor health, and animal weights were statistically similar between hGRKD and wild-type groups after controlling for sex (Wild-type male, 27.4 ± 0.66 g; Wild-type female, 23.3 ± 0.48; hGRKD male, 27.6 ± 0.66; hGRKD female, 24.2 ± 0.48; two-way ANOVA, p = 0.392 for genotype; p < 0.001 for sex; p = 0.505 for interaction). In addition, baseline serum corticosterone (CORT) was measured in all animals. Specifically, mice were acclimated daily for one week prior to the collection of baseline serum CORT, which was obtained by tail bleed the morning before pilocarpine treatment (Fig. 2A, T0). GR knockdown from hippocampal glutamatergic neurons did not impact morning baseline serum CORT concentrations among male and female mice. Specifically, no effect of sex (Fig. 2B; Wild-type, n = 26; hGRKD, n = 26; Two-way ANOVA, F (1, 48) = 0.9722; p = 0.329) or GR knockdown (F (1, 48) = 0.2148; p = 0.645) was found, and there was no interaction between factors (F (1, 48) = 0.2939; p = 0.590). Findings indicate the hippocampal GR knockdown, as conducted here, does not disrupt negative feedback regulation of CORT levels.
Fig. 2.
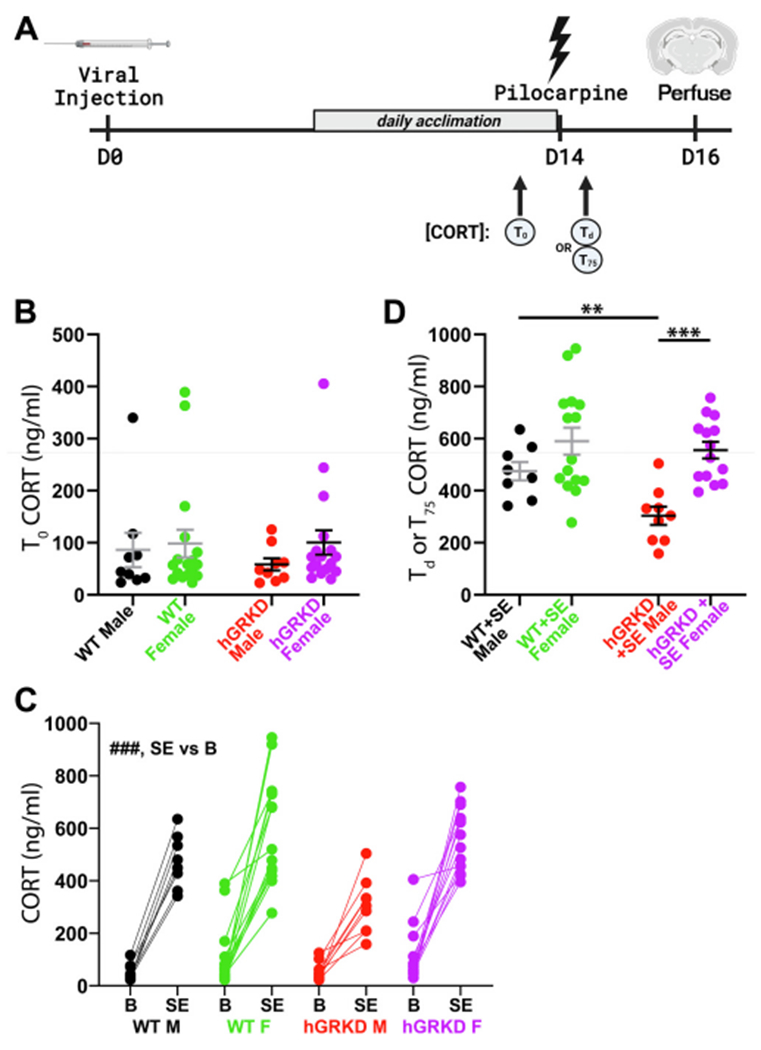
A: Adult male and female mice received hippocampal viral injections to yield hGRKD and wild-type (WT) groups. One week after viral injection, mice began daily acclimation to the researcher and testing conditions. The day before pilocarpine injection, blood was collected for baseline serum CORT measures (T0). Two weeks after viral injection, mice underwent pilocarpine-induced SE. Blood was sampled either at the time of death Td) or 75 min (T75) after pilocarpine treatment. B: Baseline morning CORT concentrations (T0) were equivalent between hGRKD and wild-type mice, with no effect of sex. C: Graph depicts paired baseline (B) and T0/T75 (SE) CORT measurements for each animal. Only animals that entered SE and had both baseline and SE measurements are shown. ###p < 0.001 for main effect of baseline vs SE. D: GR knockdown blunted the Td/T75 SE-induced increase in CORT in male, but not female mice. **p < 0.01, ***p < 0.001. Portions of this figure were generated using Biorender.
3.4. GR knockdown reduces SE-induced corticosterone concentrations in male mice
Two weeks after virus injection, hGRKD and wild-type mice were challenged with the convulsant drug pilocarpine. As mice progressed through seizures, blood was sampled either at the time of death (Fig. 2A; Td) or 75 min after pilocarpine injection for mice that survived (T75). Pilocarpine-induced SE increased systemic CORT concentrations for both wild-type and hGRKD mice (Wild-type, n = 23, baseline = 87.7 ± 20.4 ng/mL; SE = 550.4 ± 37.3; hGRKD, n = 23, baseline = 90.9 ± 18.0; SE = 457.1 ± 35.1; two-way RM ANOVA, p < 0.001 for baseline vs. SE). Analysis of the data, however, revealed a potential sex effect (Fig. 2C), so CORT levels were examined without pooling males and females. Analysis of serum CORT after SE revealed a significant interaction between genotype and sex (Fig. 2D; Two-way ANOVA on ln-transformed data, p = 0.015). Post-hoc comparisons demonstrated that serum CORT concentrations were lower in male hGRKDs after SE relative to wild-type males (Tukey, p = 0.002), and that male hGRKD mice had lower serum CORT than female hGRKD mice after SE (Tukey, p < 0.001). Male and female wild-type mice exposed to SE, however, did not differ significantly from each other (Tukey, p < 0.166), and GR knockdown had no effect on CORT levels in female mice (p = 0.811). Since samples were collected at different time points (time of death or 75 min after pilocarpine) we queried whether there was any relationship between time and serum CORT concentrations. No significant correlations were evident in any groups (Wild-type male + SE, R = −0.247, p = 0.556; Wild-type female + SE, R = −0.343, p = 0.211; hGRKD male + SE, R = −0.349, p = 0.357; hGRKD female + SE, R = −0.440, p = 0.115; Pearson product moment correlation), indicating that different collection times are unlikely to account for the reduced CORT levels in hGRKD males. Taken together, these findings support the conclusion that GR knockdown mitigated the SE-induced increase in serum CORT in male but not female mice.
3.5. Glucocorticoid receptor knockdown exerts sex-dependent bimodal effects on status epilepticus severity
To establish whether GR knockdown altered the susceptibility to or course of SE, seizure behaviors from all animals were scored from video recordings. SE-induced mortality was unexpectedly high among all genotypes in pilot work (data not shown) relative to other studies using similar protocols (Hosford et al., 2017; Wulsin et al., 2016a; Wulsin et al., 2018; Wulsin et al., 2021). Therefore, to limit study mortality, mice were not implanted with EEG electrodes. High mortality might reflect mouse line-specific, colony-specific or surgical effects, which can impact epileptogenesis in rodents (Jain et al., 2019). Responses to pilocarpine were quantified by measuring seizure behaviors, which were scored every minute for 75 min after pilocarpine injection. To visualize the progression of status epilepticus in each animal, behavioral scores were used to generate the heat maps shown in Fig. 3. Clear differences are evident from these maps, the most obvious being longer survival of hGRKD mice.
Fig. 3.
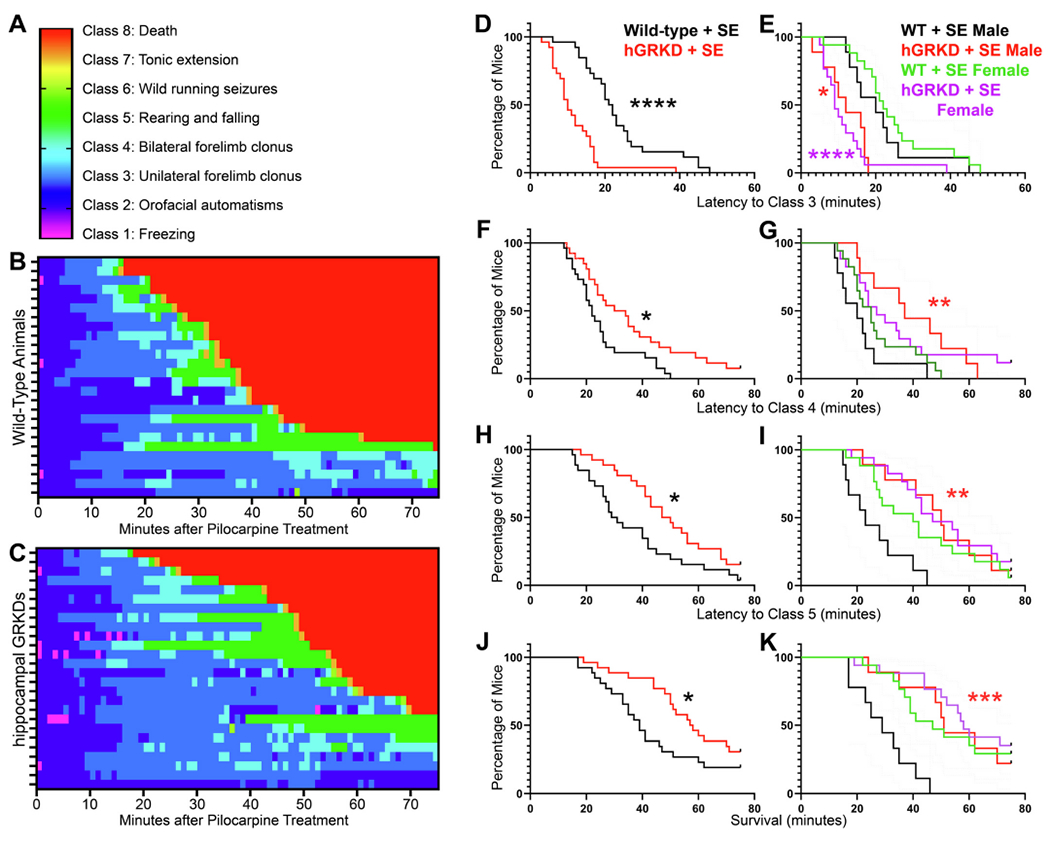
A-C: Progression of behavioral seizures through each seizure class (A) is shown for wild-type (B) and hGRKD mice (C). In the heat maps, each row gives the data for a single animal. D-K: Analysis of the data with males and females combined revealed that GR knockdown accelerated the onset of class 3 seizures (D), but delayed the onset of class 4 seizures (F), class 5 seizures (H) and death (J). To visualize how animal sex drove these findings, data are also presented with males and females separated (E,G,I,K). Both males and females contributed to the accelerated onset of class 3 seizures in hGRKDs (E). Increased latency to class 4 seizures, class 5 seizures and death, however, was only evident in hGRKD males. Restated, control males developed severe outcomes more rapidly, and GR knockdown in males shifted their curves towards the more resistant female pattern (G,I,K). *, p < 0.05. **p < 0.01, ***p < 0.001. ****p < 0.0001. Asterisks in B,D,F and H denote comparisons between hGRKD and sex-matched wild-type groups.
To begin to quantify the apparent differences in responses, we first assessed whether GR knockdown impacted the incidence, progression or outcomes of pilocarpine-induced SE. Interestingly, examination of the data revealed sex dependent effects for some measures, but not others. To best convey these differences, data sets are first presented with males and females combined, followed by post-hoc tests to query whether male or female mice drive observed effects.
GR knockdown did not alter the proportion of animals that developed behavioral SE (Wild-type, 96.1%, 25/26; hGRKD, 88.5%, 23/26, Z-test, p = 0.304). Specifically, all mice in the study developed SE except for 3 female hGRKDs and 1 female wild-type. No effect of sex was found (data not shown). Surprisingly, however, GR knockdown had a bimodal effect on measures of behavioral seizure progression. GR knockdown reduced the latency to class 3 seizures, but increased the latency to class 4 seizures, class 5 seizures and death. Median onset for focal motor (class 3) seizures was 10 min in hGRKDs, compared to 22 min in wild-type mice (Fig. 3D; Kaplan-Meier curve with log-rank tests, p < 0.0001). By contrast, the onset of class 4 seizures – characterized by bilateral forelimb clonus – was delayed in hGRKD mice, with a median latency of 32 min in hGRKDs compared to 22 min for wild-type mice (Fig. 3F; p = 0.0133). Similarly, hGRKD mice were also protected against generalized tonic-clonic (Class 5) seizures, with a median latency of 49 min compared to 30 min in wild-type mice (Fig. 3H; p = 0.0197). Death was also delayed among hGRKDs, with a median survival time of 58 min compared to 39 min among wild-type mice (Fig. 3J; p = 0.047). While latency to death was delayed among hGRKDs, overall mortality was unchanged, with 69.2% (18/26) of hGRKD mice and 80.8% (21/26) of wild-type mice dying after pilocarpine treatment (Z-test, p = 0.334). Thus, GR expression among hippocampal excitatory neurons contributes bimodally to the development of acute seizures. Within the first 20–30 min after pilocarpine injection, intact hippocampal GR expression seems to slow the development of early, class 3 seizures. However, as seizures progress, GRs seem to accelerate the onset of more generalized, life-threatening seizures.
Analysis of class 3 seizure latencies by sex revealed no differences between males and females. Latency was significantly shorter in both male (Fig. 3E; p = 0.016, Kaplan-Meier with Bonferroni corrections [α = 0.05/2]) and female (p < 0.0001) hGRKD mice relative to sex-matched wild-type mice. By contrast, latencies to more severe class 4 seizures (Fig. 3G; p = 0.007), class 5 seizures (Fig. 3I; p = 0.001) and death (Fig. 3K; p < 0.001) were increased in male hGRKD mice relative to male wild-type mice, while female hGRKD and wild-type mice had statistically indistinguishable latencies for these measures (class 4, p = 0.273; class 5, p = 0.220; death, p = 0.418). Visual examination of the graphs in Fig. 2G,I,K suggests that sex differences are driven by increased susceptibility of wild-type males to more severe seizures and death, and that hippocampal GR knockdown in males has a protective effect.
3.6. The density and spread of viral labeling does not predict SE responses
Variability in surgical AAV9 injection produces mCherry labeling/GR loss that varies in regional extent and affected cell types within the hippocampus. This variability provides an opportunity to assess whether greater knockdown or recruitment of specific cell types produces different effects. For the present study, ventral hippocampal injection resulted in viral infection of dentate granule cells (DGCs), mossy cells, and pyramidal cells in CA1, CA2, CA3 and subiculum (Fig. 4). These cell populations express GR under resting, non-stressed conditions (Ahima and Harlan, 1990; Herman et al., 1989; Reul and De Kloet, 1985; Van Eekelen et al., 1988). Viral expression, assessed by mCherry expression, was most prominent and consistent in the dentate gyrus and CA1, so viral load (the percentage of a structure covered by the mCherry signal) was quantified in these two regions along the dorso-ventral extent of the hippocampus.
Fig. 4.
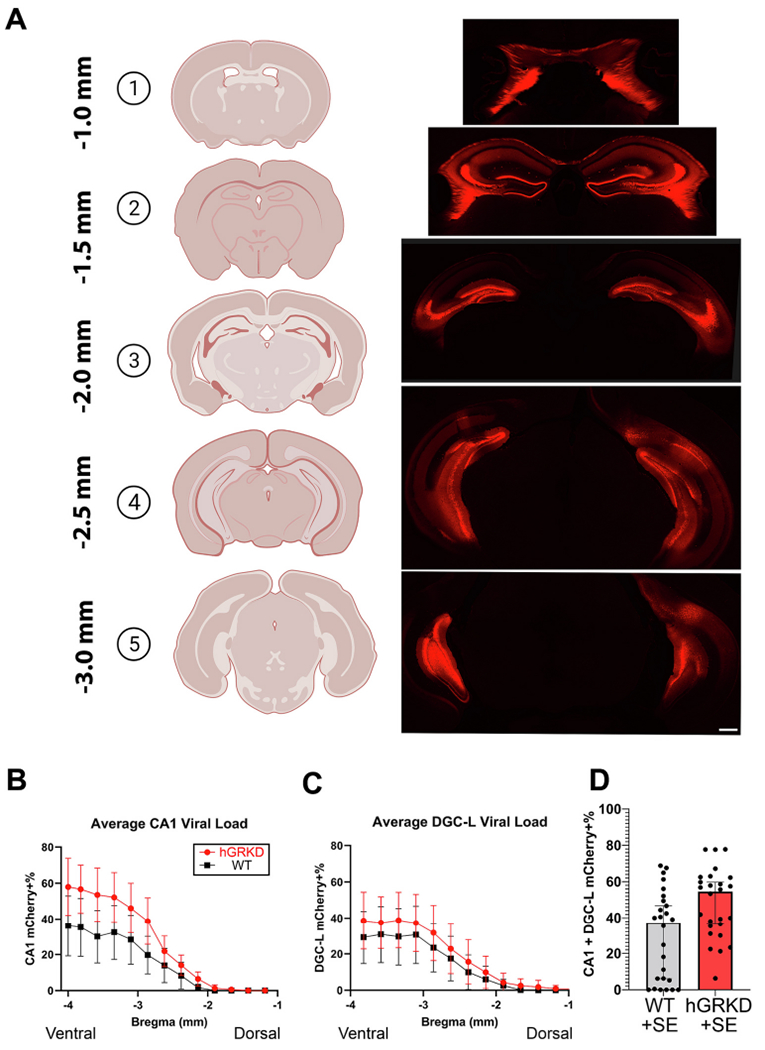
A: Representative images of viral spread along the dorso-ventral axis of the hippocampus, as revealed by mCherry+ expression among dentate granule cells (DGCs), mossy cells (MCs), pyramidal cells of CA1, CA2, CA3 and ventral subiculum. Among animals, labeling was most expansive and consistent in CA1 and dentate gyrus. Scale bar = 1 mm. B, C: The percentage of mCherry+ CA1 pyramidal cells and dentate granule cells was quantified for each wild-type (black) and hGRKD (red) animal in the study. Ventral regions (3–4 mm posterior to bregma) exhibited the highest viral load for both CA1 (B) and dentate gyrus (C). The pattern of viral expression was similar between wild-type and hGRKD groups. D: Stereological data on mCherry expression in the dentate and CA1 at each bregma level was averaged to generate a single viral load score for each mouse. Each dot represents the score for a single animal. Portions of this figure were generated using Biorender. (For interpretation of the references to colour in this figure legend, the reader is referred to the web version of this article.)
Among both GR knockdown and wild-type mice, the average viral load was highest in the ventral hippocampus in both CA1 (Fig. 4B) and dentate gyrus (Fig. 4C), as expected given the ventral placement of AAV9 injections. Similar infection patterns and average viral load scores (Fig. 4D; [%CA1 KD + %DGC-L KD/2]) between wild-type and hGRKD groups support the conclusion that non-specific AAV9 effects (e.g. inflammation) do not contribute to group differences. Within hGRKD mice, combined viral load (average of CA1 and dentate scores) was not significantly different between males and females (Female hGRKD, n = 17, 49.7 ± 4.2%; Male hGRKD, n = 9, 45.3 ± 7.7%; Student’s t-test, p = 0.589), indicating that male/female differences in SE responses are not driven by differences in infection rates.
To determine whether the degree of GR knockdown among CA1 or dentate might affect the latency to any of the seizure measures, a Cox Proportional Hazards Model was applied to calculate hazard ratios for each region. For this analysis, mCherry-labeling was used as a surrogate marker for GR knockdown. No significant relationship between the percentage of mCherry+ cells and any seizure measures were found for either wild-type (mCherry+ only cells) or hGRKD (mCherry+, GR knockout cells) groups (Supplementary Table 1). We note, however, that the majority of hGRKD mice (14/26) had a mixed pattern of mCherry labeling, hitting both CA1 and dentate gyrus. Only 9/26 hGRKDs had CA1 specific hits, and only 3/26 dentate specific hits. Futures studies designed to specifically target these regions might produce different results.
3.7. GR knockdown does not alter SE-induced cell loss
To determine whether GR knockdown might alter SE-induced cell loss, brains from the four wild-type and five hGRKD mice that entered and survived SE were collected at 48 h. A stereological series through the dorso-ventral axis of the hippocampus was stained with the cell death marker FluoroJade B (FJB). FJB-labeled cells in CA1 and the dentate hilus were quantified in each section (Fig. 5). Data from exhaustive stereological cell counts were extrapolated to estimate the total number of FJB positive cells per animal for each hippocampal region. Both hGRKD and wild-type mice displayed large numbers of FJB+ cells within the CA1 pyramidal cell body layer, but there were no differences between groups (Fig. 5B; Student’s t-test, t(7) = −0.0556, p = 0.957). Among the same mice, total hilar cell death was highly variable, but ultimately not significantly different between wild-type and hGRKD mice undergoing SE (Fig. 5C; Welch’s t-test, t(4.054) = −1.836, p = 0.139).
Fig. 5.
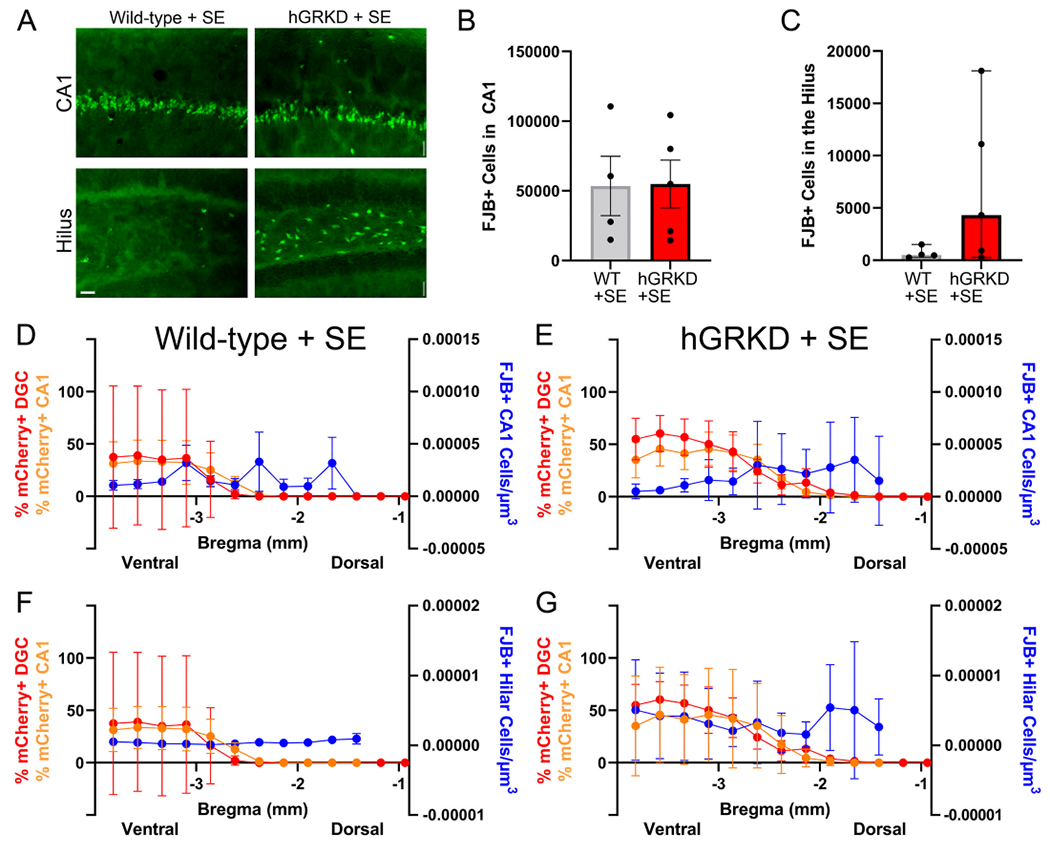
A: Cell loss was assessed by FluoroJade B (FJB) staining in the CA1 pyramidal cell layer and dentate hilus of wild-type (n = 4) and hGRKD (n = 5) mice that survived for 48 h after SE. Scale bar = 25 μm. B: Stereological cell counts produced similar estimates for the number of FJB+ dying cells in the CA1 pyramidal cell layer of wild-type and hGRKD mice. C: Greater variability in the degree of cell loss was evident in the dentate hilus of hGRKDs, however, similar to CA1, cell loss was statistically similar between hGRKDs and wild-type groups. D,E,F,G: Graphs show combined data for mCherry-expression in CA1 (orange, left y-axis) and dentate (red, left y-axis) relative to FJB+ cell densities (blue, right y-axis) along the dorso-ventral extent of the hippocampus (x-axis). Each point is the group average for each measure at that bregma level ± SEM. The smaller cohort of survivors parallels the larger group, with greater mCherry expression in ventral hippocampus. No clear relationship between hGRKD rates and cell loss, however, was evident. (For interpretation of the references to colour in this figure legend, the reader is referred to the web version of this article.)
3.8. Within-animal analyses of the impact of hippocampal GR knockdown on cell loss
Variability in the extent and predominant type of GR knockout cells could preclude detecting differences in cell loss at the whole hippocampal level, so we conducted a within-animal analysis to explore whether cell loss differed between regions with high KD rates relative to regions with lower rates. Mixed effects models using the individual animal data plotted in Supplementary Fig. 1 (wild-type mice) and 2 (hGRKD mice) were run to determine whether there was a relationship between local GR loss and local cell loss. Fig. 5D–G shows average viral coverage for CA1 and the DGC layer plotted against average hilar and CA1 FJB densities according to bregma level, although we note that this averaged data is for visualization purposes only and was not used for the within-animal analysis approach.
For cell loss in CA1, no significant effect of treatment group was evident (wild-type vs. hGRKD mice, p = 0.949), while a significant effect of bregma level was found (p = 0.010), with cell loss being higher in more dorsal regions. Cell loss, however, was not significantly associated with GR knockdown rates in CA1 (p = 0.251) or dentate gyrus (p = 0.413). Results were similar for hilar cell loss, where no significant effects were found for treatment group (p = 0.103), bregma level (p = 0.881), CA1 GR knockdown rate (p = 0.873) or dentate knockdown rate (p = 0.196). Together, the findings suggest that localized loss of GR does not impact cell survival after SE in the immediate vicinity of the targeted region.
4. Discussion
During status epilepticus (SE) the rapid increase in CORT levels has the potential to modulate the SE event, as brain regions implicated in generating seizures, such as hippocampus, express high levels of GRs. To test this possibility, we selectively deleted GRs from a subset of hippocampal excitatory neurons of adult mice prior to pilocarpine-induced SE. This hippocampal knockdown of GRs had a bimodal effect on SE, reducing the latency to mild behavioral seizures, while delaying the onset of generalized convulsive seizures and death. Interestingly, the more rapid onset of focal seizures was evident in both male and female hGRKD mice, while delayed onset of more severe seizures and death occurred only in males – with hGRKD males assuming a more female-like resistant phenotype. GR knockdown also blunted the SE-induced increase in CORT levels, but again only in males. In addition to whole animal effects on status epilepticus, variable patterns of GR knockdown within animals allowed us to query whether brain regions with large numbers of GR knockout cells suffered more or less SE-induced damage than adjacent regions with intact GR signaling. Exhaustive stereological cell counts revealed no relationship between regional patterns of cell loss within the hippocampus and GR knockdown rates, suggesting that the absence of GR neither increases nor decreases the susceptibility of individual neurons to SE-induced cell death. Together, findings support the conclusion that hippocampal GRs in excitatory neurons acutely regulate SE severity. Furthermore, the bimodal effects and pronounced sex differences demonstrate a much greater complexity of GR regulation of SE than previously appreciated.
4.1. Effects of hippocampal GR knockdown on acute seizure progression and mortality
Studies examining the impact of systemic manipulations of glucocorticoids on status epilepticus go back decades, yet findings are conflicting. Supporting a pro-convulsant role, adrenalectomy reduces susceptibility to kainic acid-induced seizures, while exogenous CORT and dexamethasone (a GR agonist) increase susceptibility (Lee et al., 1989; Talmi et al., 1995; Roberts and Keith, 1995; O’toole et al., 2014). Other studies, however, support an anti-convulsant role, with glucocorticoid treatment reducing the severity of seizures induced by chemoconvulsants (Yang et al., 2020; Marchi et al., 2011). Moreover, several investigators report no effect of manipulating glucocorticoid levels on seizure severity following chemoconvulsant challenge (Benkovic et al., 2009; Garcia-Garcia et al., 2017; Stein and Sapolsky, 1988).
Differences among species examined, seizure models, drug classes, drug-dosing regimens, and use of physiological and supraphysiological levels of glucocorticoids are likely key variables contributing to the discrepancies (Scaccianoce et al., 1997). In addition, glucocorticoids act on numerous cell types throughout the hypothalamic-pituitary-adrenal axis to produce a wide range of effects, including negative feedback regulation of their own secretion. Finally, glucocorticoids bind to and mediate their effects through two distinct receptor types: glucocorticoid receptors (GRs) and mineralocorticoid receptors (MRs). Both receptor types can produce rapid effects following ligand binding at the cell membrane, and slower transcription-dependent effects at the nucleus (De Kloet, 2014). The complexity of glucocorticoid action, therefore, poses a significant challenge to understanding whether and how specific cell types modulate injury responses.
For the present study, the key advance is the selective deletion of GRs from a subset of excitatory hippocampal neurons, thus providing direct insights into whether activation of GRs among these neurons contributes to SE severity. The bimodal effect of GR loss is particularly intriguing. Class 3 seizures, which showed accelerated onset in hGRKDs, are considered to reflect more restricted (focal) involvement of neurons and brain regions relative to class 4 and 5 seizures, which showed delayed onset. It can be inferred, therefore, that GR loss from hippocampal neurons slowed the recruitment of other brain regions. Hippocampal outputs project widely throughout the brain, so the structure is well-position to mediate seizure spread, and studies in animals that develop epilepsy after pilocarpine status epilepticus implicate ventral hippocampus as the seizure onset zone (Buckmaster et al., 2022; Wyeth et al., 2020). The effect is even more notable given that class 3 seizures began about 12 min earlier in GRKOs than controls, such that GRKO brains constrained seizure spread for 22 min, whereas controls progressed almost immediately from class 3 to class 4. The primary effect of hippocampal GRs, therefore, would seem to be on regulating seizure spread throughout the brain. Future studies combining GR knockdown with EEG recordings will be needed to confirm these inferences, but the behavioral readouts provide clear, testable predictions.
4.2. Mechanisms of altered seizure spread
Numerous mechanisms can be proposed for how hippocampal GR knockdown might regulate seizure spread. GRs can regulate ion channel composition, membrane properties and other parameters affecting neuronal excitability (Azmitia and Mcewen, 1974; McEwen and Sapolsky, 1995; Sloviter et al., 1993; Sloviter et al., 1989; Vaher et al., 1994). A straightforward prediction, thus, is that GR loss might reduce neuronal activity within the hippocampus such that firing is sufficient only to sustain more focal seizures, but not to robustly recruit extrahippocampal structures. Alternatively, GRs can regulate long-term potentiation (Lengel et al., 2022), and potentiation of granule cell – mossy cell synapses has been shown to increase SE severity following kainic acid treatment (Nasrallah et al., 2022). Indeed, GR knockdown in the present study occurred in neurons (dentate, CA1, CA3) participating in the three key synapses of the classic hippocampal trisynaptic circuit, and altered synaptic strength or plasticity at any (or all) of these could reduce hippocampal output.
4.3. Sex-dependent regulation of SE severity by hippocampal GRs
The present study revealed that hippocampal GRs in male mice increase vulnerability to more severe seizures in SE. Such evidence for sexual dimorphisms in the HPA axis is abundant. For example, the pattern of GR expression has been shown to be sexually dimorphic in rodent models (Ahima et al., 1992), and recent work in which GRs were deleted from cortical and hippocampal pyramidal neurons revealed sex differences in the impact of GR deletion on dendritic structure, spine density and miRNA expression (Tejos-Bravo et al., 2021). Forebrain-specific GR deletion and hypothalamic GR deletion has also been shown to produce sexually dimorphic effects on a variety of physiological and behavioral outcome measures (Solomon et al., 2012; Solomon et al., 2015). Despite clear dimorphisms in rodents, evidence for differential vulnerability to seizures is ambiguous, with SE susceptibility varying by seizure model, species (rat vs. mouse) and strain (Christian et al., 2020). In humans, clinical studies suggest that men exhibit greater susceptibility to developing epilepsy than women, however, this does vary, with women being more susceptible to certain types of epilepsy (Reddy et al., 2021). Whether men are more or less susceptible to status epilepticus is unclear, with studies concluding greater incidence (Logroscino et al., 2005; Reddy et al., 2021; Bhalla et al., 2014; Govoni et al., 2008; Coeytaux et al., 2000; Hesdorffer et al., 1998; Knake et al., 2001), reduced incidence (Gasparini et al., 2021; Vignatelli et al., 2005) and no difference relative to women (Lv et al., 2017). Extensive expression of GRs among central and peripheral organ systems make these conflicting findings difficult to interpret, highlighting the advantages of cell- and tissue-specific manipulations as utilized here.
4.4. Effect of GR knockdown on neuronal cell loss
Variability in the pattern of GR knockout cells in the present study allowed us to query whether GRs impact cell survival following status epilepticus. Pilocarpine status epilepticus – and seizure models in general – often produce highly variable patterns of cell loss despite behaviorally similar SE severities (Danzer et al., 2010). This variability was evident among wild-type animals in the present study (Supplementary Fig. 1). Whether and why some neurons die, while others survive remains a poorly understood phenomenon in the epilepsy field. Neuronal GR expression could have a cell-intrinsic impact on neuronal survival. Specifically, glucocorticoids can exacerbate seizure-induced neuronal injury (Sorrells et al., 2014; Duffy et al., 2014) and glucocorticoid antagonists applied after SE can limit subsequent neuronal loss (Wulsin et al., 2016a), so receptor knockdown before SE might plausibly impact the ability of affected neurons to survive the insult. Among hGRKD animals, however, we found no relationship between regional GR knockdown rates and cell loss (Supplementary Fig. 2). We do note the caveat that dying neurons might degrade the mCherry protein, making double-labeled FJB+/mCherry+ regions harder to detect. Granule cells were rarely immunoreactive for FJB in the present study (data not shown), so this is not an issue for the dentate, however, cell loss in CA1 can be significant. If mCherry+, GRKD cells were consistently dying in the CA1, one would expect a negative relationship between FJB immunoreactivity and mCherry labeling. As this was not evident in the data (Supplementary Fig. 2), the scenario seems less likely. We also note that only five surviving hGRKD mice were available for this analysis, so results could be impacted by a survivor bias. Nonetheless, we consider the negative result to be reasonably robust because the analysis allowed for within-animal comparisons. Specifically, each hGRKD mouse contained regions with both high and low knockdown rates, providing multiple opportunities to look for a relationship between cell loss and GR knockdown, both along the dorso-ventral extent of the hippocampus and across hemispheres. The absence of any strong relationships from this within-animal approach suggests that GR loss does not have a strong impact on SE-induced neuronal loss. Findings are consistent with prior research suggesting that GR signaling among myeloid and endothelial cells plays a bigger role in seizure-induced cell loss than neuronal signaling (Sorrells et al., 2013).
5. Conclusions
The present findings indicate that hippocampal GRs bimodally modulate status epilepticus severity through both sex-independent and sex-dependent effects. Findings provide direct evidence for the importance of hippocampal GRs in modulating the severity of status epilepticus and suggest that a key effect of GR action may be to regulate the ability of hippocampal seizures to recruit extrahippocampal structures.
Supplementary Material
Acknowledgements
The authors would like to thank Matt Kofron, PhD, Sarah McLeod, and Marina George, PhD with the Cincinnati Children’s Hospital (CCHMC) Confocal Imaging Core for their assistance and expertise in the acquisition and analysis of imaging data. We would also like to recognize the quality care and effort provided by the Vet Services staff at the CCHMC vivarium. Finally, we thank Lili Ding, PhD and Qing Duan in the Division of Biostatistics and Epidemiology at CCHMC for statistical guidance and analyses.
Funding
This work was supported by NINDS grants F31NS115525 (CMG), F31NS122484 (KLK), R01-NS-062806 (SCD), R01-NS-065020 (SCD) and R01-NS-121042 (SCD).
Abbreviations:
- GR
glucocorticoid receptor
- MR
mineralocorticoid receptor
- SE
status epilepticus
- WT
wild-type
- hGRKD
hippocampal glucocorticoid receptor knockdown
- HPA
hypothalamic-pituitary adrenal axis
- CORT
corticosterone
- ILAE
International League Against Epilepsy
- FJB
Fluoro-Jade B
- DGC-L
dentate granule cell layer
- fl
floxed
- AAV9
adeno-associated virus serotype 9
- CaMKII
calcium-calmodulin dependent kinase II
- M
male
- F
female
- Cre
cre recombinase
Footnotes
Supplementary data to this article can be found online at https://doi.org/10.1016/j.nbd.2023.106014.
Declaration of Competing Interest
The authors have no relevant conflicts of interest to disclose.
Data availability
Data will be made available on request.
References
- Abbott RJ, Browning MC, Davidson DL, 1980. Serum prolactin and cortisol concentrations after grand mal seizures. J. Neurol. Neurosurg. Psychiatry 43, 163–167. [DOI] [PMC free article] [PubMed] [Google Scholar]
- Ahima RS, Harlan RE, 1990. Charting of type II glucocorticoid receptor-like immunoreactivity in the rat central nervous system. Neuroscience 39, 579–604. [DOI] [PubMed] [Google Scholar]
- Ahima RS, Lawson AN, Osei SY, Harlan RE, 1992. Sexual dimorphism in regulation of type II corticosteroid receptor immunoreactivity in the rat hippocampus. Endocrinology 131, 1409–1416. [DOI] [PubMed] [Google Scholar]
- Ascoli M, Ferlazzo E, Gasparini S, Mastroianni G, Citraro R, Roberti R, Russo E, 2021. Epidemiology and outcomes of status epilepticus. Int. J. Gen. Med 14, 2965–2973. [DOI] [PMC free article] [PubMed] [Google Scholar]
- Azmitia EC, Mcewen BS, 1974. Adrenalcortical influence on rat brain tryptophan hydroxylase activity. Brain Res. 78, 291–302. [DOI] [PubMed] [Google Scholar]
- Benkovic SA, O’callaghan JP, Miller DB, 2009. Protracted exposure to supraphysiological levels of corticosterone does not cause neuronal loss or damage and protects against kainic acid-induced neurotoxicity in the hippocampus of C57BL/6J mice. Neurotoxicology 30, 965–976. [DOI] [PubMed] [Google Scholar]
- Bhalla D, Tchalla AE, Mignard C, Marin B, Mignard D, Jallon P, Preux PM, 2014. First-ever population-based study on status epilepticus in French Island of La Reunion (France) - incidence and fatality. Seizure 23, 769–773. [DOI] [PubMed] [Google Scholar]
- Buckmaster PS, Reyes B, Kahn T, Wyeth M, 2022. Ventral hippocampal formation is the primary epileptogenic zone in a rat model of temporal lobe epilepsy. J. Neurosci 42, 7482–7495. [DOI] [PMC free article] [PubMed] [Google Scholar]
- Castro OW, Santos VR, Pun RY, Mcklveen JM, Batie M, Holland KD, Gardner M, Garcia-Cairasco N, Herman JP, Danzer SC, 2012. Impact of corticosterone treatment on spontaneous seizure frequency and epileptiform activity in mice with chronic epilepsy. PLoS One 7, e46044. [DOI] [PMC free article] [PubMed] [Google Scholar]
- Christian CA, Reddy DS, Maguire J, Forcelli PA, 2020. Sex differences in the epilepsies and associated comorbidities: implications for use and development of pharmacotherapies. Pharmacol. Rev 72, 767–800. [DOI] [PMC free article] [PubMed] [Google Scholar]
- Coeytaux A, Jallon P, Galobardes B, Morabia A, 2000. Incidence of status epilepticus in French-speaking Switzerland: (EPISTAR). Neurology 55, 693–697. [DOI] [PubMed] [Google Scholar]
- Danzer SC, He X, Loepke AW, Mcnamara JO, 2010. Structural plasticity of dentate granule cell mossy fibers during the development of limbic epilepsy. Hippocampus 20, 113–124. [DOI] [PMC free article] [PubMed] [Google Scholar]
- De Kloet ER, 2014. From receptor balance to rational glucocorticoid therapy. Endocrinology 155, 2754–2769. [DOI] [PubMed] [Google Scholar]
- Dham BS, Hunter K, Rincon F, 2014. The epidemiology of status epilepticus in the United States. Neurocrit. Care 20, 476–483. [DOI] [PubMed] [Google Scholar]
- Duffy BA, Chun KP, Ma D, Lythgoe MF, Scott RC, 2014. Dexamethasone exacerbates cerebral edema and brain injury following lithium-pilocarpine induced status epilepticus. Neurobiol. Dis 63, 229–236. [DOI] [PMC free article] [PubMed] [Google Scholar]
- Ehlers CL, Killam EK, 1979. The influence of cortisone on Eeg and seizure activity in the baboon Papio papio. Electroencephalogr. Clin. Neurophysiol 47, 404–410. [DOI] [PubMed] [Google Scholar]
- Garcia-Garcia L, Shiha AA, Fernandez De La Rosa R, Delgado M, Silvan A, Bascunana P, Bankstahl JP, Gomez F, Pozo MA, 2017. Metyrapone prevents brain damage induced by status epilepticus in the rat lithium-pilocarpine model. Neuropharmacology 123, 261–273. [DOI] [PubMed] [Google Scholar]
- Gasparini S, Ferlazzo E, Gigli G, Pauletto G, Nilo A, Lettieri C, Bilo L, Labate A, Fortunato F, Varrasi C, Cantello R, D’aniello A, Gennaro GD, D’orsi G, Sabetta A, Claudio MTD, Avolio C, Dono F, Evangelista G, Cavalli SM, Cianci V, Ascoli M, Mastroianni G, Lobianco C, Neri S, Mercuri S, Mammì A, Gambardella A, Beghi E, Torino C, Tripepi G, Aguglia U, 2021. Predictive factors of Status Epilepticus and its recurrence in patients with adult-onset seizures: a multicenter, long follow-up cohort study. Seizure 91, 397–401. [DOI] [PubMed] [Google Scholar]
- Govoni V, Fallica E, Monetti VC, Guerzoni F, Faggioli R, Casetta I, Granieri E, 2008. Incidence of status epilepticus in southern Europe: a population study in the health district of Ferrara, Italy. Eur. Neurol 59, 120–126. [DOI] [PubMed] [Google Scholar]
- Gundersen HJ, Jensen EB, 1987. The efficiency of systematic sampling in stereology and its prediction. J. Microsc 147, 229–263. [DOI] [PubMed] [Google Scholar]
- Herman JP, 1993. Regulation of adrenocorticosteroid receptor mRNA expression in the central nervous system. Cell. Mol. Neurobiol 13, 349–372. [DOI] [PMC free article] [PubMed] [Google Scholar]
- Herman JP, Schäfer MK, Young EA, Thompson R, Douglass J, Akil H, Watson SJ, 1989. Evidence for hippocampal regulation of neuroendocrine neurons of the hypothalamo-pituitary-adrenocortical axis. J. Neurosci 9, 3072–3082. [DOI] [PMC free article] [PubMed] [Google Scholar]
- Hesdorffer DC, Logroscino G, Cascino G, Annegers JF, Hauser WA, 1998. Incidence of status epilepticus in Rochester, Minnesota, 1965-1984. Neurology 50, 735–741. [DOI] [PubMed] [Google Scholar]
- Hester MS, Danzer SC, 2013. Accumulation of abnormal adult-generated hippocampal granule cells predicts seizure frequency and severity. J. Neurosci 33, 8926–8936. [DOI] [PMC free article] [PubMed] [Google Scholar]
- Hester MS, Hosford BE, Santos VR, Singh SP, Rolle IJ, Lasarge CL, Liska JP, Garcia-Cairasco N, Danzer SC, 2016. Impact of rapamycin on status epilepticus induced hippocampal pathology and weight gain. Exp. Neurol 280, 1–12. [DOI] [PMC free article] [PubMed] [Google Scholar]
- Hosford BE, Rowley S, Liska JP, Danzer SC, 2017. Ablation of peri-insult generated granule cells after epilepsy onset halts disease progression. Sci. Rep 7, 18015. [DOI] [PMC free article] [PubMed] [Google Scholar]
- Jain S, Lafrancois JJ, Botterill JJ, Alcantara-Gonzalez D, Scharfman HE, 2019. Adult neurogenesis in the mouse dentate gyrus protects the hippocampus from neuronal injury following severe seizures. Hippocampus 29, 683–709. [DOI] [PMC free article] [PubMed] [Google Scholar]
- Jaszczyk A, Juszczak GR, 2021. Glucocorticoids, metabolism and brain activity. Neurosci. Biobehav. Rev 126, 113–145. [DOI] [PubMed] [Google Scholar]
- Joëls M, 2018. Corticosteroids and the brain. J. Endocrinol 238, R121–r130. [DOI] [PubMed] [Google Scholar]
- Karst H, De Kloet ER, Joëls M, 1999. Episodic corticosterone treatment accelerates kindling epileptogenesis and triggers long-term changes in hippocampal CA1 cells, in the fully kindled state. Eur. J. Neurosci 11, 889–898. [DOI] [PubMed] [Google Scholar]
- Kirmani BF, Au K, Ayari L, John M, Shetty P, Delorenzo RJ, 2021. Super-refractory status epilepticus: prognosis and recent advances in management. Aging Dis. 12, 1097–1119. [DOI] [PMC free article] [PubMed] [Google Scholar]
- Knake S, Rosenow F, Vescovi M, Oertel WH, Mueller HH, Wirbatz A, Katsarou N, Hamer HM, 2001. Incidence of status epilepticus in adults in Germany: a prospective, population-based study. Epilepsia 42, 714–718. [DOI] [PubMed] [Google Scholar]
- Koe AS, Salzberg MR, Morris MJ, O’brien TJ, Jones NC, 2014. Early life maternal separation stress augmentation of limbic epileptogenesis: the role of corticosterone and Hpa axis programming. Psychoneuroendocrinology 42, 124–133. [DOI] [PubMed] [Google Scholar]
- Kraus KL, Chordia AP, Drake AW, Herman JP, Danzer SC, 2022. Hippocampal interneurons are direct targets for circulating glucocorticoids. J. Comp. Neurol 530, 2100–2112. [DOI] [PMC free article] [PubMed] [Google Scholar]
- Kumar G, Couper A, O’brien TJ, Salzberg MR, Jones NC, Rees SM, Morris MJ, 2007. The acceleration of amygdala kindling epileptogenesis by chronic low-dose corticosterone involves both mineralocorticoid and glucocorticoid receptors. Psychoneuroendocrinology 32, 834–842. [DOI] [PubMed] [Google Scholar]
- Lee PH, Zhao DY, Mitchell CL, Hong JS, 1987. Effects of corticosterone on shaking and seizure behavior induced by deep prepyriform cortex kindling. Neurosci. Lett 82, 337–342. [DOI] [PubMed] [Google Scholar]
- Lee PH, Grimes L, Hong JS, 1989. Glucocorticoids potentiate kainic acid-induced seizures and wet dog shakes. Brain Res. 480, 322–325. [DOI] [PubMed] [Google Scholar]
- Lengel D, Romm ZL, Bostwick A, Huh JW, Snyder NW, Smith GM, Raghupathi R, 2022. Glucocorticoid receptor overexpression in the dorsal hippocampus attenuates spatial learning and synaptic plasticity deficits after pediatric traumatic brain injury. J. Neurotrauma 39, 979–998. [DOI] [PMC free article] [PubMed] [Google Scholar]
- Liu Z, Chen O, Wall JBJ, Zheng M, Zhou Y, Wang L, Vaseghi HR, Qian L, Liu J, 2017. Systematic comparison of 2A peptides for cloning multi-genes in a polycistronic vector. Sci. Rep 7, 2193. [DOI] [PMC free article] [PubMed] [Google Scholar]
- Logroscino G, Hesdorffer DC, Cascino G, Hauser WA, Coeytaux A, Galobardes B, Morabia A, Jallon P, 2005. Mortality after a first episode of status epilepticus in the United States and Europe. Epilepsia 46 (Suppl. 11), 46–48. [DOI] [PubMed] [Google Scholar]
- Lv RJ, Wang Q, Cui T, Zhu F, Shao XQ, 2017. Status epilepticus-related etiology, incidence and mortality: a meta-analysis. Epilepsy Res. 136, 12–17. [DOI] [PubMed] [Google Scholar]
- Marchi N, Granata T, Freri E, Ciusani E, Ragona F, Puvenna V, Teng Q, Alexopolous A, Janigro D, 2011. Efficacy of anti-inflammatory therapy in a model of acute seizures and in a population of pediatric drug resistant epileptics. PLoS One 6, e18200. [DOI] [PMC free article] [PubMed] [Google Scholar]
- McAuliffe JJ, Bronson SL, Hester MS, Murphy BL, Dahlquist-Topala R, Richards DA, Danzer SC, 2011. Altered patterning of dentate granule cell mossy fiber inputs onto CA3 pyramidal cells in limbic epilepsy. Hippocampus 21, 93–107. [DOI] [PMC free article] [PubMed] [Google Scholar]
- McEwen BS, Sapolsky RM, 1995. Stress and cognitive function. Curr. Opin. Neurobiol 5, 205–216. [DOI] [PubMed] [Google Scholar]
- Nasrallah K, Frechou MA, Yoon YJ, Persaud S, Gonçalves JT, Castillo PE, 2022. Seizure-induced strengthening of a recurrent excitatory circuit in the dentate gyrus is proconvulsant. Proc. Natl. Acad. Sci. U. S. A 119, e2201151119. [DOI] [PMC free article] [PubMed] [Google Scholar]
- OLESEN MV, NEEDHAM, PAKKENBERG B, 2017. The Optical Fractionator Technique to Estimate Cell Numbers in a Rat Model of Electroconvulsive Therapy. J Vis Exp 125, 55737. [DOI] [PMC free article] [PubMed] [Google Scholar]
- O’toole KK, Hooper A, Wakefield S, Maguire J, 2014. Seizure-induced disinhibition of the Hpa axis increases seizure susceptibility. Epilepsy Res. 108, 29–43. [DOI] [PMC free article] [PubMed] [Google Scholar]
- Racine RJ, 1972. Modification of seizure activity by electrical stimulation. II. Motor seizure. Electroencephalogr. Clin. Neurophysiol 32, 281–294. [DOI] [PubMed] [Google Scholar]
- Reddy DS, Thompson W, Calderara G, 2021. Molecular mechanisms of sex differences in epilepsy and seizure susceptibility in chemical, genetic and acquired epileptogenesis. Neurosci. Lett 750, 135753. [DOI] [PMC free article] [PubMed] [Google Scholar]
- Reul JM, De Kloet ER, 1985. Two receptor systems for corticosterone in rat brain: microdistribution and differential occupation. Endocrinology 117, 2505–2511. [DOI] [PubMed] [Google Scholar]
- Roberts AJ, Keith LD, 1995. Corticosteroids enhance convulsion susceptibility via central mineralocorticoid receptors. Psychoneuroendocrinology 20, 891–902. [DOI] [PubMed] [Google Scholar]
- Santos VR, De Castro OW, Pun RY, Hester MS, Murphy BL, Loepke AW, Garcia-Cairasco N, Danzer SC, 2011. Contributions of mature granule cells to structural plasticity in temporal lobe epilepsy. Neuroscience 197, 348–357. [DOI] [PMC free article] [PubMed] [Google Scholar]
- Scaccianoce S, Alemà GS, Cigliana G, Nicolai R, Buttarelli FR, Angelucci L, 1997. Neurotoxicity of kainate to the hippocampus is not accrued by aging, stress and exogenous corticosterone in wistar kyoto and spontaneously hypertensive rats. Stress 1, 201–212. [DOI] [PubMed] [Google Scholar]
- Sloviter RS, Valiquette G, Abrams GM, Ronk EC, Sollas AL, Paul LA, Neubort S, 1989. Selective loss of hippocampal granule cells in the mature rat brain after adrenalectomy. Science 243, 535–538. [DOI] [PubMed] [Google Scholar]
- Sloviter RS, Sollas AL, Dean E, Neubort S, 1993. Adrenalectomy-induced granule cell degeneration in the rat hippocampal dentate gyrus: characterization of an in vivo model of controlled neuronal death. J. Comp. Neurol 330, 324–336. [DOI] [PubMed] [Google Scholar]
- Solomon MB, Furay AR, Jones K, Packard AE, Packard BA, Wulsin AC, Herman JP, 2012. Deletion of forebrain glucocorticoid receptors impairs neuroendocrine stress responses and induces depression-like behavior in males but not females. Neuroscience 203, 135–143. [DOI] [PMC free article] [PubMed] [Google Scholar]
- Solomon MB, Loftspring M, De Kloet AD, Ghosal S, Jankord R, Flak JN, Wulsin AC, Krause EG, Zhang R, Rice T, Mcklveen J, Myers B, Tasker JG, Herman JP, 2015. Neuroendocrine function after hypothalamic depletion of glucocorticoid receptors in male and female mice. Endocrinology 156, 2843–2853. [DOI] [PMC free article] [PubMed] [Google Scholar]
- Sorrells SF, Caso JR, Munhoz CD, Hu CK, Tran KV, Miguel ZD, Chien BY, Sapolsky RM, 2013. Glucocorticoid signaling in myeloid cells worsens acute CNS injury and inflammation. J. Neurosci 33, 7877–7889. [DOI] [PMC free article] [PubMed] [Google Scholar]
- Sorrells SF, Munhoz CD, Manley NC, Yen S, Sapolsky RM, 2014. Glucocorticoids increase excitotoxic injury and inflammation in the hippocampus of adult male rats. Neuroendocrinology 100, 129–140. [DOI] [PMC free article] [PubMed] [Google Scholar]
- Stein BA, Sapolsky RM, 1988. Chemical adrenalectomy reduces hippocampal damage induced by kainic acid. Brain Res. 473, 175–180. [DOI] [PubMed] [Google Scholar]
- Taher TR, Salzberg M, Morris MJ, Rees S, O’brien TJ, 2005. Chronic low-dose corticosterone supplementation enhances acquired epileptogenesis in the rat amygdala kindling model of TLE. Neuropsychopharmacology 30, 1610–1616. [DOI] [PubMed] [Google Scholar]
- Talmi M, Carlier E, Bengelloun W, Soumireu-Mourat B, 1995. Synergistic action of corticosterone on kainic acid-induced electrophysiological alterations in the hippocampus. Brain Res. 704, 97–102. [DOI] [PubMed] [Google Scholar]
- Tejos-Bravo M, Oakley RH, Whirledge SD, Corrales WA, Silva JP, García-Rojo G, Toledo J, Sanchez W, Román-Albasini L, Aliaga E, Aguayo F, Olave F, Maracaja-Coutinho V, Cidlowski JA, Fiedler JL, 2021. Deletion of hippocampal Glucocorticoid receptors unveils sex-biased microRNA expression and neuronal morphology alterations in mice. Neurobiol. Stress 14, 100306. [DOI] [PMC free article] [PubMed] [Google Scholar]
- Trinka E, Cock H, Hesdorffer D, Rossetti AO, Scheffer IE, Shinnar S, Shorvon S, Lowenstein DH, 2015. A definition and classification of status epilepticus–Report of the ILAE Task Force on Classification of Status Epilepticus. Epilepsia 56, 1515–1523. [DOI] [PubMed] [Google Scholar]
- Vaher PR, Luine VN, Gould E, Mcewen BS, 1994. Effects of adrenalectomy on spatial memory performance and dentate gyrus morphology. Brain Res. 656, 71–78. [DOI] [PubMed] [Google Scholar]
- VAN EEKELEN JA, JIANG W, DE KLOET, BOHN MC, 1988. Distribution of the mineralocorticoid and the glucocorticoid receptor mRNAs in the rat hippocampus. J Neurosci Res 21, 88–94. [DOI] [PubMed] [Google Scholar]
- Vignatelli L, Rinaldi R, Galeotti M, De Carolis P, D’alessandro R, 2005. Epidemiology of status epilepticus in a rural area of northern Italy: a 2-year population-based study. Eur. J. Neurol 12, 897–902. [DOI] [PubMed] [Google Scholar]
- Walter C, Murphy BL, Pun RY, Spieles-Engemann AL, Danzer SC, 2007. Pilocarpine-induced seizures cause selective time-dependent changes to adult-generated hippocampal dentate granule cells. J. Neurosci 27, 7541–7552. [DOI] [PMC free article] [PubMed] [Google Scholar]
- Wang Q, Van Heerikhuize J, Aronica E, Kawata M, Seress L, Joels M, Swaab DF, Lucassen PJ, 2013. Glucocorticoid receptor protein expression in human hippocampus; stability with age. Neurobiol. Aging 34, 1662–1673. [DOI] [PubMed] [Google Scholar]
- Wulsin AC, Herman JP, Danzer SC, 2016a. RU486 mitigates hippocampal pathology following status epilepticus. Front. Neurol 7, 214. [DOI] [PMC free article] [PubMed] [Google Scholar]
- Wulsin AC, Solomon MB, Privitera MD, Danzer SC, Herman JP, 2016b. Hypothalamic-pituitary-adrenocortical axis dysfunction in epilepsy. Physiol. Behav 166, 22–31. [DOI] [PMC free article] [PubMed] [Google Scholar]
- Wulsin AC, Franco-Villanueva A, Romancheck C, Morano RL, Smith BL, Packard BA, Danzer SC, Herman JP, 2018. Functional disruption of stress modulatory circuits in a model of temporal lobe epilepsy. PLoS One 13, e0197955. [DOI] [PMC free article] [PubMed] [Google Scholar]
- Wulsin AC, Kraus KL, Gaitonde KD, Suru V, Arafa SR, Packard BA, Herman JP, Danzer SC, 2021. The glucocorticoid receptor specific modulator CORT108297 reduces brain pathology following status epilepticus. Exp. Neurol 341, 113703. [DOI] [PMC free article] [PubMed] [Google Scholar]
- Wyeth M, Nagendran M, Buckmaster PS, 2020. Ictal onset sites and γ-aminobutyric acidergic neuron loss in epileptic pilocarpine-treated rats. Epilepsia 61, 856–867. [DOI] [PMC free article] [PubMed] [Google Scholar]
- Yang N, Zhang Y, Wang JT, Chen C, Song Y, Liang JM, Ma DH, Zhang YF, 2020. Effects of dexamethasone on remodeling of the hippocampal synaptic filamentous actin cytoskeleton in a model of pilocarpine-induced status epilepticus. Int. J. Med. Sci 17, 1683–1691. [DOI] [PMC free article] [PubMed] [Google Scholar]
Associated Data
This section collects any data citations, data availability statements, or supplementary materials included in this article.
Supplementary Materials
Data Availability Statement
Data will be made available on request.