

Abstract
We conducted (I) 18 event-related potential (ERP) field tests to detect concealed information regarding major terrorist crimes and other real-world crimes and (II) 5 ERP tests regarding participation in a classified counterterrorism operation. This study is a test of the brain fingerprinting scientific standards hypothesis: that a specific set of methods for event-related potential (ERP) concealed information tests (CIT) known as the brain fingerprinting scientific standards provide the sufficient conditions to produce less than 1% error rate and greater than 95% median statistical confidence for individual determinations of whether the tested information is stored in each subject’s brain. All previous published results in all laboratories are compatible with this hypothesis. We recorded P300 and P300-MERMER ERP responses to visual text stimuli of three types: targets contain known information, irrelevants contain unknown/irrelevant information, and probes contain the situation-relevant information to be tested, known only to the perpetrator and investigators. Classification CIT produced significantly better results than comparison CIT, independent of classification criteria. Classification CIT had 0% error rate; comparison CIT had 6% error rate. As in previous studies, classification-CIT median statistical confidences were approximately 99%, whereas comparison CIT statistical confidences were no better than chance for information-absent (IA) subjects (who did not know the tested information). Over half of the comparison-CIT IA determinations were invalid due to a less-than-chance computed probability of being correct. Experiment (I) results for median statistical confidence: Classification CIT, IA subjects: 98.6%; information-present (IP) subjects (who know the tested information): 99.9%; comparison CIT, IA subjects: 48.7%; IP subjects: 99.5%. Experiment (II) results (Classification CIT): error rate 0%, median statistical confidence 96.6%. Countermeasures had no effect on the classification CIT. These results, like all previous results in our laboratory and all others, support the brain fingerprinting scientific standards hypothesis and indicate that the classification CIT is a necessary condition for a reliable, accurate, and valid brainwave-based CIT. The comparison CIT, by contrast, produces high error rates and IA statistical confidences no better than chance.
Supplementary Information
The online version contains supplementary material available at 10.1007/s11571-022-09795-1.
Keywords: Brain fingerprinting, Concealed information test, P300, P300-MERMER, ERP, Classification CIT, Comparison CIT, Counterterrorism, Terrorism, Criminal investigation, Scientific standards, Detection of concealed information, MERMER, Guilty knowledge test, Lie detection, Forensic science, Field study, Forensic neuroscience
Introduction
Previous related research
In our previous field studies (e.g., Farwell et al. 2013), we applied a very specific method of event-related brain potential (ERP)-based classification concealed information test (classification CIT) in the investigation of real-world crimes. We refer to the particular method practiced therein as the “brain fingerprinting” method. In previous publications (Farwell 1992, 1994, 1995a, 1995b, 2007, 2010, 2012, 2013, 2014; Farwell and Donchin 1986 [abstract], 1988a [abstract], 1991; Farwell and Smith 2001; Farwell et al. 2013; Farwell et al. 2014) we have specified in detail what this method entails and how it differs from other methods of brainwave-based CITs. Farwell and Farwell (1995) investigated the role of consciousness in similar neurological and psychophysiological phenomena applying quantum physics apparatus and protocols.
Farwell and Donchin (1991) applied this method to detect concealed information regarding both real minor crimes and mock espionage crimes. Farwell and FBI scientist Sharon Smith (Farwell and Smith 2001; Roberts (2007); applied this specific method to detect information regarding real-world events in the lives of FBI agents. Farwell, FBI scientist Drew Richardson, and present author Graham Richardson (Farwell et al. 2013) applied it to detect (1) Information regarding the FBI stored in the brains of FBI agents; (2) Information regarding bomb making stored in the brains of improvised explosive device (IED)/explosive ordnance disposal (EOD) experts; (3) And information regarding real-world crimes in two studies, one funded by the CIA. Farwell et al. (2014) applied it in another CIA-funded study to detect concealed information known to US Navy military medical experts. All these studies achieved 0% error rate and over 95% median statistical confidences.
Independent replications of the same methods, i.e., studies that met the brain fingerprinting scientific standards as described herein (see Appendix 1), consistently achieved essentially the same results. For example, Allen and Iacono (1997; see also Miller 2010) also achieved 0% error rate, high statistical confidences, and resistance to countermeasures with the classification CIT in a replication of Farwell and Donchin’s (1991) study conducted according to the brain fingerprinting scientific standards. Unlike all of the above studies except Farwell and Donchin (1991), they reported some indeterminate results.1 Neshige et al. (1991) developed a similar method in Japan, using photographs as stimuli.
The crimes we previously investigated with this method and reported in previous publications were committed by one or two individuals acting alone. Planning, if any, was done solely by the perpetrator(s). These crimes included, for example, two unplanned murders and one murder planned and perpetrated by a serial killer.
Highlights of innovation in the present study
The present study comprises the following innovations: the first application of the ERP-based CIT in real-world counterterrorism cases; the first application of the ERP-based CIT in investigation of crimes with multiple perpetrators; and the first application of the ERP-based CIT in detection of information stored in the brains of the planners as well as the perpetrators of real-world crimes; the first to empirically compare the classification CIT and the comparison CIT in specific-issue cases; the first to empirically compare the classification CIT and the comparison CIT in field cases; the first to test the predictions of the brain fingerprinting scientific standards hypothesis (the only existing hypothesis to explain the distribution of results in previous studies) in specific-issue, field, and counterterrorism cases and cases involving multiple perpetrators and planners; and the innovation of applying classification operating characteristic (COC) curves and analysis and area between curves (ABC) analysis to ERP data and to CIT data.
The present study: a counterterrorism and real-crime field study
In the current study we have included crimes committed by individuals acting alone or with one or two others, as in previous studies. For example, we include one unplanned murder committed by two perpetrators, with one accomplice and no one else involved in the crime.
In addition, however, in the present study we have applied the same “brain fingerprinting” forensic science method in the investigation of terrorist crimes. These terrorist crimes were planned, orchestrated, and perpetrated by terrorist organizations involving multiple individuals. In each case only a few of the individuals physically carried out the crime at the crime scene, while multiple individuals were involved in planning and orchestrating the crimes. Investigation of such terrorist crimes involves different challenges from those encountered in our previous field studies.
We designed and conducted brain fingerprinting tests to detect concealed information regarding a several terrorist crimes. Examples are as follows:
A hijacking wherein all of the hijackers were killed. One handler and one mastermind who planned and orchestrated the crime remained to be brought to justice. We developed a brain fingerprinting test to detect concealed information known only to the mastermind and to the handler (and to investigators).
A mass shooting involving multiple victims and multiple shooters. Some of the shooters died at the scene, along with numerous victims. Some of the shooters were neither killed, captured, nor identified at the scene. The surviving shooters, along with the mastermind and handler, remained to be brought to justice. We developed a brain fingerprinting test to detect information known only to the surviving shooters, the mastermind, and the handler (and to investigators).
A suicide bombing in which the suicide bomber died at the scene, along with multiple victims. A mastermind planned the attack and recruited the suicide bomber. A handler provided instructions, explosives, and logistical support for the suicide bomber. We developed a brain fingerprinting test to detect information known only to the mastermind and handler (and to investigators).
We applied these same methods in the investigation of real-world non-terrorist crimes.
The brain fingerprinting scientific standards hypothesis
The most striking feature of the research on brainwave-based concealed information tests to date is the sharp bimodal distribution of results with respect to both error rate and statistical confidences for individual determinations. The brain fingerprinting scientific standards hypothesis is the only hypothesis advanced so far to explain this pattern.
The present paper is a test of the brain fingerprinting scientific standards hypothesis on the detection of concealed information regarding major real-world terrorist crimes as well as conventional crimes.
The brain fingerprinting scientific standards hypothesis explains the following facts. One set of methods has consistently produced error rates of less than 1% (actually, 0%) and median statistical confidences of greater than 95% in every published study. Another, fundamentally different set of methods has produced widely variable error rates, averaging 20%–30% and sometimes as high as 50% (chance), along with statistical confidences consistently averaging no better than chance (50%) for information-absent determinations.
Farwell, D. Richardson, G. Richardson, and Furedy (Farwell 2012; Farwell et al. 2013; Farwell et al. 2014) proposed the brain fingerprinting scientific standards hypothesis to explain these results. The threefold hypothesis refers to the published brain fingerprinting scientific standards (Farwell 2012; Farwell et al. 2013; Farwell et al. 2014) as follows:
Hypothesis 1
Applying methods that substantially2 meet the 20 brain fingerprinting scientific standards provides sufficient conditions to produce less than 1% error rate3 overall and less than 5% error rate in every individual study. This holds true (1a) without countermeasures, (1b) with countermeasures, and (1c) in field cases, where it is always unknown whether countermeasures are being practiced or not.
Hypothesis 2
Applying scientific methods that substantially meet the 20 brain fingerprinting scientific standards provides sufficient conditions to consistently produce median statistical confidences for individual determinations of 95% overall, including at least 90% for information-present determinations (the subject knows the tested information) and 90% in the opposite direction for information-absent determinations (the subject does not know the tested information). (Farwell et al. 2013) suggested that data to date would justify increasing this to 95% median statistical confidences for both.)
Hypothesis 3
Some but not all of the 20 scientific standards are also necessary conditions to simultaneously obtain the above described levels of (3a) error rate and (3b) statistical confidence. The standards that are not necessary are nevertheless useful in that they improve accuracy and/or statistical confidence.
Farwell and Donchin’s (1988b, 1991) seminal papers, wherein the brain fingerprinting scientific standards were first substantially applied, have been cited by over 3000 subsequent publications in the literature. All published data to date (and all known unpublished data) are in accord with the three-part brain fingerprinting scientific standards hypothesis. No one has published any data contradictory to this hypothesis. No one has proposed an alternative hypothesis to explain the striking bimodal distribution of results in the published data. (See Farwell 2012, 2014 for reviews.)
The methods reported herein and the brain fingerprinting scientific standards on which they are based comprise an application of the classification concealed information test (CIT). A fundamentally different method is the comparison CIT. The comparison CIT does not meet the brain fingerprinting scientific standards. As predicted by the brain fingerprinting scientific standards hypothesis, in every study so far the comparison CIT has failed to produce the results that have characterized the studies meeting the standards: near-zero error rates along with high statistical confidences for both information-present4 and information-absent determinations.
This study directly compared the results produced by the classification CIT with the results produced by the comparison CIT for the same subjects tested for the same concealed information regarding the same real-world terrorist attacks and other crimes.
Fundamental principles and procedures of the classification CIT
To assess whether or not the subject knows specific information, the BF classification CIT establishes two templates: one for the subject’s response to known, situation-relevant information, and another for the subject’s response to irrelevant information. Then the subject’s response to the tested information is classified as being more similar to his response to known, relevant information or to his response to irrelevant/unknown information.
To accomplish this, the BF classification CIT presents three types of stimuli. These consist of words, phrases, or pictures presented briefly on a computer screen. “Probes” contain the information to be tested. Probes have three defining characteristics: (1) They consist of correct, salient information about the investigated situation; (2) The subject has no way of knowing the probes other than having participated in the investigated situation; and (3) The subject denies knowing the information contained in the probes. For example, if the murder weapon is a knife, and the subject has never been informed of this fact, and the subject denies knowing what the murder weapon is, then a probe stimulus could be “knife.”
“Irrelevants” contain equally plausible, but in fact incorrect and irrelevant, information regarding the investigated situation. The subject’s response to irrelevants provides a template for the subject’s response (or lack of a response) to unknown/irrelevant information. For each probe, there are two or more corresponding irrelevants consisting of equally plausible but incorrect features of the investigated event. For example, if the description of the probe is “the murder weapon used in the murder of John Jones” and probe is “knife,” corresponding irrelevants could be “rifle” and “pistol.”
“Targets” contain known, relevant details about the investigated situation. For example, if the subject knows he is being investigated for the murder of Joe Smith, “Joe Smith” could be used as a target stimulus. For each target, two or more equally plausible but incorrect irrelevants are presented. For example, if the target is “Joe Smith,” corresponding irrelevants could be “Sam Jones” and “Mike Davis.”
The subject is informed of the significance of the probes in the context of the investigated situation, but is not informed which stimuli are probes and which are irrelevants. For example, the subject may be told: “One of the items you will see on the screen will be the murder weapon. You will see the words ‘knife,’ ‘pistol,’ and ‘rifle.’ You have told us that you do not know what the murder weapon is, so you will not recognize it when it is presented, is this right?”
The subject is also told of the significance of the targets in the context of the investigated situation. Unlike probes, however, targets are explicitly identified to the subject as being crime-relevant (or situation-relevant). Moreover, the subject is assigned a specific, differential, overt behavioral task to perform in response to the targets. The subject is instructed to press a specific button in response to targets, and a different button in response to “everything else.”
In this and our previous studies, probes and targets each constitute 1/6 of stimuli presented, and irrelevants constitute 2/3.
A subject who knows the tested information embodied in the probes recognizes three types of stimuli: known targets, unknown/irrelevant irrelevants, and known probes. For such a subject, “everything else” (everything except the targets for which he pushes a special button) consists of two types of stimuli: probes that he recognizes as being relevant and significant in the context of the investigated situation, and irrelevant stimuli.
A subject who does not know the tested information will distinguish only two types of stimuli. He will recognize the targets, which have been clearly identified and require a specific, overt, differential button-press response. Since he does not know the probes, and since irrelevants and probes are equally plausible as being correct features of the investigated situation, he will not distinguish between probes and irrelevants. For a subject lacking the knowledge embodied in the probes, “everything else” will all be unknown/irrelevant stimuli. For him, true irrelevants are indistinguishable from (unknown and unrecognized) probes.
For a subject who knows the tested information, probes are extremely similar to targets. Both contain known, situation-relevant information. Thus, brain responses to probes will be extremely similar to brain responses to targets in every respect. For a subject lacking the tested information, probes will be indistinguishable from irrelevants. Thus, brain responses to probes will be extremely similar to brain responses to irrelevants.
In this way, the targets provide a template for the subject’s brain response to known, situation-relevant information. The irrelevants provide a template for the subject’s brain response to unknown/irrelevant information. The data analysis of the BF classification CIT classifies the subject’s brain response to the probes as being more similar to his response to targets, or more similar to his response to irrelevants. We use the bootstrapping statistical technique applied to correlations between brain responses to the different stimulus types to accomplish this classification. This procedure produces a determination for each subject and a corresponding statistical confidence, or probability of being correct, for each individual determination.
If the subject’s response is classified with a high statistical confidence as being more similar to the known targets than to the unknown/irrelevant irrelevants, then the determination is “information present”: the subject knows the information embodied in the probes. If the subject’s response is classified with a high statistical confidence as being more similar to his response to the irrelevants, then the determination is “information absent”: he does not know the tested information. If the subject’s response cannot be classified with a high statistical confidence in either direction, then no determination is made. The outcome is “indeterminate.”
In all of our recent studies, targets are relevant to the investigated situation. In some previous studies (Farwell and Donchin 1991), targets were inherently irrelevant (like irrelevants), and artificially made relevant only by the assigned button-press task. The primary advantage of using situation-relevant targets is that for a subject who knows the relevant information situation-relevant targets are more similar to probes than inherently irrelevant targets would be. Thus, for an information-present subject, brain responses to probes and targets tend to be more similar when targets are situation-relevant, resulting in greater accuracy and/or statistical confidence. (This and other advantages are discussed in detail in Farwell 2012 and Farwell et al. 2013).
Previous real-world, field studies with the BF classification CIT
The BF classification CIT has been applied in real-world cases involving two types of tests that detect of two types of information respectively. Specific issue tests detect information regarding a particular event that took place at a particular time and place, such as a crime or terrorist attack (Farwell and Donchin 1991 [Experiment 2]; Farwell and Smith 2001; Farwell et al. 2013). Specific screening or focused screening tests detect information that identifies people with specific training, expertise, or inside information of an agency or group, such as knowledge specific to FBI agents or bomb makers (Farwell et al. 2013). (The CIT is not applicable in general screening applications, where investigators do not know what information they are seeking to detect.)
Farwell and Donchin (1991) comprised two specific issue experiments. Experiment 1 was a laboratory study comprising detecting information regarding a mock espionage scenario. Experiment 2 detected information regarding minor real-world crimes. Both experiments achieved 0% error rate/100% accuracy. 12.5% of cases were indeterminate.
Allen and Iacono (1997) independently replicated Farwell and Donchin’s (1991) BF classification CIT methods and results (no false negatives or false positives; some indeterminates). They also implemented an alternative, Bayesian data analysis method that produced results that were highly accurate, albeit not as accurate as the Farwell and Donchin BF-classification-CIT method.
Farwell and Smith (2001) was a real-life specific issue experiment that comprised detecting information regarding non-criminal events in the lives of FBI agents. Results were 0% error rate/100% accuracy, 0% indeterminates, median statistical confidences for individual determinations of 99.9%, and all individual statistical confidences over 95%.
Farwell et al. (2013) comprised four real-life studies, two specific issue studies and two specific screening studies. The CIA real-life study was a specific issue study funded by the CIA. It comprised detecting information regarding real-life events, including felony crimes. Results were 0% error rate/100% accuracy, 0% indeterminates, median statistical confidences for individual determinations of 99.9%, and all individual statistical confidences over 95%.
The real crimes real consequences study was a real-life specific issue test comprising detecting information regarding real crimes wherein there were life-changing consequences to the outcome of the test (e.g., conviction for murder and the death sentence or life in prison). In cases where there were no judicial consequences, life-changing consequences were achieved by offering subjects a $100,000 reward for beating the test. Results were 0% error rate/100% accuracy and 0% indeterminates.
The FBI agent study was a real-life specific screening study comprising detecting information unique to FBI agents. Results were 0% error rate/100% accuracy, 0% indeterminates, median statistical confidences for individual determinations of 99.9%, and all individual statistical confidences over 95%.
The bomb maker study was a real-life specific screening study that comprised detecting information unique to bomb makers (explosive ordnance disposal [EOD] and improvised explosive device [IED] experts). Results were 0% error rate/100% accuracy, 0% indeterminates, median statistical confidences for individual determinations of 99.9%, and all individual statistical confidences over 95%.
Farwell et al. (2014) was a CIA-funded real-life specific screening study conducted in conjunction with the US Navy that comprised detecting information known only to military medical experts. Information-present subjects were US Navy military medical experts. Results for the BF classification CIT were 0% error rate/100% accuracy, 0% indeterminates, and median statistical confidences of 99.9%.
Farwell et al. (2014) compared the results of the BF classification CIT with the results of the comparison CIT applied to the same data. The comparison CIT produced significantly a higher error rate and significantly lower statistical confidences than the classification CIT. Comparison-CIT error rate was 20%. Median statistical confidence was 67%. As predicted by the statistical model, median statistical confidence for information-absent subjects was no better than chance; in fact, it was less than chance, 28.9%. More than half of the information-absent determinations were invalid, having less than 50% computed probability of being correct. Error rate, statistical confidences, and invalid results are similar to those of previous comparison-CIT studies in other laboratories. Median statistical confidence and percentage of invalid results are in accord with the predictions of the statistical model for the comparison CIT.
In summary, all previous field and real-life studies on the BF classification CIT have resulted in 0% error rate/100% accuracy and extremely high median statistical confidences. All but one study (Farwell and Donchin 1991) have also resulted in 0% indeterminates.
Countermeasures
The BF classification CIT, when practiced according to the 20 brain fingerprinting scientific standards (Farwell 2012; Farwell et al. 2013, 2014) has been shown to be highly resistant to countermeasures. No one has ever beaten a classification CIT, when implemented according to these standards, despite real-world motivations. In past studies, these motivations have included consequences such as the death penalty or life in prison, as well as a $100,000 reward for beating the test (Farwell et al. 2013).
Three types of countermeasures have been reported to be effective against comparison-CIT methods, including the complex trial protocol of Rosenfeld et al. (2008). All CIT methods involve differences in responses to the different types of stimuli. Countermeasures that have been effective against some methods have focused on attempting to manipulate responses to the respective stimulus types. There are essentially three ways of attempting to do this that have proven to be effective against the comparison CIT but not against the BF classification CIT: (1) Additional attention to irrelevants: Attempting to enhance the response to irrelevant stimuli by covertly performing a task (such as moving the toe) in response to each irrelevant stimulus (Rosenfeld et al. 2004, 2008); (2) Additional attention to targets: Attempting to enhance the response to the target stimuli by covertly performing an additional task in response to targets (Mertens and Allen 2008); (3) “Try not to think about it”: Attempting to reduce brain responses to probe stimuli by attempting not to think about the event related to the information contained in the probes (Bergström et al. 2013). A fourth method comprising a simple mental task designed to distract the subject from the stimuli (Sasaki et al. 2002) was ineffective.
All of the studies that have reported an effect of countermeasures on error rate have tested procedures that failed to implement over half of the 20 standard procedures. Predictably, they all reported high error rates and low statistical confidences even without countermeasures.
The “additional attention to irrelevants” countermeasure has defeated the comparison CIT (Rosenfeld 2004; Farwell 2011a, b; Farwell et al. 2014), and in particular Rosenfeld et al.’s (2008) complex trial protocol. In a series of experiments, the comparison-CIT complex trial protocol produced error rates of 15% without countermeasures and 29% with countermeasures (for reviews see Farwell 2012, 2014).
Mertens and Allen (2008) tested the effect of the “additional attention to targets” and “additional attention to irrelevants” countermeasures on both a classification CIT (their “bootstrapped correlation” condition) and a comparison CIT (“bootstrapped amplitude difference”). Although one of their conditions was a classification CIT, this study failed to implement several important standard procedures (7, 12, 18, and 19), and predictably produced high error rates in all conditions even without countermeasures.
Both countermeasures tested by Mertens and Allen (2008) produced a considerable increase in error rate for the comparison CIT, but no significant difference in error rate for the classification CIT. In the classification-CIT condition that most closely resembled Farwell and Donchin (1991) and our other studies (Mertens and Allen, page 292, footnote 1), 21% of the determinations made were false negatives without countermeasures, and only 16% of the determinations made were false negatives with countermeasures. In other words, countermeasures not only failed to produce more errors in the classification CIT, if anything they resulted in a (non-significantly) lower error rate.
Mertens and Allen (2008) found the comparison CIT, by contrast, to be highly susceptible to countermeasures. The error rate for the comparison CIT was 81% for the countermeasure groups (19% accuracy), which is far worse than chance (50%) performance. Even without countermeasures, the comparison CIT produced 53% errors, worse than chance performance and dramatically higher error rate than the classification CIT.
Farwell et al. (2013) showed that the “additional attention to irrelevants” and the “additional attention to targets” countermeasures had no effect on the BF classification CIT when implemented according to the 20 standard procedures, even when subjects had strong motivation to beat the test. Farwell et al. taught subjects these countermeasures in a field study on real crimes. All subjects were correctly detected, with no false positives and no false negatives. (There were also no indeterminates).
Bergström et al. (2013) tested the “try not to think about it” countermeasure on a comparison CIT. They applied the comparison-CIT bootstrapping data analysis method of Rosenfeld et al. (2004). Their results showed that, like the other two countermeasure methods described above, the “try not to think about it” countermeasure is effective against the comparison CIT.5
Although the countermeasure applied was different, Bergström et al.’s (2013) results for the comparison CIT both with and without countermeasures were similar to the results produced by the same comparison-CIT analysis procedure in the Rosenfeld et al. (2004) study and other comparison-CIT studies by that group (e.g., Verschuere et al. 2009). With the experiment and subject group with the most accurate results, and using the peak-to-peak comparison-CIT bootstrapping algorithm applied in Rosenfeld et al. (2004) and that group’s various other studies, Bergström et al. (2013) reported 30% false negatives without countermeasures, 45% false negatives with countermeasures, and 17% false positives. These results are typical of the comparison CIT as applied by Rosenfeld, Verschuere, Meijer, and others who apply that method.
In addition to demonstrating that the comparison CIT is highly susceptible to yet another countermeasure, Bergström et al. (2013) reached two conclusions, both of which are addressed by our present study: (1) “The generalizability of our findings is somewhat complicated by the multitude of different guilty knowledge protocols,” and (2) “It is also crucial that suppression countermeasures are assessed outside the laboratory. First, memories of a real crime may differ in intrusiveness from those of a crime simulation, which could affect suppression success. Second, real criminals will likely differ in their motivation to control retrieval from typical research volunteers.”
Our study addresses both of these issues. Although the BF classification CIT incorporating the 20 standard procedures has been shown to be highly resistant to the other two types of countermeasures that have defeated the comparison CIT (including Rosenfeld’s complex trial protocol), the “try not to think about it” countermeasure has never been tested on the BF classification CIT. We tested this countermeasure in the present study.
Moreover, we tested the resistance of the BF classification CIT to this countermeasure in field conditions in the investigation of real crimes, with major consequences to the outcome, on subjects with high motivation to beat the test. To provide life-changing motivation in cases where there were no judicial consequences to the outcome of the test, we offered a $100,000 reward for beating the BF classification CIT wherein the brain fingerprinting scientific standards were met.
Understanding the literature: different methods produce different results
In the literature on the brainwave-based CIT, there is an obvious bimodal distribution with respect to both error rate and statistical confidence in the results reported. What has sometimes escaped commentators, and even some researchers, is the fact that the two strikingly different patterns of results are brought about by two very different sets of methods.
One set of methods, exemplified by Farwell and Donchin (1991), Farwell and Smith (2001), and Farwell et al. (2013, 2014) has in every study—including both field and laboratory studies—produced error rates of less than 1% and median statistical confidences for individual determinations that are greater than 95%, including greater than 90% median statistical confidences for both information-present and information-absent determinations (Farwell 2012; Farwell and Richardson 2013). These methods are also highly resistant to countermeasures. Independent replications (e.g., Allen and Iacono 1997) have produced essentially the same results.
A very different set of methods, exemplified by Rosenfeld et al. (1987, 2004, 2007, 2008, 2018), Meijer et al. (2007, 2014), Meixner et al. (2009), Meixner and Rosenfeld (2014), and Lu et al. (2017), has produced an order of magnitude higher error rates and dramatically lower statistical confidences—averaging no better than chance (50%) for information-absent determinations. These methods are also highly susceptible to countermeasures.
To make sense of the bimodal distribution of results reported in the literature, and in particular the two very different patterns of results reported, it is necessary to have an understanding of the fundamental differences in methods that bring about these extremely different results.
The brain fingerprinting scientific standards specify in detail the methods that have consistently produced low error rates and high statistical confidences. In previous publications (Farwell 2012; Farwell et al. 2013, 2014; Farwell and Richardson 2013), we have discussed the methodological differences between the studies reporting low error rates and high statistical confidences versus the studies reporting high error rates and low statistical confidences with respect to the specific scientific standards that were met or not met in the two different groups of studies, as well as in specific individual studies. The studies exemplifying the two different modes of the bimodal distribution differed with respect to their compliance or lack of compliance with at least 15 of the 20 standards.
The primary difference between the methods that produced low error rates and high statistical confidences and those that produced high error rates and low statistical confidences is that the former practiced the BF classification CIT (which meets defining scientific standards 13, 14, and 17) and the latter practiced the comparison CIT (which does not meet those particular standards).
The classification CIT is a fundamentally different paradigm from the comparison CIT. The BF classification CIT analyzes responses to different types stimuli than those analyzed in the comparison CIT, and analyzes them in a fundamentally different way. These differences are described in detail in the Methods and Discussion sections.
In the present study, as in Farwell et al. (2014), we directly investigated the differences in results produced by the BF classification CIT versus the comparison CIT, with all other variables held constant. We applied both the BF classification-CIT and the comparison-CIT analysis methods to the same data, and compared the results produced by the respective techniques. This allows us to draw conclusions regarding the differences in results produced by the classification CIT and the comparison CIT in a design in which everything else except the classification/comparison distinction is the same for both conditions.
Scientific questions addressed by this research
This research addresses one primary scientific question (I) and a secondary question (II). Both are relevant to the practical application of the brainwave-based concealed information test in field situations in real-world counterterrorism and criminal investigations.
-
I.
Do field tests on suspects in real-world terrorist crimes and other crimes support the brain fingerprinting scientific standards hypothesis?
This fundamental question can be divided into the following parts:
-
Does the classification CIT, when implemented according to the 20 brain fingerprinting scientific standards, produce
-
(A)Error rate, and
-
(B)Statistical confidences for individual determinations that are viable for field use in real-world counterterrorism and criminal investigation applications?
“Viable for field use” is defined as meeting the following criteria:-
(i)Less than 1% error rate;
-
(ii)Median statistical confidences for individual determinations of at least 95%; including
-
(iii)Median statistical confidences of at least 90% for both information-present determinations and information-absent determinations;
-
(iv)Produced in the following conditions:
- without countermeasures;
- with countermeasures; and
- in field cases with substantial consequences to the outcome, where it is unknown for certain whether or not countermeasures are being applied.
-
(A)
- Do the 20 brain fingerprinting scientific standards provide sufficient conditions for a brainwave-based classification CIT that is viable for field use?
-
II.What are the differences, if any, between the results produced by the BF classification CIT versus the comparison CIT?
-
II.
This question can be divided into the following parts:
- Does the BF classification CIT produce significantly more accurate and valid results and higher statistical confidences than the comparison CIT, when all other variables are held constant?
-
(i)“Accurate and reliable” constitutes a combination of lower error rate across subjects and/or higher statistical confidences within subjects;
-
(ii)To be “valid” a study must use valid statistics properly and must at a minimum not determine any subject to be information present or information absent when the statistics applied compute a probability of less than 50% that the selected determination is correct.
-
(iii)“All other variables held constant” means that the only difference between the two methods is the fundamental one: that the classification CIT classifies the probe responses as being more similar to the target responses or to the irrelevant responses, and the comparison CIT computes whether the probe responses are larger than the irrelevant responses (and ignores the targets).
-
(i)
-
2.
Is implementing the BF classification CIT, rather than the comparison CIT (brain fingerprinting scientific standards 13, 14, and 17), a necessary condition for a combination of adequate error rate and adequate statistical confidences to meet the criteria for viable field use?
Methods
Material and methods
Subjects
We conducted 24 tests on 23 subjects on information regarding (1) Terrorist crimes; (2) Other crimes; and (3) A classified counterterrorism operation.
In Experiment 1 we conducted 19 tests on 18 subjects. (One subject was tested on information regarding two different terrorist crimes.) Results of testing showed that 6 subjects were “information present,” i.e., they had information stored in their brains regarding specific terrorist crimes or other known crimes, and that 12 subjects were “information absent,” i.e., lacked such information.
The cases reported were all of the counterterrorism and criminal cases in specific theaters that we conducted in the time period during which we were collecting data for this report. All of the other cases that we conducted in other theaters and at other times achieved identical error rates (0%) and extremely similar statistical confidences.
In Experiment 2 we conducted 5 tests on 5 subjects who were participants in a classified counterterrorism operation. All were correctly determined to be “information present.”
Due to real-world considerations, including the classified nature of the operations, ongoing counterterrorism operations and criminal investigations, and uncertainties regarding the identity and history of some of the subjects, complete demographic information is unavailable. All subjects were of sufficient age to meet ethics requirements (over 18 years).
Experimental procedures were approved by the Brain Fingerprinting Laboratories ethics committee and performed in accordance with the ethical standards of the 1964 Declaration of Helsinki, including written informed consent prior to participation.
Stimuli
Three types of stimuli consisting of words or phrases were presented on a computer screen: probes, targets, and irrelevants. Probes contained specific information relevant to the investigated situation. In Experiment 1 the investigated situations were different for each test, comprising terrorist and other crimes. In Experiment 2 the investigated situation was the same for all subjects, namely a specific classified counterterrorism operation. The test is designed to detect the subject’s knowledge or lack of knowledge of the information contained in the probes as relevant in the context of the investigated situation.
For each probe (and each target) comparable irrelevants were structured that contained similar, plausible, but incorrect information about the investigated situation. For a subject lacking the relevant knowledge contained in the probes, the irrelevants and probes were equally plausible as correct, relevant details. The irrelevants that were comparable to each probe were indistinguishable from the probe for a subject lacking the tested information.
Each probe contained correct, relevant information fitting the description of that probe. Descriptions of each probe were presented to each subject in the course of the experiment. The two irrelevants comparable to each probe contained incorrect information that would be plausible as fitting that same description for an individual lacking the information contained in the probes. For example, a probe stimulus may be the specific composition of a bomb in a terrorist bombing, or the content of intercepted communications between the mastermind, the handlers, and the end perpetrators in a hijacking. Corresponding irrelevants could be plausible alternative information that logically could be, but in fact is not, an accurate description of items matching this description. For obvious security reasons, the exact stimuli cannot be given.
Subjects were provided with a description of each probe that specified the significance of the probe in the context of the investigated situation, but were not informed which was the correct, situation-relevant probe and which were the corresponding irrelevants.
Similarly, each target stimulus contained correct, situation-relevant information, and the two irrelevant stimuli comparable to each target contained comparable, incorrect but plausible information. Unlike probes, targets were identified as such in instructions to the subjects.
Stimuli were constructed in groups of six: one probe, one target, and four irrelevants. For each probe there were two comparable irrelevants. For each target there were two comparable irrelevants. We used a ratio of 1/6 targets, 1/6 probes, and 2/3 irrelevants so targets and probes were relatively rare, which is known to enhance P300 amplitude (Farwell and Donchin 1988b, 1991).
Our prediction was that targets would elicit a large P300 and P300-MERMER (memory and encoding related multifaceted electroencephalographic response; see Farwell 2012; Rapp et al. 1993) (or P300 + LNP—late negative potential) in all subjects, irrelevants would not elicit a large P300-MERMER, and probes would elicit a large P300-MERMER only in information-present subjects. Thus, for information-present subjects, ERP responses to probes would be similar to ERPs for targets. For information-absent subjects, ERP responses to probes would be similar to ERPs for irrelevants.
For all but one test there were 9 unique probes, 9 unique targets, and 36 unique irrelevants, a total of 54 unique stimuli. These comprised 9 groups of stimuli, each consisting of one probe, one target, and four irrelevants. In each test, 3 groups (comprising one “stimulus set”) were presented. There was one exception to all of this: For one test, only 2 crime-relevant items that were known only to the investigators and the perpetrator were available, so there were only 2 probes, 2 targets, and 4 irrelevants. Each unique stimulus was presented multiple times, as described below.
The stimuli were words and short phrases, represented alphanumerically, presented on a 21.5″ AOC LED HD monitor Model #G2260VWQ6 at a distance of 24″ from the subject. The text was in white typeface against a blue background. The average length of stimuli was 12 characters, presented at a horizontal visual angle of 6.4 degrees. They varied in length from 8 to 16 characters.
Procedure
Before the test, we made certain that the subject understood the significance of the probes, without revealing which stimuli were probes. We described the significance of each probe to the subject. We then showed the subject the probe and the corresponding irrelevants, along with the description of the significance of the probe, without revealing which was the probe. Thus, subjects were informed of the significance of each probe stimulus, but were not told which stimulus was the probe and which were corresponding irrelevants. For example, subjects were told, “One of these three items is the kind of specific projectiles contained in the suicide vest,” followed by a list of one probe and two irrelevants (in random order). Although the descriptions of the probes were made known to subjects, the probe stimuli themselves were never identified as probes, nor were probes in any way distinguishable from irrelevants, except to an individual who already knew the crime-relevant information contained in the probes.
Targets were explicitly identified to the subjects. Experimental instructions ensured that the subject knew the targets and their significance in the context of the investigated situation. We described the significance of each target to the subject. We showed the subject each target and the corresponding irrelevants, along with the description of the significance of the target.
We also showed subjects a list of the targets and noted that subjects would be required to recognize the targets during the test. We instructed subjects to press one button in response to targets, and another button in response to “all other stimuli.” The subject’s task was to read and comprehend each stimulus, and then to indicate by a button press whether the stimulus was a target stimulus or not.
For a subject possessing the knowledge embodied in the probes, "all other stimuli" consisted of two types of stimuli: probes containing the known situation-relevant information, and irrelevant stimuli. For a subject lacking the tested knowledge, "all other stimuli" appeared equally irrelevant. Probes were indistinguishable from irrelevants. For “all other stimuli” (that is, everything except targets), the subject was instructed to push the opposite button from the one pushed in response to targets. This instruction applied whether the subject perceived these as a single category—all equally irrelevant, if the subject was information absent—or as two categories—(1) Irrelevant, and (2) Relevant to the concealed information being tested, if the subject was information present.
The differential button-press task in response to every stimulus presentation ensured that the subject was required to read and comprehend every stimulus, including the probe stimuli, and to prove behaviorally that he had done so on every trial. (A “trial” is defined as one stimulus presentation and the resulting brainwave and behavioral response.) This allowed us to avoid depending on detecting brain responses to assigned tasks that the subject could covertly avoid doing, while performing the necessary overt responses.
This is a critical difference between the method we employed and other methods such as Rosenfeld’s complex trial protocol that do not require subjects to distinguish the different types of stimuli to prove behaviorally on every trial that they have done so. This feature is specified in the brain fingerprinting scientific standards, and has been shown to be a necessary condition for a valid and reliable test.
We obtained the permission of all subjects to provide the information regarding the outcome of the test to authorities, agencies, and/or judicial forums where it may be requested as relevant scientific evidence. We explained to the subjects what relevant information the test could potentially provide. Before the test, subjects were knowledgeable regarding the possible consequences of the test—or any other event that might potentially provide relevant evidence—because they were well informed regarding their legal situation and any investigations or legal proceedings in which they were involved. In some cases these consequences involved life or death, prison sentences, or other inherently life-changing consequences. All subjects knew these consequences because they were knowledgeable regarding their current situation. All subjects had access to legal counsel and unlimited communication with anyone with whom they wished to discuss their situation.
To provide for life-changing consequences for all subjects including those for whom there were no judicial consequences to the outcome, we offered a $100,000 reward for beating the test. This reward applied only to the BF classification CIT implemented according to the brain fingerprinting scientific standards, and not to the comparison CIT.
We taught all subjects the “try not to think about it” countermeasure (Bergström et al. 2013) and instructed them practice it. We used the exact same instructions as Bergström et al., as closely as can be determined from their publication. Prior to the test, we instructed the subjects as follows: “Try to stop any memories of the event from coming to mind at all during the test.” This instruction immediately followed the standard instruction in brain fingerprinting scientific standard #7, as specified below.
Testing was divided into separate blocks. In each block the computer display presented 72 stimulus presentations or trials. In each block, 3 stimulus groups (one stimulus set) were presented. That is, in each block there were 3 unique probes, 3 unique targets, and 12 unique irrelevants. Each stimulus was presented 4 times in a block to make the total of 72 stimulus presentations per block. Stimuli were presented in random order. Each full test comprised at least 9 blocks.
Immediately before each block, we repeated the description of the significance of each of the probes and targets that were to appear in each block (but not the actual stimuli). For example, “In this test you will see the secret location of the control headquarters of the terrorist attack, the party who supplied the weapons, the code names for the weapons, the way the instructions were communicated from the mastermind to the end perpetrators, and the vehicle used in the attack.”
Stimuli were presented for 400 ms at an inter-stimulus interval (ISI; stimulus onset asynchrony—SOA) of 3000 ms. A fixation point (“X”) was presented for 1000 ms prior to each stimulus. For each trial, the sequence was a fixation point for 1000 ms, the stimulus (target, probe, or irrelevant) for 400 ms, a blank screen for 1600 ms, and then the next fixation point.
Trials contaminated by artifacts generated by eye movements or muscle-generated noise were rejected on-line, and additional trials were presented until 72 artifact-free trials were obtained. Trials with a range of greater than 150 microvolts in the electro-oculograph (EOG) channel were rejected. Data for “rejected” trials were collected and recorded, but rejected trials did not contribute to the count of trials presented, so each rejection resulted in an additional stimulus presentation.
Brain responses were recorded from the midline frontal, central, and parietal scalp locations (Fz, Cz, and Pz, International 10–20 System) referenced to the left ear, and from a location on the forehead to track eye movements. Custom electrodes were held in place by a custom headset.
Electroencephalograph (EEG) data and electro-oculograph (EOG/eye movement) data were digitized at 500 Hz. Data were amplified at a gain of 50,000 using custom amplifiers embedded in a custom Cognionics Quick-20 headset and communicated wirelessly via Bluetooth to the computer for recording and analysis. Analog filters passed signals between 1 and 30 Hz. Data were stored on a solid-state drive for off-line analysis.
Data were recorded in a sound-isolated room. The subject sat facing the stimulus-display monitor. The experimenter sat in the same room, out of sight of the subject.
Data analysis
We analyzed ERP data from the Pz scalp site. Data were digitally filtered using an equal-ripple, zero-phase-shift, optimal, finite impulse response, low-pass filter with a passband cutoff frequency of 6 Hz and a stopband cutoff frequency of 8 Hz (Farwell et al. 1993). Trials with a range of greater than 150 microvolts in the EOG channel were excluded from analysis. We decided on this threshold based on our previous experience (Farwell and Donchin 1991; Farwell et al. 2013). In exploratory data analysis, we have varied this threshold considerably, and the results are robust even if we change this parameter within quite a wide range.
For each subject’s data we conducted two separate analyses: a classification-CIT analysis and a comparison-CIT analysis, applying the respective bootstrapping procedures described below. The epoch analyzed was 300 to 1500 ms post-stimulus.
Classification-CIT statistical analysis bootstrapping method
The primary data-analysis task was to determine whether the ERP responses to the probe stimuli resembled the responses to the targets, containing a large P300 and P300-MERMER similar to that elicited by the targets, or whether the probe responses were more similar to the irrelevant responses, which lacked a large P300 and P300-MERMER.
We used bootstrapping (Farwell and Donchin 1988a, 1991; Wasserman and Bockenholt 1989; Farwell et al. 2013; Efron 1979) to determine whether the probe responses were more similar to the target responses or to the irrelevant responses, and to compute a statistical confidence for this determination for each individual subject. The metric for similarity was double-centered correlation.
The bootstrapping procedure accomplished two goals: (1) To take into account the variability across single trials, while also maintaining the smooth and relatively noise-free shape provided by signal averaging (which is vital for reliable correlation computations); (2) To isolate the critical variable—knowledge of the information embodied in the probes—by classifying the responses to the probe stimuli as being either more similar to the target responses or to the irrelevant responses.
Figure 1 illustrates the classification-CIT data analysis method.
Fig. 1.

Classification CIT Data Analysis. The BF classification CIT uses bootstrapping on correlations to compute the probability that the brain response to the probe stimuli is (a) significantly more similar to the target response than to the irrelevant response (“information present” determination), (b) significantly more similar to the irrelevant response than to the target response (“information absent” determination), or (c) data are insufficient to make a determination with a high statistical confidence in either direction (indeterminate—no determination is made). All determinations, both information present and information absent, are made with at least a 90% statistical confidence
Briefly, the bootstrapping procedure for the BF classification CIT is as follows. We repeat the following procedure 1000 times. Randomly sample P probes, T targets, and I irrelevants, with P, T, and I equal to the total number of probe, target, and irrelevant trials in the data set respectively. In each iteration, compare the probe-target correlation with the probe-irrelevant correlation. Count the number of times that the probe-target correlation is greater than the probe-irrelevant correlation, and convert this to a percentage. This is the probability that the probe response is more similar to the target response than to the irrelevant response, which is the probability that information present is the correct determination. 100% minus this is the probability that the probe response is more similar to the irrelevant response, which is the probability that information absent is the correct determination.
We set an a priori bootstrapping probability criterion of 90% for an information-present determination and 90% (in the opposite direction) for an information-absent determination.6 If the probability was greater than 90% that the probe response was more similar to the target response than to the irrelevant response, we classified the subject as information present. If the probability was greater than 90% that the probe response was more similar to the irrelevant response than to the target response, the subject was classified as information absent. (This is equivalent to a probability of less than 10% (i.e., 100%–90%) that information present is correct).
If the results did not meet either the criterion for information present or the criterion for information absent, we did not classify the subject in either category. The outcome would then be indeterminate (although there were no indeterminates in this study or any of our studies since 1992).
In previous BF-classification-CIT research we have set the criterion for information-absent determinations at 70% probability that information absent is the correct determination (30% probability that information present is correct). Our rationale has been based on the situation prevalent in the field arenas where we have previously applied this method. Our previous field applications have been primarily in the criminal justice system in the US.
From a human rights and ethical point of view, in our view it is better to be more lenient in making an information-absent determination, which generally provides evidence of innocence, than an information-present determination, which generally provides evidence of guilt. It is the view of many in the US that it is better to allow many people to avoid conviction for crimes of which they are guilty than to have even one innocent person falsely convicted and incarcerated or put to death. Greater leniency in making an information-absent determination is in accord with this view.
In the present research, we have raised the criterion for an information-absent determination to 90% probability for two reasons. First, our results in previous field studies with substantial consequences to the outcome (Farwell et al. 2013) have produced higher than 90% statistical confidence for every subject. If we had implemented 90% criterion, our results would have been the same. In fact, in cases such as the Harrington case where our test provided exculpatory evidence, statistical confidence was greater than 99%.
Second, the field counterterrorism applications that provided some of the data for this study have different ethical, moral, and human rights implications than those that were applicable in the criminal investigations in which we participated previously. The cost in human life and global security to allowing a terrorist mastermind to escape prosecution and incarceration, and thus to allow him to continue his terrorist activities, is much higher than the cost of letting a common domestic criminal get away with his crimes. In counterterrorism, unlike the situation in the vast majority of ordinary crimes, a false negative error could have disastrous consequences in loss of human life. Therefore it makes sense to require a high standard for an information-absent determination, just as it does for an information-present determination.
For these reasons we have raised the criterion for an information-absent determination to 90% statistical confidence, the same as the criterion for an information-present determination (but in the opposite direction).
The bootstrapping-computed probability that information-present is the correct determination is also known as the bootstrap index. When the bootstrap probability exceeds the criterion for an information-present determination, the subject is determined to be information present, and in this case the bootstrap probability is the statistical confidence for the information-present determination.
Mathematically, the probability that information absent is the correct determination is 100% minus the probability that information present is the correct determination, or 100% minus the bootstrap index. For example, if there is a 5% probability that the probe response is more similar to the target than to the irrelevant response (information present is correct), then there is an 95% probability that the probe response is more similar to the irrelevant response (information absent is correct).
If the probability was greater than 90% that the probe response was more similar to the irrelevant response than to the target response (equivalent to a 10% probability that the probe response was more similar to the target response, or 10% bootstrap index), we classified the subject as information absent. The bootstrap probability that an information-absent determination is correct (100% minus the probability that information present is correct) is the statistical confidence for this information-absent determination.
Figure 2 illustrates the classification-CIT bootstrap probabilities and determinations.
Fig. 2.
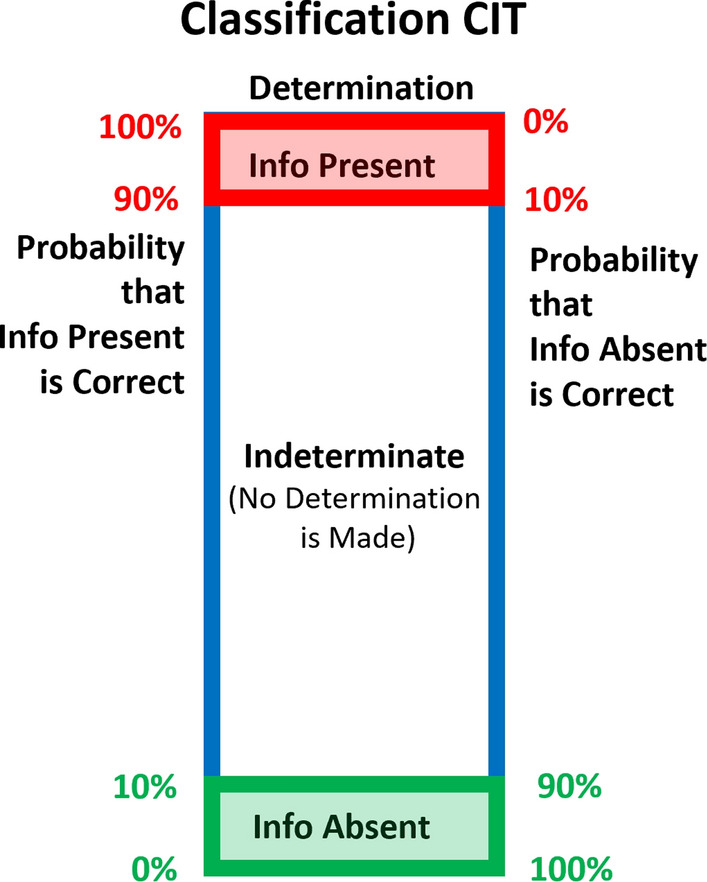
Classification CIT Bootstrap Probabilities and Determinations. The bootstrapping probability computation computes the probability that information present is the correct determination. The probability that information absent is correct is 100% minus the probability that information present is correct. A determination of either information present or information absent requires at least a 90% probability that the selected determination is correct, equivalent to 10% probability that the opposite determination is correct. Otherwise, no determination is made
Note that the probability that information absent is the correct determination equals 100% minus the probability that information present is the correct determination. The probability that information present is the correct determination is the statistical confidence for an information-present determination. The probability that information absent is the correct determination is the statistical confidence for an information-absent determination. Equivalently, the statistical confidence for an information-absent determination is 100% minus the originally computed (information-present) bootstrap probability, or 100% minus the bootstrap index.
There has been some confusion in the literature because some authors compute the bootstrap index—which is equivalent to the statistical confidence for an information-present determination—and then do not subtract it from 100% when discussing information-absent (or “innocent”) determinations. (This includes our own publication Farwell and Donchin 1991). There is nothing wrong with discussing information-absent determinations in relation to the originally computed bootstrap index, as long as one keeps in mind the fact that the bootstrap index is the probability that information absent is the incorrect determination (that is, information present is correct). Some commentators and even some researchers have been confused in evaluating information-absent determinations by the fact that a bootstrap index of 80%—which looks high at first glance—constitutes a 20% probability that information absent is the correct determination, and a bootstrap index of 20%—which looks low at first glance—constitutes an 80% probability that information absent is the correct determination.
For each subject, each data analysis method produced a determination and a statistical confidence, e.g., “information present, 99.9% statistical confidence.” The statistical confidence is the probability that the determination is correct, based on the within-subjects statistical computation taking into account the size of the effect and the variability in the data.
Error rate is the percentage of incorrect information-present (false positive) and information-absent (false negative) determinations. Accuracy is 100% minus the error rate.
In reporting error rates and/or accuracy, indeterminates must be reported as such. In reporting “accuracy,” some authors have confounded indeterminates with false positives and/or false negatives, reporting “accuracy” as the percentage of tests that result in a correct determination, and hiding the number of indeterminates. This in effect constitutes misrepresenting all indeterminates as false negative errors. This irretrievably hides the true error rate if there are indeterminates, and makes it impossible to make a meaningful comparison with studies that report the true error rate. In any meaningful reporting, indeterminates if any must be identified as such, and not confounded with false positive or false negative errors. (Some legitimate techniques such as Bayesian analysis do not allow indeterminates, in which case this fact must also be reported).
The BF classification CIT detects information. Ground truth is whether or not the subject possessed the information embodied in the probes at the time of the test. Ground truth was determined by confession and, when applicable, judicial outcome of the criminal cases. That is, in every case either (a) The subject confessed independently of the test and was proven judicially to be guilty, or (b) Another person confessed and/or was proven judicially to be guilty, or (c) The subject did not confess and was found judicially to be innocent.
We restricted our conclusions to a determination as to whether or not a subject knew the specific situation-relevant knowledge embodied in the probes at the time of the test. Our procedures recognize the fact that the brainwave-based BF classification CIT detects only the presence or absence of information—not guilt, innocence, honesty, lying, deception, or any past action or non-action.
Comparison-CIT statistical analysis bootstrapping method
The comparison CIT uses bootstrapping in an entirely different way from the BF classification CIT. The comparison CIT ignores the target responses and applies bootstrapping to compute the probability that the amplitude of the probe ERP is larger than the amplitude of the irrelevant ERP. The amplitude of the ERP response is defined as the difference between the highest voltage in the P300 window (300–900 ms) and the lowest voltage in the LNP window (900–1500 ms). This is the peak-to-peak amplitude of the P300-MERMER, equivalent to the sum of the peak amplitudes of the P300 and the LNP. It is sometimes represented as simply the P300 amplitude. (See the discussion in the Supplementary Material on “Definition of Terms and Notes on Terminology”). Computing the P300 amplitude in this way is in accord with the metric used previous applications of the comparison CIT, including the complex trial protocol, e.g., Rosenfeld et al. (2008).
Figure 3 illustrates the comparison-CIT data analysis method.
Fig. 3.

Comparison CIT Data Analysis. The comparison CIT uses bootstrapping to determine if (a) there is greater than a 90% probability that the probe response is larger than the irrelevant response, resulting in an information-present determination; or (b) there is less than a 90% probability that the probe response is larger than the irrelevant response, resulting in an information-absent determination. The probability that information absent is the correct determination is 100% minus the probability that information present is correct. Information-present determinations have a statistical confidence of at least 90%. Information-absent determinations have a statistical confidence of greater than 10%. The statistical model predicts that the average statistical confidence for information-absent determinations is 50% (chance). If the statistical confidence is greater than 50%, the determination is valid, i.e., there is a computed probability of greater than chance that the selected determination is correct. If the statistical confidence is less than 50%, the determination is invalid, i.e., there is a computed probability of less than chance that the determination is correct
The comparison CIT uses the bootstrapping probability statistic computed on the amplitude of the brain responses to determine whether (a) The probe response is significantly larger than the irrelevant response, or (b) The probe response is not significantly larger than the irrelevant response. The former results in an information-present determination. The latter results in an information-absent determination.
In the comparison-CIT data analysis, trials are randomly sampled with replacement and averaged as described above for the BF classification CIT, except that only probe and irrelevant trials are sampled and averaged. In each of 1000 iterations, the amplitude of the ERP in the sampled probe average is compared with the amplitude of the ERP in the sampled irrelevant average. The percentage of times that the sampled probe ERP is larger than the sampled irrelevant ERP provides an estimate of the probability that the probe ERP is larger than the irrelevant ERP.
As in previous studies in ours and other laboratories, amplitude is defined as the difference in microvolts between the largest positive amplitude in the P300 window (300–900 ms post-stimulus) and the largest negative (or least positive) amplitude in the following negative LNP window (900–1500 ms post-stimulus).
If the probability that the probe ERP is larger than the irrelevant ERP is greater than 90%, then the subject is determined to be information present. If the probability that the probe ERP is larger than the irrelevant ERP is less than 90%, then the subject is determined to be information absent. (The comparison CIT does not have an indeterminate category).
A probability of 90% that information present is correct (that is, probe ERP is larger than irrelevant ERP) is equivalent to a probability of 10% (that is, 100%—90%) that information absent is correct.
Therefore, any subject with a probability of greater than 10% that information absent is correct is determined to be information absent. This results in subjects being determined to be information absent when the computed bootstrap probability is as high as 89.9% that information present would be the correct determination, that is, as low as a 10.1% statistically computed probability that the selected information-absent determination is correct. Information-absent statistical confidences range from 10.1 to 100%.
The statistical model predicts that the average statistical confidence for information-absent determinations is 50%, (chance). This is the approximate result of all previously published studies on the comparison CIT.
If the statistical confidence is greater than 50%, the determination is valid, i.e., there is a computed probability of greater than chance that the selected determination is correct. If the statistical confidence is less than 50%, the determination is invalid, i.e., there is a computed probability of less than chance that the determination is correct. The statistical model predicts that approximately half of information-absent determinations will be invalid. This is the approximate result of all previously published studies on the comparison CIT.
Figure 4 illustrates the comparison CIT bootstrap probabilities and determinations.
Fig. 4.

Comparison CIT Bootstrap Probabilities and Determinations. If the probability is greater than 90% that information present is the correct determination (less than 10% probability that information absent is correct), the subject is determined as information present. If the probability is less than 90% that information present is correct (greater than 10% probability that information absent is correct), the subject is determined as information absent. If the selected information-absent determination has greater than chance (50%) probability of being correct, it is a valid information-absent determination. If the probability that the selected information-absent determination is correct is less than chance (50%), it is an invalid information-absent determination
According to the predictions of the statistical model and all results of the comparison CIT reported in the literature to date, statistical confidences for the comparison CIT average 50% (chance).
According to the predictions of the statistical model as well as the results of all studies published to date, approximately half of all information-absent determinations by the comparison CIT are invalid.
In summary, the possible outcomes of the statistical computations for the comparison CIT are correct positive, correct valid negative, correct invalid negative, false positive, and false negative.
The common comparison-CIT practice of presenting invalid but “correct” results—that is, chosen determinations that have a less-than-chance (50%) probability of being correct—produces obvious logical and statistical anomalies. An alternative to reporting invalid results and less-than-chance statistical confidences is to lower the criterion for determining a subject to be information present to 50%. This means the criterion for an information-absent determination is 100% − 50% = 50% as well. With this criterion, all determinations are valid. Each subject is assigned whichever determination has a greater probability of being correct. The probability that each determination is correct is better than chance in every case. This results in a trade-off between statistical confidence and error rate, however.
We have presented the results of the comparison CIT below for both methods, the 90% information-present criterion/10% information-absent criterion and the 50%/50% criterion for both.
With a 50%/50% criterion, all determinations are valid: all are computed to be more likely than not to be correct. All determinations have a greater than 50% computed probability of being correct. All determinations have a statistical confidence of greater than chance. However, an “information absent” determination with a statistical confidence of 51%, although valid, is not of practical use. To know that there is a 51% probability that the subject is information absent provides little information about the reality of the situation.
If the probability is greater than 70% that information absent is the correct determination, however, this provides at least some potentially useful information.
Therefore, in addition to tabulating the results for the 90%/10% statistical confidence criterion and the 50%/50% statistical confidence criterion, we have also applied a third metric, tabulating which correct information-absent determinations have a greater than 70% statistical confidence. (Unlike some information-absent determinations, all information-present determinations meet this criterion because they must meet the higher 90% information-present criterion.)
Conventional signal-detection methods for illustrating error rate as a function of probability criteria are inadequate
Most common metrics and visualization modalities for assessing the trade-off between correct determinations and errors as a function of the criteria for determinations are inadequate for representing any classification-CIT data, including the data of the present study, for several reasons.
One common method for illustrating and analyzing the results of the conventional ANS-based CIT is signal-detection theory and receiver operating characteristic (ROC) curves. As the name implies, receiver operating characteristic analysis was developed to analyze the operating characteristics of signal receivers, for example, to determine whether a blip on a radar screen was substantial enough to indicate the presence of a ship, or not. Such methods can readily be applied to estimate, for example, whether a change in skin conductance was large enough to indicate deception, or not. The signal is reduced to a single number, and if this number exceeds a threshold, it is classified as a detected signal. If not, then not.
ROC curves can be used to represent the data of the comparison CIT because there is only a single criterion that can be represented by a single number (P300 amplitude). For each subject, this number can be compared to a single criterion to make the relevant determination. Any subjects’ data not determined as information-present is automatically determined as information absent. The information-absent criterion is determined by the information-present criterion: the latter is simply 100% minus the former. Thus, the data set for multiple subjects with respect to a single criterion can be represented by a single line on a graph.
Data analysis in the classification CIT, however, is fundamentally different process. The classification-CIT data analysis not a signal-detection problem with a single criterion. It is a pattern-classification algorithm, with two separate template patterns in relation to which each subject’s response-pattern ERP data are analyzed.
The entire pattern of the ERP response to probes (not just a single number representing amplitude) is classified as being either (1) Significantly more similar to the brain-response pattern elicited by target stimuli than that elicited by irrelevant stimuli, resulting in an information-present determination; (2) Significantly more similar to irrelevant responses than to target responses, resulting in an information-absent determination; or (3) If neither criterion is met, no determination is made, and the data are not classified as either information present or information absent; the outcome is indeterminate.
The primary reason that conventional ROC curves cannot be applied to our data—or to any pattern-classification data analysis involving multiple types of data and multiple classification categories—is that conventional ROC analysis assumes that there is a single cut-off point for making a determination. This assumption applies in the comparison CIT, both with ANS measures and with ERPs. However, it does not apply in the classification CIT.
The classification CIT necessitates two separate criteria, one bootstrap probability criterion for information-present determinations and a separate probability criterion (in the opposite direction) for information-absent determinations. Moreover, the classification CIT requires an indeterminate category, which is not represented in an ROC curve. Consequently, ROC curves cannot adequately represent classification-CIT data.
Moreover, conventional methods of aggregating data have another shortcoming with respect to classification-CIT data. Conventional methods such as ROC curves do not preserve the statistical confidence of individual determinations. Such methods treat an information-absent determination with a statistical confidence–the computed probability that the determination is correct—of 99.9% no differently than an information-absent determination with a statistical confidence of 51%, effectively no better than chance, or even an invalid determination made with a computed probability of less than chance of being correct.
Moreover, even if they were applicable, conventional methods would provide limited useful information for our data because they are subject to a ceiling effect in the results of the BF classification CIT. In the present research, any criterion between 97.6 and 8.6% statistical confidence for information-present determinations combined with any criterion between 91.4 and 2.4% statistical confidence for information-absent determinations results in the same 0% error rate (see the Results section). Clearly, a more refined instrument than ROC curves and conventional signal-detection analysis is required. We have implemented such a method.
Pattern-classification methods are effective for illustrating and analyzing error rate as a function of probability criteria
We have applied pattern-classification methods for illustrating and analyzing our data. Such methods are suitable for application in a pattern-classification task such as the ERP-based classification CIT that comprises multiple types of data (responses to targets, probes, and irrelevants) and multiple classification categories (information present, information absent, or neither). Such methods also can be applied to compute statistical confidence/probability of error for hypotheses regarding which method (classification CIT or comparison CIT) is more accurate and reliable in making determinations. Pattern-classification methods provide for robust statistical analysis and comparison of the results of different experimental-designs. These analyses and comparisons are independent of the criteria selected for the respective determinations.
Classification operating characteristic (COC) curves and area between curves (ABC)
The task of representing the data across all subjects for the classification CIT comprises the following aspects. The bootstrap probability computational results for each subject must be represented, along with two additional features: the classification accuracy according to all possible information-present criteria and the classification accuracy according to all possible information-absent criteria. The classification accuracy for both information-present and information-absent determinations must be represented for each of the possible bootstrap probability criteria. The bootstrap probability figures computed for each subject range from 0.1 to 99.9% for a determination of information present according to an information-present criterion and 99.9 to 0.1% for a determination of information-absent according to a separate information-absent determination. The classification accuracy results at each possible bootstrap-probability criterion (actually, two separate criteria, one for information present and one for information absent) range from 0 to 100%.
All of this is illustrated in a single classification operating characteristic (COC) graphic with two curves for the two respective criteria, information present and information absent. This is further discussed in the Results section, along with the corresponding figures.
For the sake of comparison between two methods (classification CIT and comparison CIT), the aggregate data across all subjects can be represented as a single number between 0 and 1 by the area between the curves. Perfect discrimination results in an area of 1. Random discrimination results in an area of 0. For the classification CIT, two curves are necessary to adequately represent the data because there are two separate criteria for information-present and information-absent determinations respectively. The classification operating characteristic (COC) analysis takes into account the full data set generated by the application of all possible criteria for information-present determinations and all possible criteria for information-absent determinations, represented respectively by the two curves.
The area between the curves in a COC analysis is in some ways comparable to the area under an ROC curve. An ROC plot, however, contains only one curve, because there is only a single criterion. The area under the curve comprises a number between 0 and 1, with perfect discrimination resulting in an area of 1 and random discrimination resulting in an area of 0.5.
We have represented and analyzed our data with COC curves and computation of the area between the curves.
In addition to the area between the curves, we have computed two additional single-number representations for the performance of the two respective methods, classification CIT and comparison CIT: error rate and median statistical confidence.
We have computed two non-parametric statistical results quantifying the results with respect to our hypothesis regarding the relative accuracy, reliability, and statistical confidence of the classification CIT and the comparison CIT.
One statistic compares the performance of the two methods across all subjects independent of any criteria for information-present or information-absent determinations. It compares the bootstrap probability figures for all subjects across all possible classification criteria. This analysis is represented graphically by the COC curves and the area between the curves (ABC). Like the COC curves and the ABC, this statistical analysis is entirely independent of any classification criteria. The statistical analysis is achieved by applying the Wilcoxon signed-rank test to all bootstrap probability results for all subjects, without first defining any cut-off point for correct or incorrect determinations.
A second statistic compares the performance of the respective methods, considering only the statistical confidence with which correct determinations were made. It compares the statistical confidence for the two methods for all correct determinations. The statistical analysis is achieved by applying the Wilcoxon signed-rank test to all correct bootstrap probability results, with correct defined according to our a priori criteria of 90% statistical confidence for information-present determinations and 90% (in the opposite direction) statistical confidence for information-absent determinations. As explained in the Results section, this analysis includes all the same data as the above analysis, except that the data for the one erroneous determination by the comparison CIT are excluded.
We also compared the BF classification CIT with the comparison CIT with respect to error rate. This is of course dependent on the a priori criteria selected for information-present and information-absent determinations. It provides limited information in that it does not consider the statistical confidence with which each determination was made. Nevertheless, error rate is a universal metric in reporting on scientific data. It is the primary standard by which various methods are compared in the legal arena and on the basis of which methods are evaluated for the purpose of being ruled admissible as scientific evidence in court (Farwell and Makeig 2005; Farwell et al. 2013; Harrington v. State 2001).
The error-prevention buffer
The progress in research in the brainwave-based CIT has fundamentally been an exploration of the necessary and sufficient conditions for a method to be sufficiently valid and reliable for practical and ethical field use when there are major consequences to the outcome. Fundamental to this exploration is the process of making changes in the experimental methods and documenting the effect those changes have on the experimental results. In all our research since 1992, The BF classification CIT has been subject to a ceiling effect in this regard. All our BF-classification-CIT studies have achieved 0% false negatives and 0% false positives. Since 1992, there also have been no indeterminates. Nevertheless, we have made minor changes in experimental design, and it is important to quantify the difference, if any, that these changes in method have made in results.
Error rates and statistical confidences, of course, are the universal metrics that must be considered in any meaningful comparison of the results produced by different methods. Comparing error rates across studies that all have 0% error rate (as all existing studies of the classification CIT do), however, is obviously not an adequate solution to distinguish differences in the performance brought about by minor changes in parameters or experimental design within the classification CIT.
As mentioned above, most metrics for assessing the trade-off between correct determinations and errors as a function of the probability criteria for determinations provide limited useful information for our data because they are subject to a ceiling effect in the results of the BF classification CIT. For example, in the present research, any criterion between 97.6 and 8.6% statistical confidence for information-present determinations combined with any criterion between 91.4 and 2.4% statistical confidence for information-absent determinations results in the same 0% error rate (see the Results section).
The number of indeterminates is also a metric of the performance of a method. Studies with 0% error rate and differing numbers of indeterminates can of course be compared on the basis of the number of indeterminates. The number of indeterminates, however, does not provide a metric of how close the method came to producing an error. Also, in all of our studies since 1992, when we implemented situation-relevant targets and analysis of the full P300-MERMER (which were not applied in Farwell and Donchin 1991), the BF classification CIT has produced no indeterminates.
Median statistical confidences shed considerable light on the differences in results. However, when comparing multiple methods all of which produced no errors, they do not directly address the fundamentally important question of how close each method came to producing an error.
We have developed the “error-prevention buffer” as a simple metric for comparing the results produced by different methods that produce 0% error rates, specifically with respect to how close each method comes to producing an error. It provides a standard metric for how close each particular method is to producing an error. The error-prevention buffer provides a method to compare the results of studies where there are no false positives and no false negatives (e.g., Farwell and Smith (2001); Farwell et al. (2013, 2014); and the present study).
In the present study, the classification CIT achieved 0% error rate, and the comparison CIT did not. Thus, the relative size of the error-prevention buffer could not be applied to compare these two methods, because there was no error-prevention buffer for the comparison CIT. With respect to other studies, however, the error-prevention buffer can shed light on the differences between different studies and methods.
The error-prevention buffer is a metric, or actually two similar but not identical metrics, that quantify how close to an error the results have been, when there are no actual errors. One metric is the criterion-independent error-prevention buffer. This can be applied only when there is no overlap between the data for information-present subjects and information-absent subjects. The other metric is the criterion-dependent error-prevention buffer. This can be applied when there are no errors according to the respective criteria for information-present and information absent determinations, even if there is overlap between the data for information-present and information-absent subjects.
The criterion-independent error-prevention buffer is defined as the difference between the respective probabilities of the least statistically confident information-present determination and the least statistically confident information-absent determination.7 If there are indeterminates, they are analyzed according to the computed statistical confidence, even though it does not meet the criterion for a determination.
To make this computation on compatible numbers, both probabilities are first expressed as information-present probabilities. Recall that the information-present probability (the computed probability that information-present is correct) for a subject is equivalent to 100% minus the information-absent probability (the probability that information-absent is correct) for the same subject.
For example, if the least statistically confident information-present determination has a statistical confidence of 95% and the least statistically confident information-absent determination has a statistical confidence of 90%, then the computation is as follows. A 90% information-absent probability is equivalent to a 100% − 90% = 10% information-present probability for that subject. The criterion-independent error-prevention buffer is 95% − 10% = 85%.
The criterion-independent error-prevention buffer provides an estimate of how close the technique is to having made an error, independent of the probability criteria selected to define a correct determination or an error. It quantifies a range for the criteria for information-present and information-absent determinations, such that either criterion can be set anywhere within this range without producing any errors. In the above example, one can select any information-present criterion and any information-absent criterion in the range of 85% covered by the criterion-independent error-prevention buffer (10% to 95% in the information-present direction or, equivalently, 90% to 5% in the information-absent direction), and any such selection will result in 0% errors.
The criterion-independent buffer is represented in the figures as described below.
Unlike the criterion-independent error-prevention buffer, the criterion-dependent error-prevention buffer is dependent on the criteria established for information-present and information-absent determinations. The criterion-dependent error-prevention buffer is a metric of how close the method came to producing an error, according to the bootstrap probability criteria applied in the study for information-present and information-absent determinations. This is the difference between the individual-subject bootstrap computed probability closest to an error and the probability result that would have resulted in an actual error (an incorrect determination, either a false positive or a false negative).
To compute the criterion-dependent error-prevention buffer, two buffers are computed, a false-negative-prevention buffer for information-present subjects and a false-positive-prevention buffer for information-absent subjects. The lesser of these two becomes the criterion-dependent error-prevention buffer.
The criterion-dependent error-prevention buffer is defined as the lesser of the two following numbers: (1) The difference, in bootstrap probability percentage points, between the lowest information-present probability computed for an information-present subject and the information-present probability that corresponds to the information-absent criterion (i.e., 100% minus the information-absent criterion); and (2) The difference, in bootstrap probability percentage points, between the lowest information-absent probability computed for an information-absent subject and the information-absent probability that corresponds to the information-present criterion (i.e., 100% minus the information-present criterion).
The former quantifies the distance between the information-present results and a false-negative error and can be considered the false-negative-prevention buffer. The latter quantifies the distance between the information-absent results and a false-positive error and can be considered the false-positive-prevention buffer.
When there are indeterminates, indeterminates are considered simply in terms of their computed probability of being correct, even though it does not meet the criterion for a determination.
For example, consider Farwell and Donchin (1991), Experiment 1. Note that this method can be applied when there are indeterminates, as there were in that study. The lowest information-present bootstrap probability computed for an information-present subject was 45%, equivalent to a 55% information-absent probability for that (indeterminate) subject. Applying the information-absent criterion of 70% that we applied in that study, the false-negative-prevention buffer is 70% − 55% = 15%. The lowest information-absent bootstrap probability computed on an information-absent subject was 36%, equivalent to a 64% information-present probability for that (indeterminate) subject. Applying the information-present criterion of 90%, the false-positive-prevention buffer is 90% − 64% = 26%. Since the false-negative-prevention buffer of 15% is less than the false-positive-prevention buffer of 26%, the criterion-dependent error-prevention buffer is 15%.
The criterion-dependent error-prevention buffer is one way of quantifying the improvements in performance of the present study as compared to Farwell and Donchin (1991), as discussed in the Discussion section.
Results
Classification CIT, experiment 1
Error rate/accuracy
For the BF classification CIT, if the bootstrap computed probability (statistical confidence) is greater than 90% that the subject is information present, the subject is determined to be information present. If the probability is greater than 90% that the subject is information absent (equivalent to a 100% − 90% = 10% probability that they are information present), the determination is information absent. When neither criterion is met, no determination is made: the result is indeterminate. The possible outcomes for a subject are correct positive, correct negative, false positive, false negative, and indeterminate.
Table 1 presents the error rate/accuracy of the BF classification CIT in Experiment 1.
Table 1.
BF Classification CIT error rate/accuracy, experiment 1
| BF classification CIT: error rate/accuracy | |||
|---|---|---|---|
| Information present subjects | Tests | 6 | 100% |
| Correct positives | 6 | 100% | |
| False negatives | 0 | 0% | |
| Indeterminates | 0 | 0% | |
| Information absent subjects | Tests | 12 | 100% |
| Correct negatives | 12 | 100% | |
| False positives | 0 | 0% | |
| Indeterminates | 0 | 0% | |
| All subjects | Tests | 18 | 100% |
| Correct determinations | 18 | 100% | |
| Errors | 0 | 0% | |
| Indeterminates | 0 | 0% | |
| Accuracy | 18/18 | 100% | |
| Error rate | 0/18 | 0% | |
All determinations were correct. Error rate was 0%. Accuracy was 100%. There were no indeterminates.
Individual determinations and statistical confidences
Table 2 presents the determination and statistical confidence of the BF classification CIT for each information-present subject in Experiment 1.
Table 2.
BF classification CIT determinations and statistical confidences for information-present subjects, experiment 1
| BF classification CIT Determinations and statistical confidence, exp. 1 Information-present subjects | |||
|---|---|---|---|
| Subject test # | Determination | Statistical confidence % | Correct |
| 1 | Info present | 99.9 | Yes |
| 2 | Info present | 99.6 | Yes |
| 3 | Info present | 99.9 | Yes |
| 4 | Info present | 96.7 | Yes |
| 5 | Info present | 99.9 | Yes |
| 6 | Info present | 99.9 | Yes |
All BF-classification-CIT determinations for information-present subjects in Experiment 1 were correct. All statistical confidences exceeded the BF classification CIT criterion of 90% for an information-present determination. All determinations were made with a statistical confidence of greater than 96%. All but one were made with a statistical confidence of greater than 99%. The median statistical confidence was 99.9%.
Figure 5 presents the brain responses for information-present subjects in Experiment 1.
Fig. 5.

Brain Responses, Experiment 1, Information-Present Subjects. Brain responses to Target, Irrelevant, and Probe stimuli at the Pz electrode site for information-present subjects. X axis : time post-stimulus onset, 0–1800 ms. Y axis : amplitude in microvolts
Table 3 presents the determination and statistical confidence of the BF classification CIT for each information-absent subject in Experiment 1.
Table 3.
Classification CIT determinations and statistical confidences for information-absent subjects, experiment 1
| Classification CIT determinations and statistical confidences, exp. 1 information-absent subjects | ||||
|---|---|---|---|---|
| Subject test # | Determination | Statistical confidence (%) | Correct | Valid |
| 7 | Info absent | 99.9 | Yes | Yes |
| 8 | Info absent | 99.8 | Yes | Yes |
| 9 | Info absent | 92.2 | Yes | Yes |
| 10 | Info absent | 99.6 | Yes | Yes |
| 11 | Info absent | 91.4 | Yes | Yes |
| 12 | Info absent | 99.6 | Yes | Yes |
| 13 | Info absent | 98.5 | Yes | Yes |
| 14 | Info absent | 99.6 | Yes | Yes |
| 15 | Info absent | 99.9 | Yes | Yes |
| 16 | Info absent | 99.9 | Yes | Yes |
| 17 | Info absent | 99.6 | Yes | Yes |
| 18 | Info absent | 98.3 | Yes | Yes |
Figure 6 presents the brain responses for information-absent subjects in Experiment 1.
Fig. 6.

Brain Responses, Experiment 1, Information-Absent Subjects. Brain responses to Target, Irrelevant, and Probe stimuli at the Pz electrode site for information-absent subjects. X axis : time post-stimulus onset, 0–1800 ms. Y axis : amplitude in microvolts
All BF classification-CIT determinations for information-absent subjects in Experiment 1 were correct. All statistical confidences exceeded the BF-classification-CIT criterion of 90% for an information-absent determination. All determinations were made with a statistical confidence of greater than 91%. The median statistical confidence for classification-CIT information-absent determinations was 99.6%.
The median statistical confidence for all classification-CIT determinations, including both information-present and information-absent determinations, was 99.6%.
All determinations were valid, defined as having a greater computed probability of being correct than incorrect, i.e., statistical confidence of greater than 50%. (Valid and invalid determinations are discussed in more detail below in reference to the comparison CIT.)
Classification operating characteristic (COC) curves and area between curves (ABC) analysis
Classification Operating Characteristic (COC) curves represent classification accuracy as a function of bootstrap probability criteria, for all possible criteria for both information-present and information-absent determinations.
Figure 7 is a classification operating characteristic (COC) curve representing the percentage of classification-CIT information-present and information-absent determinations that were correct as a function of bootstrap probability criteria, across all criteria for both information-present and information-absent determinations, for all subjects, including both ground-truth information-present and ground-truth information-absent subjects.
Fig. 7.

COC for Classification CIT: % Correct Determinations as a Function of Bootstrap Probability Criteria. Classification operating characteristic (COC) curve representing the percentage of classification-CIT information-present and information-absent determinations that are correct as a function of bootstrap probability criteria. For information-present subjects: X axis is all possible information-present bootstrap probability criteria in 1% increments in descending order, 99.9%, 99%, 98%…2%, 1%, 0.1%. Y axis is the percentage of correct information-present determinations at each criterion, plotted as distance from the bottom of the graph. For information-absent subjects: X axis is all possible information-absent bootstrap probability criteria in 1% increments in ascending order, 0.1%, 1%, 2%…98%, 99%, 99.9%. Y axis is the percentage of correct information-absent determinations at each criterion, plotted as distance from the top of the graph. At each point along the X axis, the difference between the curves represents the percentage of subjects who would be classified correctly by both the corresponding criteria, information present and information absent. The area between the curves (ABC) is the sum of these differences. Perfect discrimination produces an area of 1. Random discrimination produces an area of 0. The error prevention buffer is the range of bootstrap probability criteria where all determinations, information-present and information-absent, would be correct. Setting the respective criteria at any point in this range results in 0% error rate
The area between the curves (ABC) is a number between 0 and 1 that quantifies the performance of the method across all possible values for the information-present and information-absent criteria for the bootstrap probability computation. Perfect discrimination results in an area of 1. Random discrimination results in an area of 0. The classification CIT produced an ABC of 0.97, indicating near-perfect discrimination for both information-present and information-absent subjects.
All determinations were correct at the a priori criteria established for the study, 90% for information present and 90% in the opposite direction for information absent. All determinations were also correct at a wide range of higher and lower criteria.
Any information-present bootstrap probability criterion less than or equal to 96.7% results in 0% error rate; all information-present determinations are correct at any information-present criterion between 0.1 and 96%.
Any information-absent bootstrap probability criterion less than or equal to 91.4% results in 0% error rate; all information-absent determinations are correct at any information-absent criterion between 0.1 and 91%.
All determinations were valid, that is, all determinations were made with a computed bootstrap probability of greater than 50% of being correct.
The error-prevention buffer
The error-prevention buffer applies only to methods that produce 0% error rate. It comprises the range of bootstrap probability criteria, both information-present and information-absent, that result in 0% error rate. Perfect discrimination results in an error-prevention buffer of 100%.
Criterion-independent error-prevention buffer
For the BF classification CIT in Experiment 1, the least statistically confident information-present determination was made with a statistical confidence of 96.7%. The least statistically confident information-absent determination was made with a statistical confidence of 91.4%, which is equivalent to an information-present probability of 8.6%. Therefore the criterion-independent error-prevention buffer is 96.7% − 8.6% = 88.1%. This is illustrated in Fig. 7.
The bootstrap probability computation results for information-present and information-absent subjects respectively are separated by a buffer of 88.1%. Clearly, the BF classification CIT produced results where every determination was made with a high statistical confidence, and every determination was very far from an error.
The criterion for information-present could be set anywhere between 96.7% and 8.6% probability without producing any errors. The criterion for information-absent could be set anywhere between 91.4 and 4.3% probability without producing any errors.
Criterion-dependent error-prevention buffer
For the BF classification CIT in Experiment 1, the least statistically confident information-present determination was made with a statistical confidence of 96.7%. The information-absent criterion was 90% statistical confidence in the opposite direction, that is, a 90% probability that information absent was the correct determination, which is equivalent to a 10% probability that information-present is correct. The criterion-dependent false-negative error-prevention buffer therefore is 96.7% − 10% = 86.7%.
Similarly, the least statistically confident information-absent determination was made with a statistical confidence of 91.4%. The information-present criterion was 90% statistical confidence in the opposite direction, that is, a 90% probability that information present was the correct determination, which is equivalent to a 10% probability that information absent is correct. The false-positive error-prevention buffer therefore is 91.4% − 10% = 81.4%. As this is less than the false-negative error-prevention buffer, this makes the criterion-dependent error-prevention buffer 81.4%.
There is a buffer of at least 81.4% between the bootstrap probability result for every subject and the outcome that would have resulted in an error for that subject, with the criteria established for the study for information-present and information-absent determinations. This indicates that not only were all determinations correct, with no indeterminates, but also every individual subject’s result was very far from being an error.
For a discussion of the error-prevention buffer in relation to other studies with differences in methods, see the Discussion section.
Comparison CIT, experiment 1
Error rate/accuracy and validity
As discussed above, for the comparison CIT, the possible outcomes of the statistical computations are correct positive, correct valid negative, correct invalid negative, false positive, and false negative.
Table 4 presents the error rate/accuracy of the comparison CIT in Experiment 1 (the only experiment where the comparison CIT was applied). This table presents results for (1) The usual criterion of 90% statistical confidence for information-present determinations and 10% (i.e., 100% − 90% = 10%) statistical confidence for information-absent determinations, and (2) The criterion of 50% statistical confidence for information-present determinations and 50% statistical confidence for information-absent determinations. The 50%/50% criterion is the only criterion that ensures that all individual results will be valid determinations, that is, will have a greater-than-chance computed probability of being correct.
Table 4.
Comparison CIT error rate/accuracy, experiment 1
| Comparison CIT: error rate/accuracy | |||||
|---|---|---|---|---|---|
| 90%/10% criterion | 50%/50% criterion | ||||
| Information present subjects | Tests | 6 | 100% | 6 | 100% |
| Correct positives | 6 | 100% | 6 | 100% | |
| False negatives | 0 | 0% | 0 | 0% | |
| Information absent subjects | Tests | 12 | 100% | 12 | 100% |
| Correct, valid negatives | 4 | 33% | 4 | 33% | |
| Correct, invalid negatives | 7 | 58% | 0 | 0% | |
| False positives | 1 | 8% | 8 | 67% | |
| Valid determinations | 5 | 42% | 12 | 100% | |
| Correct determinations | 11 | 92% | 4 | 33% | |
| Correct & valid determinations | 4 | 33% | 4 | 33% | |
| All subjects | Tests | 18 | 100% | 18 | 100% |
| Correct, valid | 10 | 56% | 10 | 56% | |
| Correct, invalid | 7 | 39% | 0 | 0% | |
| Errors | 1 | 6% | 8 | 44% | |
| Valid | 11 | 61% | 18 | 100% | |
| Invalid | 7 | 39% | 0 | 0% | |
| Accuracy | 17 | 94% | 10 | 56% | |
| Error rate | 1 | 6% | 8 | 44% | |
| Correct and valid | 10 | 56% | 10 | 56% | |
The results for the comparison CIT present a trade-off between validity and error rate. Applying the conventional 90%/10% criterion applied in previous studies resulted in a 6% error rate/94% accuracy, with 56% correct and valid determinations and 39% correct and invalid determinations.
With the 50%/50% criterion, all results are valid, but the error rate is 44%; accuracy is 56% approximately chance accuracy. In either case, only 56% of determinations are correct and valid.8
Individual determinations, statistical confidences, and validity
Information present
Table 5 presents the determination and statistical confidence of the comparison CIT for each information-present subject in Experiment 1.
Table 5.
Comparison CIT determinations, statistical confidences, and validity, information-present subjects
| Comparison CIT determinations, statistical confidences, and validity information-present subjects | |||
|---|---|---|---|
| Subject test # | Determination | Statistical confidence % | Correct |
| 1 | Info present | 99.4 | Yes |
| 2 | Info present | 99.6 | Yes |
| 3 | Info present | 98.2 | Yes |
| 4 | Info present | 97.5 | Yes |
| 5 | Info present | 99.9 | Yes |
| 6 | Info present | 99.9 | Yes |
All information-present determinations were correct. All statistical confidences exceeded the criterion of 90%. All statistical confidences were greater than 97%. Median statistical confidence was 99.5%.
Information absent
Table 6 presents the determination, statistical confidence, and validity of the comparison CIT for each information-absent subject in Experiment 1.
Table 6.
Comparison CIT determinations, statistical confidences, and validity, information-absent subjects
| Comparison CIT determinations, statistical confidences, and validity information-absent subjects | ||||||||||
|---|---|---|---|---|---|---|---|---|---|---|
| 90% criterion information present = 10% criterion information absent | 50% criterion information present = 50% criterion information absent | |||||||||
| Subject test # | Determination | Statistical confidence | Correct | Valid (> 50%) | > 70% | Determination | Statistical confidence | Correct | Valid (> 50%) | > 70% |
| 7 | Info absent | 52.6% | Yes | Yes | No | Info absent | 52.6% | Yes | Yes | No |
| 8 | Info absent | 38.1% | Yes | No | No | Info present | 61.9% | No | N/A | N/A |
| 9 | Info absent | 62.5% | Yes | Yes | No | Info absent | 62.5% | Yes | Yes | No |
| 10 | Info absent | 75.7% | Yes | Yes | Yes | Info absent | 75.7% | Yes | Yes | Yes |
| 11 | Info absent | 39.7% | Yes | No | No | Info present | 60.3% | No | N/A | N/A |
| 12 | Info absent | 23.5% | Yes | No | No | Info present | 76.5% | No | N/A | N/A |
| 13 | Info absent | 49.1% | Yes | No | No | Info present | 50.9% | No | N/A | N/A |
| 14 | Info absent | 18.5% | Yes | No | No | Info present | 81.5% | No | N/A | N/A |
| 15 | Info absent | 83.9% | Yes | Yes | Yes | Info absent | 83.9% | Yes | Yes | Yes |
| 16 | Info absent | 48.7% | Yes | No | No | Info present | 51.3% | No | N/A | N/A |
| 17 | Info absent | 13.1% | Yes | No | No | Info present | 84.2% | No | N/A | N/A |
| 18 | Info present | 99.9% | No | N/A | N/A | Info present | 99.9% | No | N/A | N/A |
| Percent | 92% | 36% | 18% | Percent | 33% | 100% | 50% | |||
Individual results for the comparison CIT for information-absent subjects illustrate the details of the trade-off between validity and accuracy. Results for information-absent subjects were as follows.
With the 90% information-present/10% information absent criterion, error rate was 8%; accuracy was 92%.
One information-absent subject was erroneously determined as information-present at the 90%/10% criterion. Ground-truth information-absent subject 18 was determined to be information present with a statistical confidence of 99.9%. The determination for this subject would still be an error at all information-absent criteria from 0.1 to 99.9%. For an information-absent subject determined to be information-present with an information-present statistical confidence of 99.9%, this is equivalent to failing to determine the subject as information absent at a 0.1% information-absent criterion. Even at the lowest possible criterion to determine this subject as information-absent (0.1%), this subject was determined in error. In other words, if all subjects with at least a 0.1% probability of being information-absent according to the comparison-CIT analysis were determined as information absent, this subject still would not have met the criterion and would not have been determined as information absent. This is further discussed and graphically illustrated below.
Only 4 out of 11 correct determinations (36%) were valid, that is, having a computed probability of greater than 50% (chance) of being correct. 64% of correct determinations were invalid, having statistical confidences of less than 50%. That is, the comparison-CIT statistical method had computed that the probability that they were correct was less than 50%.
For example, the determination for subject 17 is information absent, which technically is not an error, but the computed probability that this determination is correct is only 13.1%. Obviously, this is not a result that could be applied in a real-world situation, nor is it valid from a scientific or statistical point of view. One cannot validly report: “Our data analysis algorithm determined that this subject is information absent. The computed probability that this is the correct determination is 13.1%.”
With this criterion, 8 out of 12 of the information-absent determinations (67%) were either incorrect or invalid. Only 4 out of 12 information-absent determinations (33%) were correct and valid.
With the comparison CIT, only 2 out of 11 correct information-absent determinations (18%) had a determination with greater than 70% computed probability of being correct, the criterion applied for information-absent determinations in our previous classification-CIT research. None had a computed probability of over 90% of being correct, the required criterion we applied to information-absent (as well as information-present) subjects in the BF classification CIT in the present studies.
Overall, the statistical confidences for the comparison CIT for information-absent subjects were no better than chance. In fact, median statistical confidence was less than chance, 48.7%. This is the same as the result predicted by the statistical model and reported overall in previous studies.
Overall comparison-CIT results, information present and information absent
Considering all results, the 90%/10% criteria for information-present and information-absent respectively resulted in an error rate of 6% and accuracy of 94%. This is the criterion applied in almost all previous comparison-CIT studies that have applied bootstrapping.
With this criterion, 59% of correct determinations were valid. 56% of all determinations were both correct and valid. Thus, the comparison CIT performed only slightly better than chance with respect to error rate and validity overall.
With the 50%/50% criterion, all correct determinations are valid, but the error rate is increased to 44%. Accuracy is 56%, only slightly better than chance.
Both the 90%/10% criterion and the 50%/50% criterion resulted in 56% of determinations being both correct and valid. 44% of determinations were either incorrect or invalid.
The median statistical confidence for all correct determinations with the comparison CIT was 62.5%, somewhat better than chance. The better-than-chance performance was entirely due to the information-present statistical confidences. Median information-absent statistical confidence was slightly less than chance, 48.7%.
Classification operating characteristic (COC) curves and area between curves (ABC) analysis
Figure 8 is a Classification Operating Characteristic (COC) curve representing the percentage of comparison-CIT information-present and information-absent determinations that are correct as a function of bootstrap probability criteria, across all possible criteria for both information-present and information-absent determinations, for both ground-truth information-present and ground-truth information-absent subjects. This figure includes both valid and invalid determinations in the count of correct determinations.
Fig. 8.

Comparison CIT: % Correct Determinations as a Function of Bootstrap Probability Criteria. Classification operating characteristic (COC) curve representing the percentage of comparison-CIT information-present and information-absent determinations that are correct as a function of bootstrap probability criteria. Axes, values, and area between curves (ABC) as in Fig. 7. This figure includes all information-present determinations and all information-absent determinations, both valid and invalid
The area between the curves (ABC) is 0.41. As compared with an ABC of 1 for perfect discrimination and an ABC of 0.97 for the classification CIT, this indicates poor discrimination by the comparison CIT, both on an absolute scale and as contrasted with the classification CIT.
The comparison CIT makes at least one error at all possible values for the bootstrap probability criterion. Ground-truth information-absent subject 18 is determined as information-present with a statistical confidence of 99.9%. This results in an error at the lowest possible information-absent criterion (0.1%), and at all other higher criteria. Equivalently, it results in an error at the highest possible information-present criterion (99.9%), and at all other lesser criteria.
There is no error-prevention buffer because there is no criterion that will prevent errors; all possible criteria result in at least one error.
Any information-absent criterion of greater than 83.9% results in 100% error rate (0% accuracy) for the comparison CIT for information-absent subjects. The highest statistical confidence for an information-absent determination was 83.9%. If we had required an a priori 90% statistical confidence for information-absent determinations for the comparison CIT, as we did for the classification CIT, the error rate for the comparison CIT would have been 100% (0% accuracy).
Figure 9 is a COC curve representing the percentage of comparison-CIT determinations that were both correct and valid, as a function of bootstrap probability criteria, across all criteria for both information-present and information-absent determinations, for both ground-truth information-present and ground-truth information-absent subjects. This figure tabulates the percentage of determinations that are correct and also valid.
Fig. 9.

Comparison CIT: % Correct, Valid Determinations as a Function of Bootstrap Probability Criteria. Classification operating characteristic (COC) curve representing the percentage of comparison-CIT information-present and information-absent determinations that are correct as a function of bootstrap probability criteria. Axes, values, and area between curves (ABC) as in Fig. 7. This figure includes all (correct) information-present determinations and only information-absent determinations that are correct and valid. Invalid determinations (those with a computed probability of less than 50% of being correct) are excluded
Valid determinations are made with a greater than 50% (chance) computed probability of being correct. Invalid determinations are correct determinations with less than a 50% computed probability of being correct, i.e., less than 50% statistical confidence. For example, ground-truth information-absent subject 17 was determined as information-absent with a statistical confidence of 13.1%. This determination is “correct” as it matches his true condition, but is not valid because the computed bootstrap probability of its being correct is less than chance (50%).
Since 7 of the 11 information-absent determinations were invalid, the percentage of correct and valid determinations represented in Fig. 9 is much lower than the percentage of correct determinations represented in Fig. 8, where invalid as well as valid correct determinations are plotted. Consequently, the area between the curves (ABC) is lower, 22%. This indicates poor discrimination for the comparison CIT.
Classification CIT vs. comparison CIT: substantially different methods produce significantly different results
The performance of the classification CIT was better than that of the comparison CIT on all relevant metrics, and significantly better as measured by all relevant statistical tests.
This difference is exemplified in the differences between Fig. 7, a classification operating characteristic (COC) analysis of the classification CIT, as contrasted with Figs. 8 and 9, which contain the comparable data for the comparison CIT.
The area between the curves (ABC), a metric of the overall performance of the respective methods across all bootstrap probability criteria and all subjects, is 0.97 (out of a maximum of 1) for the classification CIT and 0.41 for the comparison CIT, even when invalid determinations for the latter are considered “correct.” When including only determinations that are both correct and valid, the ABC is 0.22 for the comparison CIT.
This difference is highly statistically significant. The bootstrap probability results for the classification CIT were significantly higher (in the correct direction) than for the comparison CIT (P < 0.001, Wilcoxon matched-pairs signed ranks), independent of determinations, that is, considering the bootstrap probability figures without applying any criterion for information-present or information-absent determinations. This is the most universal, criterion-independent statistic applied to contrast the results of the two methods.
When information-present and information-absent determinations were applied according to our a priori criteria, BF classification-CIT statistical confidences for all correct determinations, including both information-present and information-absent, were significantly higher than comparison-CIT statistical confidences (P < 0.001, Wilcoxon matched-pairs signed ranks).
BF classification-CIT statistical confidences for information-absent subjects were significantly higher than those of the comparison CIT (P < 0.001, Wilcoxon matched-pairs signed ranks). Classification-CIT statistical significances for information-present subjects were slightly but not significantly higher than those of the comparison CIT.
The error rate for the classification CIT was 0%. The error rate for the comparison CIT was 6%.
All of the determinations for the classification CIT were valid, i.e., all were achieved with a statistical confidence (computed probability of being correct) of better than chance (50%). For the comparison CIT, only 4 of 11 (36%) information-absent determinations were valid. This is lower, but not markedly lower, than the average results of previous studies and the prediction of the statistical model, both of which comprise 50% valid information-absent determinations for the comparison CIT.
Classification CIT, experiment 2
Error rate/accuracy
Table 7 presents the error rate/accuracy of the BF classification CIT in Experiment 2. In this experiment we applied only the classification CIT. Ground truth was information present for all subjects.
Table 7.
Classification CIT error rate/accuracy, experiment 2
| BF classification CIT: error rate/accuracy | |||
|---|---|---|---|
| Information present subjects | Tests | 5 | 100% |
| Correct positives | 5 | 100% | |
| False negatives | 0 | 0% | |
| Correct determinations | 5 | 100% | |
| Errors | 0 | 0% | |
| Indeterminates | 0 | 0% | |
| Accuracy | 5/5 | 100% | |
| Error rate | 0/5 | 0% | |
Individual determinations and statistical confidences
Table 8 presents the BF classification CIT determination and statistical confidence for each subject in Experiment 2.
Table 8.
BF classification cit determinations and statistical confidences, experiment 2
| BF classification CIT determinations and statistical confidences experiment 2 information-present subjects | |||
|---|---|---|---|
| Subject test # | Determination | Statistical confidence % | Correct |
| 1 | Info present | 96.5 | Yes |
| 2 | Info present | 99.9 | Yes |
| 3 | Info present | 96.5 | Yes |
| 4 | Info present | 96.6 | Yes |
| 5 | Info present | 99.9 | Yes |
In Experiment 2 we applied only the BF classification CIT. All subjects were ground truth information present. All determinations in Experiment 2 were correct. All statistical confidences exceeded the classification-CIT criterion of 90% for an information-present determination. All determinations were made with a statistical confidence of greater than 96%. The median statistical confidence was 99.6%.
Countermeasures
In both Experiment 1 and Experiment 2, we taught subjects the “try not to think about it” countermeasure (Bergström et al. 2013), the only countermeasure for which the BF classification CIT had not been previously tested and shown to be highly resistant. The BF classification CIT was highly resistant to this countermeasure as well. The countermeasure had no discernible effect. The BF classification CIT achieved less than 1% error rate (actually, 0%) and greater than 95% median statistical confidence for both information-present and information-absent determinations.
Discussion
The brain fingerprinting scientific standards hypothesis
The present research was specifically designed to incorporate the brain fingerprinting scientific standards (specified in Appendix 1). These standards are the basis for the brain fingerprinting scientific standards hypothesis.
Recall that the three-part brain fingerprinting scientific standards hypothesis is as follows:
Hypothesis 1
Applying methods that substantially meet the 20 brain fingerprinting scientific standards provides sufficient conditions to produce less than 1% error rate9 overall and less than 5% error rate in every individual study. This holds true (1a) without countermeasures, (1b) with countermeasures, and (1c) in field cases where it is unknown whether countermeasures are being practiced or not.
Hypothesis 2
Applying scientific methods that substantially meet the 20 scientific standards provides sufficient conditions to consistently produce statistical confidences for individual determinations of 95% overall, including at least 90% for information-present determinations (the subject knows the tested information) and 90% in the opposite direction for information-absent determinations (the subject does not know the tested information).
Hypothesis 3
Some but not all of the 20 scientific standards are also necessary conditions to simultaneously obtain the levels described above for (3a) error rate and (3b) statistical confidence. The standards that are not necessary are nevertheless useful in that they improve accuracy and/or statistical confidence.
The present research was specifically structured to incorporate the brain fingerprinting scientific standards specified in Appendix 1 and to test the hypothesis that these standards provide the sufficient conditions for a brainwave-based CIT that is sufficiently reliable for field applications.
To test the brain fingerprinting scientific standards hypothesis, recall that this research addresses the specific scientific questions delineated in the section titled Scientific Questions Addressed by this Research.
Our data provide evidence that all of these scientific questions can be answered in the affirmative, particularly when considered in light of the highly similar results in previous similar field studies (Farwell et al. 2013, 2014). Details are as follows.
Our Results Support the Brain Fingerprinting Scientific Standards Hypothesis.
-
I.
Do field tests on suspects in real-world terrorist crimes and other crimes support the brain fingerprinting scientific standards hypothesis?
We shall discuss this fundamental question in relation to our data relevant to each of the specific parts.
- Does the classification CIT, when implemented according to the 20 brain fingerprinting scientific standards, produce…
-
(i)The error rate of 0% meets the criterion of less than 1% error rate.
-
(ii)The overall median statistical confidences of 99.6% for both Experiment 1 and Experiment 2 meet the criterion of 95%.
-
(iii)The median statistical confidences of 99.9% and 99.6% for information-present subjects in Experiment 1 and Experiment 2 respectively, and 99.6% for information-absent subjects (Experiment 1) meet the criterion of 90% for information-present and information-absent statistical confidences taken separately.
-
(iv)With regard to countermeasures, since this is a field study, it meets the criterion for the above metrics of error rate and statistical confidences for (c) field cases, where it is unknown whether subjects used countermeasures or not. Since subjects were instructed in countermeasures, it also meets the criterion for (b) countermeasures. Since it is a field case and we cannot count on cooperation from subjects, it was not possible to run a condition that was known for certain to be without countermeasures (a). In any case, the 0% error rate in field conditions is the best that can be obtained, in the most demanding circumstances possible. Since the error rate is 0%, there is no way that the countermeasures practiced could have increased the error rate.
-
(i)
-
2.
Do the 20 brain fingerprinting scientific standards provide sufficient conditions for a brainwave-based classification CIT that is viable for field use?
Question 2 summarizes all of the preceding questions. The results of the present study present evidence that the answer to this question is yes: The 20 brain fingerprinting scientific standards provide sufficient conditions for a brainwave-based classification CIT that is viable for field use.
The results of previous research by ourselves and independent replications by others (Farwell and Donchin 1991; Farwell and Smith 2001; Farwell et al. 2013, 2014; Allen and Iacono 1997) support the same hypothesis. Our current working hypothesis is that the 20 brain fingerprinting scientific standards provide sufficient conditions for a brainwave-based classification CIT that is viable for field applications (as specifically defined herein), and that some of these standards are also necessary conditions.
This is the brain fingerprinting scientific standards hypothesis. The present results are consistent with our results in previous field and real-life studies (Farwell and Donchin 1991, Experiment 2; Farwell and Smith 2001; Farwell et al. 2013, 2014) in which we applied the same methods in other field and real-life conditions. Taken together, the present research along with all known past results support the brain fingerprinting scientific standards hypothesis.
Classification CIT versus comparison CIT
The scientific questions addressed by the present research regarding the differences in results produced by the BF classification CIT and the comparison CIT and the relevant data are as follows.
-
II.What are the differences, if any, between the results produced by the BF classification CIT versus the comparison CIT?
- Does the BF classification CIT produce significantly more accurate and valid results and higher statistical confidences than the comparison CIT, when all other variables are held constant? (For definitions see the Supplementary Material on “Definition of Terms and Notes on Terminology”).
In the present study, as in Farwell et al. (2014) and many other previous studies, the error rate produced by the classification CIT was lower than that of the comparison CIT. The classification CIT produced an error rate of 0% (100% accuracy). Also, there were no indeterminates. The comparison CIT produced an error rate of 6%.
This is a very low error rate for the comparison CIT compared to the error rates reported in previous publications, but still more than an order of magnitude higher than the error rate of the BF classification CIT. The reason for the low error rate for the comparison CIT when compared to the results reported by others may be that unlike many other studies, this comparison-CIT study met all of the brain fingerprinting scientific standards except for the ones specifying the classification CIT, standards 13, 14, and 17.
The area between the curves (ABC) provides a criterion-independent metric of the comparative performances of the BF classification CIT and the comparison CIT. The ABC for the BF classification CIT was 0.97, close to the maximum possible of 1. The ABC for the comparison CIT was 0.41 when considering all correct results and 0.22 when considering only correct and valid results. The statistical significance of this difference is discussed below.
The BF classification CIT produced significantly higher bootstrap probabilities, independent of the criteria selected for determinations of information present or information absent. The results across all possible bootstrap probability criteria were significantly higher for the classification CIT than for the comparison CIT (P < 0.001, Wilcoxon matched-pairs signed rank test).
When the a priori criteria for determinations were applied in the present study, the BF classification CIT produced significantly higher statistical confidences than the comparison CIT (P < 0.001, Wilcoxon matched-pairs signed rank test). The median statistical confidence for the BF classification CIT was 99.6%, including 99.9% for information-present determinations and 99.6% for information-absent determinations. The comparison CIT produced median statistical confidences of 62.5% overall, including 99.6% for information-present determinations and 48.7% (less than chance) for information-absent determinations.
The BF-classification-CIT statistical significances for information-absent subjects were also significantly higher than those of the comparison CIT (P < 0.001, Wilcoxon matched-pairs signed rank test). Statistical confidences for information-present subjects were slightly but not significantly higher for the BF classification CIT than for the comparison CIT.
The BF classification CIT produced statistical significances greater than 90% for all subjects, both information present and information absent. The comparison CIT produced statistical confidences of greater than 90% for all information-present subjects, but did not produce statistical confidences over 90% for any of the information-absent subjects.
In our view, determinations should not be made in field conditions with less than a 90% statistical confidence. In fact, all of the determinations we have applied in field situations where lives and freedom were at stake have been made with a statistical confidence of greater than 95%. If we were to require a 90% statistical confidence for information-absent determinations with the comparison CIT, as we did with the BF classification CIT, the comparison CIT would have had a 100% error rate (0% accuracy) for information-absent subjects and a 65% error rate (35% accuracy) overall, considerably less than chance.
Even with a 70% statistical confidence for information-absent determinations—arguably the minimum for scientific purposes even when there are no non-trivial consequences—the comparison CIT would have resulted in an error rate of 82% (18% accuracy) for information-absent subjects and a 53% error rate (47% accuracy) overall, still less than chance.
If we apply the 90%/10% criterion applied in many previous comparison CIT studies, and only require a 10% probability that information-absent determinations are correct, error rate is 6%; accuracy is nominally 94%. However, only 56% of all tests and 33% of tests on information-absent subjects produced correct and valid results, i.e., correct determinations with greater than a computed 50% probability of being correct.
With the 50%/50% criterion, all comparison-CIT determinations are valid, but the error rate is 44% overall and 67% for information-absent subjects.
With both the 90%/10% criterion and the 50%/50% criterion, only 56% of determinations overall and 33% of information-absent determinations are correct and valid for the comparison CIT, as compared with 100% correct and valid determinations with the BF classification CIT.
The BF classification-CIT results are the same as the results obtained in all previous studies in which the brain fingerprinting scientific standards were met (reviews see Farwell 2012, 2014; Farwell et al. 2013). This includes our previous real-life study in which we directly compared the results produced by the BF classification CIT and the comparison CIT (Farwell et al. 2014).
-
2.
Is implementing the BF classification CIT, rather than the comparison CIT (brain fingerprinting scientific standards 13, 14, and 17), a necessary condition for a combination of adequate error rate and adequate statistical confidences to meet the criteria for viable field use?
The data reported here suggest that the answer to this question is yes, with the criteria and terms precisely specified and defined as we have in the Supplementary Material on “Definition of Terms and Notes on Terminology” and in the brain fingerprinting scientific standards (Appendix 1). All previous data in the reviews and research papers cited immediately above also support this same hypothesis.
The reason that implementing the BF classification CIT rather than the comparison CIT is a necessary condition for achieving a viable method for field use is illustrated by the following example.
Figure 10 illustrates the data analysis of subject 18 by the comparison CIT. The comparison CIT compares the amplitude of the probe brain response with the amplitude of the irrelevant brain response. This comparison determined that the probe brain response was larger than the irrelevant brain response. The comparison-CIT analysis ignores the target brain responses. The amplitude of the brain response is defined as the difference between the highest voltage in the P300 window (300–900 ms) and the lowest voltage in the LNP window (900–1500 ms10). This is the peak-to-peak amplitude of the P300-MERMER, equivalent to the sum of the peak amplitudes of the P300 and the LNP, and is sometimes represented as simply the P300 amplitude.
Fig. 10.

Comparison CIT Data Analysis for Subject 18. The comparison CIT compared the amplitude of the probe response with the amplitude of the irrelevant response and determined that the probe response was larger. Target brain responses are not included in the analysis or the plot. Determination: Information Present. Statistical confidence: 99.9%. This determination was an error. Since this is the highest possible statistical confidence, the same erroneous determination would be reached at all possible criteria
The comparison CIT determined that the probe brain response was larger than the irrelevant brain response. The comparison-CIT determination therefore was information present. The statistical confidence was 99.9%. This determination was an error. Ground truth was that the subject was information absent.
The comparison CIT falsely determined that there was a 99.9% probability that the individual tested knew the secret details about a terrorist mass shooting in which many innocent people died, details that were known only to investigators and to the mastermind, handler, and perpetrators who committed the crime.
This error is inherent in the comparison CIT, and is not merely a function of the criterion selected for an information-present determination. Since 99.9% is the highest possible statistical confidence, the same determination would be made at all possible criteria.
Figure 11 illustrates the data analysis of subject 18 by the classification CIT.
Fig. 11.

Classification CIT Data Analysis for Subject 18. The BF classification CIT classified the probe brain response as being more similar to the target brain response than to the irrelevant brain response based on bootstrap correlations. Determination: Information Absent. Statistical confidence: 98.3%. This determination was correct. The same determination would be reached at any criterion less than or equal to 98%
One reason that the BF classification CIT is more accurate than the comparison CIT is that it takes into account more data and also more complex patterns in the data. The BF classification CIT incorporates the following three critical factors that are missing from the comparison-CIT analysis.
The BF classification CIT takes into account the target responses as a template for the brain’s response to known, relevant information. The comparison CIT ignores the target responses.
The BF classification CIT provides a more comprehensive analysis than the comparison CIT. The BF classification CIT classifies the brain responses to probe stimuli as being either more similar to the responses to the (known, relevant) target stimuli or more similar to the responses to the (unknown/irrelevant) irrelevant stimuli. The BF classification CIT computes correlations between the probe responses and the target responses and between the probe responses and the irrelevant responses. The comparison CIT only compares the probe responses with the irrelevant responses, based on a single-number estimate of amplitude.
In classifying brain responses, the BF classification CIT takes into account more data and more complex patterns in the data of the individual and average brain responses. The correlations computed by the BF classification CIT include the entire brainwave response in the epoch of interest (300 to 1500 ms after stimulus onset). Thus the BF classification CIT takes into account the amplitude, latency, morphology, and time course of the brain response. The comparison CIT reduces the entire response to a single number representing the peak-to-post-peak amplitude, and thus loses all additional data that could identify the different patterns of the respective responses to different stimuli.
The result of the more comprehensive and accurate data analysis implemented by the BF classification CIT in this case was that the BF classification CIT returned the correct determination, the opposite of the erroneous determination returned by the comparison CIT. Taking the full brain response into consideration, the BF classification CIT determined that the probe brain response was more similar to the target brain response than to the irrelevant brain response. The correct determination was information absent. The statistical confidence was 98.3%.
The BF classification CIT correctly determined, with a 98.3% statistical confidence, that the subject did not know the details of a terrorist mass shooting in which many died, details known only to investigators and to the terrorists who planned and perpetrated the shooting.
This determination did not depend on applying the a priori 90% criterion for an information-absent determination. The same determination would be made at any criterion less than or equal to 98%.
The difference between a correct determination and an error in this case was extremely consequential, as in many others among the field cases reported here. If authorities had relied on the comparison CIT result, this would have been the worst imaginable human rights violation for the subject. Moreover, it would have had disastrous consequences for national and global security. Identifying an innocent person as the mastermind behind a major terrorist attack would have been a serious setback in the efforts to identify the actual mastermind and bring him to justice and to identify and dismantle the entire terrorist infrastructure.
By contrast, the BF classification CIT provided the correct answer, and by so doing not only preserved human rights for one individual but also contributed to national and global security, to the efforts to bring terrorists to justice, and to the search for truth in a complex and chaotic arena with major consequences to success or failure in that endeavor.
Subject 17 is a similar case, albeit with somewhat less dire potential consequences. The BF classification CIT determined that there was a 99.6% confidence that this subject did not possess inside information known only to investigators and terrorists who planned and orchestrated a suicide bombing with that killed many innocent people. The BF classification CIT preserved human rights and contributed to the investigation of a major terrorist attack.
The comparison CIT reached a correct determination of information absent, but only with a 13.9% statistical confidence. In other words, the comparison CIT computed a 13.9% probability that the subject did not know the incriminating information. Equivalently, the comparison CIT computed an 86.1% probability that this individual had a record stored in his brain of the secret details involved in the planning and coordination of a major suicide bombing, details known only to the surviving terrorists who planned and orchestrated the attack and to investigators. If authorities had in any way considered this comparison-CIT result, it would have at best resulted in serious human rights violations and at worst in the death or imprisonment of an innocent person and a substantial setback in the investigation of the terrorist attack.
Countermeasures
Specific countermeasures
We taught subjects the only known countermeasure that had not yet been proven ineffective against the BF classification CIT, the “try not to think about it” countermeasure (Bergström et al. 2013). Since our subjects were highly motivated, it is reasonable to conclude that they practiced this countermeasure.
The BF classification CIT was highly resistant to this countermeasure, achieving less than 1% error rate (actually, 0%) and greater than 95% median statistical confidences for both information-present and information-absent subjects.
Fundamental shortcomings of the brainwave-based comparison CIT
The comparison CIT has produced more than 10 times higher error rates than the BF classification CIT, and statistical confidences no better than chance (50%) for information-absent subjects. These results did not happen by coincidence or chance. They are entirely predictable from fundamental differences between the scientific protocols and mathematical and statistical computations of the comparison CIT and the BF classification CIT (Farwell 2012, 2013, 2014; Farwell et al. 2013, 2014).
Like the ANS-based comparison CIT, the brainwave-based CIT compares the responses to two types of stimuli. In the brainwave-based comparison CIT these are the responses to relevant and irrelevant stimuli in the form of words or pictures presented briefly on a computer screen. The brainwave-based comparison CIT presents three, or in some cases four, types of stimuli, but only analyzes responses to two types of stimuli: probe (relevant) and irrelevant.
If the response to the probe (or relevant) stimuli is significantly “larger” than the response to the irrelevant stimuli, the subject is determined to possess the relevant information embodied in the probe stimuli, a determination of “information present.” If not, then the subject is determined not to possess the relevant information, a determination of “information absent.” Sometimes “information present” is called “guilty,” and “information absent” is called “innocent,” although “guilty” and “innocent’ are not accurate labels, since what is detected is information and not guilt or innocence.
The comparison CIT has several inherent shortcomings.
A “larger” response can be defined in multiple different ways, none of which fully characterize the response. Psychophysiological responses are complex. Different responses are characterized by differences in latency, time course, and morphology as well as amplitude. Even amplitude can be defined in many different ways. For example, in the case of ERPs, “P300 amplitude” may be the voltage of the most positive point in the P300 time window (P300 peak) compared to baseline, or the difference between the P300 peak and the preceding (negative) N2, or the difference between the P300 peak and the subsequent negative potential (the late negative potential or LNP), or the area under the curve in the P300 time window, or in any one of several other ways. Moreover, sometimes a more pronounced response results in a lower amplitude of a particular metric, such as expansion of the chest in the conventional ANS-based CIT. Both ERP and ANS responses constitute particular patterns that unfold over time, and patterns that are not accurately or fully characterized by a single number such as “amplitude.”
Once a definition for “larger” has been chosen, four questions remain: (a) What is the criterion for a response to be determined to be definitively larger? (b) What is the probability that that determination is correct (i.e., statistical confidence for an information-present determination)? (c) What is the criterion for a response to be determined to be definitively not larger? and (d) what is the probability that that determination is correct (i.e., statistical confidence for an information-absent determination)?
The comparison CIT has addressed these questions regarding information-present determinations adequately, but has failed to address the questions regarding information-absent determinations in a mathematically correct, scientifically valid, and practically viable manner. When statistics are applied, the brainwave-based comparison CIT computes a probability that the subject’s response to the probe stimuli is “larger” (however defined) than his/her response to the irrelevant stimuli. The probability that the probe responses are larger than the irrelevant responses is the statistical confidence for an information-present determination. If this probability is greater than a criterion, usually 90%, then the subject is determined to be “information present” (or “guilty”). This generally results statistical confidences for information-present determinations that are better than chance and sometimes quite high, as they were in the research reported here.
This is not the case, however, for information-absent determinations, due to the following fatal structural and logical flaw in the procedure. The criterion for an information-absent determination is as follows. If the probability that the probe responses are “larger” than the irrelevant responses is less than the criterion for an information-present determination (usually 90%) then the subject is determined to be information absent (or “innocent”). By simple arithmetic, the probability that the probe responses are not larger than the irrelevant responses is 100% minus the probability that the probe responses are larger than the irrelevant responses. The probability that the probe responses are not larger than the irrelevant responses is the statistical confidence for an information-absent determination.
Any subject whose probability of being information-present is less than 90% is determined to be information absent. Mathematically, this means that any subject with as high as 89.9% probability of being information-present is determined to be information-absent. This is equivalent to a probability of 100%−89.9% = 10.1% that the subject is information absent. In summary, subjects are classified as being information-absent with as low as a 10.1% mathematically computed probability that the information-absent determination is correct.
Since an information-absent subject does not differentiate between probe and irrelevant stimuli (because he lacks the knowledge contained in the probes), the probe and irrelevant ERPs are expected to be virtually identical for information-absent subjects. Thus, the expected value11 for any statistic to estimate the probability that the probe responses are larger than the irrelevant responses is 50%. (This is the information-present probability for an information-absent subject.) The expected value for the probability that the probes are not larger than the irrelevants is also 50%. (This is the information-absent probability for an information-absent subject).
Thus, if the true state of the subject is information absent, and the test and the statistics work as designed, the comparison-CIT statistical method is expected to compute a statistical probability of 50% that the subject is information-absent. In other words, the average statistical confidence for a (correct) information-absent determination with the brainwave-based comparison CIT is 50%, no better than chance.
This is not merely a theoretical issue. The average statistical confidence for information-absent determinations in all brainwave-based comparison-CIT studies reported to date has been no better than chance (50%), in accord with the predictions of the statistical model.
The results of the present study are consistent in this regard with the previously reported results by ourselves (Farwell et al. 2014) and all others who have reported their actual results of applying the comparison CIT. Median statistical confidence for information-absent determinations with the comparison CIT was 48.7%. The comparison CIT determined subject 17 to be information absent with a computed statistical probability of 13.1% of being correct, far less than chance.
Moreover, again in accord with the predictions of the statistical model, approximately half of the information-absent determinations made in all comparison CIT studies to date have been invalid. That is, half of the information-absent determinations have a probability of less than 50% of being correct, according to the statistics with which they were computed.
The comparison-CIT results of the present study are consistent in this regard with the previously reported results by ourselves (Farwell et al. 2014) and all others who have reported their actual results. For the comparison CIT, 64% of information-absent results were nominally correct but were invalid, having a computed probability of less than chance (50%) of being correct.
Obviously, it is not statistically or scientifically valid to report a result as follows: “Our data analysis algorithm has determined that the subject is ‘information absent’ (or ‘innocent’). The computed probability that this is the correct determination is 13.1% [or any other probability less than chance (50%)].” Determinations with less than a 50% computed probability of being correct are invalid. Such determinations not only violate the canons of statistics. They also fly in the face of logic and common sense.
Scientific standards contributing to low error rate and high statistical confidence
The classification CIT as opposed to the comparison CIT: standards 13, 14, and 17
As discussed above, the primary feature of the current research methods that resulted in the low error rates and high statistical confidences for the BF classification CIT was our application of the classification CIT as opposed to the comparison CIT (brain fingerprinting scientific standards 13, 14, and 17).
Our results reported here are consistent with previous studies demonstrating that applying the classification CIT, as opposed to the comparison CIT, is a necessary condition for obtaining less than 1% error rate and greater than 95% median statistical confidences (Farwell 2012, 2014; Farwell et al. 2013, 2014), and in fact is a necessary condition for achieving better-than-chance statistical confidences for information-absent determinations.
A comparison with other previous studies on the BF classification CIT, however, reveals that several other features may have contributed to the low error rate and high statistical confidences achieved here for the BF classification CIT.
Analyzing the full positive–negative P300-MERMER rather than the positive P300 alone: standard 15
Our current study (and all others after Farwell and Donchin 1991, e.g., Farwell and Smith 2001; Farwell et al. 2013, 2014) included the full P300-MERMER (or P300 plus LNP) in analysis and achieved 0% indeterminates as well as 0% errors. Farwell and Donchin (1991; see also Murphy et al. 2011) met 18 of the 20 brain fingerprinting scientific standards. However, they included only the P300 (300–900 ms post-stimulus) in their bootstrap correlation computations, and omitted the full P300-MERMER (or P300 plus LNP, 300–1500 ms post-stimulus).
Although Farwell and Donchin (1991) had the same 0% error rate as the present study (and all of our other studies after Farwell and Donchin), they reported 12.5% indeterminates. The criterion-dependent error-prevention buffer achieved by Farwell and Donchin was 15%. The present study achieved a criterion-dependent error-prevention buffer of 81.4%. This indicates that the results of Farwell and Donchin were much closer to producing an error than those of the present study. As discussed above, including the full brain response in the analysis may have contributed to this difference in results.
Although standard 15 contributes to better performance, in light of the adequate results of Farwell and Donchin (1991) standard 15 is not a necessary condition for a method that is viable for field use.
Situation-relevant targets: standard 4
In the present study we used target stimuli that were relevant to the investigated situation. Farwell and Donchin (1991) used targets that were unrelated to the investigated situation and were made relevant only by task instructions to press a particular button when they appeared. Farwell and FBI forensic scientist Drew Richardson (Farwell et al. 2013) originated situation-relevant targets in response to the demands of the real world. They used the BF classification CIT to detect information known only to FBI agents.
In a pilot study that preceded Farwell et al. (2013), we found that for information-present subjects, the brain responses to probes—which were known, inherently relevant, and immediately recognized—had shorter latencies than brain responses to targets—which were previously unknown, not immediately recognized, and inherently irrelevant (having been made relevant only by task instructions). This latency difference resulted in lower correlations between the probe and target waveforms, which in turn resulted in lower statistical confidences in results for information-present subjects. (There were no latency differences for information-absent subjects because they did not recognize the probes).
When we replaced the unknown and inherently meaningless targets with known targets that were relevant to the investigated situation, the target brain response latencies matched the probe brain response latencies, correlations between probe and target brain responses were higher, and statistical confidences for determinations were consequently higher for information-present subjects.
This effect was particularly prominent when the probes were acronyms known to and immediately recognizable by FBI agents and the targets were (unknown and inherently meaningless) random letter strings that were not acronyms (as were the irrelevants). The random-letter-string targets had longer latencies than the acronym probes. When the experimental design was modified so that the targets were also acronyms known to FBI agents, the latencies of the corresponding target brain responses matched those of the probes. This resulted in higher correlations between probe and target brain responses and higher statistical confidences in the resulting determinations.
One of the reasons that the present study, unlike Farwell and Donchin (1991), had no indeterminate outcomes and produced higher statistical confidences and a greater criterion-dependent error-reduction buffer than that previous study may be that we used situation-relevant targets in the current study.
Although standard 4 contributes to better performance, in light of the adequate results of Farwell and Donchin (1991) standard 4 is not a necessary condition for a method that is viable for field use.
Collecting a sufficient number of trials: standard 12
In the present study we collected and analyzed at least 108 probe trials and 108 target trials. Farwell et al. (2014) used as few as 84 probe and target trials. A larger number of trials results in less variability in the bootstrap averages and therefore less variability in the bootstrap correlations, and consequently can be expected to produce higher statistical confidences (until a ceiling effect is reached). Although both studies produced 0% error rates, the present study produced higher statistical confidences that Farwell et al. (2014). The present study produced criterion-independent and criterion-dependent error-reduction buffers of 88.1 and 81.4% respectively. Farwell et al. produced lower criterion-independent and criterion-dependent error-reduction buffers of 73.5 and 64.2% respectively. This suggests that Farwell et al.’s results were closer to producing an error than those of the present study.
The difference in number of trials in the two studies may have contributed to these differences in results.
Although collecting a sufficient number of trials as per standard 12 contributes to better performance, in light of the adequate results of Farwell et al. (2014) standard 12 is not a necessary condition for a method that is viable for field use.
Higher signal-to-noise ratio
In the current study we used a custom wireless headset that automatically detected and counteracted electromagnetic noise in the environment. This resulted in cleaner EEG signals, i.e., a higher signal-to-noise ratio resulting from less electromagnetic noise than has been encountered in previous studies. This may have contributed to our low error rate and high statistical confidences. Our use of optimal digital filters (Farwell et al. 1993) also contributed to a high signal-to-noise ratio and may have contributed to the low error rate and high statistical confidences obtained.
Although these methods contributed to better performance, in light of the adequate results of previous studies they are not necessary conditions for a method that is viable for field use.
Summary
We conducted two field experiments applying event-related brain potentials (ERP) in the detection of concealed information. In Experiment 1 we conducted 18 ERP tests applying the P300 and P300-MERMER to detect concealed information regarding major terrorist crimes and other real-world crimes around the world. In Experiment 2 we conducted 5 ERP tests regarding participation in a classified counterterrorism operation.
This study is a test of the brain fingerprinting scientific standards hypothesis: that a specific set of methods for ERP-based concealed information tests (CIT) known as the brain fingerprinting scientific standards provide the sufficient conditions to produce less than 1% error rate and greater than 95% median statistical confidence for individual determinations of whether the tested information is stored in each subject’s brain. All previous published results in all laboratories are compatible with this hypothesis.
We recorded P300 and P300-MERMER ERP responses to visual text stimuli of three types: targets contain known information, irrelevants contain unknown/irrelevant information, and probes contain the crime-relevant information to be tested, information known only to the perpetrator(s) and investigators. We compared results for the BF classification CIT (wherein the brain fingerprinting scientific standards are met) with the comparison CIT (wherein the scientific standards are not met).
The classification CIT classifies the responses to probe stimuli as being more similar to the responses (known, relevant) targets or to (unknown, irrelevant) irrelevant stimuli. If the bootstrapping statistical algorithm determines with a high statistical confidence that the probes can be classified as being more similar to the targets than to the irrelevants, the determination is “information present”: the subject knows the information. If the bootstrapping statistical algorithm determines with a high statistical confidence that the probes can be classified as being more similar to the irrelevants than to the targets, the determination is “information absent”: the subject does not know the information. If no determination can be made with a high statistical confidence, no determination is made; the outcome is indeterminate.
The comparison CIT compares the responses to the probes and the irrelevants to determine if the probe responses are larger. If there is a high probability that the probe responses are larger than the irrelevant responses, the determination is information present. If not, the determination is information absent.
Results of experiment 1
The BF classification CIT produced 0% error rate. The comparison CIT produced 6% error rate.
As in previous studies, classification-CIT median statistical confidences were near 100%, whereas comparison CIT statistical confidences were no better than chance for information absent (IA) subjects (who did not know the tested information). Over half of the comparison-CIT determinations were invalid due to a less-than-chance probability of being correct.
The BF classification CIT produced an overall median statistical confidence of 99.6%, including a median statistical confidence of 98.6% for information-absent (IA) subjects and 99.9% for information-present (IP) subjects (who know the tested information).
As in all previous studies, countermeasures had no effect on the BF classification CIT.
The comparison CIT produced significantly lower statistical confidences than the classification CIT. The median statistical confidence for all correct determinations with the comparison CIT was 62.5%, somewhat better than chance. The better-than-chance performance was entirely due to the information-present statistical confidences. Median information-absent statistical confidence was slightly less than chance, 48.7%.
We computed classification operating characteristic (COC) curves and area between the curves (ABC) for the classification CIT and the comparison CIT. ABC for the classification CIT was 0.97. ABC for the comparison CIT was 0.41 if valid and invalid determinations are included as “correct” and 0.22 if only correct and valid determinations are included as “correct.”
These differences in results between the classification CIT and the comparison CIT were statistically significant. When the bootstrap probability computation results are considered independent of criteria for information-present and information-absent determinations, classification-CIT results are higher than comparison-CIT results (p < 0.001, Wilcoxon matched-pairs signed-rank test). When subjects are determined as information present or information absent, statistical confidences for correct determinations are higher for the classification CIT than for the comparison CIT (p < 0.001, Wilcoxon matched-pairs signed-rank test).
Results of experiment 2
Experiment 2 applied only the BF classification CIT and comprised only information-present subjects. Error rate was 0%. Median statistical confidence was 96.6%. Countermeasures had no effect on the BF classification CIT.
Our results support the brain fingerprinting scientific standards hypothesis
These results, like all previous published results in our laboratory and all others, support the brain fingerprinting scientific standards hypothesis: that the BF classification CIT provides sufficient conditions for achieving less than 1% error rate and greater than 95% median statistical confidence for individual determinations.
These results indicate that applying the classification CIT (and not the comparison CIT) is a necessary condition for a reliable, accurate, and valid brainwave-based CIT. The comparison CIT produces an order of magnitude higher error rates IA statistical confidences no better than chance.
Supplementary Information
Below is the link to the electronic supplementary material.
Acknowledgements
The US Central Intelligence Agency, contract No. 92-F138600-000, provided funding for developmental work that contributed to this research.
Appendix 1
Brain Fingerprinting Scientific Standards
The following procedures comprise the Scientific Standards for Brain Fingerprinting Science. These standards have been established in the peer-reviewed scientific literature, in four US patents and one UK patent, and in court documents where Brain Fingerprinting and testimony on it by Dr. Lawrence Farwell, the inventor of Brain Fingerprinting, were ruled admissible as scientific evidence in court.
Use equipment and methods for stimulus presentation, data acquisition, and data recording that are within the standards for the field of cognitive psychophysiology and event-related brain potential research. These standards are well documented elsewhere. For example, the standard procedures Farwell introduced as evidence in the Harrington case were accepted by the court, the scientific journals, and the other expert witnesses in the case. Use a recording epoch long enough to include the full P300-MERMER. For pictorial stimuli or realistic word stimuli, use at least a 1800 ms recording epoch. (Shorter epochs may be appropriate for very simple stimuli.) Use correct electrode placement. The P300 and P300-MERMER are universally known to be maximal at the midline parietal scalp site, Pz in the standard International 10–20 system.12
Apply brain fingerprinting tests only when there is sufficient information that is known only to the perpetrator and investigators. If possible, use a minimum of six probes and six targets.
Use stimuli that isolate the critical variable: the subject’s knowledge or lack of knowledge of the probe stimuli as significant in the context of the investigated situation. Obtain the relevant knowledge from the criminal investigator (or for laboratory studies from the knowledge-imparting procedure such as a mock crime and/or subject training session). Probe stimuli constitute information that has not been revealed to the subject.
Divide the relevant knowledge into probe stimuli and target stimuli. Target stimuli contain information that has been revealed to the subject after the crime or investigated situation. If initially there are fewer targets than probes, create more targets. Ideally, this is done by seeking additional known information from the criminal investigators. Note that targets may contain information that has been publicly disclosed. Alternatively, some potential probe stimuli can be used as targets by disclosing to the subject the specific items and their significance in the context of the investigated situation.
For each probe and each target, fabricate several stimuli of the same type that are unrelated to the investigated situation. These become the irrelevant stimuli. Use stimuli that isolate the critical variable. For irrelevant stimuli, select items that would be equally plausible for an information-absent subject. The stimulus ratio is approximately one-sixth probes, one-sixth targets, and two-thirds irrelevants.
Ascertain that the probes contain information that the subject has no known way of knowing, other than participation in the investigated situation. This information is provided by the criminal investigator for field studies, and results from proper information control in laboratory studies.
Make certain that the subject understands the significance of the probes, and ascertain that the probes constitute only information that the subject denies knowing, as follows. Describe the significance of each probe to the subject. Show him the probe and the corresponding irrelevants, without revealing which is the probe. Ask the subject if he knows (for any non-situation-related reason) which stimulus in each group is situation-relevant/crime-relevant. Describe the significance of the probes and targets that will appear in each test block immediately before the block.
If a subject has knowledge of any probes for a reason unrelated to the investigated situation, eliminate these from the stimulus set. This provides the subject with an opportunity to disclose any knowledge of the probes that he may have for any innocent reason previously unknown to the scientist. This will prevent any non-incriminating knowledge from being included in the test.
Ascertain that the subject knows the targets and their significance in the context of the investigated situation. Show him a list of the targets. Describe the significance of each target to the subject.
Require an overt behavioral task that requires the subject to recognize and process every stimulus, specifically including the probe stimuli, and to prove behaviorally that he has done so on every trial. Detect the resulting brain responses. Do not depend on detecting brain responses to assigned tasks that the subject can covertly avoid doing while performing the necessary overt responses.
Instruct the subjects to press one button in response to targets, and another button in response to all other stimuli. Do not instruct the subjects to “lie” or “tell the truth” in response to stimuli. Do not assign different behavioral responses or mental tasks for probe and irrelevant stimuli.
In order to obtain statistically robust results for each individual case, present a sufficient number of trials of each type to obtain adequate signal-to-noise enhancement through signal averaging. Use robust signal-processing and noise-reduction techniques, including appropriate digital filters and artifact-detection algorithms. The number of trials required will vary depending on the complexity of the stimuli, and is generally more for a field case. In their seminal study, Farwell and Donchin (1991) used 144 probe trials. In the Harrington field case, a murder case wherein brain fingerprinting and Farwell’s testimony in it were admitted in court as scientific evidence, Farwell used 288 probe trials (Farwell et al. 2013; Harrington v. State 2001). In any case, use at least 100 probe trials and an equal number of targets. Present three to six unique probes in each block.
Use appropriate mathematical and statistical procedures to analyze the data. Do not classify the responses according to subjective judgments. Use statistical procedures properly and reasonably. At a minimum, do not determine subjects to be in a category where the statistics applied show that the determination is more likely than not to be incorrect, i.e., statistical confidence is less than 50%.
Use a mathematical classification algorithm, such as bootstrapping on correlations, that isolates the critical variable by classifying the responses to the probe stimuli as being either more similar to the target responses or to the irrelevant responses.
In a forensic setting, conduct two analyses: one using only the P300 (to be more certain of meeting the standard of general acceptance in the scientific community), and one using the P300-MERMER (to provide the current state of the art).
Use a mathematical data-analysis algorithm that takes into account the variability across single trials, such as bootstrapping.
Set a specific, reasonable statistical criterion for an information-present determination and a separate, specific, reasonable statistical criterion for an information-absent determination. Classify results that do not meet either criterion as indeterminate. Recognize that an indeterminate outcome is not an error, neither a false positive nor a false negative. Error rate is the percentage of information-present or information-absent determinations that are false positives and false negatives respectively; accuracy is 100% minus the error rate.
Restrict scientific conclusions to a determination as to whether or not a subject has the specific situation-relevant knowledge embodied in the probes stored in his brain. Recognize that brain fingerprinting detects only presence or absence of information – not guilt, honesty, lying, deception, or any action or non-action. Do not offer scientific opinions on whether the subject is lying or whether he committed a crime or other act. Recognize that the question of guilt or innocence is a legal determination to be made by a judge and jury, not a scientific determination to be made by a scientist or a computer.
Evaluate error rate/accuracy based on actual ground truth. Ground truth is the true state of what a scientific test seeks to detect. Brain fingerprinting is a method to detect information stored in a subject’s brain. Ground truth is whether the specific information tested is in fact stored in the subject’s brain. Establish ground truth with certainty through post-test interviews in laboratory experiments and in field experiments wherein subjects are cooperative. Establish ground truth insofar as possible through secondary means in real-life forensic applications with uncooperative subjects. Recognize that ground truth is the true state of what the subject in fact knows, not what the experimenter thinks the subject should know, not what the subject has done or not done, and not whether the subject is guilty, or deceptive.
Make scientific determinations based on brain responses. Do not attempt to make scientific determinations based on overt behavior that can be manipulated, such as reaction time.
Authors’ contributions
All authors contributed to the study conception and design. Material preparation and analysis were performed by all authors. Data collection was performed by Lawrence Farwell. The first draft of the manuscript was written by Lawrence Farwell and all authors commented on previous versions of the manuscript. All authors read and approved the final manuscript.
Data availability
Data and relevant material are available from the authors.
Declarations
Conflicts of interest
Author Farwell has received compensation for related work from Harvard University, the US Central Intelligence Agency, the US Federal Bureau of Investigation, multiple intelligence, counterterrorism, and law enforcement agencies in other countries, the University of Illinois, Brain Fingerprinting Laboratories, Inc., Brain Fingerprinting, LLC, and the Wisconsin Innocence Project. He is a principal in Brain Fingerprinting Laboratories, Inc. and Brain Fingerprinting, LLC. He is the inventor of three related US patents and one related UK patent. He is the author of two books containing related information.
Consent to participate
Experimental procedures were approved by the Brain Fingerprinting Laboratories, Inc. ethics committee and performed in accordance with the ethical standards of the 1964 Declaration of Helsinki, including subjects’ written informed consent prior to participation.
Ethics Approval
Experimental procedures were approved by the Brain Fingerprinting Laboratories, Inc. ethics committee and performed in accordance with the ethical standards of the 1964 Declaration of Helsinki, including subjects’ written informed consent prior to participation.
Footnotes
Some discussions of Allen and Iacono (1997) and Farwell and Donchin (1991) have erroneously misclassified indeterminates as errors, and consequently have failed to accurately represent the fact that both of these studies resulted in no false positives and no false negatives—0% error rate/100% accuracy for the BF classification CIT.
“Substantially” is precisely and numerically defined in the Supplementary Material on “Definition of Terms and Notes on Terminology.”.
To date, studies that meet the brain fingerprinting standards have produced 0% error rate. We characterize this as “less than 1%” to provide a conservative estimate and to avoid the mathematical anomalies of 0%.
In some studies the term “guilty” is used to mean “information present” and “innocent” is used to mean “information absent.” Since the brainwave-based CIT detects information, not guilt or innocence, we prefer the terms “information present” and “information absent.”
Rosenfeld and colleagues apparently conducted two studies on the “try not to think about it” countermeasure that might have contributed to the available data on that subject if they had reported their actual data with respect to detection of concealed information. According to their discussions, one study found an effect of that countermeasure on their technique and the other did not. However, since they computed but did not report statistical confidences and error rates it is impossible to determine whether their data confirm the finding by others that their method is susceptible to this countermeasure.
Here we use “greater than” and “less than” in every case to describe the relationship between the bootstrap probability and the criteria for determinations. To be more precise, by convention, in both the classification CIT and the comparison CIT, if the bootstrap probability is greater than or equal to the information-present criterion, the subject is determined as information-present. For the comparison CIT, all subjects not determined as information present are determined as information absent. For the classification CIT, if the bootstrap information-absent probability is greater than or equal to the information-absent criterion, the subject is determined to be information absent.
Note that the difference between probabilities is no longer a probability. The error-prevention buffers are non-linear metrics suitable for ordinal comparisons only.
Some totals do not add up to exactly 100% due to rounding error.
To date, studies that meet the brain fingerprinting standards have produced 0% error rate. We characterize this as “less than 1%” to provide a conservative estimate and to avoid the mathematical anomalies of 0%.
Some researchers include the entire epoch after 900 ms for the purpose of locating the negative peak. With that method, the difference between the amplitude of the probe response and the amplitude of the irrelevant response would have been even larger. The statistical result would have been the same, as the statistical confidence was already 99.9%.
We use “expected value” in the strict statistical definition of the term.
To facilitate statistical analysis, we have re-numbered the Brain Fingerprinting Scientific Standards, while retaining the original wording of previous publications. Standards 1 and 2 have been combined, 3 – 14 become 2 – 13, 15a becomes 14, and 15b becomes 15. Part (b) of former Standard 4 is moved to new Standard 4 (former Standard 5). 16 – 20 remain the same.
Publisher's Note
Springer Nature remains neutral with regard to jurisdictional claims in published maps and institutional affiliations.
References
- Allen J, Iacono WG. A comparison of methods for the analysis of event-related potentials in deception detection. Psychophysiology. 1997;34:234–240. doi: 10.1111/j.1469-8986.1997.tb02137.x. [DOI] [PubMed] [Google Scholar]
- Bergström ZM, Anderson MC, Buda M, Simon JS, Richardson-Klavehn A. Intentional retrieval suppression can conceal guilty knowledge in ER memory detection tests. Biol Psychol. 2013;94(2013):1–11. doi: 10.1016/j.biopsycho.2013.04.012. [DOI] [PMC free article] [PubMed] [Google Scholar]
- Efron B. Bootstrap methods: another look at the jackknife. Ann Stat. 1979;7:1–26. doi: 10.1214/aos/1176344552. [DOI] [Google Scholar]
- Farwell LA. Brain fingerprinting: corrections to Rosenfeld. Sci Rev Mental Health Pract. 2011;8(2):56–68. [Google Scholar]
- Farwell LA. Brain fingerprinting: a comprehensive tutorial review of detection of concealed information with event-related brain potentials. Cogn Neurodyn. 2012;6:115–154. doi: 10.1007/s11571-012-9192-2. [DOI] [PMC free article] [PubMed] [Google Scholar]
- Farwell LA. Lie detection. In: Saukko P, editor. Encyclopedia of forensic sciences. 2. Elsevier; 2013. [Google Scholar]
- Farwell L. Brain fingerprinting: detection of concealed information. In: Jamieson A, Moenssens AA, editors. Wiley encyclopedia of forensic science. Chichester: John Wiley; 2014. [Google Scholar]
- Farwell LA, Donchin E. The ‘‘brain detector’’: P300 in the detection of deception. Psychophysiology. 1986;23(4):434. [Google Scholar]
- Farwell LA, Donchin E. Event-related brain potentials in interrogative polygraphy: analysis using bootstrapping. Psychophysiology. 1988;25(4):445. doi: 10.1111/j.1469-8986.1991.tb01990.x. [DOI] [PubMed] [Google Scholar]
- Farwell LA, Donchin E. Talking off the top of your head: toward a mental prosthesis utilizing event-related brain potentials. Electroencephalogr Clin Neurophysiol. 1988;70:510–523. doi: 10.1016/0013-4694(88)90149-6. [DOI] [PubMed] [Google Scholar]
- Farwell LA, Donchin E. The truth will out: interrogative polygraphy (‘‘lie detection’’) with event-related potentials. Psychophysiology. 1991;28(5):531–547. doi: 10.1111/j.1469-8986.1991.tb01990.x. [DOI] [PubMed] [Google Scholar]
- Farwell LA, Farwell GW. Quantum-mechanical processes and consciousness. Bull Am Phys Soc. 1995;40(2):956–957. [Google Scholar]
- Farwell LA, Richardson DC. Brain fingerprinting: let's focus on the science a reply to Meijer Ben-Shakhar, Verschuere, and Donchin. Cogn Neurodynamics. 2013;7(2):159–166. doi: 10.1007/s11571-012-9238-5. [DOI] [PMC free article] [PubMed] [Google Scholar]
- Farwell LA, Smith SS. Using brain MERMER testing to detect concealed knowledge despite efforts to conceal. J Forensic Sci. 2001;46(1):135–143. doi: 10.1520/JFS14925J. [DOI] [PubMed] [Google Scholar]
- Farwell LA, Martinerie JM, Bashore TR, Rapp PE, Goddard PH. Optimal digital filters for long-latency components of the event-related brain potential. Psychophysiology. 1993;30(3):306–315. doi: 10.1111/j.1469-8986.1993.tb03357.x. [DOI] [PubMed] [Google Scholar]
- Farwell LA, Richardson DC, Richardson GM. Brain fingerprinting field studies comparing P300-MERMER and P300 brainwave responses in the detection of concealed information. Cogn Neurodynamics. 2013 doi: 10.1007/s11571-012-9230-0. [DOI] [PMC free article] [PubMed] [Google Scholar]
- Farwell LA, Richardson DC, Richardson GM, Furedy JJ. Brain fingerprinting classification concealed information test detects US Navy military medical information with P300. Front Neurosci. 2014;8:410. doi: 10.3389/fnins.2014.00410. [DOI] [PMC free article] [PubMed] [Google Scholar]
- Farwell LA, Makeig TH (2005) Farwell brain fingerprinting in the case of Harrington v. State. Open Court X [10] 3:7–10 Indiana State Bar Assoc. Available at: https://farwellbrainfingerprinting.com/wp-content/uploads/2022/01/OpenCourtFarwellMakeig-dr-larry-farwell-brain-fingerprinting-dr-lawrence-farwell.pdf
- Farwell LA (1992) The brain-wave information detection (BID) system: a new paradigm for psychophysiological detection of information. Doctoral Dissertation. University of Illinois, Urbana-Champaign, pp 1–165
- Farwell LA (1994) Method and apparatus for multifaceted electro- encephalographic response analysis (MERA). US Patent #5,363,858
- Farwell LA (1995a) Method and apparatus for truth detection. US Patent #5,406,956
- Farwell LA (1995b) Method for electroencephalographic information detection. US Patent #5,467,777
- Farwell LA (2007) Apparatus for a classification guilty knowledge test and integrated system for detection of deception and information. UK Patent # GB2421329
- Farwell LA (2010) Method and apparatus for brain fingerprinting, measurement, assessment and analysis of brain function. US Patent # 7,689,272
- Farwell LA (2011b) Brain fingerprinting: comprehensive corrections to Rosenfeld in scientific review of mental health practice seattle: excalibur scientific press
- Harrington v. State (2001) Case No. PCCV 073247(Iowa District Court for Pottawattamie County, 5 March 2001)
- Lu Y, Rosenfeld JP, Deng X, Zhang E, Zheng H, Yan G, Dan Ouyang D, Hayat SZ. Inferior detection of information from collaborative versus individual crimes based on a P300 concealed information test. Psychophysiology. 2017;55(4):e13021. doi: 10.1111/psyp.13021. [DOI] [PubMed] [Google Scholar]
- Meijer EH, Smulders FTY, Merckelbach HLGJ, Wolf AG. The P300 is sensitive to face recognition. Int J Psychophysiol. 2007;66(3):231–237. doi: 10.1016/j.ijpsycho.2007.08.001. [DOI] [PubMed] [Google Scholar]
- Meijer EH, Selle NK, Elber L, Gershon B-S. Memory detection with the concealed information test: a meta analysis of skin conductance, respiration, heart rate, and P300 data. Psychophysiology. 2014 doi: 10.1111/psyp.12239. [DOI] [PubMed] [Google Scholar]
- Meixner JB, Rosenfeld JP. Detecting knowledge of incidentally acquired, real-world memories using a p300-based concealed-information test. Psychol Sci. 2014 doi: 10.1177/0956797614547278. [DOI] [PubMed] [Google Scholar]
- Meixner JB, Haynes A, Winograd MR, Brown J, Rosenfeld PJ. Assigned versus random, countermeasure-like responses in the p300 based complex trial protocol for detection of deception: task demand effects. Appl Psychophysiol Biofeedback. 2009;34(3):209–220. doi: 10.1007/s10484-009-9091-4. [DOI] [PubMed] [Google Scholar]
- Mertens R, Allen JJB. The role of psychophysiology in forensic assessments: deception detection, ERPs, and virtual reality mock crime scenarios. Psychophysiology. 2008;45(2):286–298. doi: 10.1111/j.1469-8986.2007.00615.x. [DOI] [PubMed] [Google Scholar]
- Miller G. For distinguished contributions to psychophysiology: William G Iacono. Psychophysiology. 2010;47(4):603–614. doi: 10.1111/j.1469-8986.2010.00975.x. [DOI] [PubMed] [Google Scholar]
- Murphy PR, Robertson IH, Balsters JH, O’Connell RG. Pupillometry and P3 index the locus coeruleus-noradrenergic arousal function in humans. Psychophysiology. 2011;48:1531–1542. doi: 10.1111/j.1469-8986.2011.01226.x. [DOI] [PubMed] [Google Scholar]
- Neshige R, Kuroda Y, Kakigi R, Fujiyama F, Matoba R, Yarita M, Luders H, Shibasaki H. Event-related brain potentials as indicators of visual recognition and detection of criminals by their use. Forensic Sci Int. 1991;51(1):95–103. doi: 10.1016/0379-0738(91)90209-2. [DOI] [PubMed] [Google Scholar]
- Rapp PE, Albano AM, Schmah TI, Farwell LA. Filtered noise can mimic low dimensional chaotic attractors. Phys Rev E. 1993;47(4):2289–2297. doi: 10.1103/PhysRevE.47.2289. [DOI] [PubMed] [Google Scholar]
- Roberts A. Everything old is new again: brain fingerprinting and evidentiary analogy. Yale J Law Technol. 2007;9:234. [Google Scholar]
- Rosenfeld JP, Nasman VT, Whalen R, Cantwell B, Mazzeri L. Late vertex positivity in event-related potentials as a guilty knowledge indicator: a new method of lie detection. Int J Neurosci. 1987;34:125–129. doi: 10.3109/00207458708985947. [DOI] [PubMed] [Google Scholar]
- Rosenfeld JP, Soskins M, Bosh G, Ryan A. Simple effective countermeasures to P300-based tests of detection of concealed information. Psychophysiology. 2004;41(2):205–219. doi: 10.1111/j.1469-8986.2004.00158.x. [DOI] [PubMed] [Google Scholar]
- Rosenfeld JP, Shue E, Singer E. Single versus multiple probe blocks of P300-based concealed information tests for autobiographical versus incidentally learned information. Biol Psychol. 2007;74:396–404. doi: 10.1016/j.biopsycho.2006.10.002. [DOI] [PubMed] [Google Scholar]
- Rosenfeld JP, Labkovsky E, Lui MA, Winograd M, Vandenboom C, Chedid K. The complex trial protocol (CTP): a new, countermeasure-resistant, accurate P300-based method for detection of concealed information. Psychophysiology. 2008;45:906–919. doi: 10.1111/j.1469-8986.2008.00708.x. [DOI] [PubMed] [Google Scholar]
- Rosenfeld JP, Sitar E, Wasserman J, Ward A. Moderate financial incentive does not appear to influence the P300 concealed information test (CIT) effect in the complex trial protocol (CTP) version of the CIT in a forensic scenario, while affecting P300 peak latencies and behavior. Int J Psychophysiol. 2018;125:42–49. doi: 10.1016/j.ijpsycho.2018.02.006. [DOI] [PubMed] [Google Scholar]
- Sasaki M, Hira H, Matsuda, T (2002) Effects of a mental countermeasure on the physiological detection of deception using P3. Stud Humanit Sci 42:73–84 [DOI] [PubMed]
- Verschuere B, Rosenfeld JP, Winograd M, Labkovksy E, Wiersema JR. The role of deception in P300 memory detection. Leg Criminol Psychol. 2009;14(2):253–262. doi: 10.1348/135532508X384184. [DOI] [Google Scholar]
- Wasserman S, Bockenholt U (1989) Bootstrapping: applications to psychophysiology. Psychophysiology 26:208–221 [DOI] [PubMed]
Associated Data
This section collects any data citations, data availability statements, or supplementary materials included in this article.
Supplementary Materials
Data Availability Statement
Data and relevant material are available from the authors.