

Abstract
Introduction
Research on maternal prepregnancy weight suggests adiposity is associated with dysfunctional labor, but knowledge about how gestational weight gain (GWG) affects labor is sparse. Our objective was to evaluate associations between GWG adequacy and intrapartum obstetric interventions (oxytocin administration; cesarean section) necessitated by labor dysfunction.
Material and methods
Using national, population‐based French National Perinatal Survey 2016 data, we included term cephalic singleton pregnancies involving trial of labor (n = 9724). For the intrapartum oxytocin administration analysis, we included only women with spontaneous labor (n = 7352). GWG was calculated as the difference between end of pregnancy and prepregnancy weight (both self‐reported) and categorized as insufficient, adequate (reference group), or excessive by prepregnancy body mass index (BMI; underweight <18.5, normal weight 18.5–24.9, overweight 25–29.9, obese ≥30 kg/m2) using the 2009 Institute of Medicine thresholds. Multilevel generalized estimating equation logistic regression models, unadjusted and adjusted for a priori confounders, evaluated intervention‐GWG adequacy associations within BMI categories (under/normal weight combined), stratified by parity (primiparas; multiparas).
Results
GWG adequacy was associated with oxytocin use among under/normal weight women (primiparas: insufficient 57.3%, adequate 60.8%, excessive 65.0%, p = 0.014; multiparas: insufficient 27.2%, adequate 29.1%, excessive 36.2%, p < 0.001) and overweight primiparas (insufficient 56.0%, adequate 58.7%, excessive 72.5%, p = 0.002). In unadjusted and adjusted models, trends of increased odds of oxytocin administration among women with excessive GWG were found regardless of parity and prepregnancy BMI. Similarly, among under/normal weight women, GWG adequacy was associated with intrapartum cesarean section (primiparas: insufficient 10.7%, adequate 12.7%, excessive 15.3%, p = 0.014; multiparas: insufficient 3.1%, adequate 3.5%, excessive 6.3%, p < 0.001) with increased cesarean section among multiparas with excessive GWG persisting in adjusted models (adjusted odds ratio 1.9, 95% confidence interval 1.3–2.7). However, intrapartum cesarean section was reduced among multiparas with overweight and obese prepregnancy BMI and excessive GWG.
Conclusions
Excessive GWG was associated with intrapartum oxytocin administration, regardless of parity or prepregnancy BMI, and cesarean section among women with under/normal weight prepregnancy BMI, providing evidence for benefits of healthy GWG for normal labor progression. Additional research is needed to verify our findings and understand differences by BMI.
Keywords: body mass index, gestational weight gain, Institute of Medicine guidelines, obstetric interventions, pregnancy, weight gain
Gestational weight gain is potentially associated with labor dysfunction. Among French women with term singleton live births, we found excessive gestational weight gain was associated with intrapartum oxytocin use (overall) and cesarean section (among women with lower BMI).

Abbreviations
- aOR
adjusted odds ratio
- BMI
body mass index
- CI
confidence interval
- CS
cesarean section
- GA
gestational age
- GWG
gestational weight gain
- IOM
Institute of Medicine
- NPS
French National Perinatal Survey
- OR
odds ratio
Key message.
Gestational weight gain is potentially associated with labor dysfunction. Excessive gestational weight gain was associated with intrapartum oxytocin use (overall) and cesarean section (among women with lower body mass index). Healthy gestational weight gain should be encouraged as it might reduce intrapartum interventions.
1. INTRODUCTION
Worldwide, the obstetric population is increasing in body mass index (BMI) 1 and gestational weight gain (GWG), 2 , 3 posing numerous risks to mothers (for example, gestational diabetes and pre‐eclampsia) and fetuses (for example, macrosomia and preterm delivery). 4 Further, increased maternal prepregnancy weight/adiposity/BMI may be associated with intrapartum obstetric interventions related to dysfunctional labor (for example, cesarean section [CS] or oxytocin administration) through increased adiposity causing uterine contraction impairment resulting in prolonged labor, 5 a blunting of the effects of oxytocin, 6 or hormonal factors (excess adipose tissue producing elevated levels of estrogen). 6 , 7
Although these mechanisms could reasonably be extended to excess GWG as well, few studies have explored the association between GWG and intrapartum interventions due to dysfunctional labor. In particular, no studies have investigated the association between GWG and intrapartum oxytocin administration. Previous studies have found evidence that excessive/high GWG may be associated with dystocia, 8 shoulder dystocia, 9 CS due to dystocia, 10 or dysfunctional labor, 11 and emergency/intrapartum/non‐elective CS, 9 , 12 , 13 , 14 , 15 , 16 , 17 , 18 but the applicability of these studies to contemporary French or European obstetric populations is limited. Specifically, many of these studies were conducted in Asian 8 , 10 , 11 or other non‐European 9 , 13 , 14 , 15 , 19 populations. Although other studies of the association between GWG and intrapartum CS were conducted in European populations, important differences, such as GWG adequacy not based on the 2009 Institute of Medicine (IOM) recommendations, 16 older cohorts before (fully or partially) the IOM recommendations, 16 , 17 , 18 or non‐general obstetric populations used (two previous CS attempting trial of labor, 15 obese prepregnancy BMI 19 ) and a different research focus (risks of gestational weight loss), 12 limits their direct applicability to current French or European obstetric populations.
Both BMI and GWG are modifiable risk factors for intrapartum obstetric interventions, with improving GWG a particularly relevant, but understudied, target for prenatal intervention. Therefore, the objective of this study was to evaluate the association between GWG adequacy and intrapartum obstetric interventions necessitated by labor dysfunction in women with term singleton pregnancies undergoing trial of labor within a large, prospective population‐based French cohort.
2. MATERIAL AND METHODS
2.1. Study population
We used data from the 2016 French National Perinatal Survey (NPS), 2 a routine, nationally representative study including all live and stillbirths in all maternity units in metropolitan, mainland France (n = 493 hospitals) during 1 week. Trained study personnel, generally midwives, performed data collection. Face‐to‐face interviews with women 2–3 days after birth were conducted using a standardized questionnaire to collect sociodemographic characteristics and antenatal care information and chart abstraction was performed to collect information related to maternal and neonatal health and delivery.
A total of 13 147 women were included in the 2016 NPS (Figure 1). We excluded women with non‐singleton births (n = 249), pregnancy terminations (n = 52), and stillbirths (n = 73), as these women may have distinct GWG patterns. Additionally, we excluded preterm births (<37+0 weeks' gestational age [GA] or missing GA at birth; n = 1175) and pregnancies with prelabor CS (or missing onset of labor; n = 921) or non‐cephalic presentation (n = 152), as our research interest was intrapartum obstetric interventions in term pregnancies. We also excluded women with missing (n = 750) or implausible (n = 1; gain >50 kg or loss >30 kg) GWG, missing prepregnancy BMI (n = 49), or missing outcome data (n = 1). As a result, 9724 women were included in the present study.
FIGURE 1.
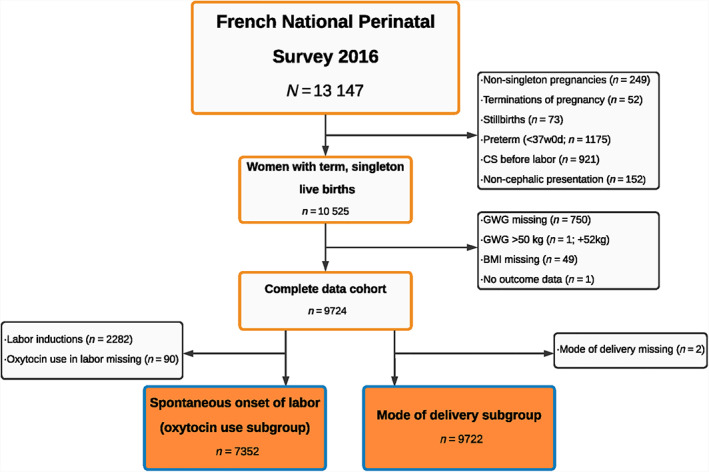
Participant flowchart. BMI, body mass index; CS, cesarean section; GWG, gestational weight gain.
2.2. Study variables
Observed GWG was calculated as a woman's end of pregnancy weight minus her prepregnancy weight (both self‐reported). The main exposure of interest was GWG adequacy (insufficient, adequate, excessive) based on the 2009 IOM guidelines, which provide specific guidelines based on maternal prepregnancy BMI (underweight, normal weight, overweight, obese). 3 We used a previously described method to account for the inherent correlation between GA at birth and GWG, as detailed in Box 1. 20 Briefly, the IOM recommendations for total GWG at 40 weeks were converted to ranges of proportions for each BMI category by determining expected GWG at 40 weeks (based on the assumptions underlying the IOM recommendations) and then dividing IOM recommended ranges by the IOM expected GWG. Women's individual proportions of recommended GWG achieved were calculated as observed GWG/expected GWG, and GWG adequacy for each woman was classified as insufficient (below lower bound), adequate (within recommended range), or excessive (above upper bound of the converted IOM ranges of proportions) GWG.
BOX 1. Determination of gestational weight gain adequacy based on the 2009 Institute of Medicine guidelines and assumptions using a method described previously to account for gestational age at birth 20 .
| Prepregnancy BMI | Recommendations for GWG 3 | Conversion to recommended ranges based on proportions | ||||
|---|---|---|---|---|---|---|
| Category | BMI (kg/m2) | Total first‐trimester (<13 weeks; kg) | Rate of second‐ and third‐trimester GWG (kg/week) | Total at 40 weeks (kg) | Expected GWG (40 weeks) | Range of proportion of GWG |
| Underweight | <18.5 | 2.0 | 0.51 | 12.5–18.0 | 15.77 | 0.79–1.14 |
| Normal weight | 18.5–24.9 | 2.0 | 0.42 | 11.5–16.0 | 13.34 | 0.86–1.20 |
| Overweight | 25–29.9 | 1.0 | 0.28 | 7.0–11.5 | 8.56 | 0.81–1.34 |
| Obese | ≥30 | 0.5 | 0.22 | 5.0–9.0 | 6.44 | 0.78–1.41 |
Abbreviations: BMI, body mass index; GWG, gestational weight gain; IOM, Institute of Medicine.
- Conversion of IOM recommendations to ranges of proportions for each BMI category
-
Calculation of Expected gestational weight gain (GWG) at 40 weeks based on IOM recommendationsExpected GWG = Total first‐trimester GWG (kg) + ([gestational age [GA] at birth – 13 weeks] * Rate of second‐ and third‐trimester GWG).Example for overweight BMI: Expected GWG at 40 weeks = (1 + [40–13]*0.28) = 8.56 kg.
-
-
b
Ranges of proportions of GWG calculated from recommended ranges of total GWG at 40 weeks: lower and upper bounds of recommended range divided by expected GWG at 40 weeks
Example for underweight BMI: (12.5/15.77; 18/15.77) = 0.79–1.14.
-
2Women's GWG compared with ranges of proportions
- Observed GWG (kg) calculated as: self‐reported end of pregnancy minus prepregnancy weight
-
b
Individual expected GWG based on gestational age at delivery (kg) calculated using the formula from step 1a
Example for a woman with normal weight BMI and GA at birth 35 weeks:
Individual Expected GWG = (2 + [35–13]*0.42) = 11.24 kg.
-
c
Women's individual proportion of recommended GWG achieved calculated as: observed GWG/expected GWG
Example for woman with normal weight BMI and GA at birth 35 weeks with GWG 12.5 kg (continued from 2b):
Individual proportion of recommended GWG achieved = 12.5 kg/11.24 kg = 1.11.
-
dGWG adequacy determined by comparing women's individual proportion of recommended GWG achieved with the recommended ranges of proportions for her BMI category
- Insufficient GWG: less than lower limit
- Adequate GWG: within recommended range of proportions
- Excessive GWG: more than upper limit
Example for woman with normal weight BMI and GA at birth 35 weeks with GWG 12.5 kg (continued from 2b and 2c): given that the individual proportion of recommended GWG achieved was 1.11 and range of proportion of GWG was 0.86–1.20, GWG was considered adequate.
In line with the IOM recommendations, which provide distinct thresholds depending on prepregnancy BMI, GWG adequacy is reported and analyzed by BMI category. Maternal prepregnancy BMI (kg/m2) was determined by self‐reported height and self‐reported prepregnancy weight and classified as: underweight less than 18.5, normal weight 18.5–24.9, overweight 25–29.9, or obese 30 kg/m2 or more. For analysis, women with underweight and normal weight BMI were combined because of the small number of underweight women.
French guidelines (2007 French National Nutrition and Health Program [Programme National Nutrition et Santé]) recommend that women with normal prepregnancy BMI gain 12 kg, and higher GWG for women with underweight prepregnancy BMI but lower GWG (not under 7 kg) for women with overweight or obese prepregnancy BMI. 21 Though generally similar to the IOM guidelines, the French guidelines lack clear ranges of appropriate GWG to define GWG adequacy and furthermore the IOM guidelines are routinely used in clinical practice and research internationally and are better known to French clinicians. 15 , 17 , 22 , 23 Hence, we used the IOM guidelines in our analysis.
Our main outcomes, collected by chart abstraction, are oxytocin administration during labor (yes, no) and CS. We excluded women with prelabor CS from all analyses (Figure 1) and for the analysis of oxytocin administration, only included women with spontaneous onset of labor (n = 7352), excluding induction of labor.
Maternal characteristics, collected by interview, reported are: parity (primiparous, multiparous), age (<25, 25–34, ≥35 years), country/region of birth (France, not France [includes Europe, northern Africa, sub‐Saharan Africa, other]), education (less than high school or high school completed; any post‐high school graduation education), and for multiparas, previous mode of delivery (vaginal delivery only, vaginal delivery and CS, CS only). Pregnancy complications and delivery characteristics, obtained from chart abstraction, included gestational diabetes (yes, no) and hypertension during pregnancy (blood pressure: systolic >140 mm Hg or diastolic >90 mm Hg; yes [with or without proteinuria], no), birthweight (grams; ≤2499, 2500–2999, 3000–3499, 3500–3999, ≥4000), and GA at birth (continuously [days] and categorically: early term [37–38 weeks], full term [39–40 weeks], late term [41+ weeks]).
2.3. Statistical analyses
Overall maternal prepregnancy BMI, GWG, and intrapartum intervention use were determined. Maternal characteristics, pregnancy complications, and delivery characteristics were compared by GWG adequacy, for all eligible women and within the spontaneous onset of labor (oxytocin analysis) subgroup. Percentages of women receiving oxytocin or CS within maternal prepregnancy BMI categories were compared by GWG adequacy. For these descriptive/crude analyses, categorical variables were assessed using the chi‐squared test and continuous variables using analysis of variance (normally distributed) or the Kruskal–Wallis test (non‐normally distributed).
Then, multilevel generalized estimating equation logistic regression models, accounting for hospital clustering, were used to calculate unadjusted and adjusted odds ratios (OR and aOR) and 95% confidence intervals (CIs) for the association between GWG adequacy and oxytocin administration and CS. Confounders chosen a priori based on literature review and constructed directed acyclic graphs (not shown) included in adjusted models were: maternal country/region of birth, age, education, prepregnancy BMI (to account for potential residual confounding within BMI categories), GA at birth (days), and birthweight (g; continuous variables). Adjusted ORs and 95% CIs for these covariates are also reported for insight into potential relationships underlying associations.
To verify that combining women with underweight and normal weight prepregnancy BMI did not impact our results, we performed sensitivity analyses to compare the GWG and BMI of these two groups and to repeat the analyses of the association between GWG adequacy and oxytocin administration and CS with women with underweight prepregnancy BMI excluded.
Due to differences in GWG and prepregnancy BMI by parity and potential differences in labor progression and management, 24 , 25 all analyses were stratified by parity. SAS software version 9.4 for Windows (SAS Institute Inc.) was used for statistical analyses.
2.4. Ethics statement
The 2016 NPS was performed in accordance with the Declaration of Helsinki and with all relevant national and institutional guidelines and regulations. The 2016 NPS was approved by the National Council on Statistical Information (Comité du Label; approval number 2016X703SA), the French Commission on Information Technology and Liberties ([CNIL]; registration number 915197; CNIL 2016‐004, approved January 14, 2016), and the Inserm ethics committee (approval IRB00003888 no. 14‐191, approved December 9, 2014). Participants provided verbal consent for survey participation before being interviewed, as approved by the Inserm ethics committee.
3. RESULTS
3.1. Population characteristics
Overall, 8.4% of primiparas were underweight, 64.7% were normal weight, 17.8% were overweight, and 9.1% were obese. For multiparas, 6.8% were underweight, 59.3% were normal weight, 21.2% were overweight, and 12.7% were obese by their prepregnancy BMI. Among primiparas, 25.9% had insufficient, 36.4% had adequate, and 37.7% had excessive GWG, while among multiparas, 29.7% had insufficient, 37.2% had adequate, and 33.1% had excessive GWG.
Among both primiparas (Table 1) and multiparas (Table 2), differences by GWG adequacy were noted for most maternal, pregnancy, and delivery characteristics (p < 0.05). Results were generally similar within the oxytocin subgroups of primiparas (Table S1) and multiparas (Table S2).
TABLE 1.
Maternal and pregnancy and delivery characteristics by GWG adequacy among primiparous women.
|
Insufficient GWG a n = 1094 |
Adequate GWG a n = 1542 |
Excessive GWG a n = 1595 |
p value b | ||||
|---|---|---|---|---|---|---|---|
| n | (%) | n | (%) | n | (%) | ||
| Maternal characteristics | |||||||
| BMI c | |||||||
| Underweight + normal weight | 884 | 80.8 | 1287 | 83.5 | 920 | 57.7 | <0.001 |
| Overweight | 113 | 10.3 | 179 | 11.6 | 462 | 29.0 | |
| Obese | 97 | 8.9 | 76 | 4.9 | 213 | 13.4 | |
| Age | |||||||
| <25 years | 236 | 21.6 | 298 | 19.3 | 380 | 23.8 | 0.011 |
| 25–34 years | 719 | 65.7 | 1059 | 68.7 | 1055 | 66.1 | |
| ≥35 years | 139 | 12.7 | 185 | 12.0 | 160 | 10.0 | |
| Country or region of birth | |||||||
| France | 904 | 82.7 | 1307 | 84.8 | 1372 | 86.0 | 0.064 |
| Not France | 189 | 17.3 | 235 | 15.2 | 223 | 14.0 | |
| Education | |||||||
| Less than high school/high school | 391 | 36.1 | 526 | 34.4 | 719 | 45.4 | <0.001 |
| Any post‐high school graduation | 693 | 63.9 | 1003 | 65.6 | 864 | 54.6 | |
| Pregnancy and delivery characteristics | |||||||
| Hypertension during pregnancy d | |||||||
| No | 1062 | 97.3 | 1480 | 96.5 | 1464 | 92.2 | <0.001 |
| Yes (with or without proteinuria) | 29 | 2.7 | 54 | 3.5 | 123 | 7.8 | |
| Gestational diabetes | |||||||
| No | 966 | 88.4 | 1407 | 91.5 | 1470 | 92.6 | <0.001 |
| Yes | 127 | 11.6 | 131 | 8.5 | 117 | 7.4 | |
| GWG (kg), median (IQR) | 9 | 6–10 | 13 | 12–15 | 18 | 16–20 | <0.001 |
| Birthweight (g), mean (SD) | 3151.7 | 400.7 | 3273.7 | 420.7 | 3376.0 | 439.8 | <0.001 |
| ≤2499 | 44 | 4.0 | 30 | 1.9 | 36 | 2.3 | <0.001 |
| 2500–2999 | 338 | 30.9 | 363 | 23.5 | 273 | 17.1 | |
| 3000–3499 | 501 | 45.8 | 706 | 45.8 | 666 | 41.8 | |
| 3500–3999 | 187 | 17.1 | 364 | 23.6 | 492 | 30.9 | |
| ≥4000 | 23 | 2.1 | 79 | 5.1 | 127 | 8.0 | |
| Gestational age at birth (days), median (IQR) | 279 | 274–285 | 280 | 274–286 | 281 | 274–287 | <0.001 |
| Early term (37–38 weeks) | 216 | 19.7 | 335 | 21.7 | 304 | 19.1 | <0.001 |
| Full term (39–40 weeks) | 675 | 61.7 | 863 | 56.0 | 873 | 54.7 | |
| Late term (41+ weeks) | 203 | 18.6 | 344 | 22.3 | 418 | 26.2 | |
Abbreviations: BMI, body mass index; GWG, gestational weight gain; IQR, interquartile range; SD, standard deviation.
Based on 2009 Institute of Medicine thresholds, 3 accounting for gestational age at birth; 20 considered insufficient GWG if below recommendation, adequate if within recommendation, or excessive if above recommendation.
Categorical variables: chi‐squared test; normally distributed continuous variables: analysis of variance; non‐normally distributed continuous variables: Kruskal–Wallis test.
BMI: underweight: <18.5; normal weight: 18.5–24.9; overweight: 25–29.9; obese: ≥30 kg/m2.
Hypertension defined as blood pressure: systolic >140 mm Hg or diastolic >90 mm Hg.
TABLE 2.
Maternal and pregnancy and delivery characteristics by GWG adequacy among multiparous women.
|
Insufficient GWG a n = 1632 |
Adequate GWG a n = 2044 |
Excessive GWG a n = 1817 |
p value b | ||||
|---|---|---|---|---|---|---|---|
| n | (%) | n | (%) | n | (%) | ||
| Maternal characteristics | |||||||
| BMI c | |||||||
| Underweight + normal weight | 1215 | 74.4 | 1486 | 72.7 | 931 | 51.2 | <0.001 |
| Overweight | 204 | 12.5 | 393 | 19.2 | 566 | 31.2 | |
| Obese | 213 | 13.1 | 165 | 8.1 | 320 | 17.6 | |
| Age | |||||||
| <25 years | 144 | 8.8 | 122 | 6.0 | 118 | 6.5 | 0.011 |
| 25–34 years | 1066 | 65.3 | 1356 | 66.3 | 1216 | 66.9 | |
| ≥35 years | 422 | 25.9 | 566 | 27.7 | 483 | 26.6 | |
| Country or region of birth | |||||||
| France | 1283 | 78.7 | 1682 | 82.3 | 1473 | 81.1 | 0.020 |
| Not France | 348 | 21.3 | 362 | 17.7 | 344 | 18.9 | |
| Education | |||||||
| Less than high school/high school | 787 | 48.7 | 835 | 41.2 | 943 | 52.4 | <0.001 |
| Any post‐high school graduation | 830 | 51.3 | 1190 | 58.8 | 857 | 47.6 | |
| Previous delivery mode(s) | |||||||
| VD only | 1436 | 88.0 | 1792 | 87.7 | 1577 | 86.8 | 0.219 |
| VD and CS | 72 | 4.4 | 69 | 3.4 | 80 | 4.4 | |
| CS only | 124 | 7.6 | 183 | 9.0 | 159 | 8.8 | |
| Pregnancy and delivery characteristics | |||||||
| Hypertension during pregnancy d | |||||||
| No | 1600 | 98.4 | 1994 | 98.2 | 1742 | 96.3 | <0.001 |
| Yes (with or without proteinuria) | 26 | 1.6 | 37 | 1.8 | 67 | 3.7 | |
| Gestational diabetes | |||||||
| No | 1408 | 86.5 | 1844 | 90.7 | 1635 | 90.2 | <0.001 |
| Yes | 220 | 13.5 | 188 | 9.3 | 178 | 9.8 | |
| GWG (kg), median (IQR) | 8 | 5–10 | 13 | 11–14 | 17 | 15–20 | <0.001 |
| Birthweight (g), mean (SD) | 3269.8 | 425.8 | 3404.8 | 425.1 | 3504.6 | 453.1 | <0.001 |
| ≤2499 | 54 | 3.3 | 33 | 1.6 | 34 | 1.9 | <0.001 |
| 2500–2999 | 382 | 23.4 | 291 | 14.2 | 185 | 10.2 | |
| 3000–3499 | 728 | 44.6 | 895 | 43.8 | 668 | 36.8 | |
| 3500–3999 | 388 | 23.8 | 661 | 32.3 | 679 | 37.4 | |
| ≥4000 | 80 | 4.9 | 164 | 8.0 | 251 | 13.8 | |
| Gestational age at birth (days), median (IQR) | 278.5 | 273–284 | 280 | 273–285 | 279 | 273–285 | <0.001 |
| Early term (37–38 weeks) | 393 | 24.1 | 461 | 22.6 | 400 | 22.0 | 0.008 |
| Full term (39–40 weeks) | 994 | 60.9 | 1198 | 58.6 | 1063 | 58.5 | |
| Late term (41+ weeks) | 245 | 15.0 | 385 | 18.8 | 354 | 19.5 | |
Abbreviations: BMI, body mass index; CS, cesarean section; GWG, gestational weight gain; IQR, interquartile range; SD, standard deviation; VD, vaginal delivery.
Based on 2009 Institute of Medicine thresholds, 3 accounting for gestational age at birth; 20 considered insufficient GWG if below recommendation, adequate if within recommendation, or excessive if above recommendation.
Categorical variables: chi‐squared test; continuous variables: analysis of variance (ANOVA); normally distributed continuous variables: ANOVA; non‐normally distributed continuous variables: Kruskal–Wallis test.
BMI: underweight: <18.5; normal weight: 18.5–24.9; overweight: 25–29.9; obese: ≥30 kg/m2.
Hypertension defined as blood pressure: systolic >140 mm Hg or diastolic >90 mm Hg.
3.2. Association between intrapartum oxytocin administration and GWG adequacy
Overall, 62.6% of primiparas and 32.8% of multiparas received intrapartum oxytocin. Among primiparas and multiparas with underweight and normal weight prepregnancy BMI, intrapartum oxytocin administration increased across insufficient, adequate, and excessive GWG (primiparas: p = 0.014; multiparas: p < 0.001; Figure 2), a trend also evident among primiparas with overweight prepregnancy BMI (p = 0.002). In unadjusted and adjusted regression models (Table 3), similar results were noted among women with underweight and normal weight prepregnancy BMI. Additionally, regardless of parity or prepregnancy BMI, a trend of increased oxytocin administration among women with excessive GWG was apparent. For primiparas with obese prepregnancy BMI, oxytocin administration was also increased among those with insufficient GWG (aOR 2.6, 95% CI 1.1–6.3). Some associations were noted between oxytocin administration and other covariates of interest (Table S3).
FIGURE 2.
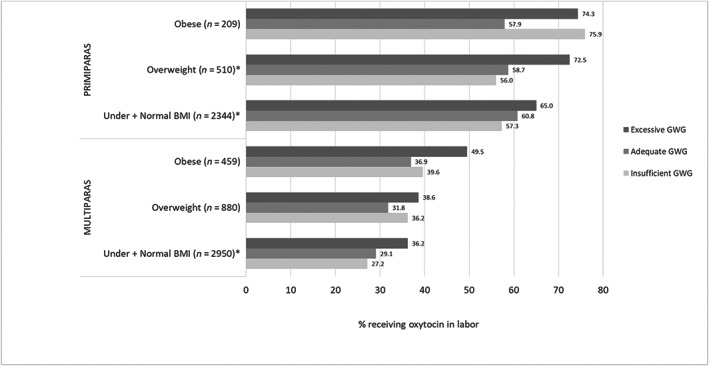
Oxytocin use among women with spontaneous labor according to gestational weight gain (GWG) adequacya by maternal prepregnancy body mass index (BMI)b. *Statistically significant difference (p < 0.05). aBased on 2009 Institute of Medicine thresholds, 3 accounting for gestational age at birth; 20 considered insufficient GWG if below recommendation, adequate if within recommendation, or excessive if above recommendation. bBMI: underweight: <18.5; normal weight: 18.5–24.9; overweight: 25–29.9; obese: ≥30 kg/m2.
TABLE 3.
Associations between gestational weight gain adequacy and intrapartum interventions
| Primiparas | Multiparas | |||||||||||||||
|---|---|---|---|---|---|---|---|---|---|---|---|---|---|---|---|---|
| Oxytocin administration a | Intrapartum CS | Oxytocin administration a | Intrapartum CS | |||||||||||||
| Unadjusted b | Adjusted c | Unadjusted b | Adjusted c | Unadjusted b | Adjusted c | Unadjusted b | Adjusted c | |||||||||
| OR | 95% CI | aOR | 95% CI | OR | 95% CI | aOR | 95% CI | OR | 95% CI | aOR | 95% CI | OR | 95% CI | aOR | 95% CI | |
| Underweight + Normal weight d | ||||||||||||||||
| Insufficient GWG e | 0.9* | 0.7–1.1 | 0.9 | 0.8–1.2 | 0.8* | 0.6 –1.1 | 0.9 | 0.6–1.1 | 0.9* | 0.7–1.1 | 0.9* | 0.8 –1.1 | 0.9* | 0.6–1.4 | 0.9* | 0.6 –1.3 |
| Excessive GWG e | 1.2* | 1.0–1.5 | 1.2 | 0.9–1.5 | 1.3* | 1.0 –1.6 | 1.2 | 0.9–1.5 | 1.4 * | 1.2 –1.7 | 1.3 * | 1.1–1.6 | 1.8 * | 1.3–2.6 | 1.9 * | 1.3–2.7 |
| Overweight d | ||||||||||||||||
| Insufficient GWG e | 0.9* | 0.5–1.5 | 1.1* | 0.6 –1.9 | 0.8 | 0.4–1.6 | 0.8 | 0.4–1.7 | 1.2 | 0.8–1.9 | 1.2 | 0.8–1.9 | 0.9 | 0.5–1.6 | 0.8 | 0.4–1.5 |
| Excessive GWG e | 1.8 * | 1.2–2.8 | 1.8 * | 1.1 –2.8 | 1.1 | 0.7–1.7 | 1.0 | 0.6–1.6 | 1.4 | 1.0–1.8 | 1.2 | 0.9–1.7 | 0.6 | 0.4–1.0 | 0.6 | 0.4–0.9 |
| Obese d | ||||||||||||||||
| Insufficient GWG e | 2.4 | 1.0–5.8 | 2.6 | 1.1–6.3 | 0.9 | 0.5–1.8 | 0.9 | 0.5–1.8 | 1.1 | 0.7–1.9 | 1.0 | 0.6–1.8 | 0.9 | 0.5–1.6 | 0.7 | 0.4–1.4 |
| Excessive GWG e | 2.1 | 1.0–4.5 | 2.5 | 1.1–5.5 | 1.0 | 0.6–1.8 | 1.1 | 0.6–2.0 | 1.7 | 1.0–2.8 | 1.7 | 1.0–2.8 | 0.8 | 0.5–1.4 | 0.8 | 0.5–1.4 |
Note: OR/aOR (95% CI) in bold type had a statistically significant association (does not cross null).
Abbreviations: aOR, adjusted odds ratio; CI, confidence interval; CS, cesarean section; GWG, gestational weight gain; OR, odds ratio.
Among women with spontaneous onset of labor only.
Associations estimated using multi‐level generalized estimating equations models accounting for clustering by hospital.
Associations estimated using multi‐level generalized estimating equations models accounting for clustering by hospital and adjusted for maternal age, country/region of birth, education, birthweight (g), gestational age at birth (days), prepregnancy body mass index (kg/m2).
Body mass index: underweight: <18.5; normal weight: 18.5–24.9; overweight: 25–29.9; obese: ≥30 kg/m2.
Based on 2009 Institute of Medicine thresholds, 3 accounting for gestational age at birth; 20 considered insufficient GWG if below recommendation, adequate if within recommendation (reference group), or excessive if above recommendation.
GWG adequacy variable statistically significant (p < 0.05) Type 3 statistic in model.
3.3. Association between intrapartum CS and GWG adequacy
Overall, 15.8% of primiparas and 5.7% of multiparas received an intrapartum CS. Among primiparas and multiparas with underweight and normal weight prepregnancy BMI, intrapartum CS increased across insufficient, adequate, and excessive GWG (primiparas: p = 0.014; multiparas: p < 0.001; Figure 3). Similar trends were found for primiparas with overweight (p = 0.527) and obese (p = 0.872) prepregnancy BMI. However, intrapartum CS was reduced among multiparas with overweight and obese prepregnancy BMI and excessive GWG. In unadjusted and adjusted regression models (Table 3), similar results were noted, though statistically significant associations for the association between GWG adequacy and intrapartum CS in adjusted models were only noted for multiparas with underweight and normal weight prepregnancy BMI and excessive GWG (aOR 1.9, 95% CI 1.3–2.7) and multiparas with overweight prepregnancy BMI and excessive GWG (aOR 0.6, 95% CI 0.4–0.9). Some associations were noted between intrapartum CS and other covariates of interest (Table S3).
FIGURE 3.
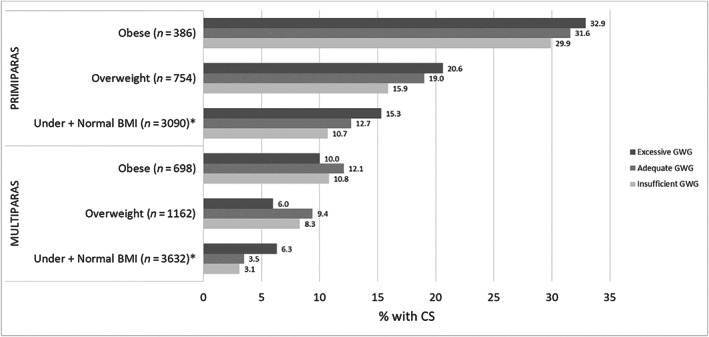
Cesarean section (CS) among women undergoing trial of labor according to gestational weight gain (GWG) adequacya by maternal prepregnancy body mass index (BMI)b. *Statistically significant difference (p < 0.05). aBased on 2009 Institute of Medicine thresholds, 3 accounting for gestational age at birth; 20 considered insufficient GWG if below recommendation, adequate if within recommendation, or excessive if above recommendation. bBMI: underweight: <18.5; normal weight: 18.5–24.9; overweight: 25–29.9; obese: ≥30 kg/m2.
3.4. Sensitivity analysis
GWG was similar between women with underweight and normal weight prepregnancy BMI (primiparas: underweight: median 13 kg, interquartile range (IQR) 10–17 kg; normal weight: median 14 kg, IQR 11–17 kg; multiparas: underweight: median 13 kg, IQR 10–17 kg; normal weight: median 13 kg, IQR 10–16 kg) and the underweight group was fairly close in BMI (primiparas: median: 17.7 kg/m2, IQR 17.2–18.2 kg/m2; multiparas: median: 17.9 kg/m2, IQR 17.3–18.3 kg/m2) to the normal weight group (lower cut‐point 18.5 kg/m2). Results were similar when underweight women were excluded from the analyses of the association between GWG adequacy and intrapartum interventions (results not shown).
4. DISCUSSION
Among women with term singleton live births, GWG adequacy was associated with intrapartum oxytocin administration and CS. Specifically, excessive GWG was associated with intrapartum oxytocin administration, regardless of parity or prepregnancy BMI, suggesting an association between excessive GWG and labor dysfunction. In contrast, excessive GWG was significantly associated with intrapartum CS only among multiparas with underweight and normal weight prepregnancy BMI. Similar trends were found for primiparas with underweight and normal weight prepregnancy BMI, but CS was reduced among multiparas with overweight and obese prepregnancy BMI and excessive GWG.
We found that oxytocin administration was increased with excessive GWG regardless of prepregnancy BMI or parity, in line with previous studies, which found higher oxytocin administration with increased BMI, 24 , 25 , 26 including a previous NPS study. 27 Though we did not identify any other studies specifically investigating the association between GWG adequacy and intrapartum oxytocin administration, the association is plausible because increased BMI/adiposity may cause uterine contraction impairment, 5 which could lead to increased use of oxytocin in labor. Given the general lack of evidence, additional research is needed to clarify the relation between GWG adequacy and intrapartum oxytocin administration necessitated by labor dysfunction.
We found that GWG adequacy was associated with intrapartum CS among underweight and normal weight prepregnancy BMI regardless of parity. Specifically, in line with previous literature, insufficient GWG was associated with decreased CS 9 , 11 , 15 , 16 and excessive GWG with increased CS. 9 , 11 , 14 , 15 , 16 , 17 , 18 , 19 However, in contrast, a trend of decreased CS with excessive GWG was found for multiparas with overweight or obese prepregnancy BMI. Although one previous study also found reduced CS due to dystocia among women with obese prepregnancy BMI and excessive GWG, 10 most found associations between excessive/increased GWG and CS regardless of BMI, 9 , 13 , 15 , 16 , 17 albeit some did not report results by BMI category. 11 , 14 , 18 Differences in findings between studies by BMI could be a result of different classifications for GWG (z‐scores), 16 GWG categories, 13 , 18 focus on weight loss, 12 or study population (women with two previous CS attempting trial of labor, 15 only primiparas 9 ). Additionally, some differences in classifications of intrapartum CS are likely, as definitions included unplanned/emergency, 13 , 16 during labor/emergency, 18 in labor, 14 following trial of labor/among women who had labored, 9 , 15 , 19 emergency/acute, 17 non‐elective, 12 or primary CS due to dysfunctional labor/dystocia. 10 , 11 Though GWG adequacy within some populations was relatively similar to our cohort, 10 , 12 , 17 in others, excessive GWG was more 9 , 14 or less 11 common.
Nonetheless, the specific association between inadequate GWG and intrapartum CS necessitated by labor dysfunction among underweight and normal weight women is plausible. Excessive GWG among women with higher prepregnancy BMI may not substantially alter the pre‐existing underlying physiology leading to intrapartum CS to the same extent as among women entering pregnancy with a lower BMI. For example, excessive GWG could have a greater impact on uterine contraction impairment and hormone and lipid levels among underweight and normal weight women given their relatively lower prepregnancy risk profile, whereas the impact of excessive GWG could be less among overweight and obese women given their relatively elevated prepregnancy risk profile. Additionally, mechanical risks of excess adiposity associated with labor dysfunction in the first stage of labor may be beneficial in the second stage of labor, as evidenced by findings of a shorter second stage of labor among overweight and obese women, potentially related to increased abdominal pressure and strength when pushing. 25
The lack of association between GWG and intrapartum interventions among women with obese prepregnancy BMI could also reflect selection biases. Obstetricians may prefer to schedule these women for a planned CS (given their higher risk for intrapartum CS due to prolonged labor), 7 meaning that only the healthiest obese women with a higher likelihood of achieving a vaginal delivery attempt a trial of labor. Given that additional maternal characteristics were associated with intrapartum interventions, the potential mechanisms/relation between BMI, GWG, and intrapartum interventions and other factors are complex. Additional research is needed to verify our finding of differences by BMI and to further explore the potential mechanisms for these associations.
The NPS provide extensive, rigorous data, obtained by specially trained study personnel within a large, nationally representative sample (based on comparisons of selected perinatal indicators, eg, maternal age and GA, available from birth certificate and hospital discharge statistics in the corresponding years). 2 To limit biases due to the correlation between GWG and length of gestation, we accounted for GA at birth in our definition of GWG adequacy, 28 as done in previous studies. 20 , 23 Additional methodological strengths are the large sample size and low level of missing data (~1.5% in multivariable analyses; >90% of women participating in NPS with necessary data on BMI, GWG, and outcomes for analysis). Given the lack of studies examining intrapartum CS or oxytocin administration, our study provides important information for providers, in particular given recent changes to the obstetric population risk profile in France and other countries with similar trends.
Limitations of our study include measurement error due to the inclusion of some self‐reported (in particular for both prepregnancy and end of pregnancy weight) and retrospective data. Though self‐reported weight may be underestimated 29 and the precision of timing of maternal weight estimates (for example, how close the end of pregnancy weight measure was to delivery) is unclear, because GWG is not reported in medical records in France in a standardized manner, this information was obtained by self‐report to ensure complete and consistently reported data. Additionally, longitudinal GWG information was not available, preventing the evaluation of GWG trajectories or timing. Finally, although the NPS includes a large cohort of women, after stratifying by BMI and parity, we had low power to detect differences, particularly among women with obese prepregnancy BMI. Similar studies should be performed in countries with higher obesity rates to provide additional evidence within this group. While institutional differences in obstetric interventions are likely, the multi‐level models used in our adjusted analysis accounted for these differences. As we have performed many statistical tests, results, particularly for other covariates included in the adjusted models, should be interpreted with caution and are only included for hypothesis generation and to understand the various factors that impact the associations.
5. CONCLUSION
Among a nationally representative sample of women giving birth to singletons in France, excessive GWG was associated with increased oxytocin administration regardless of prepregnancy BMI and parity and intrapartum CS among women with underweight and normal weight prepregnancy BMI, providing further evidence for the benefits of healthy GWG for normal labor progression. Additional research in larger cohorts is needed to verify our findings and to further explore the potential mechanisms, in particular the role of BMI, for the associations evaluated.
AUTHOR CONTRIBUTIONS
Béatrice Blondel and Camille Le Ray contributed substantially to the design and data acquisition of the French National Perinatal Surveys. Melissa Amyx, Camille Le Ray, and Jennifer Zeitlin contributed substantially to the design of the current study. Melissa Amyx conducted data analysis, interpreted the results, and developed the draft manuscript under the supervision of Camille Le Ray and Jennifer Zeitlin and with input from Béatrice Blondel. All authors critically reviewed and approved the final manuscript.
FUNDING INFORMATION
The 2016 National Perinatal Survey was supported by the French Ministry of Health (Direction de la Recherche, des Études, de l'Évaluation et des Statistiques [DREES], Direction Générale de la Santé [DGS], and Direction Générale de l'Organization des Soins [DGOS]) and by Santé Publique France. Dr. Amyx's postdoctoral fellowship is funded by the Inserm‐NICHD agreement.
CONFLICT OF INTEREST
The authors have stated explicitly that there are no conflicts of interest in connection with this article.
Supporting information
Table S1.
Table S2.
Table S3.
ACKNOWLEDGMENT
The authors thank the Maternal and Child Health service in each French district, the heads of the maternity units, and the investigators who participated in the surveys.
Amyx M, Zeitlin J, Blondel B, Le Ray C. Gestational weight gain adequacy and intrapartum oxytocin and cesarean section use: Observational population‐based study in France. Acta Obstet Gynecol Scand. 2023;102:301‐312. doi: 10.1111/aogs.14496
REFERENCES
- 1. Prevalence of obesity among adults, BMI ≥30. 2021. World Health Organization. Available at: https://www.who.int/data/gho/data/indicators/indicator‐details/GHO/prevalence‐of‐obesity‐among‐adults‐bmi‐=‐30‐(age‐standardized‐estimate). (Accessed July 12, 2022).
- 2. Coulm B, Bonnet C, Blondel B, EPOPé Research Team . French National Perinatal Survey 2016: situation in 2016 and trends since 2010. Inserm; 2017. [Google Scholar]
- 3. Institute of Medicine and National Research Council . Weight gain during pregnancy: reexamining the guidelines. National Academies Press; 2010. [PubMed] [Google Scholar]
- 4. Santos S, Voerman E, Amiano P, et al. Impact of maternal body mass index and gestational weight gain on pregnancy complications: an individual participant data meta‐analysis of European, North American and Australian Cohorts. BJOG. 2019;126:984‐995. [DOI] [PMC free article] [PubMed] [Google Scholar]
- 5. Xiong C, Zhou A, Cao Z, et al. Association of pre‐pregnancy body mass index, gestational weight gain with cesarean section in term deliveries of China. Sci Rep. 2016;6:1‐6. [DOI] [PMC free article] [PubMed] [Google Scholar]
- 6. Stotland NE, Hopkins LM, Caughey AB. Gestational weight gain, macrosomia, and risk of cesarean birth in nondiabetic nulliparas. Obstet Gynecol. 2004;104:671‐677. [DOI] [PubMed] [Google Scholar]
- 7. Rogers AJG, Harper LM, Mari G. A conceptual framework for the impact of obesity on risk of cesarean delivery. Am J Obstet Gynecol. 2018;219:356‐363. [DOI] [PubMed] [Google Scholar]
- 8. Kyozuka H, Hiraiwa T, Murata T, et al. Gestational weight gain as a risk factor for dystocia during first delivery: a multicenter retrospective cohort study in Japan. BMC Pregnancy Childbirth. 2022;22:728. [DOI] [PMC free article] [PubMed] [Google Scholar]
- 9. Dude AM, Grobman W, Haas D, et al. Gestational weight gain and pregnancy outcomes among nulliparous women. Am J Perinatol. 2021;38:182‐190. [DOI] [PMC free article] [PubMed] [Google Scholar]
- 10. Wie JH, Park IY, Namkung J, Seo HW, Jeong MJ, Kwon JY. Is it appropriate for Korean women to adopt the 2009 Institute of Medicine recommendations for gestational weight gain? PLoS One. 2017;12:e0181164. [DOI] [PMC free article] [PubMed] [Google Scholar]
- 11. Hung T, Chen S, Hsu J. Gestational weight gain and risks for adverse perinatal outcomes: a retrospective cohort study based on the 2009 Institute of Medicine guidelines. Taiwan J Obstet Gynecol. 2015;54:421‐425. [DOI] [PubMed] [Google Scholar]
- 12. Beyerlein A, Schiessl B, Lack N, von Kries R. Associations of gestational weight loss with birth‐related outcome: a retrospective cohort study. BJOG. 2011;118:55‐61. [DOI] [PubMed] [Google Scholar]
- 13. Lan‐Pidhainy X, Nohr EA, Rasmussen KM. Comparison of gestational weight gain‐related pregnancy outcomes in American primiparous and multiparous women. Am J Clin Nutr. 2013;97:1100‐1106. [DOI] [PubMed] [Google Scholar]
- 14. Chung JGY, Taylor RS, Thompson JMD, et al. Gestational weight gain and adverse pregnancy outcomes in a nulliparous cohort. Eur J Obstet Gynecol. 2013;167:149‐153. [DOI] [PubMed] [Google Scholar]
- 15. Sargent JA, Savitsky LM, Dissanayake MV, Lo JO, Cheng YW, Caughey AB. Gestational weight gain during pregnancy as an important factor influencing a successful trial of labor following two previous cesareans. Am J Perinatol. 2019;36:588‐593. [DOI] [PMC free article] [PubMed] [Google Scholar]
- 16. Xu H, Arkema EV, Cnattingius S, Stephansson O, Johansson K. Gestational weight gain and delivery outcomes: a population‐based cohort study. Paediatr Perinat Epidemiol. 2021;35:47‐56. [DOI] [PubMed] [Google Scholar]
- 17. Haugen M, Brantsæter AL, Winkvist A, et al. Associations of pre‐pregnancy body mass index and gestational weight gain with pregnancy outcome and postpartum weight retention: a prospective observational cohort study. BMC Pregnancy Childbirth. 2014;14:1‐11. [DOI] [PMC free article] [PubMed] [Google Scholar]
- 18. Nohr EA, Vaeth M, Baker JL, Sørensen TI, Olsen J, Rasmussen KM. Combined associations of prepregnancy body mass index and gestational weight gain with the outcome of pregnancy. Am J Clin Nutr. 2008;87:1750‐1759. [DOI] [PubMed] [Google Scholar]
- 19. Carassou‐Maillan A, Mulliez A, Curinier S, et al. Facteurs prédictifs d'échec de l'intention de voie basse chez la primipare obèse. Gynecol Obstet Fertil. 2014;42:755‐760. [DOI] [PubMed] [Google Scholar]
- 20. Bodnar LM, Siega‐Riz AM, Simhan HN, Himes KP, Abrams B. Severe obesity, gestational weight gain, and adverse birth outcomes. Am J Clin Nutr. 2010;91:1642‐1648. [DOI] [PMC free article] [PubMed] [Google Scholar]
- 21. Programme National Nutrition et Santé . Le guide de nutrition pendant et après la grossesse. Livret d'accompagnement destiné aux professionnels de santé. Agence française de sécurité sanitaire des aliments; 2007. [Google Scholar]
- 22. Bouvier D, Forest JC, Dion‐Buteau E, et al. Association of maternal weight and gestational weight gain with maternal and neonate outcomes: a prospective cohort study. J Clin Med. 2019;8:2074. [DOI] [PMC free article] [PubMed] [Google Scholar]
- 23. Liu J, Gallagher AE, Carta CM, Torres ME, Moran R, Wilcox S. Racial differences in gestational weight gain and pregnancy‐related hypertension. Ann Epidemiol. 2014;24:441‐447. [DOI] [PMC free article] [PubMed] [Google Scholar]
- 24. Hollowell J, Pillas D, Rowe R, Linsell L, Knight M, Brocklehurst P. The impact of maternal obesity on intrapartum outcomes in otherwise low risk women: secondary analysis of the birthplace national prospective cohort study. BJOG. 2014;121:343‐355. [DOI] [PMC free article] [PubMed] [Google Scholar]
- 25. Østborg TB, Sande RK, Kessler J, Tappert C, von Brandis P, Eggebø TM. Put your weight behind it—effect of body mass index on the active second stage of labour: a retrospective cohort study. BJOG. 2022;129:2166‐2174. [DOI] [PMC free article] [PubMed] [Google Scholar]
- 26. Carlson NS, Corwin EJ, Lowe NK. Oxytocin augmentation in spontaneously laboring, nulliparous women: multilevel assessment of maternal BMI and oxytocin dose. Biol Res Nurs. 2017;19:382‐392. [DOI] [PMC free article] [PubMed] [Google Scholar]
- 27. Belghiti J, Coulm B, Kayem G, Blondel B, Deneux‐Tharaux C. Oxytocin administration during labor. Results from the 2010 French National Perinatal Survey. J Gynecol Obstet Biol Reprod. 2013;42:662‐670. [DOI] [PubMed] [Google Scholar]
- 28. Hutcheon JA, Bodnar LM. Good practices for observational studies of maternal weight and weight gain in pregnancy. Paediatr Perinat Epidemiol. 2018;32:152‐160. [DOI] [PMC free article] [PubMed] [Google Scholar]
- 29. Yoong SL, Carey ML, D'Este C, Sanson‐Fisher RW. Agreement between self‐reported and measured weight and height collected in general practice patients: a prospective study. BMC Med Res Methodol. 2013;13:1‐8. [DOI] [PMC free article] [PubMed] [Google Scholar]
Associated Data
This section collects any data citations, data availability statements, or supplementary materials included in this article.
Supplementary Materials
Table S1.
Table S2.
Table S3.