

Abstract
Objective
To evaluate the association of Dipeptidyl-peptidase 4 (DPP4, also known as CD26) with cellular senescence of human cartilage and knee osteoarthritis (OA) progression.
Methods
Articular cartilage sections and chondrocytes were acquired from 35 individuals undergoing total knee replacement for OA to evaluate: (1) the association between OA severity and established senescence markers (SA-β-gal activity and p16) quantified by immunohistochemistry and flow cytometry (n=19); (2) the co-expression of DPP4 with established senescence markers by flow cytometry, and (3) expression levels of anabolic and catabolic genes, senescence related genes and senescence-associated secretory phenotypes (SASPs) in DPP4+ and DPP4− cells, isolated by fluorescence-activated cell sorting vs magnetic-activated cell sorting (n=16). The concentration of soluble DPP4 was measured in synovial fluid (SF) and plasma of the Prediction of Osteoarthritis Progression cohort, and evaluated for its association with knee radiographic OA (rOA) severity at baseline (n=65) and structural rOA progression (n=57) over three years.
Results
DPP4 expression was associated with higher SA-β-gal, p16 expression, senescence-related gene and catabolic gene (ADAMTS5, MMP13, IL6, and IL8) expression, higher SASPs secretion, and lower anabolic gene (COL2A1 and ACAN) expression in primary chondrocytes. SF DPP4 was associated with rOA progression (Odds ratio=105.32, p=0.015), proteases (SF MMP-1 and -3), aggrecan degradation (SF sGAG), indicators of activated macrophages (SF CD14 and CD163) and inflammation (SF IL-6).
Conclusion
Our study identifies DPP4 as a key surface marker of senescent chondrocytes, and a predictor of rOA progression.
Keywords: DPP4, CD26, osteoarthritis, senescence, chondrocyte, progression
Graphical Abstract

Introduction
Cellular senescence is a state of irreversible cell cycle arrest after various cell stresses (1). Cellular senescence has been identified as a major factor in the pathogenesis of osteoarthritis (OA) based on elevated senescence-associated-β-galactosidase (SA-β-gal) activity, CDKN2A (p16) cartilage chondrocyte gene expression, reduced chondrocyte proliferation, and elevated expression of cartilage degrading metalloproteinases (MMPs) −1 and −13 (2–5), suggesting that senescence targeted therapy could be an effective treatment for OA.
The most commonly used senescence markers, including p16, p21 and SA-β-gal activity, are intracellular, hampering the ability to specifically select or target senescent chondrocytes for senolytic or senomorphic therapies based on these indicators. A cell surface marker associated with a senescent cell phenotype may provide the necessary tool for senolytic and senomorphic targeting. To date, there is no well-defined cell surface indicator of senescence in OA. Therefore, the field has relied on criteria of large cell size and high autofluorescence to identify senescent chondrocytes (6); this is useful for the study of senescence in OA but cannot be used to target senescent chondrocytes for elimination or modification. Moreover, defining size and autofluorescence is arbitrary, which leads to the challenge of establishing standardized and reproducible procedures. The goal of this study was to validate a new surface marker indicative of chondrocyte senescence, Dipeptidyl-peptidase 4 (DPP4, also known as CD26).
DPP4 is a serine protease that cleaves a variety of substrates, including cytokines, growth factors and incretins; it can exist in both membrane and soluble forms (7, 8). Based on its recent identification as a senescence marker on the surface of human WI-38 primary fibroblasts (9), our goal was to evaluate primary human chondrocyte expression of DPP4 and its relationship to senescence, severity, and progression of OA. To our knowledge, its role in OA-related senescence has not been previously investigated. To fill this knowledge gap, we investigated the association of DPP4 surface expression with senescence biomarkers, gene expression and secretion of indicators of a senescence associated secretory phenotype (SASP) in osteoarthritic human primary chondrocytes. We also measured soluble DPP4 in synovial fluid (SF) and plasma from the Prediction of Osteoarthritis Progression (POP) cohort (10) to determine the association of soluble DPP4 with knee radiographic OA (rOA) severity and progression. We hypothesized that DPP4 is a biomarker of chondrocyte senescence in OA that contributes to disease pathogenesis and progression.
Materials and Methods
Tissues and samples
Articular cartilages were collected as anonymized waste surgical specimens from 35 patients undergoing total knee replacement (TKR). A total of 19 samples from patients with medial compartment dominant OA (MOA) were used to evaluate the association of SA-β-gal activity and p16 with OA severity: n=12 for generating 10 μm cartilage cryosections from the outer lateral tibial plateau (oLT), inner lateral tibial plateau (iLT) and medial tibial plateau (MT), and n=7 for isolating chondrocytes from the medial tibia (MT) and lateral tibia (LT, including oLT and iLT). An additional 16 samples (n=12 with MOA and n=4 with lateral compartment dominant OA) were used to isolate chondrocytes from the whole knee joint (articular cartilage from the tibial plateau and femoral condyle) to evaluate senescence markers, catabolic, anabolic and senescence-related gene expression, SASPs and soluble DPP4 secretion. Collins’ grade and OARSI grade were used for macroscopic and microscopic assessment of OA severity, respectively (11, 12).
SF from one knee and plasma of 65 participants with knee rOA from the POP cohort (10) were used for determining soluble DPP4 concentrations. Among these participants, samples of 57 individuals with three-year follow-up radiographic data were used for DPP4 and rOA progression analyses; the analysis of the association of plasma DPP4 and patient-level knee rOA progression status used samples from 53 participants, excluding four patients with follow-up data but with a replaced contralateral (non-index) knee at baseline.
All samples were obtained with IRB approval from Duke University Hospital. Demographic and clinical information related to these samples is described in Table S1.
Radiographic knee OA burden and progression
Radiographs were scored for Kellgren Lawrence (KL) grade, osteophyte severity (OST, 0–12 per knee) and joint space narrowing (JSN, 0–6 per knee) using a standardized atlas (13); as previously published (14); intraclass correlation coefficients between readers for KL grade, OST and JSN were good to excellent, 0.69, 0.84 and 0.86, respectively, indicating high reliability of radiographic scoring. Baseline knee rOA burden of severity was defined as the sum of KL grades of the left and right knees (range 0–8). A baseline replaced knee was assigned a KL=0 score. Individual knee rOA progression status was categorized as non-progression (NP) on the basis of neither OST nor JSN progression and no TKR during the follow-up interval; or progression, which included three categories, OST progression only (OST+/JSN−), OST and JSN progression (OST+JSN+), or TKR performed during the follow-up interval (there were no JSN only progressors, see Table S2 depicting the trajectories of the 57 patients over the 3 year follow-up by baseline KL grade). Patient-level knee rOA progression status was categorized as NP (when neither knee changed OST or JSN status nor underwent TKR), unilateral or bilateral knee rOA progression (change of ≥1 unit of OST or JSN, or TKR).
Primary chondrocyte isolation
Articular cartilage was digested in 0.1% pronase solution for 1 hour and 0.17% type II collagenase solution for 16 hours at 37 °C, yielding a mean (± standard error of mean, SEM) 3.83±0.25 × 10⁶ chondrocytes per gram of human articular cartilage. Isolated chondrocytes were cultured or stained for DPP4 expression (Supplementary Methods).
SA-β-gal activity assay
A senescence β-galactosidase staining kit (CST, 9860) was used to assess SA-β-gal activity in cartilage cryosections. After fixation, sections were incubated with SA-β-gal staining solution overnight at 37°C, followed by 0.1% Safranin-0 counterstain. SA-β-gal activity positive cells (stained blue). Sections were scanned under a light microscope with a 10x objective, and the percentage of SA-β-gal-positive (blue) cells was determined by a manual count of 4 fields (Supplementary Methods).
P16 staining and quantification
After fixation and permeabilization, cartilage cryosections were blocked with 10% donkey serum in PBST for 30 minutes, incubated with anti-p16INK4a or a control antibody (Roche, CINtec kit 9517) at 4°C overnight, followed by washing and 1-hour incubation with Alexa Fluor plus 647-conjugated anti-Mouse IgG secondary antibody (Thermo Fisher, A32787), then washed and mounted, with visualization of P16 positive cells using a Zeiss Axio imager widefield fluorescence microscope.
Freshly isolated primary chondrocytes were fixed and permeabilized with methanol and incubated with anti-p16INK4a or a control antibody (20:100, both from the Roche CINtec kit 9517) for 30 mins, followed by washing and 30 minutes incubation with AF647-conjugated anti-mouse IgG2a secondary antibody (1:1000, Jackson, 115607186). The cells were washed and analyzed using an Attune NxT flow cytometer (Thermo Fisher) (Supplementary Methods).
Co-staining of SA-β-gal activity and p16 with DPP4
To avoid the strong autofluorescence of chondrocytes that interferes with detection of green fluorophores by flow cytometry, chondrocytes were cultured for three days before quantifying their SA-β-gal activity. Cells were initially incubated with anti-DPP4, PE (Thermo Fisher, 12-0269-42) for 30 mins at room temperature, then washed and fixed, followed by SA-β-gal activity measurement with the CellEvent Senescence Green Flow Cytometry Assay Kit (Thermo Fisher, C10840) as previously described (15). After staining for SA-β-gal activity, chondrocytes were permeabilized and stained for p16. The stained cells were acquired and analyzed using FlowJo V10.8 software (BD Life Sciences). DPP4, SA-β-Gal activity and p16 expression were quantified as the gated percentage of expressing cells minus the unstained background (see Supplementary Methods).
Fluorescence-activated cell sorting (FACS)
Chondrocytes stained with PE-conjugated anti-DPP4 antibody were sorted using a MoFlo Astrios Cell Sorter (Beckman Coulter Life Science) or a MA900 cell sorter (Sony Biotechnology). Dead dye Sytox AAD (1 μM, Thermo Fisher, S10349) was used to exclude dead cells. The purity of sorted DPP4+ and DPP4− chondrocytes was confirmed by flow cytometry and quantitative real-time polymerase chain reaction (qRT-PCR).
Magnetic activated cell sorting (MACS)
Cells stained with PE-conjugated anti-DPP4 antibodies were incubated with anti-PE magnetic beads (MACS, 130090757) for 15 minutes then loaded onto a MS column (MACS, 130042201) with the mini magnetic separator apparatus (MiniMACS, 130042102) deployed. The flow-through was collected as the DPP4 depleted chondrocyte subset. The bead-captured chondrocytes, retained within the column, represented the DPP4 enriched population. The purity of DPP4depleted and DPP4enriched chondrocytes was determined by flow cytometry and qRT-PCR (see Supplementary Methods).
Quantitative Real-Time Polymerase Chain Reaction (qRT-PCR)
RNA was extracted using an Aurum™ Total RNA Mini Kit (Bio-Rad, 7326820). cDNA was synthesized using the iScript™ cDNA Synthesis Kit (Bio-Rad,1708891) for anabolic and catabolic gene analysis. YWHAZ was used as an internal reference control gene. The primers used are listed in Table S3. qRT-PCR was performed using a SYBR green mastermix (Applied Biosystems, 4309155) with QuantStudio 6 Flex Real-Time PCR Systems (Applied Biosystems).
A custom RT2 Profiler PCR Array (Qiagen, 330171) was used to profile a total of 42 genes related to cellular senescence as previously described (15) (Table S4). cDNA was synthesized using an RT2 First Strand Kit (Qiagen, 330404) with 20 ng RNA per sample. QRT-PCR was performed using a RT2 SYBR Green ROX qPCR mastermix (Qiagen, 330522) with the PCR System.
Gene expression was calculated from the CT value of each gene subtracting the reference gene (YWHAZ) expression yielding ΔCT (CTtarget gene−CTYWHAZ), which was used to calculate the Log2 expression ratio (2−ΔCT). The relative gene expression was determined by ΔΔCT (ΔCTDPP4+ −ΔCTDPP4−), which was used to calculate the relative expression ratio (2−ΔΔCT).
SASPs measurements
After FACS and MACS, chondrocyte subsets were cultured at 50,000 per well/96 well plate in chondrocyte culture media for 2 days, then the media were replaced and collected for 24 hours. IL-1β, IL-6, IL-8, and TNF-α were measured by a V-PLEX Human Proinflammatory Panel II 4-Plex (MSD, K15053D). MMP-1, MMP-3 and MMP-9 were measured by a Human MMP 3-Plex Ultra-Sensitive Kit (MSD, K15034C), see Supplementary Methods for the coefficients of variation (CV).
Soluble DPP4 measurements
The concentrations of soluble DPP4 in cell culture supernatants, plasma, and SF, were measured by the Quantikine human DPPIV/CD26 Immunoassay (R&D, DC260B) according to the manufacturer’s protocol (see Supplementary Methods for the CV).
SF biomarker measurements
Sulfated Glycosaminoglycan (sGAG) was measured by a Blyscan Sulfated Glycosaminoglycan assay (Biocolor, B3000). Cartilage Oligomeric Matrix Protein (COMP) was measured by a Cartilage Oligomeric Matrix Protein Human ELISA kit (BioVender, RD194080200). MMP-1, MMP-3, and MMP-9 were measured by a Human MMP 3-Plex Ultra-Sensitive Kit (MSD, K15034C). Results of soluble CD163, CD14, and elastase, IL-6, IL-8 and IL-10 were previously measured and published (10, 16) (see Supplementary Methods).
Statistical Analyses
Analyses were performed using Prism 9 (GraphPad software) and SPSS (IBM SPSS Statistics for Macintosh, Version 28.0). Data were presented as mean ± SEM. OARSI score and percentage of SA-β-gal+ chondrocytes were normalized by the rank-based inverse normal transformation (17); their association was subsequently analyzed using a mixed-effects analysis (patient as random effect, location as repeated measure) to account for the correlation of repeated measures within participants. The percentages of DPP4+ cells in FACS and MACS were normalized with log transformation. Repeated measures ANOVA and mixed-effects analysis with Tukey’s post-hoc test were performed to compare OARSI histologic scores of oLT, iLT and MT regions and to evaluate MACS and FACS sorting purity. Wilcoxon tests were performed for comparison of cell size-gated and DPP4-gated subsets. Paired t-tests were performed for chondrocytes from MT and LT, and DPP4 sorted (FACS and MACS) subsets. Benjamini and Hochberg false discovery rate (FDR) was applied for correcting multiple testing of the qRT-PCR array data and FDR <0.05 was considered significant. Ordinal regression analysis was used to evaluate the association of the difference in Collins’ grade (MT-LT) and the difference in percentage of p16 (MT-LT), and SF and plasma DPP4 concentrations with OA baseline severity and progression. The Mann-Whitney test was used to compare SF DPP4 between NPs and progressors. Receiver operating characteristic (ROC) curve analysis was employed to assess the ability of SF DPP4, without or with KL grade, to discriminate between patients who did versus did not undergo TKR. The Spearman test was used to evaluate the correlation of plasma DPP4 and SF DPP4 with other SF biomarkers. P <0.05 was considered statistically significant. When <40% values were below the detection limit, those missing not at random low values were imputed as ½ the lower limit of detection (for soluble biomarkers), or CT=40 for qRT-PCR (for gene expression). As this was hypothesis generating discovery research, we did conduct it on the basis of a priori determined effect sizes. The number of biological replicates for each experiment are provided in the figure legends (see Supplementary Methods).
Results
Cellular senescence was associated with knee OA severity
oLT, iLT and MT represent mild, moderate and severe disease in MOA, respectively (18, 19). OARSI histologic scores from the oLT, iLT and MT were 5.83±0.46, 11.50±0.96, and 18.08±0.34, respectively, confirming a gradient of OA severity across the tibial plateau (MT>iLT> oLT) as expected for MOA (Figure 1B and C). SA-β-gal activity was higher in cartilage sections from MT compared to iLT and oLT (77.69±3.60%, 33.45±4.32% and 9.51±3.39%, respectively; Figures 1B and 1D), and positively correlated with the OARSI score (Figure 1D). In addition, p16 expression by immunofluorescence was qualitatively greater in MT than LT (Figure 1E), and confirmed quantitatively with flow cytometric analysis; chondrocytes from the MT region had a higher percentage of p16+ chondrocytes (33.76±3.51%) than LT (23.24±4.24%, p= 0.036, Figure 1F and 1G). Difference in percentage of p16+ chondrocytes (MT-LT) was marginally correlated with difference in Collins’ grade (MT-LT)(Figure 1H). Taken together, these results demonstrate that the established cellular senescence markers, SA-β-gal activity and p16, are positively associated with knee OA severity.
Figure 1. SA- β-gal activity and p16 in chondrocytes were associated with knee OA severity.
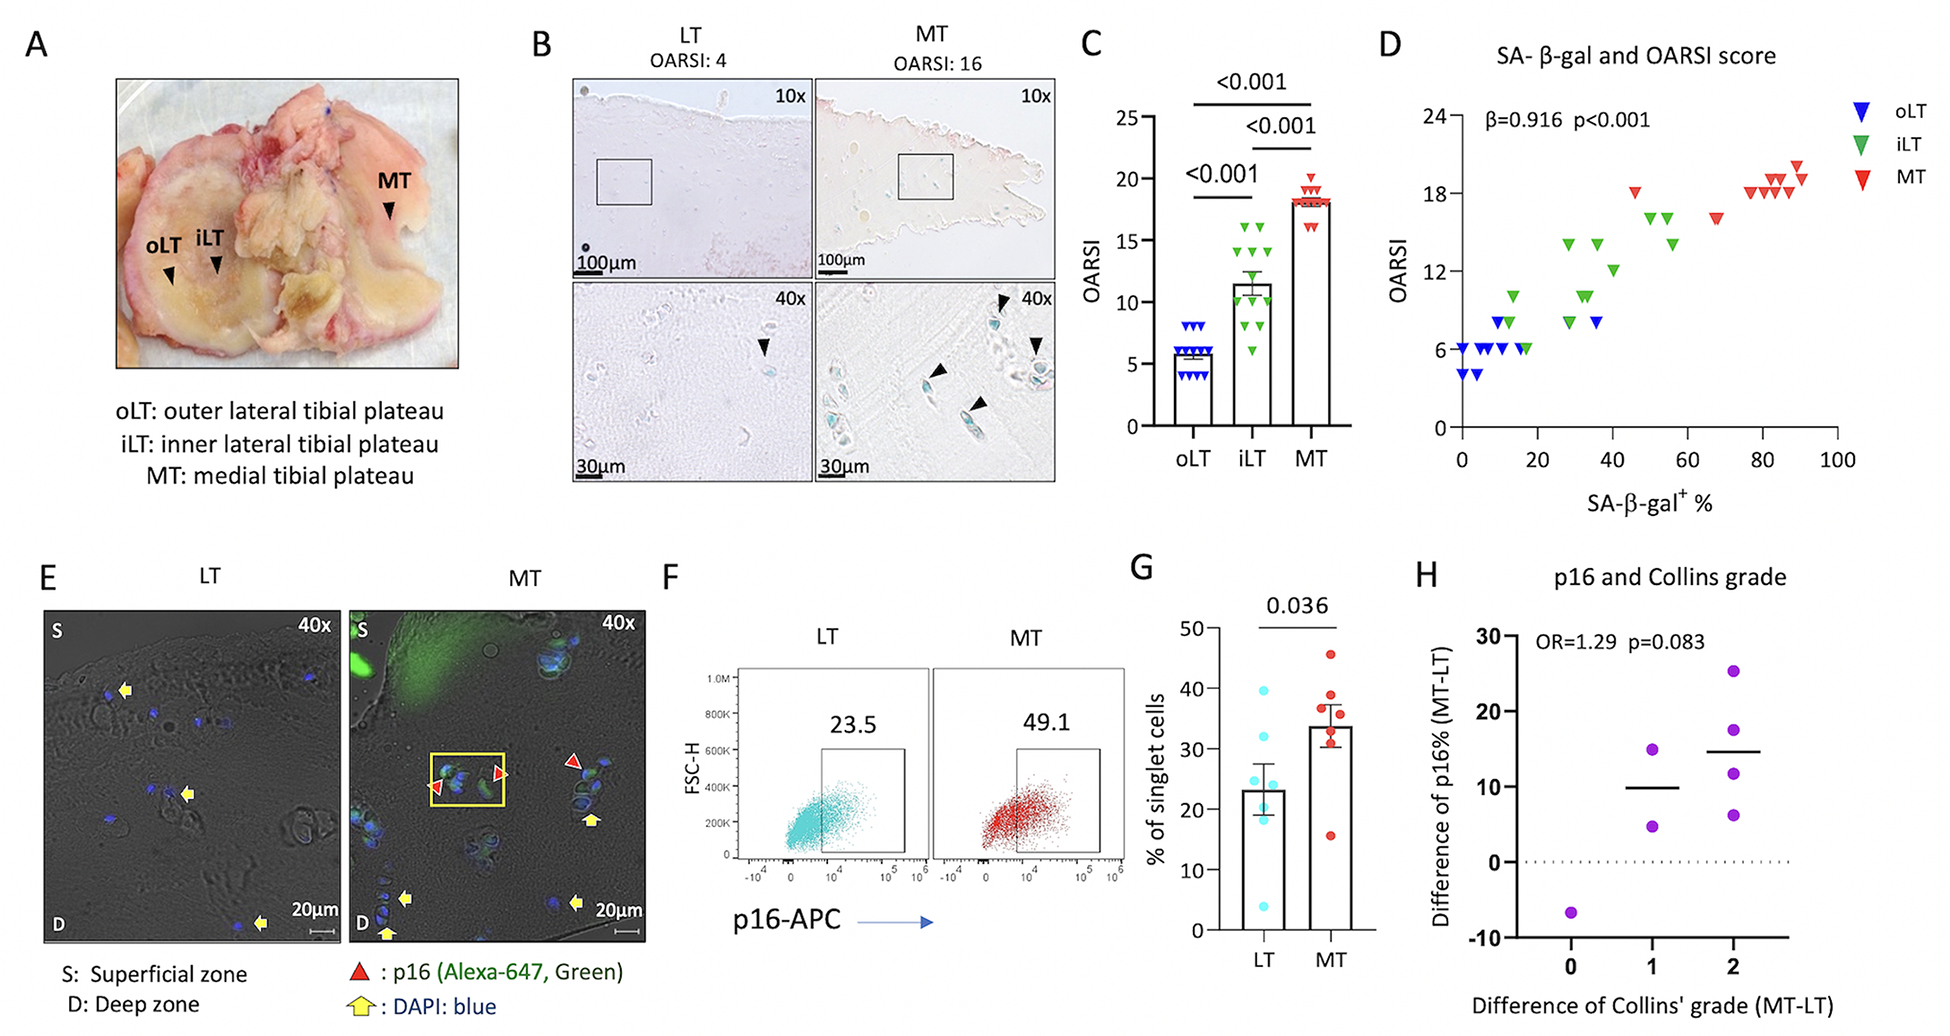
Data from 12 patients with medial compartment dominant OA. A) Human tibial plateau demonstrating the gradient of OA severity within an individual: MT>iLT>oLT severity of OA. B) Representative microscopic image demonstrating higher OARSI score of OA severity and SA-β-gal activity in MT than LT. C) OARSI score demonstrating MT>iLT>oLT OA severity (repeated measures ANOVA, n=12). D) Significant positive correlation of OARSI histological scores vs % SA-β-gal+ chondrocyte data scores (n=12). Shown are the correlation of raw values, however, for purposes of statistical analysis, these scores were transformed using a rank-based inverse normal transformation for use in mixed models yielding a significant correlation (β=0.916, p<0.001). p16 expression was qualitatively greater in MT than LT (representative immunofluorescence image in E); the percentage of p16+ chondrocytes by flow cytometry was greater in chondrocytes isolated from MT than LT (F, G, n=7). H) Dot plot demonstrating the correlation of difference in percentage of p16+ chondrocytes (MT-LT) and difference in Collins’ grade (MT-LT) (n=7).
DPP4 was associated with cellular senescence markers in OA chondrocytes
The mean frequency of primary human chondrocyte expression of DPP4 and two well-established senescence markers, SA-β-gal activity and p16, was 15.16±1.99%, 10.03±3.41% and 15.57±2.83%, respectively (Figures 2A, representative figure and 2B). The FITC channel used for SA-β-gal activity quantification revealed high autofluorescence of unstained cells. Gating on large cell size (relatively higher FSC-A and FSC-H), a measure used in the past to identify senescent chondrocytes (6, 20), we found a significantly higher mean percentage of DPP4, SA-β-gal activity and p16 expression in the large-sized compared to the small-sized subgroup of cells; expression of DPP4, SA-β-gal activity and p16 in large cells was 25.88±3.23%, 27.28±6.19% and 49.19±4.58% vs small cells 10.38±1.84%, 2.63±1.60% and 3.16±0.88%, respectively (Figures 2C representative figure and 2D). Higher autofluorescence was detected in the large-sized compared to the small-sized cell subgroup (Figure S1).
Figure 2. DPP4 expressing chondrocytes expressed high levels of traditional senescence markers, SA-β-gal and p16.
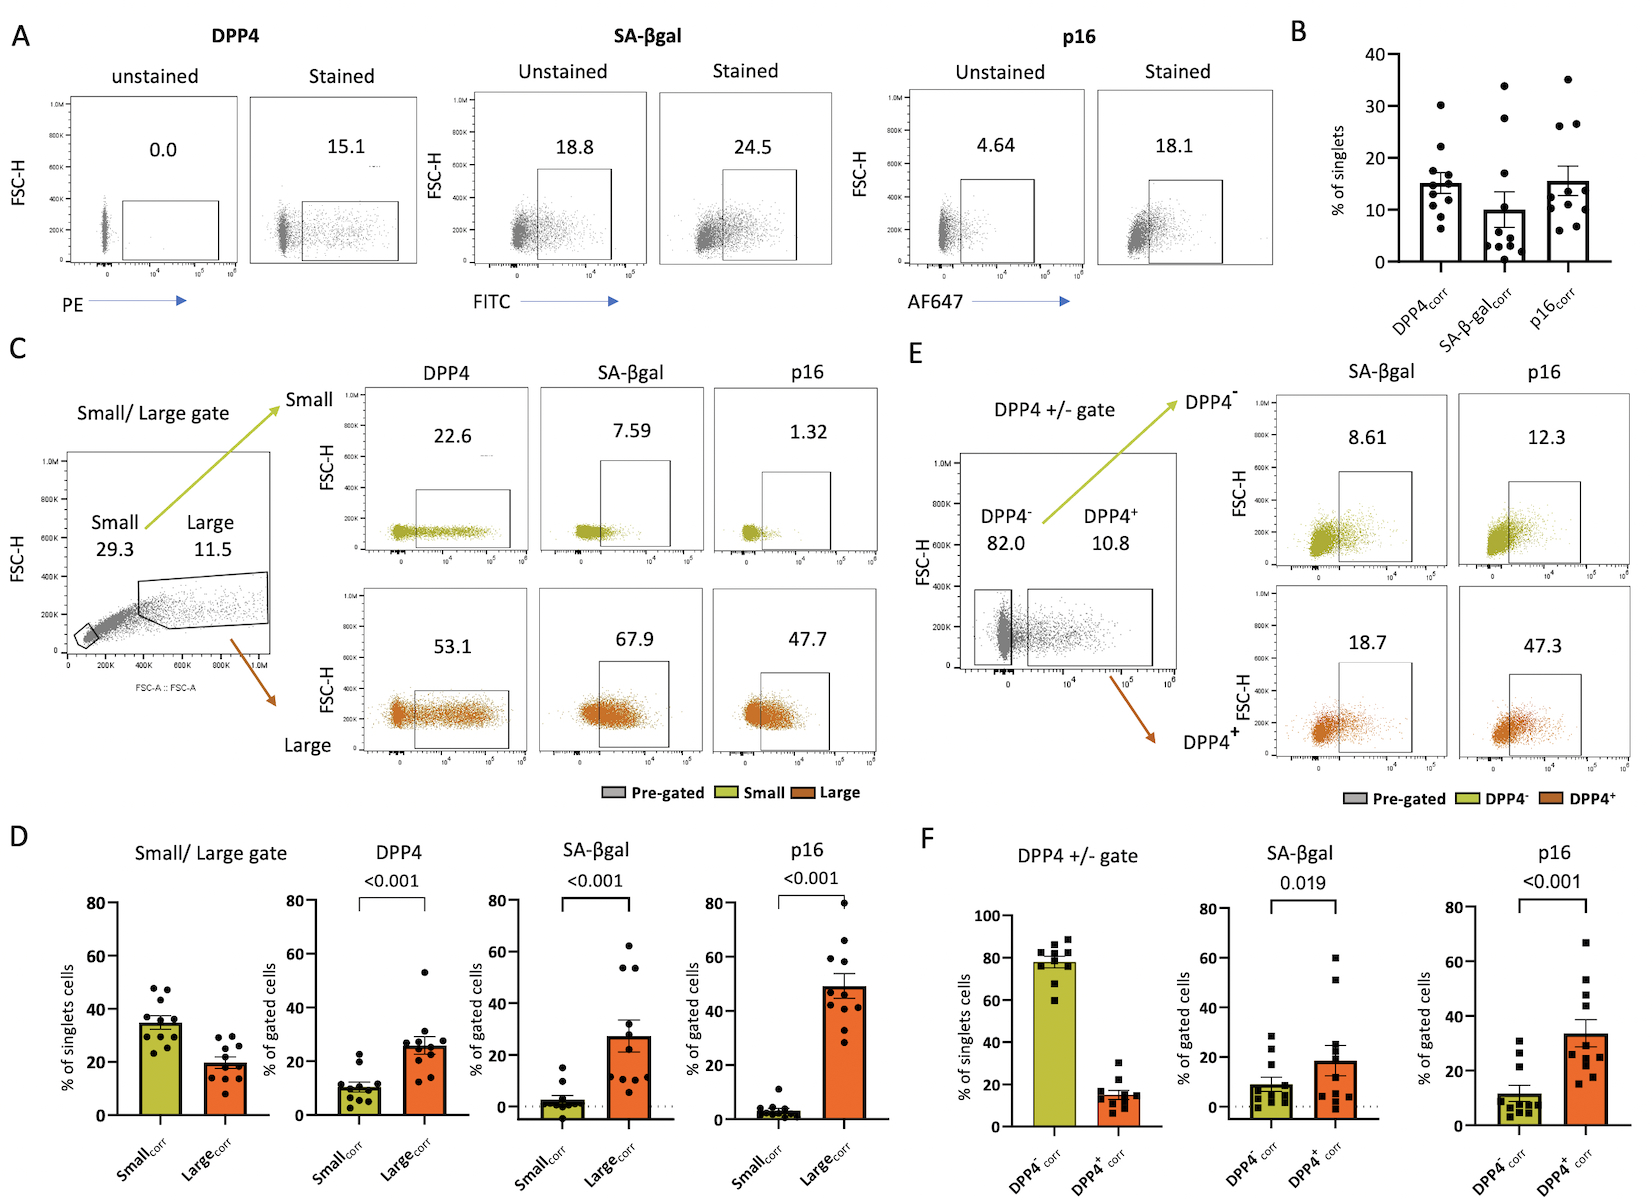
A) Representative flow-cytometry image of SA-β-gal activity, p16 and DPP4 expression in stained vs unstained chondrocytes. B) Bar graph depicting the percentage of DPP4, SA-β-Gal activity and p16 expression determined by flow cytometry (n=11). C) Representative flow-cytometry image of SA-β-gal activity, p16 and DPP4 expression in size-gated chondrocytes. D) Bar graphs depicting the higher expression of DPP4, SA-β-gal activity and p16 in large compared with small chondrocytes (n=11). E) Representative flow cytometry image demonstrating the higher expression of SA-β-gal activity and p16 expression in DPP4+ compared with DPP4− gated chondrocytes. F) Bar graph depicting a greater percentage of cells expressing DPP4, SA-β-Gal activity and p16 in DPP4+ compared with DPP4− chondrocytes (n=11).
DPP4 was co-expressed with SA-β-gal activity and p16 (Figure 2E). We observed a higher mean percentage of SA-β-gal activity and p16 expression in the DPP4+ (18.51±6.12% and 33.67±5.01%) compared to the DPP4− chondrocytes (8.98±2.89% and 11.68±2.93%) (Figure 2F). Our results demonstrate chondrocyte co-expression of traditional senescence markers, SA-β-gal activity and p16, with the new putative senescence surface marker, DPP4.
DPP4 expression in OA chondrocytes was associated with higher catabolic and lower anabolic gene expression
Using the FACS method, we successfully isolated DPP4+ and DPP4− cells, resulting in 91.74±2.48% DPP4+ chondrocytes in the DPP4+ sorted cell population compared with the pre-sorted (15.93±1.65%), and DPP4− sorted cell (0.90±0.53%) populations (Figures 3A and B). Compared to DPP4− chondrocytes, DPP4+ chondrocytes had higher gene expression of DPP4, ADAMTS5, MMP13, IL6 and IL8 (n=7, Figure 3C), lower gene expression of COL2A1, and ACAN, and higher secretion of SASPs including IL-6, IL-8, TNF-α and MMP-1 (Figure 3D). These findings demonstrate that chondrocyte DPP4 expression is associated with a lower expression of anabolic genes, higher expression of catabolic genes, and higher concentrations of secreted pro-inflammatory mediators. Moreover, DPP4+ chondrocytes secrete more soluble DPP4 than the DPP4− chondrocytes (Figure 3E).
Figure 3. Gene expression and SASPs secretion in osteoarthritic chondrocytes with differential DPP4 expression.
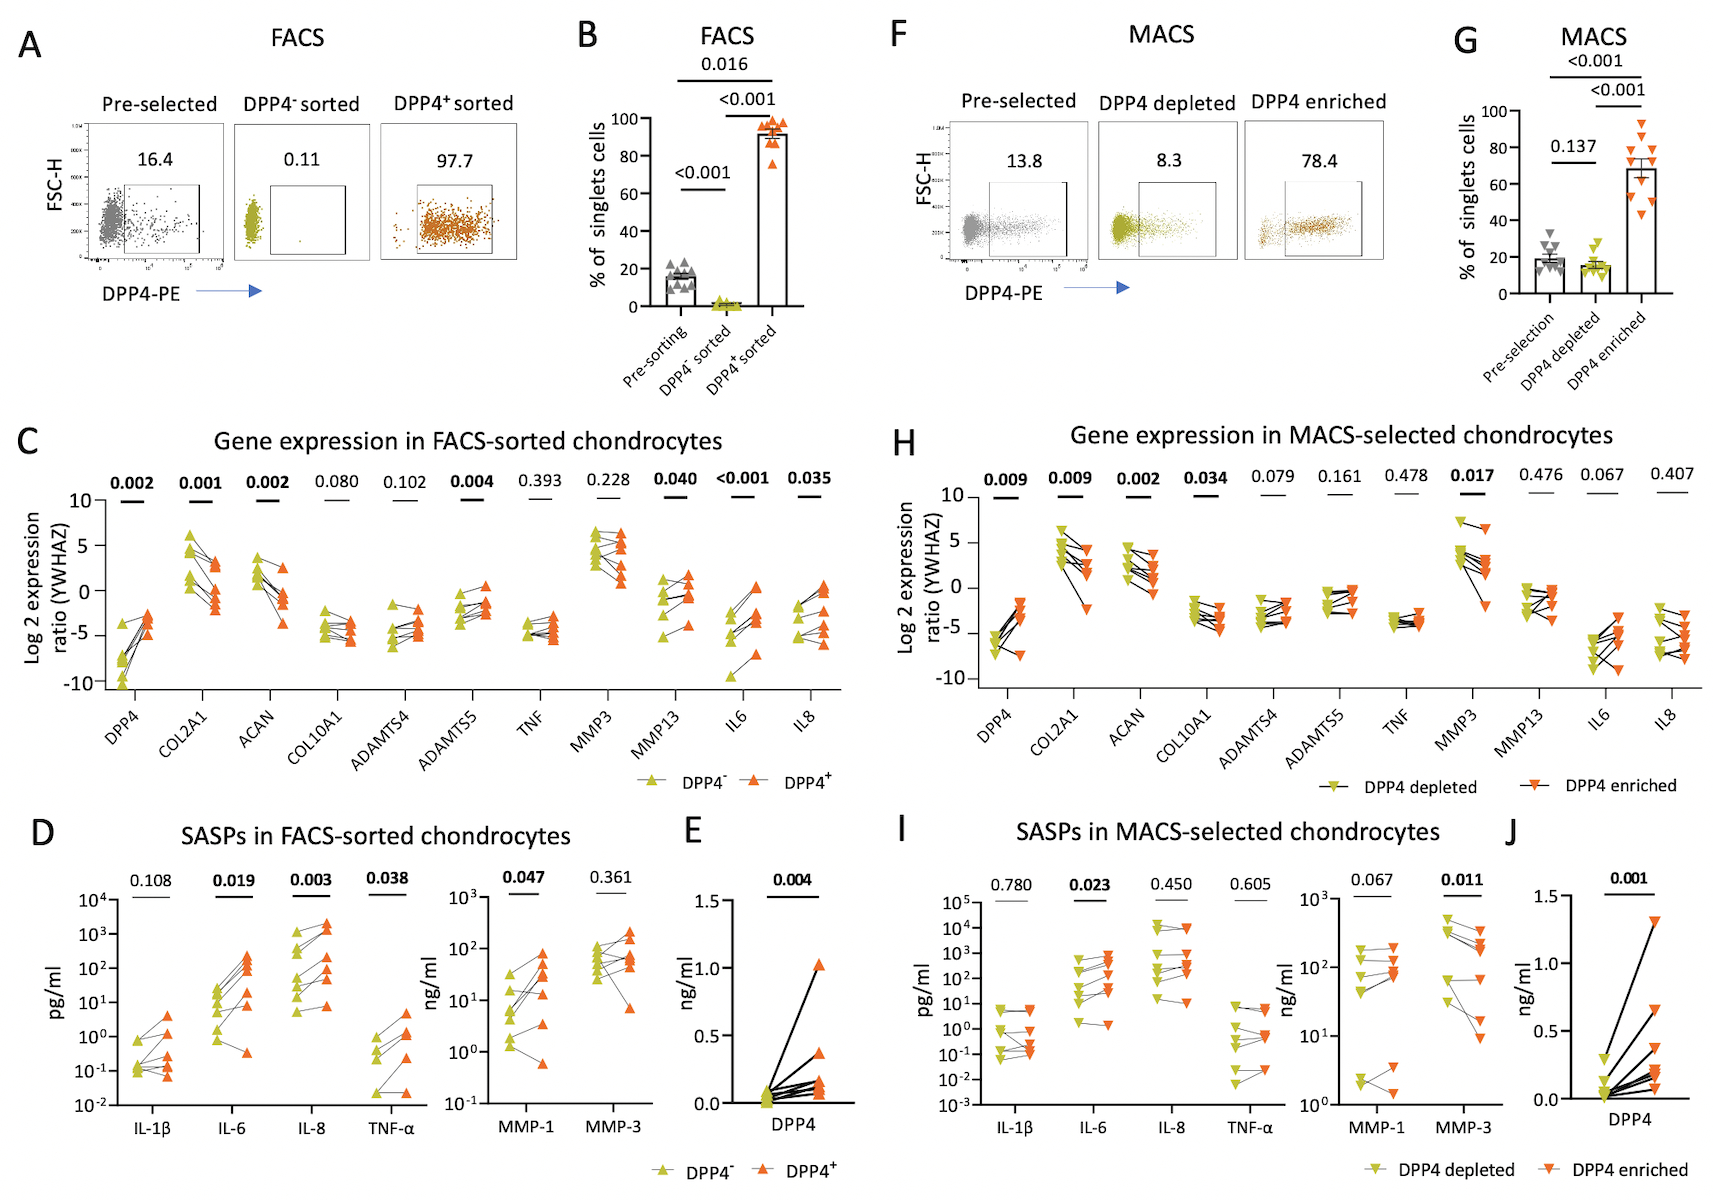
Chondrocytes were sorted based on DPP4 expression using fluorescence-activated cell sorting (FACS) and magnetic-activated cell sorting (MACS) in 16 patients. A) Representative scatterplots display enriched DPP4 expression in FACS-sorted DPP4+ compared with pre-selected, and DPP4− chondrocytes. B) Bar graph depicting a greater percentage of DPP4+ expressing cells in FACS-sorted DPP4+ compared with pre-selected, and DPP4− chondrocytes determined by flow cytometry (n=10). C) Gene expression in FACS-sorted DPP4− and DPP4+ chondrocytes relative to expression of the housekeeping YWHAZ control gene (n=7). D-E) The concentration of the indicated cytokines (I) and DPP4 (J) in the culture supernatants of FACS-sorted DPP4− and DPP4+ chondrocytes (n=7). F) Representative scatterplot displays DPP4 expression in pre-selected, and MACS-selected DPP4depleted and DPP4enriched chondrocytes. G) The percentage of DPP4+ expressing cells in pre-sorted, and MACS-selected DPP4depleted and DPP4enriched chondrocytes determined by flow cytometry (n=10). H) Gene expression in MACS-selected DPP4depleted and DPP4enriched chondrocytes relative to expression of the housekeeping YWHAZ control gene (n=7). I-J) The concentration of the indicated cytokines (I) and DPP4 (J) in the culture supernatants of MACS-selected DPP4depleted and DPP4enriched chondrocytes (n=7).
We next determined the efficiency of isolating DPP4+chondrocytes by the more accessible and cost-efficient MACS method (21). Using MACS, we successfully enriched the DPP4+ population resulting in 68.48±5.16% DPP4+ cells in the DPP4enriched cell component, compared with the pre-selected (19.19±2.22%) and DPP4depleted (15.55±1.90%) cell fractions (Figures 3F and G). Compared to the DPP4depleted chondrocytes, DPP4enriched chondrocytes had higher mean gene expression of DPP4 and lower mean gene expression of COL2A1, COL10A1, ACAN and MMP3 (Figure 3H). The mean IL6 gene expression from DPP4enriched chondrocytes was marginally higher than from DPP4depleted chondrocytes with a mean relative expression ratio 2.83±1.59, p=0.067; the mean IL-6 protein secreted from DPP4enriched chondrocytes was higher than from DPP4depleted chondrocytes (Figures 3I). MMP-1 protein secreted from DPP4enriched chondrocytes was marginally higher than from DPP4depleted chondrocytes with a mean difference of secretion of 12.07±5.41 ng/ml, p=0.067. Moreover, DPP4enriched chondrocytes, isolated by MACS, secreted more soluble DPP4 than the DPP4depleted chondrocytes (Figure 3J). We concluded that MACS is qualitatively similar but did not achieve the same level of DPP4 enrichment as FACS, so the associations of DPP4 with senescence and OA degradation related indices was stronger for FACS sorted cells.
Senescence-related genes were elevated in DPP4 enriched OA chondrocytes
A total of 33 out of 42 selected senescence-related genes were detected by the qRT-PCR array in OA chondrocytes sorted by FACS (Figure 4A); 9 genes (DAO, TP63, PRODH, EPN3, CDK1, E2F7, LY6D, SLC52A1 and SOX2) were under the detection limit. Among the 33 detectable genes, 15 genes were differentially expressed (defined by uncorrected p<0.05). Compared to DPP4− chondrocytes, DPP4+ chondrocytes had lower expression of genes BCL2, and PARP1, and higher expression of DPP4, PVRL4, IL6, CBX4, BAX, SIRT1, CSNK2A, E2F3, PCNA, RB1, CDK4, BMI1, and STAT3 (Figure 4B). Using FDR<5%, differences in IL6, DPP4, CBX4, BCL2 and BAX gene expression, all higher in DPP4+ compared with DPP4− chondrocytes, remained significant (Figure 4B). Taken together, these data demonstrate that DPP4 expression in osteoarthritic chondrocytes is related to senescence gene expression.
Figure 4. Senescence related genes in DPP4 expressing osteoarthritic chondrocytes.
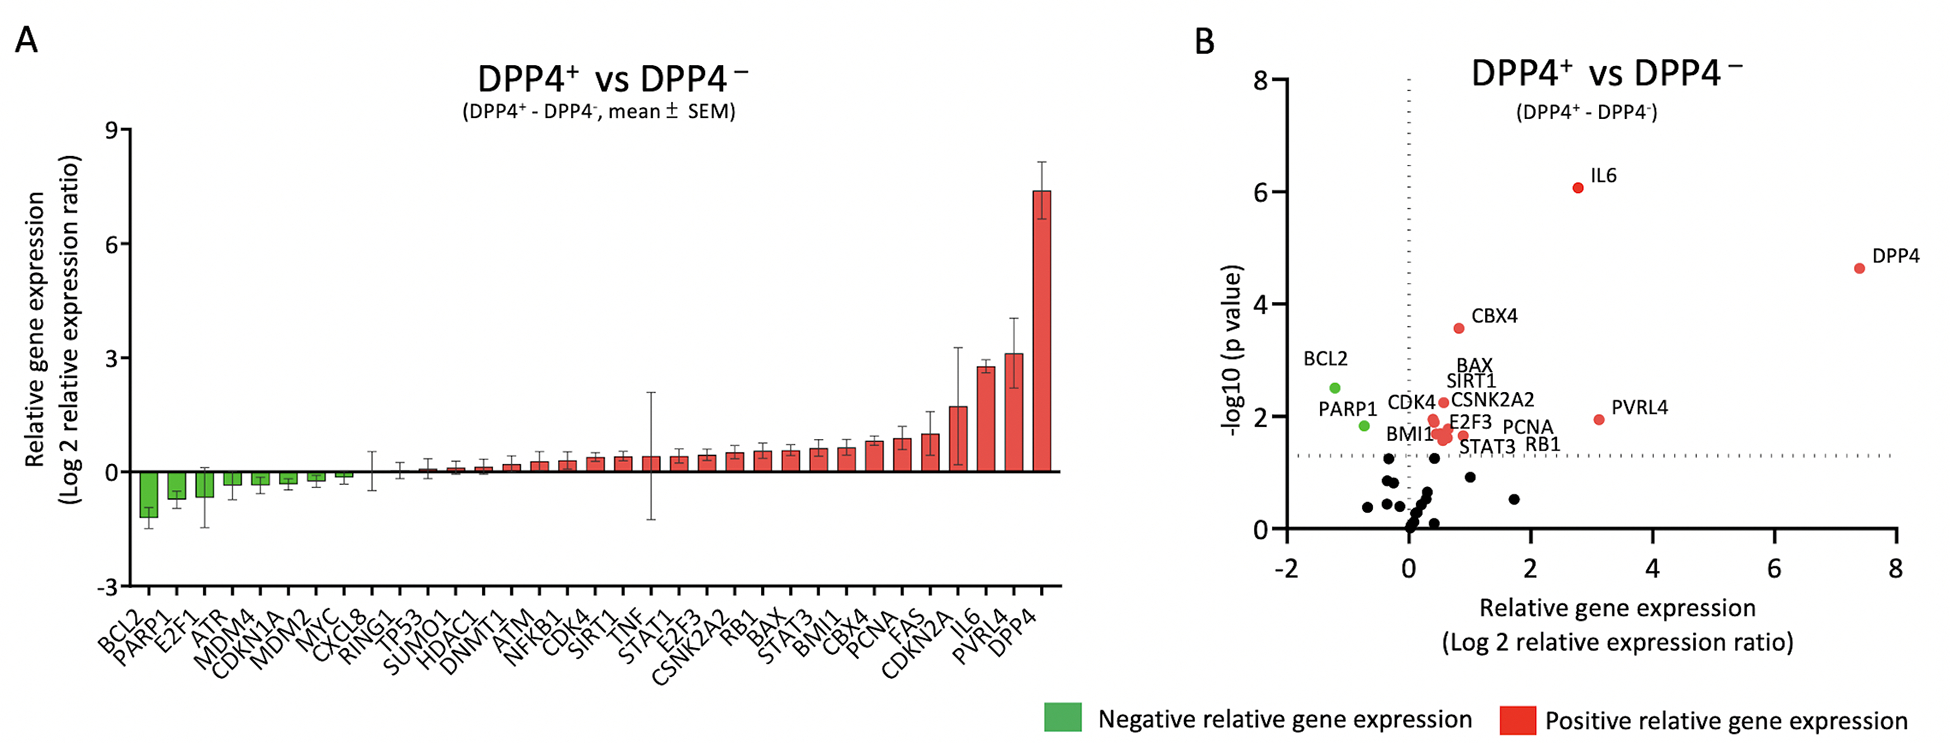
Osteoarthritic chondrocytes from 8 patients were sorted by DPP4 surface expression using FACS. A) Gene expression was ordered based on the relative differences between sorted DPP4+ and DPP4− chondrocytes. The relative mean (± SEM) difference in gene expression of DPP4+ minus DPP4− sorted osteoarthritic chondrocytes is shown for 33 senescence-related genes. B) Volcano plot of relative gene expression of DPP4+ vs DPP4− sorted chondrocytes demonstrating in DPP4+ a higher expression of DPP4, PVRL4, IL6, CBX4, BAX, SIRT1, CSNK2A, E2F3, PCNA, RB1, CDK4, BMI1, and STAT3 and lower expression of BCL2 and PARP1. Green: negative relative gene expression, red: positive relative gene expression.
SF DPP4 was associated with knee OA disease progression
To investigate the role of senescence in knee OA, we evaluated the association of soluble DPP4 in SF and plasma with baseline knee rOA severity and progression over three years (Figure 5A). Median DPP4 concentrations in plasma and SF were 395.1 ng/μl (range 259.9–595.6 ng/μl) and 137.2 ng/μl (range 72.3–510.1ng/μl), respectively; concentrations by KL grade and knee OA progression status are provided in Table S5. SF DPP4 was modestly associated with baseline OA KL grade (Figure 5B, and Table S6). Baseline SF DPP4 was also higher in knees with any progression compared with NP during a 3-year follow-up interval (Figure 5C). In an ordinal regression model, baseline SF DPP4 was associated with OA progression defined by outcome groups (NP, OST+JSN− progressor, OST+JSN+ progressor and TKR progressor) (Figure 5D, and Table S6). ROC analysis of SF DPP4 for the determination of progression to TKR versus all other outcomes yielded an area under the curve (AUC) of 0.743 (CI 0.557, 0.929); combined with baseline KL grade, the AUC increased to 0.804 (CI 0.667, 0.942).
Figure 5. Soluble DPP4 in knee OA severity and progression.
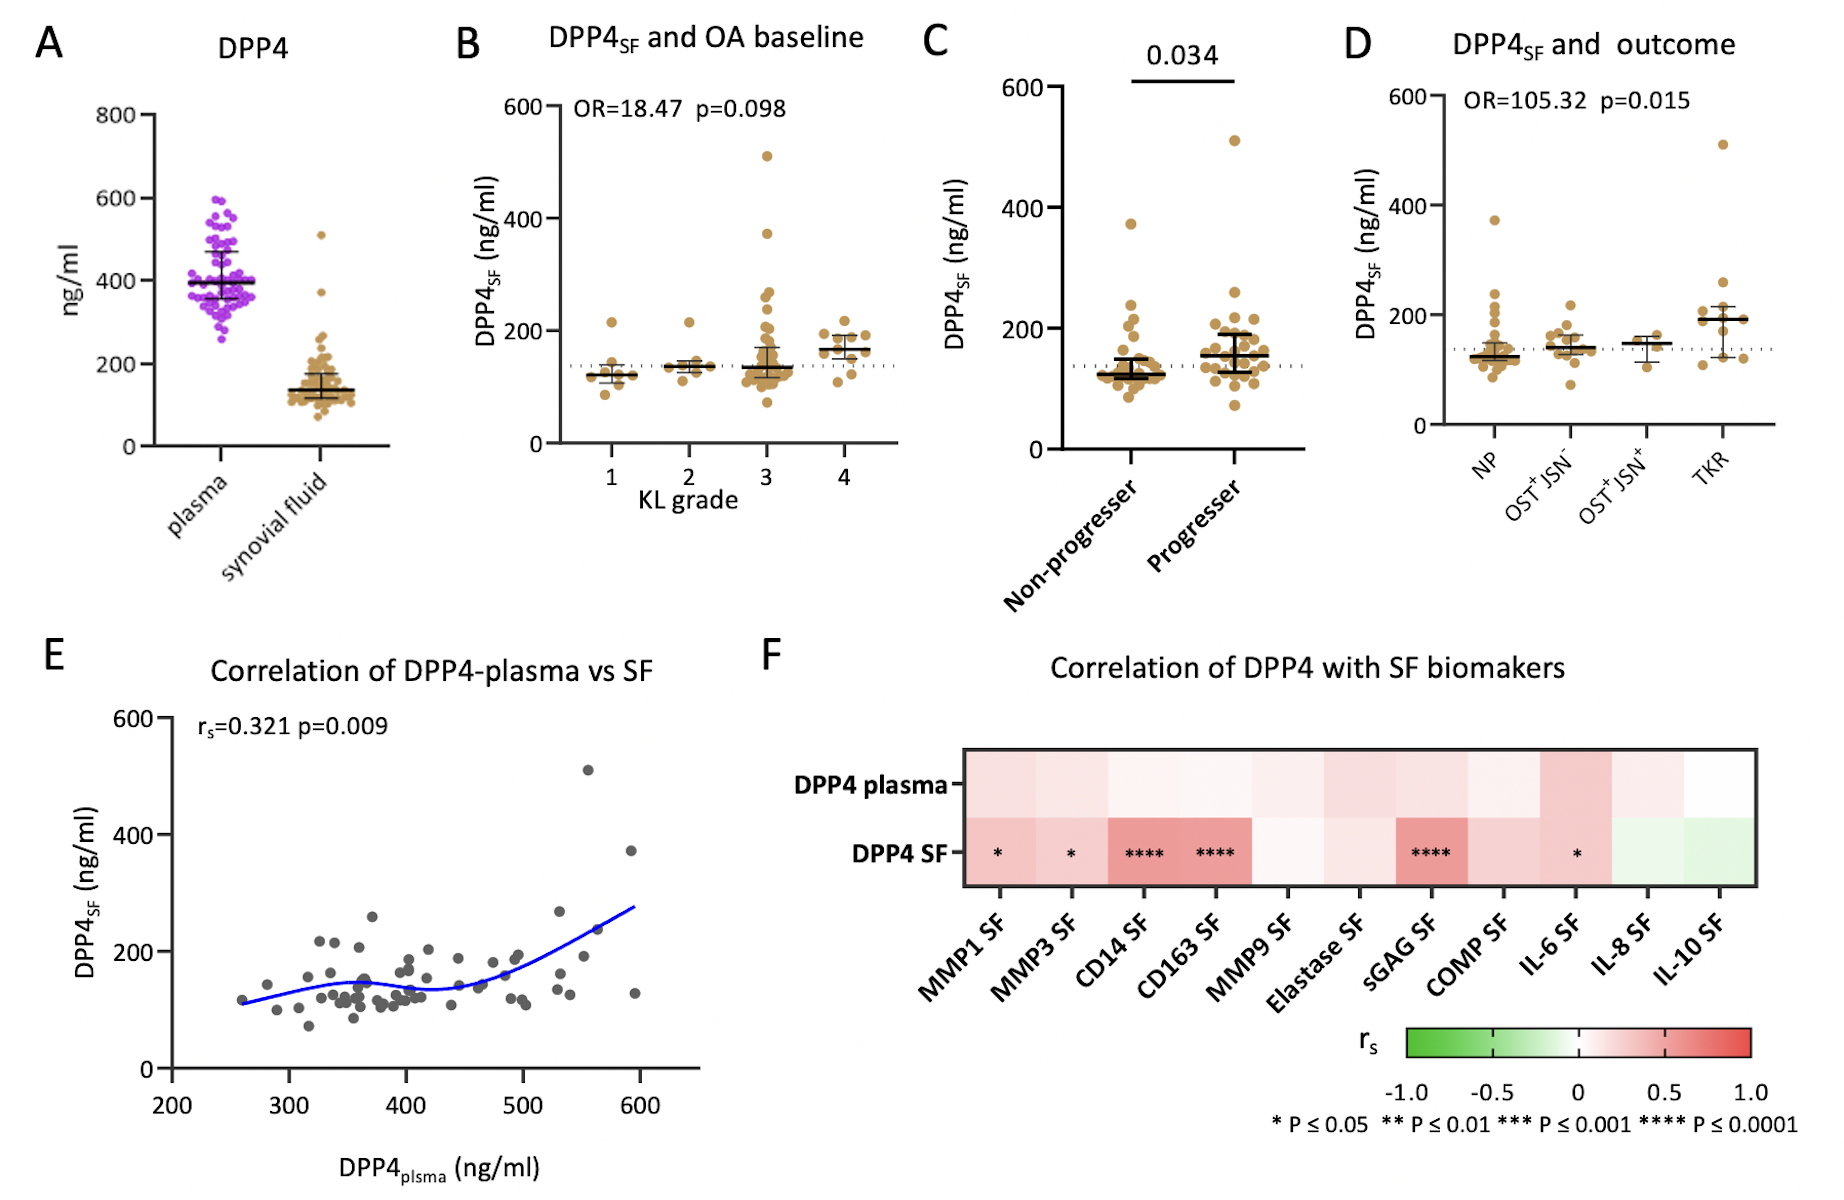
A) Plasma DPP4 concentration (purple) was higher than median SF DPP4 concentration (brown) (dot plot representing the median and interquartile ranges of DPP4 concentration; n=65 SF and matched plasma). B) SF DPP4 was modestly associated with baseline OA severity represented by KL grade (n=65, Odds ratio=18.47, p=0.098). C) Dot plot demonstrating higher SF DPP4 in the progressor group (defined as any progression), which included OST progression only (OST+/JSN−), or OST and JSN progression (OST+JSN+), or TKR during the follow-up interval (n=29), compared with the non-progressor group who had neither OST nor JSN increased scores, nor TKR performed during the follow-up interval (n=28), (Mann-Whitney test, p=0.034). D) SF DPP4 was significantly associated with OA progression (N=57, OR=105.35, p=0.015) defined by outcome groups (NP, OST+JSN−, OST+JSN+ and TKR). E) Dot plot with a spline line demonstrating the positive correlation between plasma DPP4 and synovial fluid DPP4 (n=65, rs=0.321 p=0.009). F) SF but not plasma DPP4 correlated significantly with several other OA-related biomarkers in SF.
To investigate the relationship between soluble DPP4 and knee OA pathology, we analyzed the correlation of SF DPP4 with other SF biomarkers. SF DPP4 was associated with SF MMP-1, MMP-3, CD14, CD163, sGAG, and IL-6 but not SF elastase, IL-8 or IL-10 (Figure 5F). Although SF and plasma DPP4 were correlated (Figure 5E), plasma DPP4 was not associated with knee OA severity or progression based on the sum of the baseline KL grade and the sum of the KL change scores, respectively (Figure S2A and B).
Discussion
In this study, we investigated the relationship of membrane expressed DPP4 with chondrocyte senescence and the association of soluble DPP4 with OA severity and progression. Chondrocyte expression of DPP4 was associated with cellular senescence indicated by well-established senescence biomarkers, including SA-β-gal activity, p16 protein expression, and SASPs secretion. In addition, DPP4 expression was associated with senescence-related genes (higher DPP4, PVRL4, IL6, CBX4, BAX, SIRT1, CSNK2A, E2F3, PCNA, RB1, CDK4, BMI1, and STAT3 and lower BCL2 and PARP1), higher catabolic gene expression (ADAMTS5, MMP13, IL6, and IL8), and lower anabolic gene expression (COL2A1 and ACAN). Soluble DPP4 in SF was associated with rOA progression, proteases (SF MMP-1 and −3), aggrecan degradation (sGAG), indicators of activated macrophages (SF CD14 and CD163), and inflammation (SF IL-6). Taken together, our results show that senescent chondrocytes express and secrete DPP4 and that in turn, DPP4 is a strong indicator of a senescent chondrocyte phenotype.
Although senescent chondrocytes have been identified as a major factor in the pathogeneses of OA (2), the overall burden of senescent chondrocytes in OA is unclear. Here, based on SA-β-gal activity and p16 expression, we identified a higher percentage of senescent cells in the medial peri-lesional cartilage, compared with the non-lesioned OA cartilage with around 78% senescent cell burden by SA-β-gal activity and 34% by p16 protein expression. Surface expression of DPP4, SA-β-gal activity and intracellular expression of p16 yielded a similar overall average burden of senescent chondrocytes in the whole joint cartilage (15%, 10% and 16%, respectively).
Previous literature is inconsistent with respect to the association of DPP4 expression and OA severity. One study reported decreased DPP4 surface expression with progressive OA cartilage lesions (22), whereas other studies found a significantly increased gene expression of DPP4 in OA compared to normal cartilage (23, 24). Here we found that DPP4 expressing chondrocytes were notable for multiple senescence features including higher SASPs secretion (IL-6, IL-8, TNF-α and MMP-1), higher catabolic genes (IL6, IL8, ADAMTS5 and MMP13) and lower extracellular matrix gene expression (COL2A1 and ACAN) (25, 26). Our results are consistent with prior studies showing an association of DPP4 protein expression with IL6 and MMP13 gene expression in mouse OA models (27, 28). We speculate that the higher mean expression of DPP4 protein in senescent OA chondrocytes may be transcriptionally regulated, at least in part, since DPP4+ chondrocytes had a higher mean level of DPP4 gene expression than DPP4− chondrocytes. STA1α, HNF and LncRNA-OIS1 increase DPP4 transcription in cancerous B cells, intestinal epithelial cells, and oncogene-induced senescence in the BJ fibroblast model, respectively (29–32). Whether the DPP4 increase in OA chondrocytes may be mediated via transcription factors HNF, STAT1α and/ or LncRNA-OIS1, needs further investigation.
In this study, DPP4 is identified as a surface marker for senescent chondrocytes but additional research is required to determine if DPP4 is a mediator or countermeasure of senescence in OA. A wealth of accumulating data support a role of DPP4 as a mediator of senescence; much of these data have been gleaned through the use of available DPP4 inhibitors (DPP4i) (33–35). Although the FDA announced a safety concern regarding the potential for DPP4i to cause arthralgia/arthritis (36), related studies showed inconsistent findings (37–40). Several in vitro studies demonstrate the ability of DPP4 inhibitors to reduce inflammation-induced cartilage degradation and senescence. The DPP4i, gemigliptin, protected IL-1β stimulated chondrocytes from type 2 collagen degradation by decreasing MMP-1, MMP-3 and MMP-13 through inhibition of the NF-kB pathway (41). The DPP4i, vildagliptin, protected chondrocytes from TNF-α-induced senescence by decreasing p21, p53, and SA-βgal (34). Moreover, inhibition of DPP4 with siRNA decreased SA-βgal and activated Sirt 1 in IL-1β stimulated chondrocytes (27). Taken together, these findings suggest that DPP4 could be a target for treatment of OA.
Independent of whether DPP4 is a mediator or countermeasure of arthritis, as shown here, it is a biomarker of senescent chondrocytes whose cell surface form could potentially be used to target senescent chondrocytes for selective modification with senomorphics or elimination with senolytics, for instance, using an anti-DPP4 antibody. The feasibility of this approach has been demonstrated by the elimination of anti-DPP4 labelled senescent WI-38 through antibody-dependent cell-mediated cytotoxicity (ADCC) by NK cells (9), and by ADCC elicited with an anti-DPP4 (CD26) monoclonal antibody (YS110) against cancer cells with recent investigation in clinical trials of malignant mesothelioma (42–44). Moreover, as demonstrated by our study, SF DPP4 might serve as a companion diagnostic to identify individuals best suited to DPP4 targeted therapy, particularly for OA resulting from cellular senescence etiologies.
Here, we found both MACS and FACS successfully enriched DPP4+ chondrocytes and achieved a stable phenotype of DPP4+ chondrocytes that had lower gene expression of COL2A1 and ACAN, and higher IL6 gene and protein secretion. There were some differences in gene expression and cytokine production between the two DPP4 enrichment methods that are likely related to the purity of DPP4+ chondrocytes (greater by FACS).
We found that DPP4+ chondrocytes produced higher amounts of soluble DPP4 compared to DPP4− chondrocytes, indicating that chondrocytes are a source of soluble DPP4 in synovial fluid. Prior studies showed that soluble DPP4 is generated by MMP-mediated cleavage of DPP4 from cell membranes (45). Membrane-bound DPP4 interacts with the extracellular matrix and facilitates the secretion of MMPs, which causes further extracellular matrix breakdown and release of soluble DPP4 (46, 47). Consistently, we found that DPP4+ chondrocytes produced higher amounts of MMP-1. Moreover, SF DPP4 was positively associated with SF MMP-1, MMP-3 and sGAG. These findings provide evidence to support our observation of the positive association between baseline SF DPP4 and structural rOA progression. We also found that SF DPP4 was associated with SF CD14 and SF CD163, which are considered markers of macrophage involvement of OA (10). Interestingly, DPP4 was not associated with SF elastase and SF MMP-9, which are considered markers of neutrophil involvement of OA (16). SF DPP4 was positively associated with plasma DPP4. The median concentration of DPP4 in plasma was 2.9-fold higher than SF, supporting, in addition to chondrocytes, multiple tissue origins (widely in the body, and enriched in endocrine organs, the gastrointestinal and genitourinary tract) of DPP4 as documented in the human protein atlas (48). The multiple tissue origins of plasma DPP4 provide a plausible explanation for the lack of association of plasma DPP4 with knee rOA severity or progression.
There were several limitations of this study. To avoid the strong autofluorescence of freshly isolated chondrocytes that could interfere with flow cytometric analyses, chondrocytes were cultured in vitro for 3 days before evaluating co-expression of DPP4 with SA-β-gal activity and p16. While in vitro culture might impact chondrocyte phenotypes, the senescent phenotype was similar between gated DPP4+ chondrocytes (cultured for 3 days) and sorted DPP4+ chondrocytes (freshly isolated). Due to the limited number of chondrocytes available from TKR samples, we were unable to use the same samples for flow-cytometry analysis, gene expression, SASPs secretion and qRT-PCR array. Although these limitations existed, the consistency of association of DPP4 with senescence and inflammation profiles across different patient samples suggests the generalizability of results. Although sex plays a role in rheumatoid arthritis and hand, knee, and hip OA (49), we did not find sex related differences for any of our markers (data not shown); however, failure to identify sex differences could be limited by our sample size. We explored the association of DPP4 with senescence related genes by qRT-PCR array; while other pathways or genes may relate to the inflammation phenotype of DPP4, a non-biased approach, such as RNA seq, would be worthy of future study. A recent study showed that mouse joint injury gave rise to a DPP4+ mesenchymal progenitor cell from the synovial lining that highly expressed PRG4 (lubricin), but also Rspo2 (R-spondin 2), which promoted pathological crosstalk between synovial fibroblasts, macrophages and chondrocytes (50). Moreover, treatment of IL-1β stimulated synovial fibroblasts from a healthy donor with the DPP4 inhibitor, Alogliptin, decreased production of reactive oxygen species, expression of MMP-3 and MMP-13, and secretion of TNF-α, IL-6, and IL-8 (51). In contrast, DPP4 overexpression in synovial fibroblasts from rheumatoid arthritis patients decreased IL-1β, IL-6, and IL-13, and increased IL-10 synthesis (52). These data suggest that the context of DPP4 expression may determine whether it could function as a possible mediator or a countermeasure for arthritis; further study of human synovial fibroblasts, healthy and OA, will be necessary to guide the therapeutic use of DPP4.
In summary, our study suggests that surface DPP4 expression is associated with the senescence phenotype of OA chondrocytes. We validated DPP4 as a senescence marker in OA; its expression on the chondrocyte cell surface provides a novel way to identify, isolate and target OA senescent chondrocytes, while its expression in SF provides a biomarker of OA senescence that predicts OA structural worsening. To our knowledge, this is the first demonstration that SF DPP4 is a biomarker of risk of OA progression.
Supplementary Material
Acknowledgments
Funded in part by a student grant from government of Taiwan (Y-HC), NIH/NIA P30-AG028716 (M-FH and VBK) and NIH/NIA R01AG070146 (VBK and XZ).
Footnotes
Conflicts of Interest
All authors declare that there are no conflicts of interest associated with this study.
Data Availability
Data are available within the article or its supplementary materials.
References
- 1.Kumari R, Jat P. Mechanisms of Cellular Senescence: Cell Cycle Arrest and Senescence Associated Secretory Phenotype. Frontiers in Cell and Developmental Biology. 2021;9(485). [DOI] [PMC free article] [PubMed] [Google Scholar]
- 2.McCulloch K, Litherland GJ, Rai TS. Cellular senescence in osteoarthritis pathology. Aging Cell. 2017;16(2):210–8. [DOI] [PMC free article] [PubMed] [Google Scholar]
- 3.Price JS, Waters JG, Darrah C, Pennington C, Edwards DR, Donell ST, et al. The role of chondrocyte senescence in osteoarthritis. Aging Cell. 2002;1(1):57–65. [DOI] [PubMed] [Google Scholar]
- 4.Diekman BO, Sessions GA, Collins JA, Knecht AK, Strum SL, Mitin NK, et al. Expression of p16(INK) (4a) is a biomarker of chondrocyte aging but does not cause osteoarthritis. Aging cell. 2018;17(4):e12771–e. [DOI] [PMC free article] [PubMed] [Google Scholar]
- 5.Philipot D, Guérit D, Platano D, Chuchana P, Olivotto E, Espinoza F, et al. p16INK4a and its regulator miR-24 link senescence and chondrocyte terminal differentiation-associated matrix remodeling in osteoarthritis. Arthritis Research & Therapy. 2014;16(1):R58. [DOI] [PMC free article] [PubMed] [Google Scholar]
- 6.Jeon OH, Wilson DR, Clement CC, Rathod S, Cherry C, Powell B, et al. Senescence cell–associated extracellular vesicles serve as osteoarthritis disease and therapeutic markers. JCI insight. 2019;4(7). [DOI] [PMC free article] [PubMed] [Google Scholar]
- 7.Shao S, Xu Q, Yu X, Pan R, Chen Y. Dipeptidyl peptidase 4 inhibitors and their potential immune modulatory functions. Pharmacol Ther. 2020;209:107503. [DOI] [PMC free article] [PubMed] [Google Scholar]
- 8.Röhrborn D, Wronkowitz N, Eckel J. DPP4 in Diabetes. Frontiers in Immunology. 2015;6. [DOI] [PMC free article] [PubMed] [Google Scholar]
- 9.Kim KM, Noh JH, Bodogai M, Martindale JL, Yang X, Indig FE, et al. Identification of senescent cell surface targetable protein DPP4. Genes Dev. 2017;31(15):1529–34. [DOI] [PMC free article] [PubMed] [Google Scholar]
- 10.Daghestani HN, Pieper CF, Kraus VB. Soluble macrophage biomarkers indicate inflammatory phenotypes in patients with knee osteoarthritis. Arthritis Rheumatol. 2015;67(4):956–65. [DOI] [PMC free article] [PubMed] [Google Scholar]
- 11.Collins D The Pathology of Articular and Spinal Diseas Edward Arnold Co. London; 1949. [Google Scholar]
- 12.Pritzker KPH, Gay S, Jimenez SA, Ostergaard K, Pelletier JP, Revell PA, et al. Osteoarthritis cartilage histopathology: grading and staging. Osteoarthritis and cartilage. 2006;14(1):13–29. [DOI] [PubMed] [Google Scholar]
- 13.Altman RD, Gold GE. Atlas of individual radiographic features in osteoarthritis, revised. Osteoarthritis and Cartilage. 2007;15:A1–A56. [DOI] [PubMed] [Google Scholar]
- 14.McDaniel G, Renner JB, Sloane R, Kraus VB. Association of knee and ankle osteoarthritis with physical performance. Osteoarthritis Cartilage. 2011;19(6):634–8. [DOI] [PMC free article] [PubMed] [Google Scholar]
- 15.Chen Y-H, Zhang X, Ko K-Y, Hsueh M-F, Kraus VB. CBX4 Regulates Replicative Senescence of WI-38 Fibroblasts. Oxidative Medicine and Cellular Longevity. 2022;2022:5503575. [DOI] [PMC free article] [PubMed] [Google Scholar]
- 16.Hsueh M-F, Zhang X, Wellman SS, Bolognesi MP, Kraus VB. Synergistic Roles of Macrophages and Neutrophils in Osteoarthritis Progression. Arthritis & Rheumatology. 2021;73(1):89–99. [DOI] [PMC free article] [PubMed] [Google Scholar]
- 17.McCaw ZR, Lane JM, Saxena R, Redline S, Lin X. Operating characteristics of the rank-based inverse normal transformation for quantitative trait analysis in genome-wide association studies. Biometrics. 2020;76(4):1262–72. [DOI] [PMC free article] [PubMed] [Google Scholar]
- 18.Chou CH, Lee MTM, Song IW, Lu LS, Shen HC, Lee CH, et al. Insights into osteoarthritis progression revealed by analyses of both knee tibiofemoral compartments. Osteoarthritis and cartilage. 2015;23(4):571–80. [DOI] [PMC free article] [PubMed] [Google Scholar]
- 19.Chou CH, Lee CH, Lu LS, Song IW, Chuang HP, Kuo SY, et al. Direct assessment of articular cartilage and underlying subchondral bone reveals a progressive gene expression change in human osteoarthritic knees. Osteoarthritis and cartilage. 2013;21(3):450–61. [DOI] [PMC free article] [PubMed] [Google Scholar]
- 20.Gorbunova V, Seluanov A, Pereira-Smith OM. Evidence That High Telomerase Activity May Induce a Senescent-like Growth Arrest in Human Fibroblasts*. Journal of Biological Chemistry. 2003;278(9):7692–8. [DOI] [PubMed] [Google Scholar]
- 21.Pan J, Wan J. Methodological comparison of FACS and MACS isolation of enriched microglia and astrocytes from mouse brain. Journal of Immunological Methods. 2020;486:112834. [DOI] [PubMed] [Google Scholar]
- 22.Lapadula G, Iannone F, Zuccaro C, Covelli M, Patella V, Lobianco G, et al. Expression of membrane-bound peptidases (CD10 and CD26) on human articular chondrocytes. Possible role of neuropeptidases in the pathogenesis of osteoarthritis. Clin Exp Rheumatol. 1995;13(2):143–8. [PubMed] [Google Scholar]
- 23.Swingler TE, Waters JG, Davidson RK, Pennington CJ, Puente XS, Darrah C, et al. Degradome expression profiling in human articular cartilage. Arthritis Res Ther. 2009;11(3):R96. [DOI] [PMC free article] [PubMed] [Google Scholar]
- 24.Patel A The role of novel transmembrane serine proteases: implications for arthritis: Newcastle University; 2011. [Google Scholar]
- 25.Jeon OH, David N, Campisi J, Elisseeff JH. Senescent cells and osteoarthritis: a painful connection. The Journal of Clinical Investigation. 2018;128(4):1229–37. [DOI] [PMC free article] [PubMed] [Google Scholar]
- 26.Loeser RF. Aging and osteoarthritis: the role of chondrocyte senescence and aging changes in the cartilage matrix. Osteoarthritis and Cartilage. 2009;17(8):971–9. [DOI] [PMC free article] [PubMed] [Google Scholar]
- 27.Wang K, Chen X, Chen Y, Sheng S, Huang Z. Grape seed procyanidins suppress the apoptosis and senescence of chondrocytes and ameliorates osteoarthritis via the DPP4-Sirt1 pathway. Food & Function. 2020;11(12):10493–505. [DOI] [PubMed] [Google Scholar]
- 28.Jeon OH, Kim C, Laberge R-M, Demaria M, Rathod S, Vasserot AP, et al. Local clearance of senescent cells attenuates the development of post-traumatic osteoarthritis and creates a pro-regenerative environment. Nature Medicine. 2017;23:775. [DOI] [PMC free article] [PubMed] [Google Scholar]
- 29.Bauvois B, Djavaheri-Mergny M, Rouillard D, Dumont J, Wietzerbin J. Regulation of CD26/DPPIV gene expression by interferons and retinoic acid in tumor B cells. Oncogene. 2000;19(2):265–72. [DOI] [PubMed] [Google Scholar]
- 30.Erickson RH, Lai RS, Kim YS. Role of Hepatocyte Nuclear Factor 1α and 1β in the Transcriptional Regulation of Human Dipeptidyl Peptidase IV during Differentiation of Caco-2 Cells. Biochemical and Biophysical Research Communications. 2000;270(1):235–9. [DOI] [PubMed] [Google Scholar]
- 31.D’Angelo A, Bluteau O, Garcia-Gonzalez MA, Gresh L, Doyen A, Garbay S, et al. Hepatocyte nuclear factor 1α and β control terminal differentiation and cell fate commitment in the gut epithelium. Development. 2010;137(9):1573–82. [DOI] [PubMed] [Google Scholar]
- 32.Li L, van Breugel PC, Loayza-Puch F, Ugalde AP, Korkmaz G, Messika-Gold N, et al. LncRNA-OIS1 regulates DPP4 activation to modulate senescence induced by RAS. Nucleic Acids Res. 2018;46(8):4213–27. [DOI] [PMC free article] [PubMed] [Google Scholar]
- 33.Xin M, Jin X, Cui X, Jin C, Piao L, Wan Y, et al. Dipeptidyl peptidase-4 inhibition prevents vascular aging in mice under chronic stress: Modulation of oxidative stress and inflammation. Chemico-Biological Interactions. 2019;314:108842. [DOI] [PubMed] [Google Scholar]
- 34.Bi J, Cai W, Ma T, Deng A, Ma P, Han Y, et al. Protective effect of vildagliptin on TNF-α-induced chondrocyte senescence. IUBMB Life. 2019;71(7):978–85. [DOI] [PubMed] [Google Scholar]
- 35.Wang T, Yang L, Liang Z, Wang L, Su F, Wang X, et al. Targeting cellular senescence prevents glucocorticoid-induced bone loss through modulation of the DPP4-GLP-1 axis. Signal Transduction and Targeted Therapy. 2021;6(1):143. [DOI] [PMC free article] [PubMed] [Google Scholar]
- 36.FDA drug safety communication: FDA warns that DPP-4 inhibitors for type 2 diabetes may cause severe joint pain. http://wwwfdagov/Drugs/DrugSafety/ucm459579htm. 2015.
- 37.Park T, Bresnahan M, Griggs SK, Chen J, Cho AH, Gousse Y, et al. Comparative risk of musculoskeletal adverse reactions among new users of dipeptidyl peptidase-4 inhibitors: A retrospective cohort study. Exploratory Research in Clinical and Social Pharmacy. 2021;2:100022. [DOI] [PMC free article] [PubMed] [Google Scholar]
- 38.Kathe N, Shah A, Said Q, Painter JT. DPP-4 Inhibitor-Induced Rheumatoid Arthritis Among Diabetics: A Nested Case-Control Study. Diabetes Ther. 2018;9(1):141–51. [DOI] [PMC free article] [PubMed] [Google Scholar]
- 39.Douros A, Abrahami D, Yin H, Yu OHY, Renoux C, Hudson M, et al. Use of Dipeptidyl Peptidase-4 Inhibitors and New-onset Rheumatoid Arthritis in Patients with Type 2 Diabetes. Epidemiology. 2018;29(6):904–12. [DOI] [PubMed] [Google Scholar]
- 40.Sayiner ZA, Okyar B, Kısacık B, Akarsu E, Özkaya M, Araz M. DPP-4 INHIBITORS INCREASE THE INCIDENCE OF ARTHRITIS/ARTHRALGIA BUT DO NOT AFFECT AUTOIMMUNITY. Acta Endocrinol (Buchar). 2018;14(4):473–6. [DOI] [PMC free article] [PubMed] [Google Scholar]
- 41.Mohetaer M, Li G, Wang Y, Cao L. Protective effects of gemigliptin against type II collagen degradation in human chondrocytes. Biomedicine & Pharmacotherapy. 2018;104:590–4. [DOI] [PubMed] [Google Scholar]
- 42.Hayashi M, Madokoro H, Yamada K, Nishida H, Morimoto C, Sakamoto M, et al. A humanized anti-CD26 monoclonal antibody inhibits cell growth of malignant mesothelioma via retarded G2/M cell cycle transition. Cancer Cell International. 2016;16(1):35. [DOI] [PMC free article] [PubMed] [Google Scholar]
- 43.Inamoto T, Yamada T, Ohnuma K, Kina S, Takahashi N, Yamochi T, et al. Humanized Anti-CD26 Monoclonal Antibody as a Treatment for Malignant Mesothelioma Tumors. Clinical Cancer Research. 2007;13(14):4191–200. [DOI] [PubMed] [Google Scholar]
- 44.Nakagawa K, Kijima T, Okada M, Morise M, Kato M, Hirano K, et al. Phase 2 Study of YS110, a Recombinant Humanized Anti-CD26 Monoclonal Antibody, in Japanese Patients With Advanced Malignant Pleural Mesothelioma. JTO Clin Res Rep. 2021;2(6):100178. [DOI] [PMC free article] [PubMed] [Google Scholar]
- 45.Röhrborn D, Eckel J, Sell H. Shedding of dipeptidyl peptidase 4 is mediated by metalloproteases and up-regulated by hypoxia in human adipocytes and smooth muscle cells. FEBS Letters. 2014;588(21):3870–7. [DOI] [PubMed] [Google Scholar]
- 46.Ghersi G, Zhao Q, Salamone M, Yeh Y, Zucker S, Chen W-T. The protease complex consisting of dipeptidyl peptidase IV and seprase plays a role in the migration and invasion of human endothelial cells in collagenous matrices. Cancer research. 2006;66(9):4652–61. [DOI] [PMC free article] [PubMed] [Google Scholar]
- 47.Moffitt LR, Bilandzic M, Wilson AL, Chen Y, Gorrell MD, Oehler MK, et al. Hypoxia Regulates DPP4 Expression, Proteolytic Inactivation, and Shedding from Ovarian Cancer Cells. Int J Mol Sci. 2020;21(21):8110. [DOI] [PMC free article] [PubMed] [Google Scholar]
- 48.Uhlén M, Fagerberg L, Hallström BM, Lindskog C, Oksvold P, Mardinoglu A, et al. Tissue-based map of the human proteome. Science. 2015;347(6220):1260419. [DOI] [PubMed] [Google Scholar]
- 49.Kim JR, Kim HA. Molecular Mechanisms of Sex-Related Differences in Arthritis and Associated Pain. Int J Mol Sci. 2020;21(21). [DOI] [PMC free article] [PubMed] [Google Scholar]
- 50.Knights AJ, Farrell EC, Ellis OM, Lammlin L, Junginger LM, Rzeczycki PM, et al. Synovial fibroblasts assume distinct functional identities and secrete R-spondin 2 to drive osteoarthritis. bioRxiv. 2022:2022.05.06.489035. [DOI] [PMC free article] [PubMed] [Google Scholar]
- 51.Guo Q, Zhang S, Huang J, Liu K. Alogliptin inhibits IL-1β-induced inflammatory response in fibroblast-like synoviocytes. Int Immunopharmacol. 2020;83:106372. [DOI] [PubMed] [Google Scholar]
- 52.Han C-K, Lee W-F, Hsu C-J, Huang Y-L, Lin C-Y, Tsai C-H, et al. DPP4 reduces proinflammatory cytokine production in human rheumatoid arthritis synovial fibroblasts. Journal of Cellular Physiology. 2021;236(12):8060–9. [DOI] [PubMed] [Google Scholar]
Associated Data
This section collects any data citations, data availability statements, or supplementary materials included in this article.
Supplementary Materials
Data Availability Statement
Data are available within the article or its supplementary materials.