

ABSTRACT
Macroautophagy/autophagy has been shown to exert a dual role in cancer i.e., promoting cell survival or cell death depending on the cellular context and the cancer stage. Therefore, development of potent autophagy modulators, with a clear mechanistic understanding of their target action, has paramount importance in both mechanistic and clinical studies. In the process of exploring the mechanism of action of a previously identified cytotoxic small molecule (SM15) designed to target microtubules and the interaction domain of microtubules and the kinetochore component NDC80/HEC1, we discovered that the molecule acts as a potent autophagy inhibitor. By using several biochemical and cell biology assays we demonstrated that SM15 blocks basal autophagic flux by inhibiting the fusion of correctly formed autophagosomes with lysosomes. SM15-induced autophagic flux blockage promoted apoptosis-mediated cell death associated with ROS production. Interestingly, autophagic flux blockage, apoptosis induction and ROS production were rescued by genetic or pharmacological inhibition of OGT (O-linked N-acetylglucosamine (GlcNAc) transferase) or by expressing an O-GlcNAcylation-defective mutant of the SNARE fusion complex component SNAP29, pointing to SNAP29 as the molecular target of SM15 in autophagy. Accordingly, SM15 was found to enhance SNAP29 O-GlcNAcylation and, thereby, inhibit the formation of the SNARE fusion complex. In conclusion, these findings identify a new pathway in autophagy connecting O-GlcNAcylated SNAP29 to autophagic flux blockage and autophagosome accumulation, that, in turn, drives ROS production and apoptotic cell death. Consequently, modulation of SNAP29 activity may represent a new opportunity for therapeutic intervention in cancer and other autophagy-associated diseases.
KEYWORDS: Anticancer therapy, apoptosis, autophagic flux, autophagy, kinetochore, O-GlcNAcylation, reactive oxygen species, SNAP29
Introduction
Macroautophagy/autophagy is a cellular catabolic process whereby protein aggregates or damaged organelles are engulfed in a double-membrane vesicle called autophagosome and delivered to lysosomes for degradation and recycling. The pathway is induced under nutrient deprivation or during different stress conditions to help the cell to get rid of unneeded material [1]. Given its role in cellular homeostasis, autophagy plays essential functions in a variety of cellular processes, including cell proliferation, differentiation, development, and aging. Accordingly, autophagy dysfunction is implicated in many diseases, including neurogenerative and inflammatory diseases, cancer, and various metabolic disorders [2,3]. Induction of autophagy usually requires activation of the ULK1 (unc-51 like autophagy activating kinase 1) complex, that is otherwise maintained inactive by the MTOR (mechanistic target of rapamycin kinase) complex 1 (MTORC1). In nutrient-poor conditions or energy stress, MTORC1 inactivation together with AMP-activated protein kinase (AMPK) phosphorylation promotes ULK1 complex activation and autophagy [1,4,5]. Once activated, the ULK1 complex localizes at sites of condensed cargos via its interaction with the receptor protein SQSTM1/p62 (sequestosome 1), promoting membrane nucleation [6]. Subsequent membrane recruitment of the class III phosphatidylinositol 3-kinase (PtdIns3K) complex and ULK1-dependent phosphorylation of the PtdIns3K complex subunit BECN1 (beclin 1), results in the generation of phosphatidylinositol-3-phosphate (PtdIns3P) at phagophores that expand into autophagosomes by addition of membranes from different sources [5,7]. Completion of the autophagic process and degradation of the engulfed material is ensured by intracellular trafficking of autophagosomes to encounter lysosomes, and by autophagosome-lysosome fusion, two highly regulated processes. Mature autophagosomes are transported along microtubules (MTs) toward the perinuclear region of the cell around centrosomes [8–11], a cell region where also lysosomes accumulate [12], through the action of the microtubule-associate minus-end motor dynein [13,14]. Previous studies have implicated the soluble N-ethylmaleimide-sensitive factor attachment protein receptor (SNARE) complex in the fusion of autophagosomes with the endocytic system and lysosomes. The SNARE complex consists of autophagosomal membrane-localized STX17 (syntaxin 17) and SNAP29 (synaptosome associated protein 29), and lysosome-localized VAMP8 (vesicle associated membrane protein 8) [15]; complex formation and membrane fusion activity of the complex are strictly regulated [16,17]. Indeed, regulatory molecules, such as small GTPases and tethering factors, have been reported to promote the fusion process [17–19]. Among those, RAB7 (RAB7, member RAS oncogene family) has been found to recruit a tethering factor, the homotypic fusion and protein sorting (HOPS) complex, to lysosome membranes through its effector PLEKHM1 (pleckstrin homology and RUN domain containing M1), to assist SNARE complex assembly [20]. At the same time, RAB7 has been shown to stabilize the SNARE complex via EPG5 (ectopic P-granules 5 autophagy tethering factor) [21]. A second regulatory mechanism for SNARE complex formation resides in the post-translation addition of O-linked N-acetylglucosamine (O-GlcNAc) at different serine and threonine residues of the Qbc SNARE protein SNAP29 [22]. The reaction is catalyzed by OGT (O-linked N-acetylglucosamine (GlcNAc) transferase) and increased O-GlcNAcylation on SNAP29 has been shown to inhibit SNARE complex formation [22].
In cancer, autophagy has been broadly recognized has having both tumor suppression and growth promotion roles depending on the cellular context and cancer stage [3,23]. Autophagy can prevent cancer initiation via its ability to eliminate dysfunctional proteins and damaged mitochondria or counteract reactive oxygen species (ROS) production and chromosome instability in pre-malignant cells [24–26]. On the other hand, autophagy can also assist tumor growth by providing recycled metabolites to support tumor metabolism and promotes cancer cell survival in response to anticancer treatments [23,27]. Given this complexity, targeting autophagy for cancer treatment has been only partially successful and, nowadays, only the anti-malaria drug hydroxychloroquine has been thoroughly investigated in clinical settings [28,29]. Thus, development of more potent autophagy inhibitors with a clear mechanistic understanding of their target action, has paramount importance in both cellular and clinical studies [30–32].
A virtual screening has led to the identification of a new small molecule named SM15 targeting MTs and the interaction domain of MTs with NDC80/HEC1 (NDC80 kinetochore complex component), a subunit of the proteinaceous complex connecting the centromere to MTs. The small molecule was shown to stabilize MTs and the NDC80/HEC1-MT interaction and to possess elevated anti-proliferative, pro-apoptotic and anti-mitotic activities both in cancer cell lines and in mouse xenografts [33]. Beside chromosome segregation defects and mitotic cell death, SM15 was able to induce apoptotic cell death directly from interphase in cancer cells. This occurred through extensive membrane blebbing preceded by formation of large vacuoles [33]. Since vacuole formation in interphase is considered a morphological sign of initial autophagy in microscopy studies [34], these findings suggested the activation of an autophagic process that was then followed by apoptotic cell death directly from interphase. Here, we investigate the effect of the molecule interacting at the MT- kinetochore (KT) interface on autophagy and identified a novel autophagy inhibitory pathway.
Results
SM15 blocks basal autophagy
To test the hypothesis that the molecule may promote autophagy, several markers of the autophagic process were assessed in cancer cells treated with SM15 or SM16, a SM15 analog that was previously shown to be inactive in promoting cell death, mitotic defects, or MT stabilization [33]. Consistent with SM15 being biologically active, only SM15 treatment significantly increased the lipidated form of MAP1LC3/LC3 (microtubule associated protein 1 light chain 3) termed LC3-II, a biochemical marker of autophagosome formation, and elevated the cargo receptor SQSTM1/p62 levels. As expected, LC3-II levels increased and SQSTM1/p62 levels decreased when cells were incubated with torin 1, a known autophagy inducer [35] (Figure 1A, quantification in Figure S1A). To confirm autophagosome formation, HT1080 cells stably expressing EGFP-LC3 were exposed to SM15 or to its inactive analog. Fluorescence microscope inspection showed that SM15 dramatically enhanced the frequency of cells showing EGFP-LC3 vesicles (Figure 1B,C) and the number of EGFP-LC3 vesicles/cell (Figure 1D), demonstrating that the active compound specifically promotes autophagosome accumulation.
Figure 1.
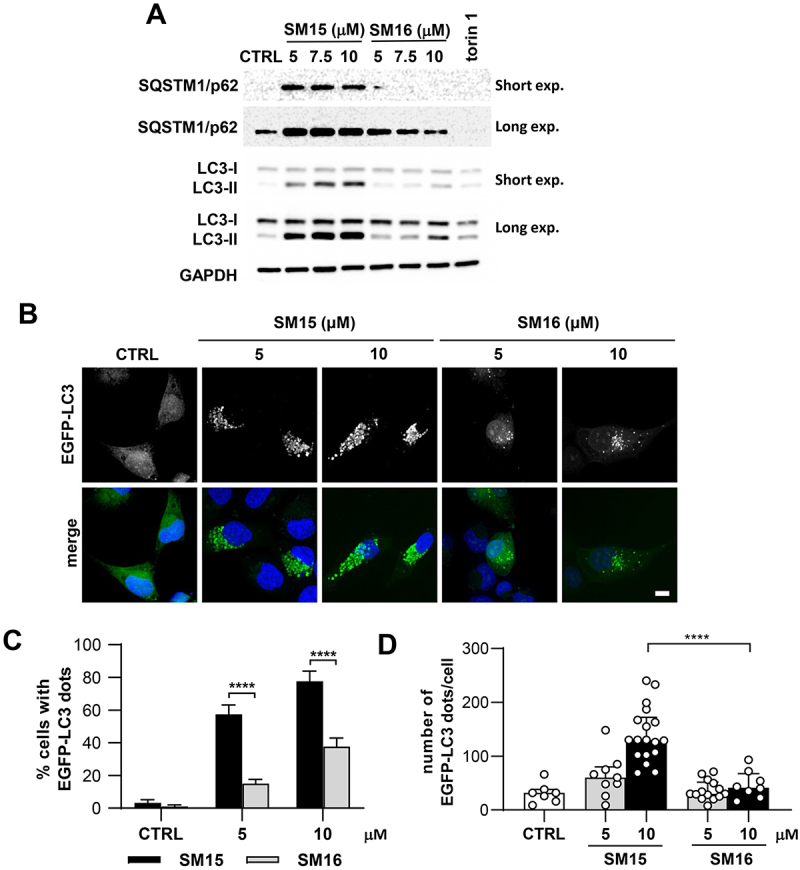
SM15 promotes autophagosome accumulation. (A) HT1080 cells were treated with SM15 or its inactive analog SM16 for 24 h or were exposed to 50 nM torin 1 for 2 h. Cell lysates were collected to assess LC3 conversion and SQSTM1/p62 levels by immunoblotting. (B) Representative images of EGFP-LC3 HT1080 exposed to SM15 or SM16 for 24 h and stained with DAPI. Scale bar: 10 μm. (C) Quantification of the percentage of cells showing ≥ 10 EGFP-LC3 dots in cells treated as in (B). ****P < 0.0001 (SM15 vs. SM16). (D) Quantification of the number of EGFP-LC3 dots/cell in cells treated as in (B). Data are presented as median with interquartile range. Symbols represent individual cells. ****P < 0.0001 (SM15 vs. SM16).
Autophagy is a dynamic process, with autophagosomes forming by membrane addition and dismantling upon lysosome fusion, a cycle that is known as autophagic flux [36]. Thus, intracellular accumulation of autophagosomes may occur either by the action of inducing stimuli in a functional autophagic flux, or in response to a block in their lysosomal degradation, a process also known as autophagy flux blockage. In the case of a functional autophagic process, inhibition of lysosome-mediated degradation of autophagosomes by the addition of chloroquine (CQ), a molecule that increases the lysosomal pH and impairs autophagosome fusion with lysosomes at high doses [37,38], blocks LC3 degradation and, thereby, enhances LC3-II accumulation. In immunoblot experiments, addition of CQ to SM15-treated cells did not increase the levels of LC3-II or SQSTM1/p62 over those observed after SM15 or CQ alone, in both HeLa and HT1080 cells (Figure 2A). The frequency of cells showing EGFP-LC3 dots in HT1080 cells stably expressing EGFP-LC3 did not increase at 5 µM in CQ + SM15 treated cells compared to SM15 alone treated cells, suggesting a flux blockage. At the 10 µM dose, the decrease in cells showing EGFP-LC3 dots may be attributed to a toxic effect of the combined treatment. At opposite, the frequency of cells showing EGFP-LC3 dots was significantly increased by CQ in untreated cells or when autophagy was induced by nutrient depletion, a condition known to induce a functional autophagic flux (Figure 2B). In accordance with an autophagic flux blockage induced by the molecule, both SQSTM1/p62 and NBR1 (NBR1 autophagy cargo receptor) levels, which function independently as autophagy receptors for ubiquinated proteins on the autophagosome membrane and are degraded after autophagosome-lysosome fusion, were clearly elevated in response to SM15 treatment in both cell lines (Figure 2C). To test whether SM15 prevented autophagosome–lysosome fusion, we took advantage of HT1080 cells stably expressing the tandem-tagged monomeric red fluorescent protein (mRFP) and EGFP-LC3 reporter [39]. By using this reporter, autophagosomes can be identified by their yellow fluorescence, whereas autolysosomes are characterized by mRFP fluorescence, since the EGFP signal is quenched by the low pH present in the lysosome lumen. Under this experimental setting, SM15-treated cells showed a clear dose-dependent increase in cells showing yellow dots (Figure 2D,E), indicating an incomplete autophagosome maturation into autolysosomes. Impairment in the autophagosome-lysosome fusion under SM15 exposure was also confirmed by the reduced colocalization of the lysosomal marker LAMP2 (lysosomal associated membrane protein 2) with EGFP-LC3 vesicular structures, when compared to the level of colocalization in untreated cells or following other autophagy modulating compounds, efficiently inducing EGFP-LC3 dots (Figure 2F - H).
Figure 2.
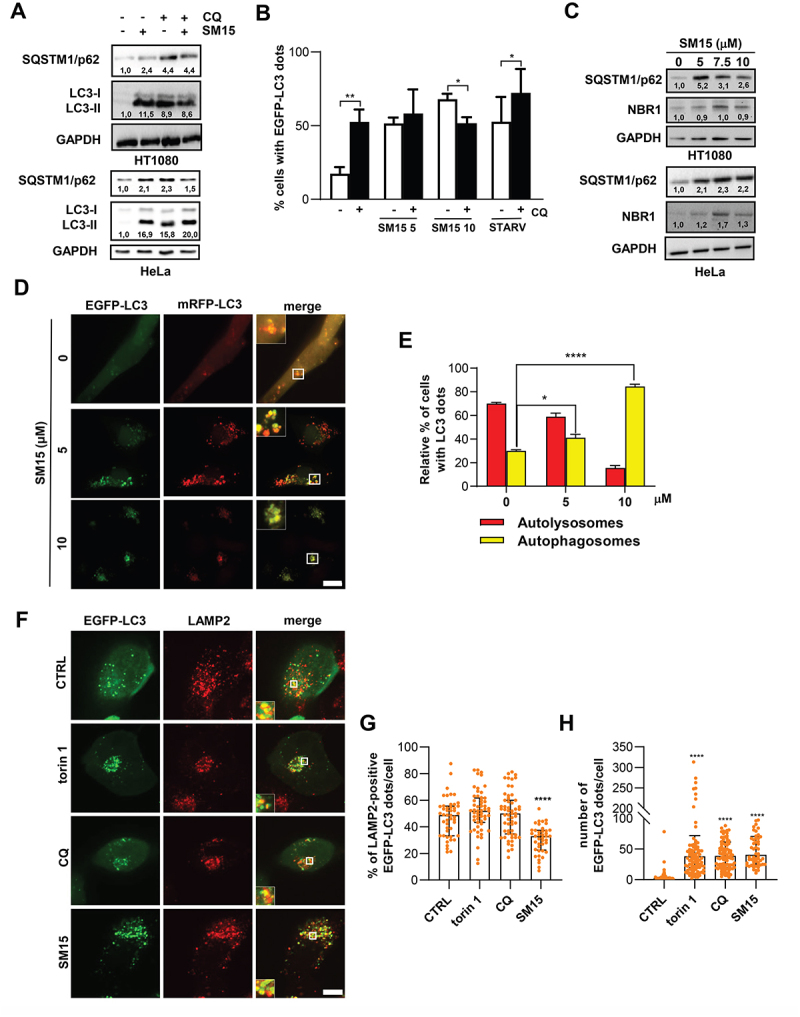
SM15 inhibits the autophagic flux. (A) HT1080 and HeLa cells were incubated with 10 μM SM15 or 25 μM CQ alone or in combination, and cell lysates were collected 24 h later to assess LC3 conversion and SQSTM1/p62 levels by immunoblotting. Numbers report the densitometric values of band intensity. (B) Quantification of the percentage of cells showing ≥ 10 EGFP-LC3 dots in EGFP-LC3 HT1080 cells treated with 5 or 10 μM SM15 for 24 h or incubated in HBSS for 6 h (STARV), alone or in combination with 25 μM CQ. *P < 0.05; **P < 0.01 (- CQ vs. + CQ). (C) Immunoblot analysis of the autophagic proteins SQSTM1/p62 and NBR1 in HT1080 and HeLa cells treated with SM15 for 24 h. Numbers report the densitometric values of band intensity. (D) Representative fluorescence images of HT1080 cells stably expressing mRFP-EGFP-LC3 treated with 5 or 10 μM SM15 for 24 h. Insets show a 3-fold enlargement of the boxed areas. Scale bar: 10 μm. (E) Quantification of the relative percentage of cells showing mRFP (red, autolysosomes) or mRFP-EGFP (yellow, autophagosomes) dots for the experiments shown in (D). *P < 0.05; ****P < 0.0001 vs. CTRL. (F) Representative fluorescence images of LAMP2 signal on EGFP-LC3 dots in EGFP-LC3 HT1080 cells immunostained for the lysosomal marker LAMP2. Cells were exposed to 50 nM torin 1 for 2 h, 25 µM CQ for 6 h or 10 µM SM15 for 24 h. Insets show a 3-fold enlargement of the boxed areas. Scale bar: 10 μm. (G) Quantification of LAMP2 and EGFP-LC3 dot colocalization in EGFP-LC3 HT1080 cells. Images were acquired by spinning disk confocal microscopy and analyzed for dot colocalization using the ComDet plugin of Fiji ImageJ. Data are presented as median with interquartile range. N ≥ 40 cells per sample from two independent experiments. Symbols represent individual cells. ****P < 0.0001 vs. CTRL. (H) Quantification of the number of EGFP-LC3 dots/cell in EGFP-LC3 HT1080 cells treated as in (F). Dots were counted using CellProfiler software. Data are presented as median with interquartile range. N ≥ 50 cells per sample. Symbols represent individual cells. ****P < 0.0001 vs. CTRL.
SM15 does not affect early autophagic events
Having demonstrated that SM15 ultimately impeded autophagosome-lysosome fusion, we then moved to ascertain at what stage the molecule, designed to target the MT-KT interface, blocked the autophagic process. To this aim, the impact of SM15 on different steps of autophagosome formation and maturation was assessed. First, the phosphorylation status of ULK1 and MTOR, both implicated in autophagy initiation [5], was monitored by immunoblot analysis. Surprisingly, both the autophagy promoting Ser555-ULK1 phosphorylation and the Ser2448-MTOR inhibiting phosphorylation remained unaffected by the SM15 treatment, suggesting that the increase in cells exhibiting autophagosomes was independent from the phosphorylation-dependent activation of the ULK1 complex (Figure 3A, quantification in Figure S1B). Unexpectedly, an evident upregulation of ULK1 protein levels was observed, which may be related to a transcriptional activation of the gene that warrants further attention [40]. To further delineate the cascade of events stimulated by SM15, key mediators of different steps of autophagy were knocked down and the influence of their downregulation on the ability of SM15 to modulate autophagic markers, such as LC3-II, was assessed. Specifically, the role of BECN1-dependent membrane nucleation and ATG7 (autophagy related 7)-mediated membrane expansion on SM15-dependent autophagy was investigated. To this aim, H1299 cells stably transfected with short hairpin RNA targeting BECN1 (shBECN1) or with scramble shRNA (shCTRL) were subjected to SM15 treatment and LC3-II expression was then assessed. Immunoblotting analyses confirmed the effective knockdown of the target gene and demonstrated that knockdown of BECN1 by RNA silencing did not impair LC3-II accumulation triggered by SM15 (Figure 3B, quantification in Figure S1C). Moreover, LC3-II upregulation after SM15 was also unaffected after successful ATG7 silencing in HeLa cells (Figure 3C, quantification in Figure S1D). Collectively, these data suggest that the molecule did not activate the apical autophagy-inducing complexes nor blocked phagophore membrane expansion. Conversely, results indicate a block in later stages of the autophagic process as cause of the strong accumulation of autophagosomes observed after SM15.
Figure 3.
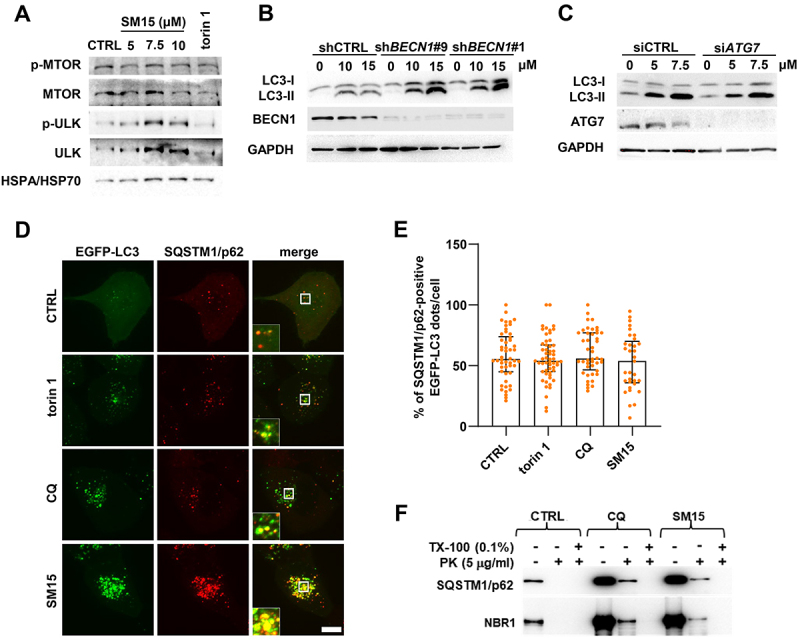
SM15 does not affect early autophagic events. (A) HeLa cells were treated with SM15 or 50 nM torin 1, cell lysates were collected 24 h later and immunoblotted with anti-phospho-MTOR (Ser2448), anti-MTOR, anti-phospho-ULK1 (Ser555), and anti-ULK1 antibodies. (B) H1299 clones stably transfected with shRNA targeting BECN1 (shBECN1#9 and shBECN1#1) or with scramble shRNA (shCTRL) were treated with SM15 and LC3 conversion was assessed by immunoblotting. (C) HeLa cells transiently transfected with an untargeted siRNA (siCTRL) or siRNA against ATG7 were treated with SM15 and LC3 conversion was assessed by immunoblotting. (D) Representative fluorescence images of SQSTM1/p62 signal on EGFP-LC3 dots in EGFP-LC3 HT1080 cells immunostained for the cargo receptor SQSTM1/p62. Cells were treated with 50 nM torin 1 for 2 h, 25 µM CQ for 6 h, or 10 µM SM15 for 24 h. Insets show a 3-fold enlargement of the boxed areas. Scale bar: 10 μm. (E) Quantification of SQSTM1/p62 and EGFP-LC3 dot colocalization in EGFP-LC3 HT1080 cells treated as in (D). Images were acquired by spinning disk confocal microscopy and analyzed for dot colocalization using the ComDet plugin of Fiji ImageJ. Data are presented as median with interquartile range. N ≥ 33 cells per sample from two independent experiments. Symbols represent individual cells. (F) Lysates from untreated, 25 µM CQ or 10 µM SM15-treated HT1080 cells were subjected to proteinase K (PK) and/or Triton X-100 (TX-100) treatment, and SQSTM1/p62 or NBR1 levels were analyzed by immunoblot. Cargo receptors in autophagosomes are protected from the addition of the external protease unless Triton X-100 is present.
To check whether autophagosomes were correctly formed and recruited cargos, the localization of SQSTM1/p62 relative to autophagosomes was visualized by antibody staining in EGFP-LC3 HT1080 cells. Immunofluorescence microscopy confirmed that SM15 treatment significantly upregulated SQSTM1/p62 levels and revealed that EGFP-LC3 vesicular structures were largely colocalizing with SQSTM1/p62 dots, similarly to what observed in untreated cells or in cells exposed to other autophagy modulating compounds (Figure 3D,E). To ensure that the observed vesicular structures represent completely sealed autophagosomes, a protease protection assay was also performed to determine whether autophagic cargos were encapsulated within closed autophagosomes [41]. Cell lysates were treated with an exogenous protease to assess if SQSTM1/p62 and NBR1 receptor proteins were protected within autophagosomes. The assay showed that cargos were protected from the protease action both after exposure to the late-stage inhibitor CQ and after SM15, demonstrating that SM15-induced EGFP-LC3 vesicles were sealed autophagosomes (Figure 3F). All together, these findings demonstrate that SM15 inhibits the basal autophagic flux without affecting the early stages of autophagosome formation.
SM15-induced SNAP29 O-GlcNAcylation inhibits autophagic flux
One major difference upon SM15 treatment was the appearance of LC3-positive vesicles larger in size than those produced under different stimuli, including those appearing under nutrient depletion, CQ treatment or following taxol, a MT-interacting drug (Figure 4A see insets, and 4B). This observation suggested that these larger structures might represent clusters of autophagosomes, as observed when fusion of autophagosomes with the endocytic system is blocked [42]. Strikingly, immunofluorescence detection of the regulatory component of the SNARE fusion complex RAB7 revealed that this GTPase specifically accumulated in SM15-treated cells (Figure 4D), with a partial localization on LC3-positive vesicles (Figure 4C, see insets). The level and localization of Golgi or endoplasmic reticulum markers were unaffected by the SM15 treatment, indicating an unequivocal involvement of RAB7 in the autophagy blockage by SM15 (Figure S2). RAB7 accumulation suggested that a defective formation of the SNARE fusion complex could be responsible for flux blockage upon SM15 treatment. SNARE complex formation is regulated by the inhibitory O-GlcNAcylation on SNAP29 by OGT, known to impair complex stabilization [22]. Therefore, we assessed O-GlcNAcylation impact on SM15-induced autophagy. Pharmacological inhibition of OGT restored the autophagic flux in SM15-treated HeLa or HT1080 cells, as shown by SQSTM1/p62 and LC3-II modulation upon exposure to alloxan, a specific OGT inhibitor (Figure 5A,B, quantification in Figure S3A). Concordantly, siRNA mediated downregulation of the OGT enzyme decreased SQSTM1/p62 and LC3-II levels in HeLa cells (Figure 5C, quantification in Figure S3B). Promotion of flux recovery by OGT inhibition was also confirmed by the increment in autolysosomes observed in mRFP-EGFP-LC3 HeLa cells treated with the OGT chemical inhibitor in combination with SM15, when compared to SM15 alone treated cells (Figure 5D,E).
Figure 4.
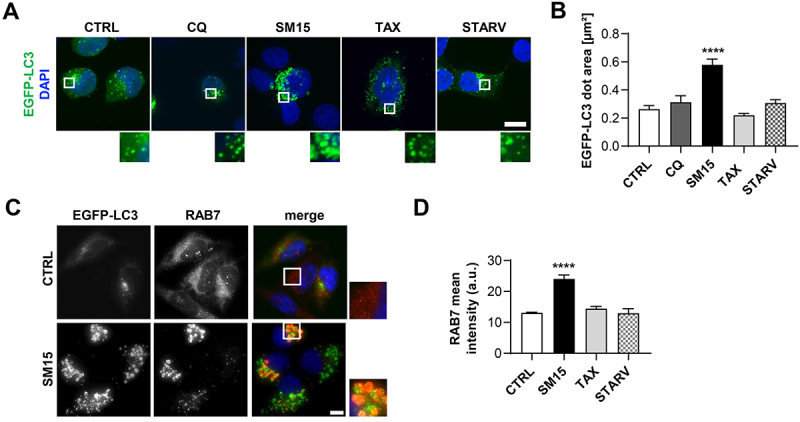
SM15 produces large autophagosomes that accumulate RAB7. (A) Representative images of EGFP-LC3 HT1080 cells treated for 24 h with 5 µM SM15, 100 nM taxol (TAX) or after 4 h incubation in HBSS (STARV) or in 25 µM CQ. Cells were counterstained with DAPI. Insets show a 3-fold enlargement of the boxed areas. Scale bar: 10 µm. (B) Quantification of the dimension of EGFP-LC3 dots in EGFP-LC3 HT1080 cells treated as in (a). N ≥ 10 cells per sample. ****P < 0.0001 vs. CTRL. (C) Representative fluorescence images of cells immunostained for RAB7 and counterstained with DAPI. Cells were treated for 24 h with 5 µM SM15. Insets show a 3-fold enlargement of the boxed areas. Scale bar: 10 µm. (D) Quantification of RAB7 mean intensity/cell (arbitrary units) in EGFP-LC3 HT1080 cells treated for 24 h with 5 µM SM15, 100 nM TAX or after 4 h incubation in HBSS (STARV). N ≥ 20 cells per sample from two independent experiments. ****P < 0.0001 vs. CTRL.
Figure 5.
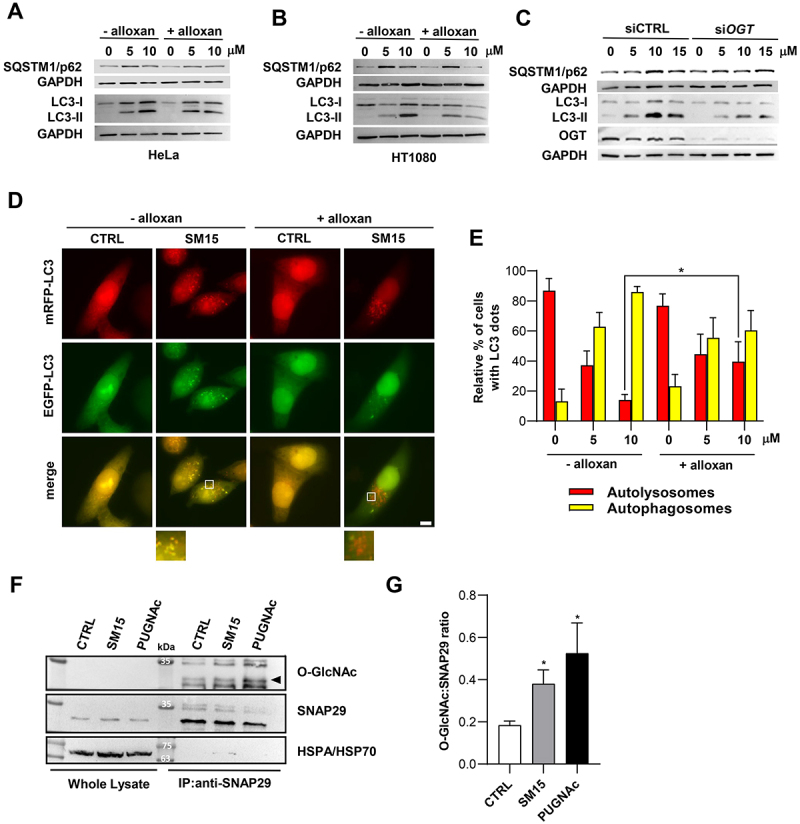
SM15-induced SNAP29 O-GlcNAcylation promotes autophagic flux blockage. (A) Immunoblot analysis of LC3 conversion and SQSTM1/p62 levels in HeLa cells treated for 24 h with SM15 alone or in combination with 5 mM of the OGT inhibitor alloxan. (B) Immunoblot analysis of LC3 conversion and SQSTM1/p62 levels in HT1080 cells treated as in (A). (C) Immunoblot analysis of LC3 conversion and SQSTM1/p62 levels in HeLa cells transfected with untargeted siRNA (siCTRL) or siOGT RNA and treated with SM15 for 24 h. (D). Representative images of HeLa cells stably expressing mRFP-EGFP-LC3 treated for 24 h with SM15 alone or in combination with 5 mM alloxan. Insets show a 3-fold enlargement of boxed areas. Scale bar: 10 μm. (E) Quantification of the relative percentage of cells showing mRFP (red, autolysosomes) or mRFP-EGFP (yellow, autophagosomes) dots for the experiments shown in (D). *P < 0.05 (- alloxan vs. + alloxan). (F) Immunoprecipitation analysis of SNAP29 O-GlcNAcylation. HeLa cells were treated with 15 μM SM15 for 6 h or 10 μM PUGNAc for 24 h, SNAP29 was immunoprecipitated using an agarose conjugated anti-SNAP29 antibody and immunoprecipitates were immunoblotted with anti O-GlcNAc and anti-SNAP29 antibodies. (G) Densitometric analysis of SNAP29 O-GlcNAcylation in SNAP29 immunoprecipitates. Values represent the ratio of O-GlcNAc to SNAP29 band intensity from four independent experiments. *P < 0.05 vs. CTRL.
As all these observations suggested O-GlcNAcylation on SNAP29 as a possible mechanism for the impaired autophagosome-lysosome fusion upon SM15 exposure, we directly tested the influence of SM15 treatment on SNAP29 O-GlcNAcylation by immunoprecipitation analysis (Figure 5F,G). As expected, SM15 treatment significantly enhanced the O-GlcNAcylation of SNAP29, as detected using an anti-O-GlcNAc antibody on immunoprecipitated SNAP29, directly demonstrating SNAP29 O-GlcNAcylation as the target of SM15 action. Concordantly, increased O-GlcNAcylation was also observed after O-(2-acetamido-2-deoxy-D-glucopyranosylidenamino) N-phenylcarbamate (PUGNAc), a widely used inhibitor of OGA (O-GlcNAcase), the enzyme that removes O-GlcNAc from modified proteins (Figure 5F,G).
To further dissect the functional relevance of SM15-dependent SNAP29 O-GlcNAcylation, we assessed the effect of SM15 on SNARE fusion complex formation. To this aim, we co-expressed differentially tagged SNAP29 and VAMP8, a SNARE complex component, in Hela cells and analyzed their interaction in immunoprecipitation studies. Immunoprecipitation for SNAP29 and immunoblot for EGFP-VAMP8 demonstrated that SNAP29-VAMP8 interaction was significantly reduced in HA-SNAP29 and EGFP-VAMP8 expressing Hela cells after SM15 treatment (Figure 6A,B). To corroborate this result, we co-transfected a SNAP29-WT or a O-GlcNAcylation-defective SNAP29 mutant (SNAP29-QM) [22] together with VAMP8 in HeLa cells and quantified the colocalization between SNAP29 and VAMP8 on autophagosomes, as visualized by antibody staining. In line with SM15 inhibiting SNARE complex formation by increasing O-GlcNAcylation on SNAP29, the colocalization of the two complex components on LC3-marked autophagosomes was clearly reduced upon SM15 exposure, while it remained unaffected when the O-GlcNAcylation-defective SNAP29 was expressed (Figure 6C,D). Moreover, the lower number of LC3 dots upon expression of the mutant SNAP29 and their limited increase in response to SM15 also converged to indicate that SM15 action is dependent on O-GlcNAcylation on SNAP29 (Figure 6E).
Figure 6.
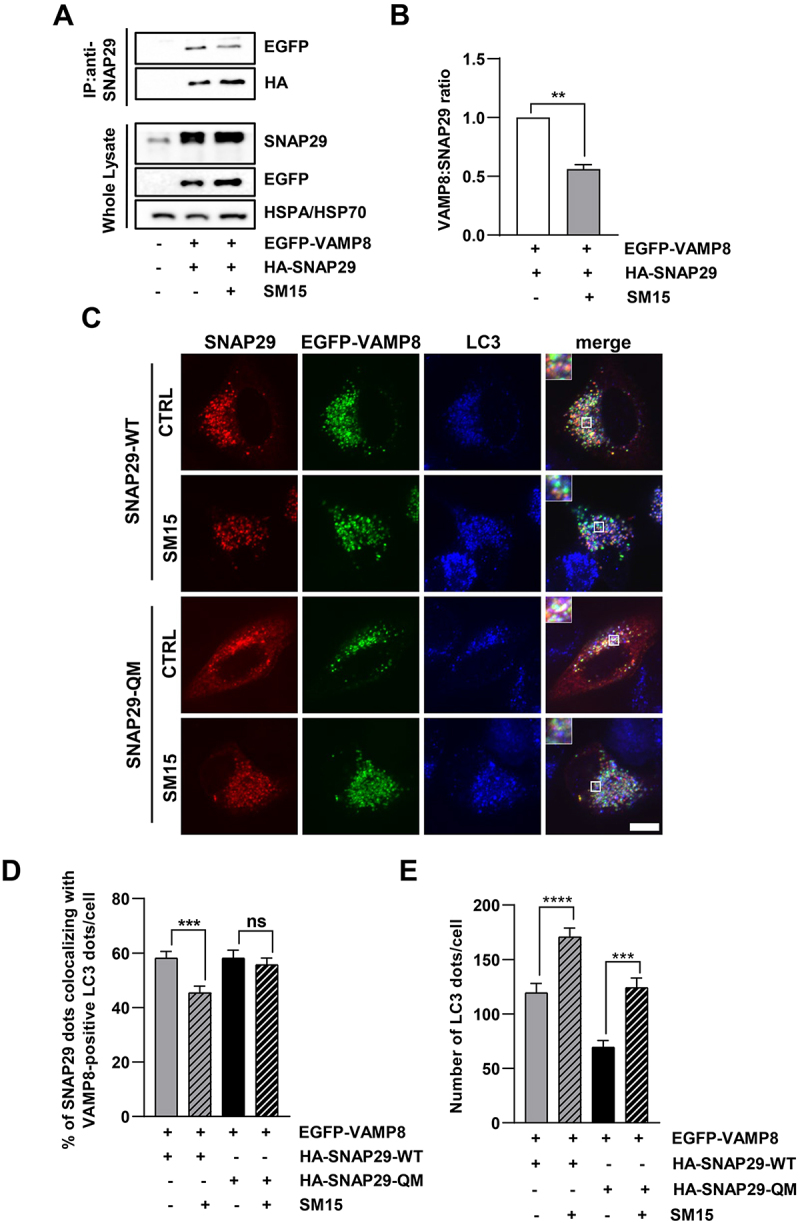
SM15 inhibits SNARE complex formation. (A) HeLa cells were transiently transfected with HA-SNAP29 and EGFP-VAMP8. 42 h after transfection cells were treated for 6 h with 15 μM SM15. SNAP29 was then immunoprecipitated using anti-SNAP29 antibody and it was revealed by immunoblotting with HA-HRP antibody. To detect VAMP8 interaction with SNAP29, EGFP-VAMP8 was revealed by anti-GFP antibody. (B) Densitometric analysis of VAMP8/SNAP29 ratio. Values represent the ratio of EGFP to HA band intensity from two independent experiments and are reported as fold change over the control value. **P < 0.01. (C) HeLa cells were transiently transfected with HA-SNAP29-WT or HA-SNAP29-QM and EGFP-VAMP8. 42 h after transfection, cells were treated for 6 h with 15 μM SM15. Samples were immunostained using SNAP29 and LC3 antibodies and images were acquired by spinning disk confocal microscopy. Insets show a 3-fold enlargement of the boxed areas. Scale bar: 10 μm. (D) Quantification of the percentage of SNAP29 dots colocalizing with VAMP8-positive LC3 dots in HA-SNAP29-WT and HA-SNAP29-QM untreated or SM15-treated HeLa cells. N ≥ 33 cells per sample from two independent experiments. Colocalization of SNAP29, VAMP8 and LC3 dots was analyzed using the ComDet plugin of Fiji ImageJ. (E) Quantification of the number of LC3 dots/cell detected by anti-LC3 antibody staining in HA-SNAP29-WT and HA-SNAP29-QM untreated or SM15-treated cells. ***P < 0.001, ****P < 0.0001.
SNAP29 O-GlcNAcylation promotes ROS-mediated cell death
We then moved to clarify the impact of the autophagic flux blockage and SNAP29 O-GlcNAcylation on the cytotoxic and potentially antitumoral effects exerted by the molecule. To dynamically analyze the formation of autophagosomes upon SM15 treatment and identify the fate of autophagy-activated cells, we used EGFP-LC3 expressing HT1080 cells in live imaging experiments. After confirming the efficacy of SM15 in inducing apoptosis in HT1080 and HeLa cells (Figure 7A,B) we subjected EGFP-LC3 HT1080 cells to live imaging recording. As exemplified in Figure 7C, control cells did not show LC3-positive dots, progressed into the cell cycle and completed mitosis in about 2 h. At opposite, SM15-treated cells showed extensive accumulation of LC3 positive vesicles over time and underwent apoptosis-related membrane blebbing at late time of observation (Figure 7C). Among the few cells dying at the low SM15 concentration, a prevalence of autophagy-activated cells undergoing apoptosis from mitosis was observed, confirming the mitotic action of the molecule. At 10 µM SM15, the great majority of cells showing accumulation of autophagosomes died through apoptosis-related membrane blebbing, suggesting that cells undergoing a blockage in autophagic flux in response to 10 µM SM15 are prone to undergo apoptosis. At this concentration, cells entered apoptosis mainly from interphase, strengthening the role of autophagy, which is active mainly in interphase [43] on cell death in this experimental setting (Figure 7D). Altogether, these data suggest that blockage of autophagic flux may be a death promoting mechanism and that blocked autophagy and apoptosis are synergic in promoting cell death upon SM15 treatment. To pinpoint the role of flux blockage due to O-GlcNAcylation in the death pathways, we again pharmacologically or genetically modulated this protein modification. Restoration of autophagic flux by alloxan treatment promoted escape from SM15-induced apoptotic death as shown by the decreased frequency of hypodiploid cells and by the reduced cleaved PARP (poly(ADP-ribose) polymerase 1) and cleaved CASP3 (caspase 3) expression in combined treatments in HeLa cells (Figure 8A,B). In line with these results, the incidence of early apoptotic ANXA5 (annexin A5)-positive HeLa cells following SM15 treatment was also decreased after RNAi mediated OGT silencing (Figure 8C,D). Recovery from apoptosis was also confirmed in HT1080 cells upon pharmacological inhibition of the enzyme, corroborating the general relevance of the results (Figure S4). Altogether, these findings indicate that SM15 blocks the autophagic flux and promotes autophagic cell death by impairing SNARE complex formation and confirm O-GlcNAcylation on SNAP29 as SM15 target. Indeed, expression of the O-GlcNAcylation-defective SNAP29-QM rescued SM15-mediated induction of apoptosis, as shown by the decreased frequency of ANXA5-positive cells in SNAP29-QM expressing cells as compared with SNAP29-WT expressing cells (Figure 8E,F). Thus, increased O-GlcNAcylation of SNAP29 drives SM15 autophagic flux blockage and cell death.
Figure 7.
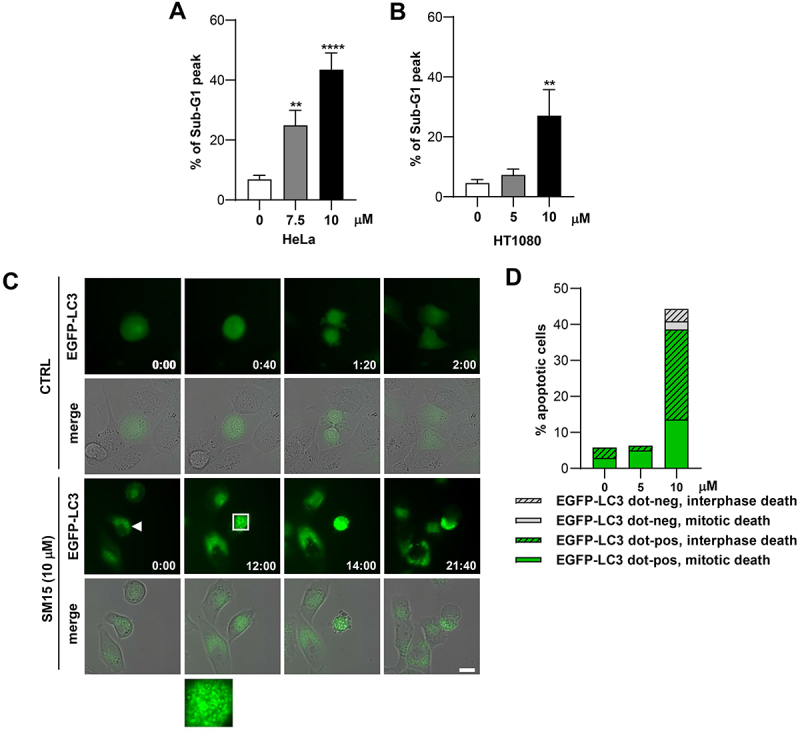
SM15 induces apoptosis in cells showing autophagic vesicles. (A) Quantification of the sub-G1 peak in HeLa cells treated with SM15 for 24 h. **P < 0.01; ****P < 0.0001 vs. untreated. (B) Quantification of the sub-G1 peak in HT1080 cells treated with SM15 for 24 h. **P < 0.01 vs. untreated. (C) Still images of an untreated EGFP-LC3 HT1080 cell (CTRL) or a SM15-treated EGFP-LC3 HT1080 cell (SM15, arrowhead) recorded by time-lapse microscopy for 48 h under phase contrast and EGFP fluorescence. The merge image shows the superimposition of the phase contrast and fluorescence images. Time is given in h:min. The inset is a 5-fold enlargement of the boxed area, showing accumulation of autophagosomes over time. (D) Quantitative analysis of the different cell death fates (interphase death vs. mitotic death) in EGFP-LC3 HT1080 cells showing (EGFP-LC3 dot-pos) or lacking (EGFP-LC3 dot-neg) EGFP-LC3 dots. Values derive from the sum of the number of cells observed in two independent experiments. CTRL N = 35; 5 μM SM15 N = 80; 10 μM SM15 N = 88. Scale bar: 20 µm.
Figure 8.
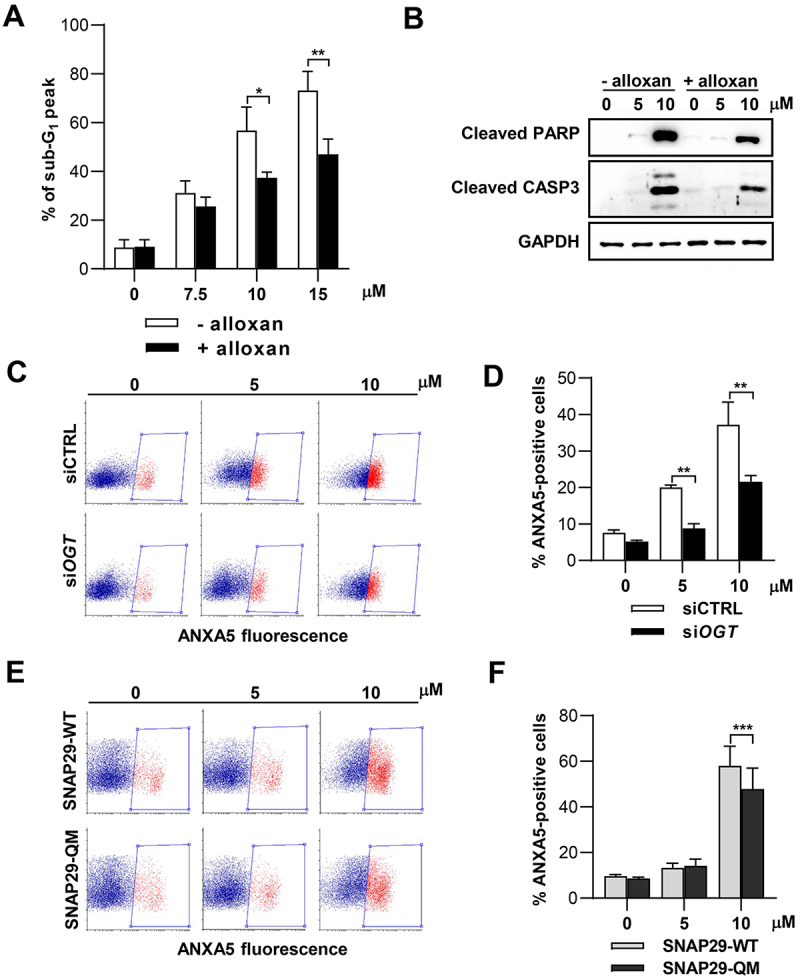
Pharmacological or genetic inhibition of O-GlcNAcylation reverts apoptosis. (A) Quantification of the sub-G1 peak in HeLa cells treated with SM15 for 24 h with or without 5 mM alloxan. *P < 0.05; **P < 0.01 (- alloxan vs. + alloxan). (B) Immunoblot analysis of the cleaved form of the apoptosis markers PARP and CASP3 in HeLa cells treated with SM15 for 24 h with or without alloxan. (C) Representative cytofluorimetric plots of ANXA5 fluorescence after siCTRL or siOGT RNA transfection in SM15-treated HeLa cells. Boxed areas represent ANXA5-positive cells. (D) Quantification of ANXA5-positive cells after siCTRL or siOGT RNA transfection and treatment with SM15 for 24 h. **P < 0.01 (siCTRL vs. siOGT). (E) Representative cytofluorimetric plots of ANXA5 fluorescence after SNAP29-WT or SNAP29-QM expression in SM15-treated HeLa cells. Boxed areas represent ANXA5-positive cells. (F) Quantification of ANXA5-positive cells after SNAP29-WT or SNAP29-QM expression and treatment with SM15 for 24 h. ***P < 0.001 (SNAP29-WT vs. SNAP29-QM).
As ROS have been identified as potential mediators of cell death in conjunction with autophagy blockage [42], we assessed ROS formation upon SM15 exposure. SM15 was found to induce ROS and, similarly to H2O2-induced ROS, their production was counteracted by the free radical scavenger N-acetyl-L-cysteine (NAC) (Figure S5A), identifying intracellular ROS as part of SM15 action. Interestingly, SM15 was found to induce ROS in a time dependent fashion in both HeLa and HT1080 cells (Figure 9A,B, Figure S5B), suggesting that accumulation of autophagic vesicles possibly due to a blockage in autophagic flux, could be the cause of ROS production and cytotoxicity. Interestingly, decreased O-GlcNAcylation by alloxan treatment was also found to ameliorate ROS production in SM15-treated cells (Figure 9C), directly linking ROS production to protein O-GlcNAcylation. Finally, scavenging of free radicals by NAC addition significantly reduced the frequency of ANXA5-positive cells when SNAP29-WT was transfected in Hela cells, but leaved unaffected the incidence of ANXA5-positive cells, when the O-GlcNAcylation defective mutant of SNAP29 was expressed (Figure 9D,E). These last results confirm SNAP29 O-GlcNAcylation as responsible for apoptosis production in response to SM15 and recognize ROS as mediators of the process. Collectively, these studies have identified a new pathway connecting SM15-dependent SNAP29 O-GlcNAcylation to autophagic flux blockage, ROS production and autophagic cell death.
Figure 9.
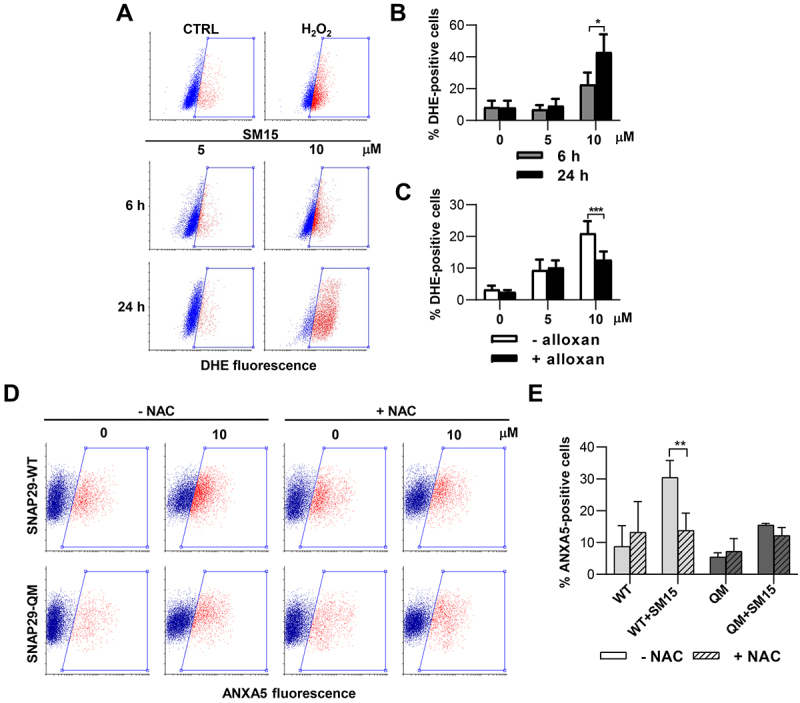
SNAP29 O-GlcNAcylation promotes ROS-mediated cell death. (A) Representative cytofluorimetric plots of DHE fluorescence in HT1080 treated with SM15 for different incubation times or treated with the ROS producer H2O2 (5 mM) for 30 min. (B) Quantification of DHE-positive HT1080 cells treated as in (A). *P < 0.05 (6 h vs. 24 h). (C) Quantification of DHE-positive HeLa cells treated with SM15 for 24 h with or without 5 mM alloxan. ***P < 0.001 (- alloxan vs. + alloxan). (D) Representative cytofluorimetric plots of ANXA5 fluorescence in SNAP29-WT or SNAP29-QM expressing HeLa cells. Cells were treated with SM15 for the last 24 h of the expression time, NAC was added 30 min before SM15. Boxed areas represent ANXA5-positive cells. (E) Quantification of ANXA5-positive cells treated as in (D). **P < 0.01 (SNAP29-WT vs. SNAP29-QM).
Discussion
The identification of autophagy as a cytoprotective pathway in late stages of tumor progression, has focused newly renovated efforts on finding efficient autophagy inhibitors as cancer therapeutics [32]. The survival-promoting action of autophagy on several tumor types is partly explained by the role of autophagy in safeguarding cells from apoptosis-related cell death, providing a logical rationale for the inhibition of autophagy as potentiating tumor response in combination therapies. This has fueled a resurgent interest on autophagy blockers. The only FDA approved late-stage autophagy inhibitor CQ, previously thought as an inhibitor of lysosomal degradation capacity, has then been found to decrease autophagosome-lysosome fusion by disorganizing the Golgi complex and the endo-lysosomal system [37,38], calling for the search of new and more targeted late-stage inhibitors.
SM15 is a small molecule identified as interfering at the MT-KT interface that was previously shown to kill cancer cells efficiently and specifically, both in vitro and in vivo models [33]. In this study, we provide evidence that SM15 affects autophagosomes turnover through an impairment of their degradation pathway under basal conditions. The molecule blocked the fusion of correctly formed autophagosomes with lysosomes producing a strong blockage in the autophagic flux. Strikingly, SM15-induced autophagy blockage was rescued by the genetic or pharmacological inhibition of the O-GlcNAc transferase OGT, suggesting that the small molecule acts on O-GlcNAcylation on the SNARE complex component SNAP29. Indeed, SM15 was found to enhance SNAP29 O-GlcNAcylation and, thereby, to exert an inhibitory action on the formation of the SNARE complex. In conclusion, SM15-induced autophagic flux blockage can be attributed to its ability to O-GlcNAcylate SNAP29, a capacity that renders SM15 a very potent late-stage inhibitor.
Noticeably, SM15-induced apoptotic cell death could also be rescued by genetically or pharmacologically inhibiting OGT or by expressing a O-GlcNAcylation defective SNAP29 mutant, identifying the inhibitory action of SNAP29 O-GlcNAcylation on autophagic flux, as a specific target to induce autophagy-mediated cancer cell death. Remarkably, modulating SNAP29 O-GlcNAcylation represents a very promising route to inhibit autophagic flux, being the complex an essential and specific mediator of autophagosome-lysosome fusion. In comparison, the action of other commonly used autophagy late-stage blockers that are inhibitors of lysosomal activity [32] is largely untargeted as it will also affect other degradative processes. Indeed, inhibiting SNARE complex formation and activity has received much attention in recent times. Autophagy flux blockage has been observed upon modulation of the expression of different complex components or after increased O-GlcNAcylation on SNAP29 [44–47]. Degradation of SNAP29 and STX17 upon 20S proteosome activation [44], impaired STX17 loading onto autophagosomes [45], and inhibition of SNAP29-VAMP8 interaction [46] have all been found to block the autophagic flux, and the same was observed by chemically mediated O-GlcNAcylation on SNAP29 [47].
Importantly, the current study provides the first demonstration that interfering with SNARE complex formation may affect cancer cell death through intracellular accumulation of autophagosomes, which, in turn, promotes ROS production. Autophagy activation in response to ROS production is a cytoprotective mechanism of tumor cells that acts to scavenge excessive ROS while maintaining pro-tumorigenic signaling [48]. On the other hand, blockage of autophagic flux has been associated to excessive ROS production and cancer cell death upon treatment with late-stage inhibitors [49,50], strengthening again the potential of autophagy inhibition in cancer therapy [51]. Interestingly, MTOR/STX17 dual knock-down, producing formation of autophagosomes coupled with inhibition of autophagosome–lysosome fusion, has been found to promote cell toxicity via excess ROS production [42]. The results presented in the current paper indicate that increased O-GlcNAcylation on SNAP29 upon small molecule treatment, drives accumulation of autophagosomes, leading to ROS production and apoptotic cell death in cancer cells. Therefore, chemical modulation of SNAP29 O-GlcNAcylation may represent a novel opportunity for therapeutic intervention in cancer and other autophagy-associated diseases.
It is interesting to note that, from a mechanistic point of view, a molecular interaction of SM15 with SNAP29 could be hypothesized, being SNAP29 a moonlight protein, that performs a further function with respect to its role in membrane trafficking and fusion [52]. During mitosis, SNAP29 is a component of the mitotic KT, where it regulates KT-MT attachment and stability [53]. SNAP29 recruitment at KT depends on Drosophila NDC80/HEC1, and SNAP29 has been shown to physically interact with this KT component [53], posing this SNARE protein in close proximity to NDC80/HEC1 and MTs. The two proteins also share some structural similarity, harboring extended coil coils involved in protein-protein interactions [52,54].
In conclusion, the use of this versatile small chemical has allowed to identify a general mechanism that drives autophagy-mediated cancer cell death, i.e., accumulation of autophagosomes and derived ROS production in response to SNARE complex disruption. This axis could be successfully exploited in tumor types that require autophagy for their proliferation, such as glioblastoma, pancreatic ductal adenocarcinomas or BRAFV600E mutated cancers [55–58]. In these cancer types, SM15 could represent an effective autophagy late-stage inhibitor and a promising dual anti-cancer agent, able to induce cell apoptotic cancer death through both anti-mitotic and autophagy-related mechanisms.
Materials and methods
Cell culture, transfection, and drug treatments
HeLa cells (American Tissue Culture Collection, CCL-2) were grown in high glucose DMEM medium (Euroclone, ECB7501L), HT1080 cells (American Tissue Culture Collection, CCL-121) were cultured in MEM medium (Euroclone, ECB2071L), and NCI-H1299 cells (American Tissue Culture Collection, CRL-5803) were cultured in RPMI 1640 (Euroclone, ECB9006L). EGFP-LC3 HT1080, mRFP-EGFP-LC3 HT1080 cells and shBECN1- or shCTRL-expressing H1299 cells were generated in a previous study [59], mRFP-EGFP-LC3 HeLa cells were generated in this study by plasmid transfection (Addgene, 21,074; deposited by Tamotsu Yoshimori). Media were supplemented with 10% fetal bovine serum, 1% L-glutamine and antibiotics. Cells were grown at 37°C in a humidified atmosphere containing 5% CO2 and routinely tested for mycoplasma contamination. In all experiments, control cells were treated with 0.2% DMSO at maximum. For each siRNA condition, 2 × 10⁵ HeLa cells were seeded and transfected the following day with 50 nM siRNA (Integrated DNA Technologies, siNEG 51011403; siOGT 227495839; siATG 233165114) using Lipofectamine (Invitrogen, L3000015) according to the manufacturer’s instructions. Cells were harvested 30 h (ANXA5 assay) or 72 h (immunoblot analysis) from transfection, including a 24 h treatment with SM15 or SM16 [33]. For plasmid expression, cells seeded as above were transfected with HA-tagged SNAP29-WT or HA-tagged SNAP29-QM, the latter plasmid harboring four Ser/Thr mutations impeding O-GlcNAcylation [22] (a gift from D. D. Zhang, University of Arizona, USA). ANXA5 assay was performed 30 h later, including a 24 h treatment with SM15. CQ (Sigma-Aldrich, C6628) was dissolved in water, NAC (Sigma-Aldrich, A9165) and alloxan (Sigma-Aldrich, A7413) were dissolved in medium and freshly used. SM15, taxol (Sigma-Aldrich, T1912) and torin 1 (Cell Signaling Technology, 14,379) were dissolved in DMSO.
Flow cytometry
Progression of cells through cell cycle phases and sub-G1 peak identification were analyzed in both floating and adherent cells by flow cytometer, as previously reported [33]. For ANXA5 analysis, samples were trypsinized, collected in 15 mL tubes, and stained with 1 µg ANXA5-APC (Invitrogen, A35110) in 100 µL Binding Buffer (Invitrogen, BMS500BB). Samples were incubated 15 min in the dark, and 20,000 events were then analyzed. ROS production was measured using DHE (dihydroethidium; Sigma-Aldrich, D7008). Cells (5x10⁵/p60 dish) were seeded, treated the next day with SM15 and collected 6 or 24 h later. H2O2 (5 mM) for 30 min was used as positive control. Samples were collected, washed with DPBS (Euroclone, ECB4004L), stained in 10 µM DHE in medium for 30 min and immediately analyzed by flow cytometer.
Live cell time-lapse microscopy
EGFP-LC3 HT1080 cells (5x10⁴/well) were seeded in 4-well μ-slides (Ibidi, 80,426). After 24 h, SM15 was added to the medium and time–lapse observation started. Cells were recorded under an Eclipse Ti inverted microscope (Nikon, Tokyo, JA), using a Plan Fluor 40x/0.6 NA objective; during the whole observation cells were kept in a microscope stage incubator (Basic WJ, Okolab) at 37°C and 5% CO2. Fluorescence and phase contrast images were acquired at 40 min intervals for 48 h. Videos and still images were processed using NIS-Elements AR 4.0.
Immunofluorescence microscopy and analysis
Cells grown on glass coverslips were rinsed in DPBS, fixed in 3.7% formaldehyde (Sigma, F1635) in DPBS or 100% cold methanol (Carlo Erba, 414,815), permeabilized in 0.2% Triton X-100 (Carlo Erba, 600,471) and successively blocked in 20% normal goat serum (Euroclone, ECS0200D) in DPBS for 1 h at room temperature. Coverslips were processed for immunofluorescence using the following antibodies: anti-LAMP2 (Santa Cruz Biotechnology, sc-18,822), anti-SQSTM1/p62 (Santa Cruz Biotechnology, sc-28,359), anti-RAB7 (Abcam, 137,029), anti-LC3 (Cell Signaling Technology, 2775S) and anti-SNAP29 (Santa Cruz Biotechnology, sc-390,602). Anti-rabbit AMCA (Jackson ImmunoResearch, 711,155,152), anti-rabbit Cy3 (Jackson ImmunoResearch, 711,165,152) and anti-mouse Rhodamine Red-X (Jackson ImmunoResearch, 715,295,150) were used as secondary antibodies. DNA was counterstained with 0.05 μg/mL DAPI (4,6-diamidino-2-phenylindole; Sigma-Aldrich, D9542). Autophagic structures were detected by fluorescence microscopy observing LC3 dots in EGFP-LC3 HT1080 cells. Typically, at least 50 cells were counted for each experimental point, and cells showing ≥ 10 dots were considered positive. Dot number and size were measured using NIS Elements AR 4.0 software. For colocalization experiments, samples were observed under a Nikon Eclipse Ti2 microscope with a 60x (1.4 NA) objective, equipped with a CrestOptics X-Light V3 confocal spinning disk and a back illuminated Kinetix sCMOS camera. Images were acquired with NIS Elements 5.4 software and analyzed using the ComDet plugin of Fiji-ImageJ.
Immunoblot and immunoprecipitation
Floating and adherent cells were collected, lysed in RIPA buffer (50 mM Tris-HCl, pH 8, 150 mM NaCl, 1 mM EGTA [Sigma-Aldrich, E3889], 0.5% sodium deoxycholate [Sigma-Aldrich, D6750], 1 mM EDTA [Sigma, E5134], 1% NP40 [Sigma-Aldrich, N6507], 0.1% SDS [Sigma-Aldrich, 05030]) added with protease and phosphatase inhibitors cocktail (Thermo Fisher Scientific, A32961). Between 20 and 50 μg of total proteins were resolved under reducing conditions by SDS-PAGE in 7.5–15% gels, transferred to a nitrocellulose filter (Bio-Rad Laboratories, 1,620,112), blocked with 5% BSA (Sigma-Aldrich, A4503) or low-fat dry milk and subjected to immunoblot assay. The following antibodies were used for immunodetection: anti-LC3B (Sigma-Aldrich, L7543), anti-SQSTM1/p62 (Santa Cruz Biotechnology, sc-28,359), anti-ATG7 (Cell Signaling Technology, 2631), anti-BECN1 (Cell Signaling Technology, 3738), anti-cleaved PARP (Cell Signaling Technology, 5625), anti-cleaved CASP3 (Cell Signaling Technology, 9664), anti-GAPDH (Santa Cruz Biotechnology, sc-32,233), anti-HSPA/HSP70 (Sigma-Aldrich, 386,032). Secondary antibodies were anti-mouse (Bio-Rad Laboratories, 1,706,515) or anti-rabbit (Bio-Rad Laboratories, 1,706,516) IgG-horseradish peroxidase-conjugated antibodies. Signals were detected by enhanced chemiluminescence (Cyanagen, Westar sun XLS142, Westar Antares XLS063). Densitometric evaluation of band intensity was performed using Image Lab or ImageJ software and values were normalized to loading controls. Quantification of immunoblot results are reported in Figure S1 and Figure S3.
For immunoprecipitation of exogenous SNARE proteins, 1 × 10⁶ HeLa cells were co-transfected with 3 ug of HA-SNAP29-WT and 1 µg EGFP-VAMP8 (Addgene, 42,311; deposited by Thierry Galli) and grown for 42 h. Thereafter, cells were left untreated or were treated with SM15 for 6 h and harvested in IP lysis buffer, according to a published method [60]. Briefly, samples were pre-cleared in protein G-coupled sepharose beads (Cytiva, 17,061,801) and rotated overnight at 4°C with anti-SNAP29 antibody (Santa Cruz Biotechnology, sc-390,602). Then, protein G-coupled sepharose beads were added. Immunocomplexes were then resolved by SDS-PAGE and analyzed by immunoblot using anti-HA-HRP (Sigma-Aldrich, H6533) and anti-GFP (Roche, 11,814,460,001) antibodies. For immunoprecipitation of endogenous SNAP29, HeLa cells treated with SM15 for 6 h or PUGNAc for 24 h were processed as described above, except that lysates were incubated with an agarose-conjugated anti-SNAP29 antibody (Santa Cruz Biotechnology, sc-390,602 AC). SNAP29 and its O-GlcNAcylation levels were analyzed by immunoblot using an antibody against O-GlcNAc (Abcam, ab2739) and an anti-SNAP29 antibody (Santa Cruz Biotechnology, sc-390,602).
Statistical analysis
Experiments were replicated three times, and data are expressed as mean ± standard error (SEM), unless otherwise indicated. Differences between two groups were analyzed by two-sided unpaired Student’s t test. Comparisons between multiple groups were performed using one-way or two-ways analysis of variance (ANOVA) followed by Fisher’s LSD post-hoc test. Data were analyzed using the GraphPad Prism software.
Supplementary Material
Acknowledgments
We are grateful to Dr. Donna D. Zhang (College of Pharmacy, University of Arizona, Tucson, USA) for sharing SNAP29 plasmids, to Dr. Maria Giubettini (CrestOptics, Rome) for qualified technical support in high resolution microscopy and to Dr. Luca Fralleoni for help with immunoblot experiments. We thank Dr. Donatella Del Bufalo, Dr. Laura Rosanò, Dr. Giulia Guarguaglini and Dr. Venturina Stagni for sharing reagents. We also acknowledge MUR (Ministry of University and Research) PON project “IMPARA, Imaging from molecules to the preclinics” for supporting the development of the IBPM imaging platform.
Funding Statement
This work was supported by the Italian Association for Cancer Research [IG 2020 #24942]; POR FESR Lazio 2014-2020, “Progetti di Gruppi di 670 Ricerca 2020” [A0375-2020-36597]; Regione Lazio “Progetti gruppi di ricerca L.R. 13/08” [project no. 85-2017-15348].
Disclosure statement
No potential conflict of interest was reported by the author(s).
Supplementary material
Supplemental data for this article can be accessed online at https://doi.org/10.1080/15548627.2023.2170962
References
- [1].Dikic I, Elazar Z.. Mechanism and medical implications of mammalian autophagy. Nat Rev Mol Cell Biol. 2018;19(6):349–364. [DOI] [PubMed] [Google Scholar]
- [2].Levine B, Kroemer G. Biological functions of autophagy genes: a disease perspective. Cell. 2019;176(1–2):11–42. [DOI] [PMC free article] [PubMed] [Google Scholar]
- [3].Yang Y, Klionsky DJ. Autophagy and disease: unanswered questions. Cell Death Differ. 2020;27(3):858–871. [DOI] [PMC free article] [PubMed] [Google Scholar]
- [4].Dossou AS, Basu A. The emerging roles of mTORC1 in macromanaging autophagy. Cancers (Basel). 2019;11(10):1422. [DOI] [PMC free article] [PubMed] [Google Scholar]
- [5].Yu L, Chen Y, Tooze SA. Autophagy pathway: cellular and molecular mechanisms. Autophagy. 2018;14(2):207–215. [DOI] [PMC free article] [PubMed] [Google Scholar]
- [6].Turco E, Witt M, Abert C, et al. FIP200 Claw domain binding to p62 promotes autophagosome formation at ubiquitin condensates. Mol Cell. 2019;74(2):330–346.e11. [DOI] [PMC free article] [PubMed] [Google Scholar]
- [7].Zhao YG, Zhang H. Formation and maturation of autophagosomes in higher eukaryotes: a social network. Curr Opin Cell Biol. 2018;53:29–36. [DOI] [PubMed] [Google Scholar]
- [8].Geeraert C, Ratier A, Pfisterer SG, et al. Starvation-induced hyperacetylation of tubulin is required for the stimulation of autophagy by nutrient deprivation. J Biol Chem. 2010;285(31):24184–24194. [DOI] [PMC free article] [PubMed] [Google Scholar]
- [9].Köchl R, Hu XW, Chan EYW, et al. Microtubules facilitate autophagosome formation and fusion of autophagosomes with endosomes. Traffic. 2006;7(2):129–145. [DOI] [PubMed] [Google Scholar]
- [10].Jahreiss L, Menzies FM, Rubinsztein DC. The itinerary of autophagosomes: from peripheral formation to kiss-and-run fusion with lysosomes. Traffic. 2008;9(4):574–587. [DOI] [PMC free article] [PubMed] [Google Scholar]
- [11].Mackeh R, Perdiz D, Lorin S, et al. Autophagy and microtubules – new story, old players. J Cell Sci. 2013;126(5):1071–1080. [DOI] [PubMed] [Google Scholar]
- [12].Korolchuk VI, Saiki S, Lichtenberg M, et al. Lysosomal positioning coordinates cellular nutrient responses. Nat Cell Biol. 2011;13(4):453–460. [DOI] [PMC free article] [PubMed] [Google Scholar]
- [13].Ravikumar B, Acevedo-Arozena A, Imarisio S, et al. Dynein mutations impair autophagic clearance of aggregate-prone proteins. Nat Genet. 2005;37(7):771–776. [DOI] [PubMed] [Google Scholar]
- [14].Kimura S, Noda T, Yoshimori T. Dynein-dependent movement of autophagosomes mediates efficient encounters with lysosomes. Cell Struct Funct. 2008;33(1):109–122. [DOI] [PubMed] [Google Scholar]
- [15].Itakura E, Kishi-Itakura C, Mizushima N. The hairpin-type tail-anchored SNARE syntaxin 17 targets to autophagosomes for fusion with endosomes/lysosomes. Cell. 2012;151(6):1256–1269. [DOI] [PubMed] [Google Scholar]
- [16].Zhao YG, Zhang H. Autophagosome maturation: an epic journey from the ER to lysosomes. J Cell Biol. 2019;218(3):757–770. [DOI] [PMC free article] [PubMed] [Google Scholar]
- [17].Tian X, Teng J, Chen J. New insights regarding SNARE proteins in autophagosome-lysosome fusion. Autophagy. 2021;17(10):2680–2688. [DOI] [PMC free article] [PubMed] [Google Scholar]
- [18].Jäger S, Bucci C, Tanida I, et al. Role for Rab7 in maturation of late autophagic vacuoles. J Cell Sci. 2004;117(20):4837–4848. [DOI] [PubMed] [Google Scholar]
- [19].Gutierrez MG, Munafó DB, Berón W, et al. Rab7 is required for the normal progression of the autophagic pathway in mammalian cells. J Cell Sci. 2004;117(13):2687–2697. [DOI] [PubMed] [Google Scholar]
- [20].McEwan DG, Popovic D, Gubas A, et al. PLEKHM1 regulates autophagosome-lysosome fusion through HOPS complex and LC3/GABARAP proteins. Mol Cell. 2015;57(1):39–54. [DOI] [PubMed] [Google Scholar]
- [21].Wang Z, Miao G, Xue X, et al. The Vici syndrome protein EPG5 Is a Rab7 effector that determines the fusion specificity of autophagosomes with late endosomes/lysosomes. Mol Cell. 2016;63(5):781–795. [DOI] [PubMed] [Google Scholar]
- [22].Guo B, Liang Q, Li L, et al. O-GlcNAc-modification of SNAP-29 regulates autophagosome maturation. Nat Cell Biol. 2014;16(12):1215–1226. [DOI] [PubMed] [Google Scholar]
- [23].Rybstein MD, Bravo-San Pedro JM, Kroemer G, et al. The autophagic network and cancer. Nat Cell Biol. 2018;20(3):243–251. [DOI] [PubMed] [Google Scholar]
- [24].Mathew R, Kongara S, Beaudoin B, et al. Autophagy suppresses tumor progression by limiting chromosomal instability. Genes Dev. 2007;21(11):1367–1381. [DOI] [PMC free article] [PubMed] [Google Scholar]
- [25].Karantza-Wadsworth V, Patel S, Kravchuk O, et al. Autophagy mitigates metabolic stress and genome damage in mammary tumorigenesis. Genes Dev. 2007;21(13):1621–1635. [DOI] [PMC free article] [PubMed] [Google Scholar]
- [26].Mathew R, Karp CM, Beaudoin B, et al. Autophagy suppresses tumorigenesis through elimination of p62. Cell. 2009;137(6):1062–1075. [DOI] [PMC free article] [PubMed] [Google Scholar]
- [27].Wu J, Ye J, Xie Q, et al. Targeting regulated cell death with pharmacological small molecules: an update on autophagy-dependent cell death, ferroptosis, and necroptosis in cancer. J Med Chem. 2022;65(4):2989–3001. [DOI] [PubMed] [Google Scholar]
- [28].Wolpin BM, Rubinson DA, Wang X, et al. Phase II and pharmacodynamic study of autophagy inhibition using hydroxychloroquine in patients with metastatic pancreatic adenocarcinoma. Oncologist. 2014;19(6):637–638. [DOI] [PMC free article] [PubMed] [Google Scholar]
- [29].Shi TT, Yu XX, Yan LJ, et al. Research progress of hydroxychloroquine and autophagy inhibitors on cancer. Cancer Chemother Pharmacol. 2017;79(2):287–294. [DOI] [PubMed] [Google Scholar]
- [30].Levy JMM, Towers CG, Thorburn A. Targeting autophagy in cancer. Nat Rev Cancer. 2017;17(9):528–542. [DOI] [PMC free article] [PubMed] [Google Scholar]
- [31].Amaravadi RK, Kimmelman AC, Debnath J, et al. Targeting autophagy in cancer: recent advances and future directions. Cancer Discov. 2019;9:1167–1181. [DOI] [PMC free article] [PubMed] [Google Scholar]
- [32].Whitmarsh-Everiss T, Laraia L. Small molecule probes for targeting autophagy. Nat Chem Biol. 2021;17(6):653–664. [DOI] [PubMed] [Google Scholar]
- [33].Ferrara M, Sessa G, Fiore M, et al. Small molecules targeted to the microtubule-Hec1 interaction inhibit cancer cell growth through microtubule stabilization. Oncogene. 2018;37(2):231–240. [DOI] [PMC free article] [PubMed] [Google Scholar]
- [34].Kovács J, Kovács L, kovács AL, et al. Regression of autophagic vacuoles in pancreatic acinar, seminal vesicle epithelial, and liver parenchymal cells: a comparative morphometric study of the effect of vinblastine and leupeptin followed by cycloheximide treatment. Exp Cell Res. 1988;174(1):244–251. [DOI] [PubMed] [Google Scholar]
- [35].Thoreen CC, Kang SA, Chang JW, et al. An ATP-competitive mammalian target of rapamycin inhibitor reveals rapamycin-resistant functions of mTORC1. J Biol Chem. 2009;284(12):8023–8032. [DOI] [PMC free article] [PubMed] [Google Scholar]
- [36].Loos B, du Toit A, Jhs H. Defining and measuring autophagosome flux—concept and reality. Autophagy. 2014;10(11):2087–2096. [DOI] [PMC free article] [PubMed] [Google Scholar]
- [37].Rubinsztein DC, Gestwicki JE, Murphy LO, et al. Potential therapeutic applications of autophagy. Published online 2007. [DOI] [PubMed]
- [38].Mauthe M, Orhon I, Rocchi C, et al. Chloroquine inhibits autophagic flux by decreasing autophagosome-lysosome fusion. Autophagy. 2018;14(8):1435–1455. [DOI] [PMC free article] [PubMed] [Google Scholar]
- [39].Kimura S, Noda T, Yoshimori T. Dissection of the autophagosome maturation process by a novel reporter protein, tandem fluorescent-tagged LC3. Autophagy. 2007;3(5):452–460. [DOI] [PubMed] [Google Scholar]
- [40].Füllgrabe J, Ghislat G, Cho DH, et al. Transcriptional regulation of mammalian autophagy at a glance. J Cell Sci. 2016;129(16):3059–3066. [DOI] [PubMed] [Google Scholar]
- [41].Nguyen TN, Padman BS, Usher J, et al. Atg8 family LC3/GAB ARAP proteins are crucial for autophagosome-lysosome fusion but not autophagosome formation during PINK1/Parkin mitophagy and starvation. J Cell Biol. 2016;215(6):857–874. [DOI] [PMC free article] [PubMed] [Google Scholar]
- [42].Button RW, Roberts SL, Willis TL, et al. Accumulation of autophagosomes confers cytotoxicity. J Biol Chem. 2017;292(33):13599–13614. [DOI] [PMC free article] [PubMed] [Google Scholar]
- [43].Odle RI, Walker SA, Oxley D, et al. An mTORC1-to-CDK1 switch maintains autophagy suppression during mitosis. Mol Cell. 2020;77(2):228–240.e7. [DOI] [PMC free article] [PubMed] [Google Scholar]
- [44].Njomen E, Tepe JJ. Regulation of autophagic flux by the 20S proteasome. Cell Chem Biol. 2019;26(9):1283–1294.e5. [DOI] [PMC free article] [PubMed] [Google Scholar]
- [45].Vats S, Manjithaya R, Subramani S. A reversible autophagy inhibitor blocks autophagosome–lysosome fusion by preventing Stx17 loading onto autophagosomes. Mol Biol Cell. 2019;30(17):2283–2295. [DOI] [PMC free article] [PubMed] [Google Scholar]
- [46].Fu R, Deng Q, Zhang H, et al. A novel autophagy inhibitor berbamine blocks SNARE-mediated autophagosome-lysosome fusion through upregulation of BNIP3. Cell Death Dis. 2018;9(2):243. [DOI] [PMC free article] [PubMed] [Google Scholar]
- [47].Dodson M, Liu P, Jiang T, et al. Increased O-GlcNAcylation of SNAP29 drives arsenic-induced autophagic dysfunction. Mol Cell Biol. 2018;38:11. [DOI] [PMC free article] [PubMed] [Google Scholar]
- [48].Moloney JN, Cotter TG. ROS signalling in the biology of cancer. Semin Cell Dev Biol. 2018;80:50–64. [DOI] [PubMed] [Google Scholar]
- [49].Wang K, Gong Q, Zhan Y, et al. Blockage of autophagic flux and induction of mitochondria fragmentation by paroxetine hydrochloride in lung cancer cells promotes apoptosis via the ROS-MAPK pathway. Front Cell Dev Biol. 2020;8:7. [DOI] [PMC free article] [PubMed] [Google Scholar]
- [50].Zhang L, Qiang PF, Yu JT, et al. Identification of compound CA-5f as a novel late-stage autophagy inhibitor with potent anti-tumor effect against non-small cell lung cancer. Autophagy. 2019;15(3):391–406. [DOI] [PMC free article] [PubMed] [Google Scholar]
- [51].Ariosa AR, Lahiri V, Lei Y, et al. A perspective on the role of autophagy in cancer. Biochim Biophys Acta Mol Basis Dis. 2021;1867:12. [DOI] [PMC free article] [PubMed] [Google Scholar]
- [52].Mastrodonato V, Morelli E, Vaccari T. How to use a multipurpose SNARE: the emerging role of Snap29 in cellular health. Cell Stress. 2018;2(4):72–81. [DOI] [PMC free article] [PubMed] [Google Scholar]
- [53].Morelli E, Mastrodonato V, Beznoussenko GV, et al. An essential step of kinetochore formation controlled by the SNARE protein Snap29. EMBO J. 2016;35(20):2223–2237. [DOI] [PMC free article] [PubMed] [Google Scholar]
- [54].Ciferri C, Pasqualato S, Screpanti E, et al. Implications for kinetochore-microtubule attachment from the structure of an engineered Ndc80 complex. Cell. 2008;133(3):427–439. [DOI] [PMC free article] [PubMed] [Google Scholar]
- [55].Jutten B, Keulers TG, Peeters HJM, et al. EGFRvIII expression triggers a metabolic dependency and therapeutic vulnerability sensitive to autophagy inhibition. Autophagy. 2018;14(2):283–295. [DOI] [PMC free article] [PubMed] [Google Scholar]
- [56].Yang S, Wang X, Contino G, et al. Pancreatic cancers require autophagy for tumor growth. Genes Dev. 2011;25(7):717–729. [DOI] [PMC free article] [PubMed] [Google Scholar]
- [57].Levy JMM, Foreman NK, Thorburn A. Using BRAFV600E as a marker of autophagy dependence in pediatric brain tumors. Autophagy. 2014;10(11):2077–2078. [DOI] [PMC free article] [PubMed] [Google Scholar]
- [58].Benitez JA, Finlay D, Castanza A, et al. PTEN deficiency leads to proteasome addiction: a novel vulnerability in glioblastoma. Neuro Oncol. 2021;23(7):1072–1086. [DOI] [PMC free article] [PubMed] [Google Scholar]
- [59].Ragazzoni Y, Desideri M, Gabellini C, et al. The thiazole derivative CPTH6 impairs autophagy. Cell Death Dis. 2013;4:3. [DOI] [PMC free article] [PubMed] [Google Scholar]
- [60].Fianco G, Mongiardi MP, Levi A, et al. Caspase-8 contributes to angiogenesis and chemotherapy resistance in glioblastoma. Elife. 2017;6:e22593. [DOI] [PMC free article] [PubMed] [Google Scholar]
Associated Data
This section collects any data citations, data availability statements, or supplementary materials included in this article.