

Abstract
Aim
To analyze the cost–effectiveness of treatment of relapsing remitting multiple sclerosis (RRMS) with cladribine tablets (CladT) and dimethyl fumarate (DMF) from the perspective of the Spanish National Health System (NHS).
Methods
A probabilistic Markov model (second-order Monte Carlo simulation) with a 10-year time horizon and annual Markov cycles was performed.
Results
CladT was the dominant treatment, with lower costs (-74,741 € [95% CI: -67,247; -85,661 €]) and greater effectiveness (0.1920 [95% CI: -0.1659; 0.2173] QALY) per patient, compared with DMF. CladT had a 95.1% probability of being cost-effective and a 94.1% chance of being dominant compared with DMF.
Conclusion
CladT is the dominant treatment (lower costs, with more QALYs) compared with DMF in the treatment of RRMS in Spain.
Keywords: cladribine tablets, cost–effectiveness, dimethyl fumarate, multiple sclerosis, relapsing-remitting multiple sclerosis
Plain language summary
What was the aim of this research?
To analyze the cost–effectiveness of treatment of relapsing remitting multiple sclerosis (RRMS) with cladribine tablets (CladT) and dimethyl fumarate (DMF) from the perspective of the Spanish National Health System (NHS).
How was the research carried out?
A probabilistic Markov model (second-order Monte Carlo simulation) with a 10-year time horizon and annual Markov cycles was performed, based on a model developed by the Canadian Agency for Drugs and Technologies in Health (CADTH). Data on progression, relapses, treatment adherence, treatment continuation and utilities (quality-adjusted life years [QALYs]) were obtained from the medical literature. Univariate sensitivity analyses (modifying time horizon, cost of treatment continuation, and CladT and DMF purchase prices) were performed to confirm and provide robustness to the results.
What were the results?
CladT was the dominant treatment, with lower costs (-74,741 € [95% CI: -67,247; -85,661 €]) and greater effectiveness (0.1920 [95% CI: -0.1659; 0.2173] QALY) per patient, compared with DMF. CladT had a 95.1% probability of being cost-effective for a willingness to pay of 25,000 € per QALY gained and remained dominant across the scenario analyses tested. In that sense, the scenario analyzed from a societal perspective, including labour costs, CladT was also dominant in 94.1% of the cases. The QALY gain (0.1920) with CladT versus DMF was clinically relevant.
What do the results of the study mean?
CladT is the dominant treatment (lower costs, with more QALYs) compared with DMF in the treatment of RRMS in Spain. These results serve as an important piece of evidence for policymakers, budget holders, and health advisers in decision-making when choosing among different treatment options for these patients.
Multiple sclerosis (MS) is a disease of the central nervous system characterised by inflammation, demyelination and degenerative changes [1]. Its onset is usually between 20 and 40 years of age and is two to three-times more common in women than men, being the most frequent cause of non-traumatic disability in the young adult population [1,2]. The prevalence of MS in Spain would range between 65 and 90 cases per 100,000 inhabitants [3–5] although according to some more recent studies it could be higher, between 112 and 184 cases per 100,000 inhabitants [6,7].
It is of interest to know the burden of the MS in Spain. According to a Spanish cross-sectional study [8], in addition to the accumulation of physical disability typical of MS, 92 and 64% of MS patients analyzed experienced fatigue and cognitive problems, respectively, with a mean utility (patient-perceived quality of life) of 0.772 and annual costs per patient ranging between 20,600 € with an Expanded Disability Status Scale (EDSS) score of 0 to 3 and 68,700 € with an EDSS score of 7 to 9. In Spain, the total annual cost of MS has been estimated at 1,395 € million (40% direct healthcare costs, 30% direct non-healthcare costs, 30% indirect costs) [9].
Most patients with MS at diagnosis, between 85 and 90%, present with a relapsing remitting form of MS (RRMS) characterised by periods of acute exacerbation (relapses) followed by periods of remission of neurological symptoms [8,10,11]. Dimethyl fumarate (DMF) and cladribine tablets (CladT) are indicated for the treatment of adult RRMS patients [12] and for the treatment of very active RRMS [13], respectively. Both drugs have been shown to be effective in RRMS [12,13]. Since the comparison against fingolimod already exists [14], the comparison against DMF has been addressed because it is the most prescribed oral treatment in Spain. On the other hand, the comparison between CladT and DMF is common in clinical practice, as is the case of the recently published real-life GLIMPSE study [15]. The cost–effectiveness of CladT versus DMF in Spain has not been previously evaluated.
The aim of this study was to evaluate the cost–effectiveness of both disease-modifying therapies (DMT), CladT and DMF, in the treatment of RRMS and from the perspective of the National Health System (NHS) in Spain.
Methods
Markov method
The characteristics of this model have been previously published by the Canadian Agency for Drugs and Technologies in Health (CADTH) [16,17] and the Norwegian Institute of Public Health (NIPH) [18]. The original model of the Canadian agency and that of the Norwegian institute have also been replicated in a study conducted in Saudi Arabia and published in 2017 [19]. The analysis is based on a Markov model that simulates the evolution of a cohort of RRMS patients through different clinical situations (health states) defined by the EDSS scale (from 0 to 10) that establishes the degree of disability and assesses disease progression. Each health state is associated with specific costs and clinical consequences. The health states in the model are mutually exclusive, in other words, each patient in a hypothetical cohort can only be in a particular health state at a particular point in time. Figure 1 shows the simplified outline of the model in which the transition between the five states and the resulting clinical and economic consequences were assessed in 1-year cycles [16,18,19]. State 1 includes patients with EDSS 0–2.5 (no or few functional or mobility limitations), state 2 refers to patients with an EDSS 3–5.5 (moderate functional or mobility limitations), state 3 (EDSS 6–7.5) includes patients who require walking assistance or a wheelchair and state 4 (EDSS 8–9.5) refers to those patients who must remain bedridden. Finally, state 5 is death due to MS or causes other than MS.
Figure 1. . Five-state Markov model, adapted from a model of the Canadian Agency for Drugs and Technologies in Health and the Norwegian Institute of Public Health [16,18].

Patients with relapsing remitting multiple sclerosis.
EDSS: Expanded Disability Status Scale.
During a Markov cycle, the patient may remain in his or her state or transition to another state of greater or lesser severity. In contrast to the Canadian model and according to expert opinion, a direct transition between states 1 and 2 without relapse was unlikely in our model, thus assuming that such a transition would only occur after a disease relapse, in other words, a patient in state 2 may return to state 1 (less severe). Only relapses in states 1 and 2 (EDSS 0–5.5) were considered. Although these can occur with an EDSS greater than or equal to 6, the severity of disability can make it difficult to identify relapses [16,17]. After relapse in states 1 and 2, the patient may either remain in the same state or progress to state 2 or state 3, respectively. Treatment discontinuation was assumed in state 3 (EDSS 6–7.5) [16,18,19] given that most patients in this state will be in the active secondary progressive MS (SPMS) phase and that DMF cannot be used in this phase. Also, we need to consider that the clinical trials analyzed in our work had been performed in RRMS. Patients in all states may progress to death (state 5, EDSS 10).
The characteristics of the patients in our model are those of the Canadian model [16], which were obtained through a systematic review of the literature. Specifically, 68% of patients being female, time since onset of five years, and an initial discrete distribution of EDSS score with a mean score of 2.3. The age of the patients was the average from Signori et al. [20]: 38 years.
All model assumptions (5-state Markov model structure, annual transition probabilities between Markov states in RRMS patients, utilities by EDSS status, resources use and unit costs considered in the model) were validated by a Spanish clinical expert in the management of RRMS (RG). The model was run using the TreeAge Pro Healthcare 2021 software [21]. The model was subjected to internal validation, defined as the extent to which the observed results represent the truth in the population we are studying and, thus, are not due to methodological errors.
Transition probabilities
Table 1 shows the annual transition probabilities (Tp) between Markov states according to the EDSS score. Tp were calculated from rates published by CADTH [16,17] and adjusted for treatment with CladT and DMF according to the hazard ratios for progression to disability described in the meta-analysis by Siddiqui et al. [22]. Final Tp were calculated using the formula Tp = e-rt (where “e” is the base of the natural logarithm, ‘r’ is the rate and ‘t’ is the time corresponding to the rate) [23]. At the start of the analysis, the cohort of patients was distributed among the different health states (59.3% in state 1, 21.8% in state 2, 11.4% in state 3 and 7.5% in state 4) according to the distribution observed in 462 Spanish patients [8]. The probability of annual mortality due to MS was derived from the relative risks described in the study by Su et al. [24] (1.45, 1.76, 3.14 and 4.88 in states 1, 2, 3 and 4, respectively). This risk of death from MS was added to the probability of death from all causes, obtained from the National Institute of Statistics [25], considering a mean age of 38 years of RRMS patients [20]. A mean body weight of 67.31 kg was considered. This was calculated from a publication by the Ministry of Health [26] according to which the mean weight for women is 64.258 kg and 76.478 kg for men. Furthermore, it was assumed that 75% of MS patients are women.
Table 1. . Annual transition probabilities between Markov states in RRMS patients. 10-year time horizon.
| From | To | Cladribine tablets | Dimethyl fumarate | ||||||
|---|---|---|---|---|---|---|---|---|---|
| Mean | Minimum | Maximum | SD | Mean | Minimum | Maximum | SD | ||
| State 1 | State 1 | 0.7933 | 0.7520 | 0.8346 | 0.0211 | 0.7057 | 0.6468 | 0.7646 | 0.0301 |
| State 1 | Relapse state 1 | 0.2037 | 0.1630 | 0.2444 | 0.0208 | 0.2913 | 0.2330 | 0.3496 | 0.0297 |
| State 1 | Death | 0.0030 | 0.0024 | 0.0036 | 0.0003 | 0.0030 | 0.0024 | 0.0036 | 0.0003 |
| Relapse State 1 | State 1 | 0.9658 | 0.9590 | 0.9726 | 0.0035 | 0.9227 | 0.9072 | 0.9382 | 0.0079 |
| Relapse State 1 | State 2 | 0.0342 | 0.0274 | 0.0410 | 0.0035 | 0.0773 | 0.0618 | 0.0928 | 0.0079 |
| State 2 | State 2 | 0.5637 | 0.4764 | 0.6510 | 0.0445 | 0.2943 | 0.1532 | 0.4354 | 0.0720 |
| State 2 | Relapse state 2 | 0.2995 | 0.2396 | 0.3594 | 0.0306 | 0.4161 | 0.3329 | 0.4993 | 0.0424 |
| State 2 | State 1 | 0.0263 | 0.0210 | 0.0316 | 0.0027 | 0.0559 | 0.0447 | 0.0671 | 0.0057 |
| State 2 | State 3 | 0.1069 | 0.0855 | 0.1283 | 0.0109 | 0.2301 | 0.1841 | 0.2761 | 0.0235 |
| State 2 | Death | 0.0036 | 0.0029 | 0.0043 | 0.0004 | 0.0036 | 0.0029 | 0.0043 | 0.0004 |
| Relapse State 2 | State 2 | 0.8931 | 0.8717 | 0.9145 | 0.0109 | 0.7699 | 0.7239 | 0.8159 | 0.0235 |
| Relapse State 2 | State 3 | 0.1069 | 0.0855 | 0.1283 | 0.0109 | 0.2301 | 0.1841 | 0.2761 | 0.0235 |
| State 3 | State 3 | 0.9095 | 0.8914 | 0.9276 | 0.0092 | 0.8098 | 0.7717 | 0.8479 | 0.0194 |
| State 3 | State 4 | 0.0841 | 0.0673 | 0.1009 | 0.0086 | 0.1838 | 0.1470 | 0.2206 | 0.0188 |
| State 3 | Death | 0.0064 | 0.0051 | 0.0077 | 0.0007 | 0.0064 | 0.0051 | 0.0077 | 0.0007 |
| State 4 | State 4 | 0.9901 | 0.9881 | 0.9921 | 0.0010 | 0.9901 | 0.9881 | 0.9921 | 0.0010 |
| State 4 | Death | 0.0099 | 0.0079 | 0.0119 | 0.0010 | 0.0099 | 0.0079 | 0.0119 | 0.0010 |
Utilities
The Markov state utilities and the loss of utilities associated with the occurrence of a relapse, from which the quality-adjusted life years (QALYs) associated with each health state were calculated, were obtained from the Canadian model (Table 2) [16,27].
Table 2. . Utilities by EDSS status.
| Item | Mean | LL CI95% | UL CI95% | SD |
|---|---|---|---|---|
| State 1 (EDSS 0-2.5) | 0.954 | 0.936 | 0.971 | 0.009 |
| State 2 (EDSS 3-5.5) | 0.870 | 0.823 | 0.917 | 0.024 |
| State 3 (EDSS 6-7.5) | 0.769 | 0.680 | 0.858 | 0.045 |
| State 4 (EDSS 8-9.5) | 0.491 | 0.372 | 0.609 | 0.060 |
| Loss of utility due to relapse† | -0.132 | -0.122 | -0.162 | -0.001 |
The disutility associated with relapses was calculated as the average of the values in CADTH model [16], considering that 33.8% of relapses are serious and 66.2% are mild-moderate, according to the Spanish study by Casado et al. [28].
95% CI: 95% confidence interval; EDSS: Expanded Disability Status Scale; LL: Lower limit; SD: Standard deviation; UL: Upper limit.
Costs
The analysis was done from the perspective of the NHS and therefore only direct healthcare costs were considered. All unit costs were updated to the year 2021 using the consumer price index (CPI) of the National Institute of Statistics. The cost of health states was calculated based on those described in the study by Casado et al. [29], while the cost of an RRMS relapse was obtained from a second Spanish study [28]. The healthcare resource use and unit costs for patient monitoring (blood chemistry test, complete blood count, MRI, neurologist consultation, tuberculin test) were obtained from the study by Poveda et al. (Table 3) [14].
Table 3. . Resource use and unit costs considered in the model.
| Item |
Cladribine tablets |
Dimethyl fumarate |
Refs. |
|---|---|---|---|
| Health resources for patient monitoring | |||
| |
Year 1/subsequent |
Year 1/subsequent |
|
| Blood chemistry test |
0/0 |
3/2 |
14 |
| Complete blood count |
3/3 |
3/2 |
Expert opinion |
| Nuclear magnetic resonance |
1/0 |
1/0 |
Expert opinion |
| Consultation with a neurologist |
2/1 |
3/1 |
Expert opinion |
| Consultation with an ophthalmologist |
0/0 |
0/0 |
Expert opinion |
| Tuberculin test | 1/0 | 0/0 | Expert opinion |
| Costs (€ 2021) | |||
|---|---|---|---|
|
Purchase of drugs
|
|
|
|
| Dose |
3.5 mg/kg |
480 mg/day |
30 |
| Units per pack |
1 tablet |
14/56 capsules |
30 |
| Doses per unit |
10 mg |
120/240 mg |
30 |
| Ex-factory price (ExFP) |
2,270€ |
134.30/1,074.40€ |
30 |
| ExFP with deduction of 7.5% |
2,099.75€ |
124.23/993.82€ |
30 |
| Cost of treatment for 10 years |
92,151€ |
153,300€ |
Calculated |
| Cost of treatment for 20 years |
183,742€ |
306,600€ |
Calculated |
| Cost of treatment for 40 years |
366,923€ |
613,200€ |
Calculated |
| Continuation of treatment after initial treatment failure |
20,336.86€ |
19,979.42€ |
Expert opinion |
| Continuation of treatment in 10 years |
44.20% |
53.00% |
34,35 |
| Continuation of treatment |
|
|
|
| Year 1 |
1.25% |
5.30% |
32 |
| Year 2 |
1.25% |
10.60% |
32 |
| Year 3 |
1.55% |
15.90% |
33 |
| Year 4 |
1.55% |
21.20% |
33 |
| Year 5 |
22.10% |
26.50% |
Calculated |
| Year 6 |
26.52% |
31.80% |
Calculated |
| Year 7 |
30.94% |
37.10% |
Calculated |
| Year 8 |
35.36% |
42.40% |
Calculated |
| Year 9 |
39.78% |
47.70% |
Calculated |
| Year 10 and subsequent |
44.20% |
53.00% |
Calculated |
|
Costs of monitoring (per patient and year)
| |||
| 10 years |
121.95€ |
317.20€ |
Calculated |
| 20 years |
142.17€ |
346.37€ |
Calculated |
| 40 years |
111.84€ |
302.61€ |
Calculated |
|
Costs of adverse events (per patient per year)
| |||
| Mean ± SD |
|
|
|
| Mild-moderate |
327.49€ ± 10.62€ |
575.63€ ± 73.00€ |
Calculated |
| Serious |
524.66€ ± 38.00€ |
286.61€ ± 12.38€ |
Calculated |
| Total |
852.15€ ± 48.62€ |
862.24€ ± 85.37€ |
Calculated |
|
Markov states, mean ± SD
|
|
|
|
| Direct/Indirect costs |
|
|
|
| State 1 |
3,500€/7,782€ |
28 |
|
| State 2 |
11,567€/13,164€ |
28 |
|
| State 3 |
22,933€/24,454€ |
28 |
|
| State 4 |
43,246€/22,480€ |
28 |
|
| Cost of relapse, mean ± SD |
7,966€ ± 1,453€ |
29 |
|
|
Unit costs of monitoring
|
|
|
|
| Blood chemistry test |
95.33€ |
14 |
|
| Complete blood count |
4.37€ |
14 |
|
| Nuclear magnetic resonance |
306.65€ |
14 |
|
| Consultation with a neurologist |
88.62€ |
14 |
|
| Consultation with an ophthalmologist |
88.87€ |
14 |
|
| Tuberculin test | 9.01€ | 14 | |
SD: Standard deviation.
The cost of the drugs (CladT and DMF) was calculated based on reported ex-factory prices in 2022 [30], recommended dosing regimens [12,13] and applying the corresponding deduction according to Royal Decree Law 8/2010 [31].
The annual probability of continuing treatment in patients initiating treatment with CladT and DMF was obtained from published studies (Table 3) [32–35]. CladT rescue medication was administered to 2.5% of patients in years 1 and 2 based on data from the CLARITY study [31] and in 3.1% in years 3 and 4, based on the CLARITY EXTENSION study [33,34,36], assuming an equitable annual distribution in both periods (1.25 and 1.55% per year, respectively). It is worth noting that, traditionally, management of active RRMS was based on the so-called maintenance therapy, like DMF, which is characterized by continuous treatment and a return of disease activity when the drug is discontinued. Regarding long-term data published on the ENDORSE study [35], with a median follow-up of 8.8 years on continuous treatment with DMF, a 53% of the exposed cohort needed a treatment adjustment. On the other hand, CladT is the only short-course oral administrated immune reconstitution therapy (IRT), with no more than 10 days of treatment per year over 2 years [13]. This innovative mechanism of action is based on the concept that the early depletion of autoreactive immune cells will have a long-term efficacy [37] and therefore has the potential to protect against relapses for years following the discontinuation of the treatment. In fact, given the CLASSIC study [34], after a median follow-up of 10.9 years, a 55.8% of the patients treated with CladT did not receive further treatment and therefore remained untreated for years, making the treatment with CladT more convenient [38]. Hence, for our analysis, the % of patients who needed a change in treatment from year 5 onwards after CladT and DMF was 44.2% and 53%, respectively. For DMF, it was assumed that there would be progressive continuation of treatment from year 1 onwards. The assumptions were validated by the clinical expert (RG). In the case of continuing treatment after CladT, in this analysis it was estimated that 70% of patients would be treated with ocrelizumab, 20% with fingolimod and 10% with natalizumab. Despite the possibility of continuing the treatment with CladT, we have not considered this assumption in our analysis waiting for real-world data. Regarding continuation of treatment after DMF, 30% would receive ocrelizumab, 40% fingolimod, 20% CladT and 10% natalizumab. The average cost result with these estimates, assumed by the clinical expert (RG), was subjected to a sensitivity analysis, modifying it by -20%; this variability includes the possible marketing of fingolimod generics.
The cost of managing adverse effects with CladT and DMF was calculated by analysing the results of the CLARITY and CLARITY EXTENSION studies of CladT and the DEFINE and CONFIRM studies of DMF. All adverse effects described in clinical trial articles [32,33,39–42] and reports published in the clinicaltrials.gov database [36,43–45] were compiled and evaluated. To obtain annual adverse event rates, patient-years were calculated for the studies analyzed (Table 3). Unit costs of adverse effects management were obtained from Spanish public sources and prices [46–59] and from a panel of Spanish clinical experts. The methodology used in this analysis has been previously published [60].
In the sub-analysis carried out from the societal perspective, indirect costs related to loss of work productivity (number of days/hours off work per year and early retirement) were obtained from a Spanish study [29] in which the electronic medical records of 200 adult patients with MS were reviewed. Thus, the number of days off work per year, the number of hours off work per year and changes in employment status (e.g. early retirement) due to MS were collected. Indirect costs were calculated using the human capital method (in the event of inability to work through illness, the loss can be calculated from the average daily income of a comparable person) [29]. The estimated indirect costs for each EDSS state are shown in Table 3.
Time horizon & discounts
The time horizon (duration) of the model was 10 years in the base case of the analysis (up to 48 years in an initial population of 38 years of age). The selection of the length period is because continuation of treatment assumptions and other longer-term assumptions would be very uncertain with a higher horizon. Moreover, this time horizon was considered in previously published analyses [16,18]. However, higher time horizons were tested in the sensitivity analysis. An annual discount rate of 3% was applied to both future costs and effects (QALYs) following current recommendations in Spain [61].
Analyses carried out
In the base case study, a probabilistic analysis was performed using second-order Monte Carlo simulation with a cohort of 1000 patients (or analysis). This methodology enables the analysis of the uncertainty of the model variables [62]. Costs (continuous variables) were fitted to gamma distributions; probabilities and utilities (dichotomous variables) were fitted to beta distributions based on the minimum and maximum values available or, alternatively, on a variability of 20% of the mean or available value of the variable [63,64]. The loss of utility associated with RRMS relapses was fitted to a log-normal distribution [16].
Sensitivity analyses were performed, modifying the time horizon (20 and 40 years), the cost of treatment continuation (-20%) due to the variability of retreatments in clinical practice and the purchase prices of CladT and DMF (minus 20% of the authorised ex-factory price for both treatments). An analysis was performed considering a 50% discount in the price of DMF, expected due to the upcoming marketing of DMF generics, and a 20% discount in the price of CladT as well. Finally, an analysis was also conducted from a societal perspective, including indirect costs related to loss of work productivity due to RRMS. The indirect costs associated with the different EDSS states were estimated based on published data from two Spanish studies (Table 3) [29,65].
Results
Base case (probabilistic analysis)
CladT was the dominant treatment, with lower costs (-74,741€ [95% CI: -67,247; -85,661€]) and higher effectiveness (0.1920 [95% CI: -0.1659; 0.2173] QALYs) per patient, compared with DMF. The probability that CladT was dominant, more effective with lower costs than DMF, was 94.1% for a willingness to pay of 25,000€ per QALY gained (Table 4 & Figure 2).
Table 4. . Base case results (probabilistic analysis).
| Treatment | Total cost per patient, mean (95% CI) | QALY per patient, mean (95% CI) | Difference in costs | Difference in QALY | Probability of cost–effectiveness CladT vs DMF |
|---|---|---|---|---|---|
| Cladribine tablets (CladT) | 199,884€ (174,395; 229,860€) |
6.6577 (2.4954; 7.4436) |
-74,741€ (-67,247; -85,661€) |
0.1920 (-0.1659; 0.2173) |
CladT is dominant: 94.1%† |
| Dimethyl fumarate (DMF) | 274,625€ (241,642; 315,521€) |
6.4657 (2.6613; 7.2263) |
CladT treatment is dominant: it is more effective, with lower costs, for a willingness to pay of 25,000 € per QALY gained.
CladT: Cladribine tablet; DMF: Dimethyl fumarate; QALY: Quality-adjusted life years.
Figure 2. . Incremental cost–effectiveness plane of cladribine tablets versus dimethyl fumarate.
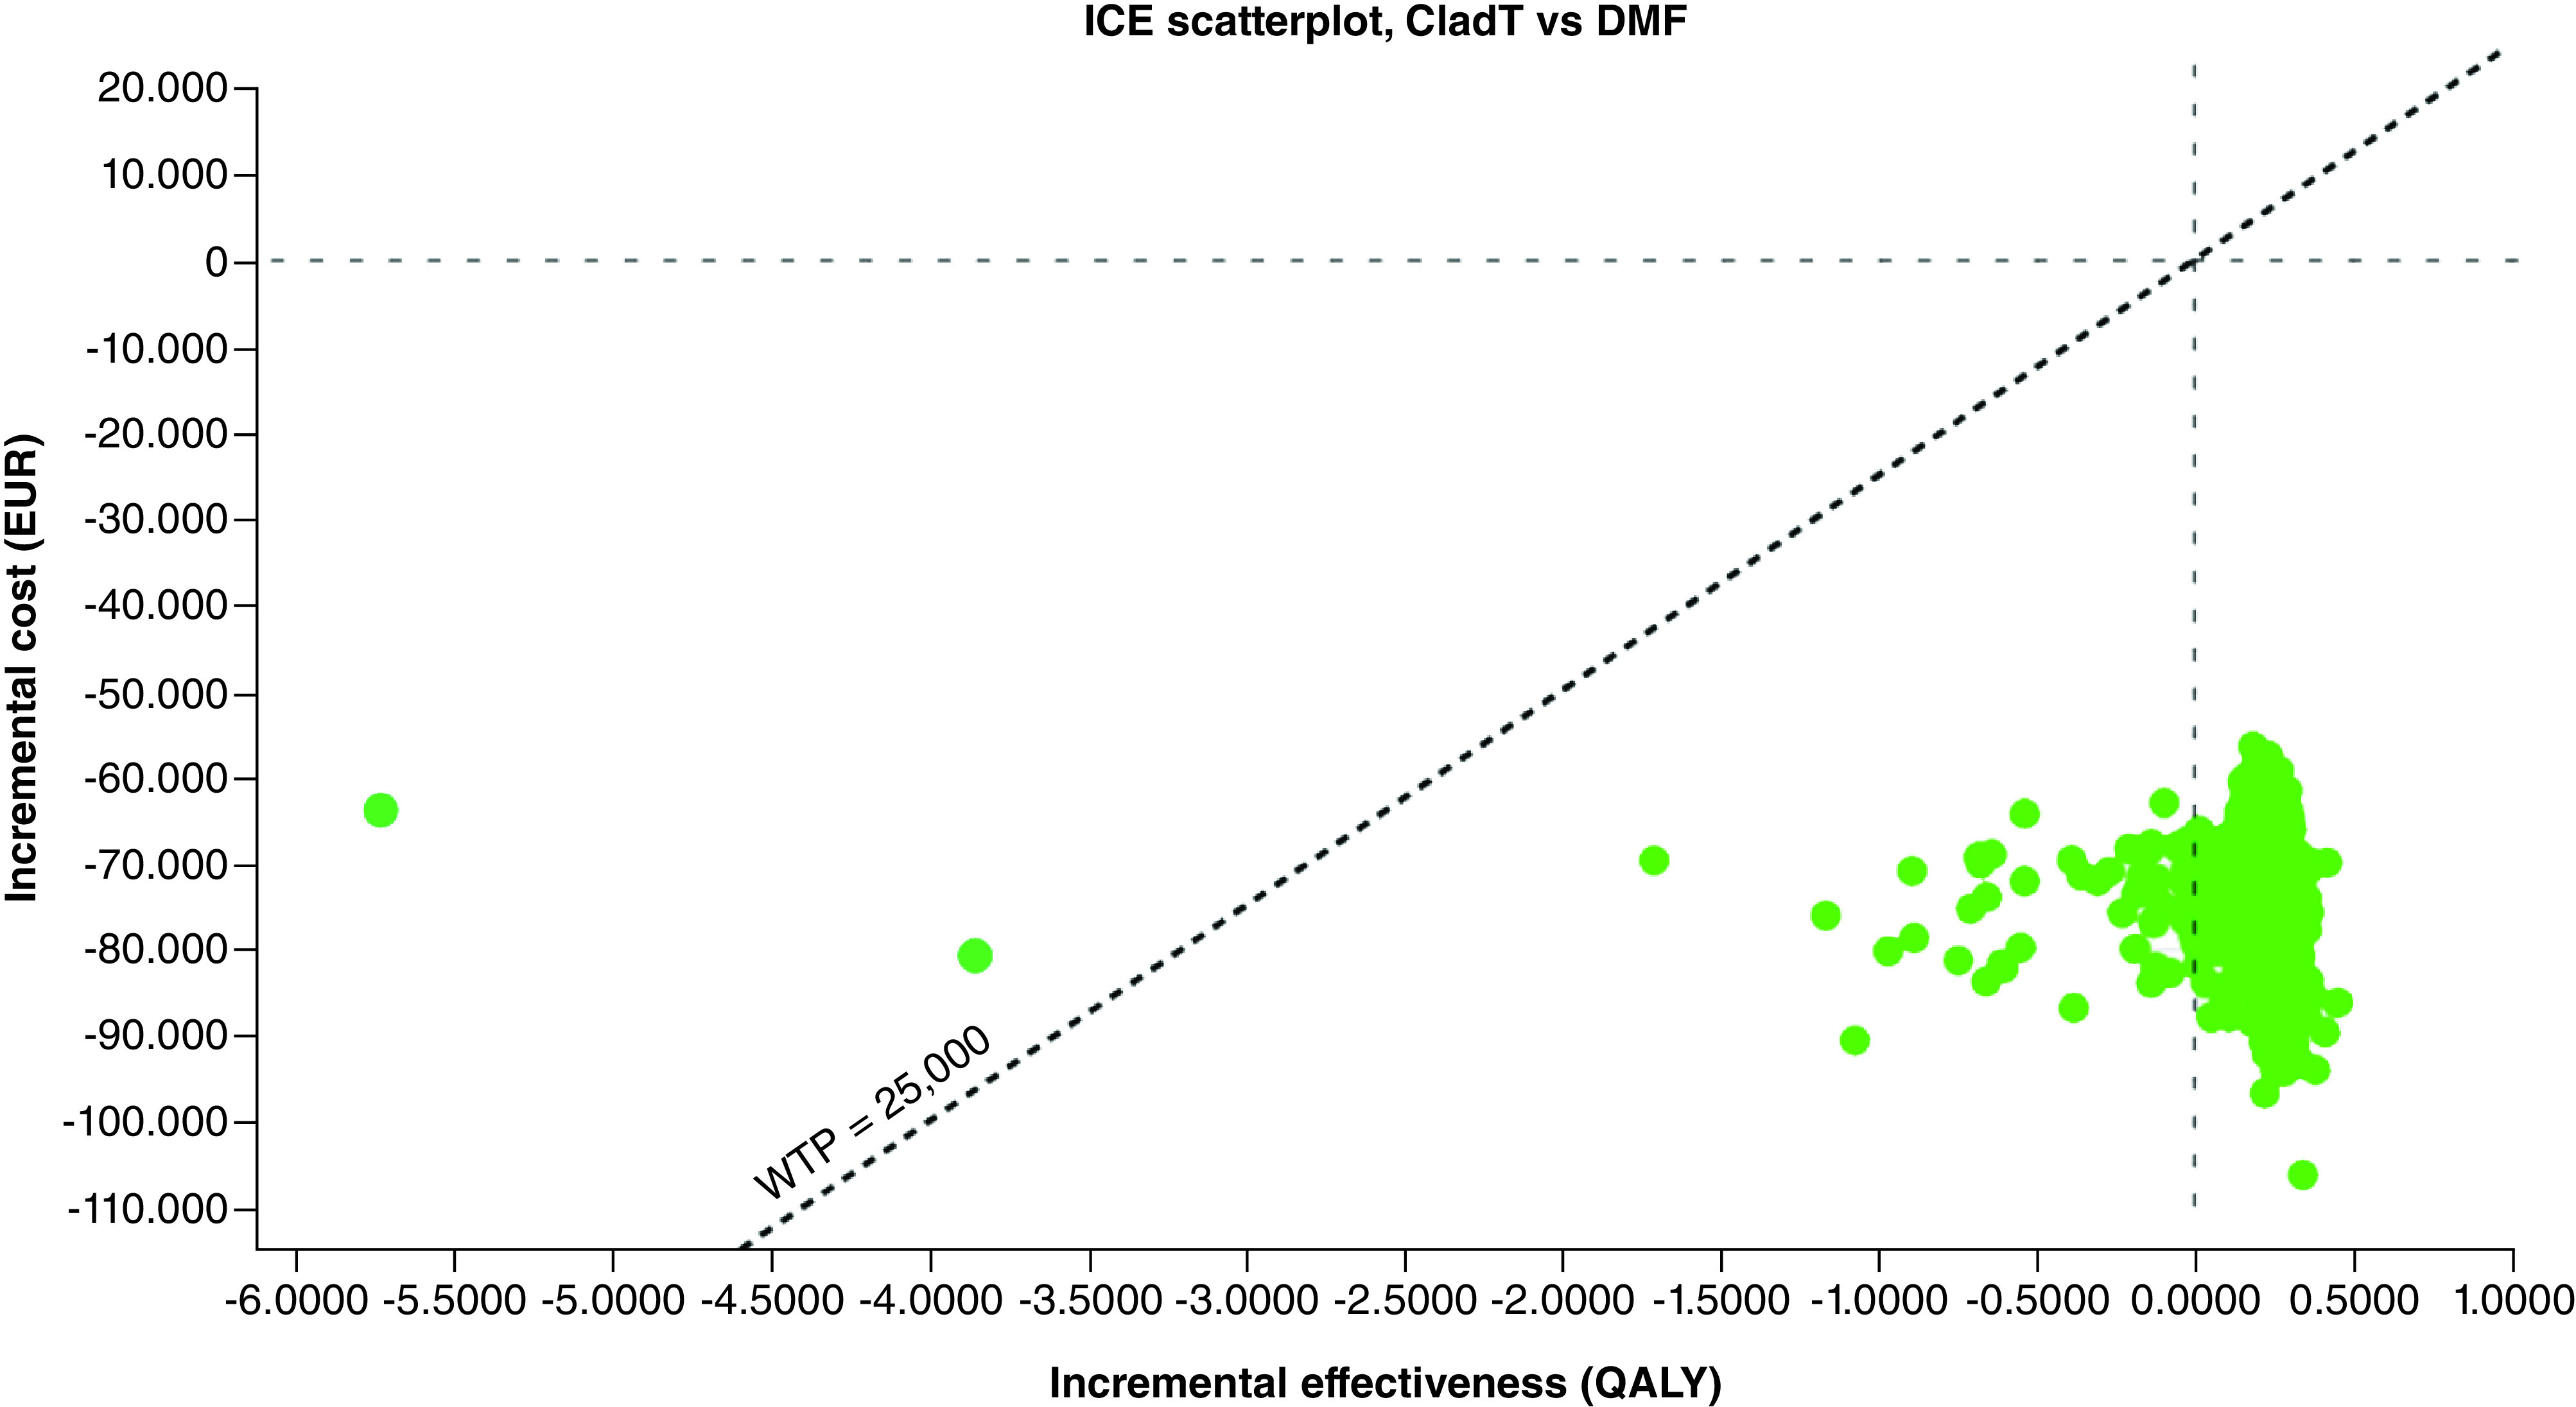
EUR: Euros; ICE: Incremental cost–effectiveness ratio; QALY: Quality-adjusted life years; WTP: Willingness to pay to gain one QALY: 25,000 €.
Sensitivity analyses
All sensitivity analyses confirmed the dominance of CladT over DMF (Table 5). CladT treatment remains dominant over DMF with time horizons of 20 and 40 years, modifying the cost of treatment continuation after initial treatment with DMF or CladT by -20%, reducing the purchase price of both drugs by 20% and considering indirect costs (labour costs) from a societal perspective. Finally, considering a 50% discount on the price of DMF, which is expected due to the upcoming marketing of DMF generics, as well as a 20% discount on the price of CladT, CladT was also the dominant treatment in 95.3% of the analyses.
Table 5. . Sensitivity analyses results.
| Item | CladT cost | DMF cost | CladT QALY | DMF QALY | Difference in costs | Difference in QALY | Cost per QALY gained/Cost–effectiveness probability |
|---|---|---|---|---|---|---|---|
| Base case | 199,884€ | 274,625€ | 6.6577 | 6.4657 | -74,741€ | 0.1920 | CladT is dominant: 94.1%† |
| Time horizon | |||||||
| 20 years (10 years more) | 355,683€ | 513,685€ | 11.3694 | 10.8033 | -158,002€ | 0.5661 | CladT is dominant: 96.6%† |
| 40 years (30 years more) | 555,819€ | 826,795€ | 16.9660 | 15.6734 | -270,976€ | 1.2926 | CladT is dominant: 96.6%† |
| Treatment continuation after initial treatment | |||||||
| Less than 20% of the base case cost | 193,169€ | 265,653€ | 6.5382 | 6.3585 | -72,484€ | 0.1797 | CladT is dominant: 95.5%† |
| Reduction in purchasing cost of CladT and DMF (20%) | 184,671€ | 249,421€ | 6.8211 | 6.6131 | -64,750€ | 0.2080 | CladT is dominant: 95.3%† |
| Societal perspective (including labor costs) | 306,700€ | 388,337€ | 6.1883 | 6.0484 | -81,637€ | 0.1399 | CladT is dominant: 94.1%† |
| 20% discount on the price of CladT and 50% on the price of DMF | 192,545€ | 237,479€ | 6.6727 | 6.4772 | -44,934€ | 0.1955 | CladT is dominant: 95.3%† |
CladT treatment is dominant: it is more effective with lower costs, for a willingness to pay of 25,000 € per QALY gained.
CladT: Cladribine tablet; DMF: Dimethyl fumarate; QALY: Quality-adjusted life year.
Discussion
According to the present analysis, CladT would generate both financial savings and QALY gain in the RRMS patient, due to the slower disability progression in the CladT arm versus DMF. In fact, at the end of the 10-year horizon, the % of patients in the health state 4, with higher indirect costs, was 18.2 and 30.2% for CladT and DMF, respectively. The amount of savings per patient over a 10-year treatment would be around 75,000 €, with a gain of 0.19 QALYs according to the probabilistic analysis. It should be noted that a difference of 0.19 QALYs in favour of CladT over DMF is clinically relevant, since it is generally considered that the minimum clinically relevant utility difference (i.e., that which the patient is able to detect) between two interventions observed with the EQ-5D, HUI2, HUI3 and SF-6D instruments would be 0.074, 0.030, 0.030 and 0.033 QALYs, respectively [66–69]. However, the QALYs gain with CladT compared with DMF would be even higher for a 40-year time horizon, amounting to 1.29 per patient. Savings with CladT were observed since the beginning of the time horizon and were also maintained after the recommended treatment course stated in the Summary of Products Characteristics, stablished in 4 years.
The economic model simulated the evolution of a cohort of RRMS patients treated with either CladT or DMF. In order to properly assess the results of the study, both possible limitations and their consistencies must be taken into account. Also, the former should be taken into consideration as this is a theoretical model, which means a simplified simulation of reality. It is a limitation of the model that the hazard ratios of confirmed disability progression for CladT and DMF versus placebo were obtained through a network meta-analysis [22] that analyzed subgroups of RRMS patients, because there are no head-to-head clinical trials in RRMS patients available. Another weakness of the study, common to many economic models, is that it was necessary to simulate the evolution of a hypothetical cohort of patients over the long term (10–40 years) using data from clinical trials with a maximum duration of 2 years [22]. As in previously published analyses [70–75] the study was modelled on the assumption that 2-year effectiveness results could be extrapolated to the longer term. However, as stated previously, data on treatment continuation after initial treatment were obtained from the CLASSIC and ENDORSE studies, which had a median follow-up of 10.9 and 8.8 years, respectively [34,35]. Evidence for the longer-term comparative efficacy of DMT versus placebo is limited for obvious ethical reasons [76]. Another limitation is that non-health direct costs were not included due to the design of the Spanish observational study from which the data was taken [29] as it didn't consider this information.
The major strength of the study lies in the stability of the economic model (maintaining the direction of the base case outcome in the sensitivity analyses), which was confirmed in all analyses. According to the probabilistic analysis, compared with DMF, CladT treatment of RRMS patients would be cost-effective in 95.1% of patients for a willingness to pay of 25,000 € per QALY gained. In this regard, it is important to note that even considering a 50% discount on the price of DMF, which is to be expected due to the upcoming marketing of generic DMF, as well as a 20% discount on the price of CladT, CladT was still the dominant treatment in 95.3% of the analyses. The analysis from a social perspective deserves also a special mention given that indirect labor costs are estimated to account for up to 61% of the total cost of RRMS [65], which is logical considering that the average age of RRMS patients generally ranges between 38 and 45 years, people with full-time employment [20,65]. The results under this perspective were consistent with all the scenarios analyzed, CladT dominant over DMF.
A Spanish cost–effectiveness analysis of RRMS treatment with CladT and fingolimod has been previously published [14]. According to this study, CladT was the dominant treatment versus fingolimod, with a cost–effectiveness probability of 94.2% and 94.5% for a willingness to pay of 20,000 € to 30,000 € per QALY gained. In an economic analysis conducted in Saudi Arabia, published in 2021, CladT was dominant compared with other treatments (alemtuzumab, DMF, fingolimod and interferon beta-1a and beta-1b) and was cost-effective against all comparators with a probability ranging from 81% to 100% [77], reaching 97.9% compared with DMF. Finally, in a cost–effectiveness analysis conducted in the UK [78], fingolimod was not dominant compared with DMF, with the cost of QALY gained with fingolimod versus DMF being £12,528 in the deterministic analysis and £14,076 in the probabilistic analysis, with a cost–effectiveness probability of 61 and 73%, respectively, for a willingness to pay of £20,000 to £30,000 per QALY gained.
Conclusion
In an economic study published in the Spanish Health Economic Association [79], spending in DMTs for MS has increased in the last years mainly due to the incorporation of innovative therapies. In fact, those therapies caused 37.43% of the total cost increase [79].
According to the present study, CladT treatment is, compared with DMF, a dominant treatment in this patient population, with lower costs (-74,741 € [95% CI: -67,247; -85,661 €]) and greater effectiveness (0.1920 [95% CI: -0.1659; 0.2173] QALY) versus DMF in the treatment of RRMS in Spain.
Hence, with a considerable QALYs gain, the use of CladT could be an efficient management strategy that generates savings and therefore contributes to the sustainability of the NHS in Spain.
Summary points.
A probabilistic Markov model was performed to analyze the cost–effectiveness of treatment of relapsing remitting multiple sclerosis (RRMS) with cladribine tablets (CladT) and dimethyl fumarate (DMF) from the perspective of the Spanish National Health System (NHS).
CladT was the dominant treatment, with lower costs (-74,741 € [95% CI: -67,247; -85,661 €]) and greater effectiveness (0.1920 [95% CI: -0.1659; 0.2173] QALY) per patient, compared with DMF.
CladT had a 95.1% probability of being cost-effective for a willingness to pay of 25,000 € per QALY gained and remained dominant across the scenario analyses tested.
In that sense, the scenario analyzed from a societal perspective, including labour costs, CladT was also dominant in 94.1% of the cases.
The QALY gain (0.1920) with CBD versus DMF was clinically relevant.
CladT is the dominant treatment (lower costs, with more QALYs) compared with DMF in the treatment of RRMS in Spain.
These results serve as an important piece of evidence for policymakers, budget holders, and health advisers in decision-making when choosing among different treatment options for these patients.
Footnotes
Author contributions
R Ginestal, C Rubio-Terrés, O Durán Morán, D Rubio-Rodríguez, H De los Santos, C Ordoñez and I Sánchez-Magro made the conceptualization of the economic model. The methodology was performed by all authors. D Rubio-Rodríguez and C Rubio-Terrés built the original economic model and wrote the first draft. Supervision was made by R Ginestal, O Durán Morán, H De los Santos, C Ordoñez and I Sánchez-Magro. All authors interpreted the data, reviewed, edited and agreed on the final version.
Financial & competing interests disclosure
This study was sponsored by Merck, S.L.U., Madrid, Spain, an affiliate of Merck KGaA. R Ginestal has received consultancy fees from Merck SLU for its advice in the development of this project. R Ginestal discloses having served on advisory boards for Almirall, Bayer, Biogen, Merck, Novartis, Sanofi Genzyme, and TEVA and has received investigational grants by Almirall, Bayer, Biogen, Novartis, Sanofi Genzyme and TEVA. D Rubio-Rodríguez is a senior consultant of Health Value, a company that has received fees in relation to the present study. C Rubio-Terrés is director of Health Value, a company that has received fees in relation to the present study. O Durán Morán is the senior HEOR technician at Merck. H De los Santos is the PR & HEOR manager at Merck. C Ordoñez is head of Medical Affairs Neurology at Merck. I Sánchez-Magro is the medical director at Merck. The authors have no other relevant affiliations or financial involvement with any organization or entity with a financial interest in or financial conflict with the subject matter or materials discussed in the manuscript apart from those disclosed.
No writing assistance was utilized in the production of this manuscript.
Open access
This work is licensed under the Attribution-NonCommercial-NoDerivatives 4.0 Unported License. To view a copy of this license, visit http://creativecommons.org/licenses/by-nc-nd/4.0/
References
Papers of special note have been highlighted as: • of interest; •• of considerable interest
- 1.Montalban X, Gold R, Thompson AJ et al. ECTRIMS/EAN Guideline on the pharmacological treatment of people with multiple sclerosis. Mult. Scler. 24, 96–120 (2018). [DOI] [PubMed] [Google Scholar]
- 2.MSSSI: Ministerio de Sanidad, Servicios Sociales e Igualdad. Estrategia en Enfermedades Neurodegenerativas del Sistema Nacional de Salud (2016). Available from: www.msps.es/organizacion/sns/planCalidadSNS/pdf/Est_Neurodegenerativas_APROBADA_C_INTERTERRITORIAL.pdf (Accessed December 2021).
- 3.Bártulos M, Marzo ME, Estrella LA, Bravo Y. Estudio epidemiológico de la esclerosis múltiple en La Rioja. Neurología 30, 552–560 (2015).24975346 [Google Scholar]
- 4.Izquierdo G, Venegas A, Sanabria C, Navarro G. Long-term epidemiology of multiple sclerosis in the Northern Seville District. Acta Neurol. Scand. 132, 111–117 (2015). [DOI] [PMC free article] [PubMed] [Google Scholar]
- 5.Carreón-Guarnizo E, Andreu-Reinón E, Cerdán-Sánchez M et al. Prevalencia de la esclerosis múltiple en la Región de Murcia. Rev. Neurol. 62, 396–402 (2016). [PubMed] [Google Scholar]
- 6.Perez-Carmona N, Gimenez-Martinez J, Borrego-Honrubia C, Sempere AP. Multiple sclerosis prevalence and incidence in San Vicente del Raspeig, Spain. Mult. Scler. Relat. Disord. 33, 78–81 (2019). [DOI] [PubMed] [Google Scholar]
- 7.García-Estévez DA, Fraga-González C, Ramos-Pacho ME, López-Díaz LM, Pardo-Parrado M, Prieto JM. Prevalencia de la esclerosis múltiple en la ciudad de Ourense, Galicia, noroeste de la Península Ibérica [The prevalence of multiple sclerosis in the city of Ourense, Galicia, in the north-west of the Iberian Peninsula]. Rev. Neurol. 71, 19–25 (2020). [DOI] [PubMed] [Google Scholar]
- 8.Oreja-Guevara C, Kobelt G, Berg J, Capsa D, Eriksson J. The European Multiple Sclerosis Platform. New insights into the burden and costs of multiple sclerosis in Europe: Results for Spain. Mult. Scler. J. 23(2S), 166–178 (2017). [DOI] [PubMed] [Google Scholar]
- 9.Fernández O, Calleja-Hernández MA, Meca-Lallana J, Oreja-Guevara C, Polanco A, Pérez-Alcántara F. Estimate of the cost of multiple sclerosis in Spain by literature review. Expert Rev. Pharmacoecon. Outcomes Res. 17, 321–333 (2017). [DOI] [PubMed] [Google Scholar]
- 10.Weinshenker BG, Bass B, Rice GP et al. The natural history of multiple sclerosis: a geographically based study. I. Clinical course and disability. Brain 112, 133–146 (1989). [DOI] [PubMed] [Google Scholar]
- 11.Confavreux C, Vukusic S. Natural history of multiple sclerosis: a unifying concept. Brain 129, 606–616 (2006). [DOI] [PubMed] [Google Scholar]
- 12.Tecfidera 120 mg/240 mg cápsulas duras gastrorresistentes. Ficha técnica o Resumen de Características del Producto. 20 de septiembre de 2018. Available from: https://cima.aemps.es/cima/pdfs/es/ft/113837001/FT_113837001.pdf (Accessed 14 December 2021).
- 13.Mavenclad 10 mg comprimidos. Ficha técnica o Resumen de Características del Producto. 22 de agosto de 2017. Available from: https://cima.aemps.es/cima/pdfs/es/ft/1171212001/FT_1171212001.pdf (Accessed 14 December 2021).
- 14.Poveda JL, Trillo JL, Rubio-Terrés C, Rubio-Rodríguez D, Polanco A, Torres C. Cost–effectiveness of Cladribine tablets and fingolimod in the treatment of relapsing multiple sclerosis with high disease activity in Spain. Expert Rev. Pharmacoecon. Outcomes Res. 20, 295–303 (2020). [DOI] [PubMed] [Google Scholar]; • Previous cost–effectiveness analysis vs. fingolimod in Spain.
- 15.Butzkueven H, Spelman T, Ozakbas S et al. MSBase Study Group. Real-world comparative effectiveness and persistence of cladribine tablets and other oral disease-modifying treatments for multiple sclerosis from GLIMPSE: Results from the MSBase Registry (P12-4.003). Neurology 98(Suppl. 18), 1373 (2022). [Google Scholar]
- 16.Canadian Agency for Drugs and Technologies in Health. CADTH Therapeutic Review. Comparative clinical and Cost–effectiveness of drug therapies for relapsing-remitting multiple sclerosis. Canadian Agency for Drugs and Technologies in Health, Canada (CADTH Therapeutic Review vol.1, no. 2b). Available from: http://www.cadth.ca/media/pdf/TR0004_RRMS_ScienceReport_e.pdf (Accessed 30 August 2021). ; •• Original model.
- 17.Tremlett H, Zhu F, Petkau J, Oger J, Zhao Y. BC MS Clinic Neurologists. Natural, innate improvements in multiple sclerosis disability. Mult. Scler. 18, 1412–1421 (2012). [DOI] [PubMed] [Google Scholar]
- 18.Couto E, Hamidi V, Ringerike T, Odgaard-Jensen J, Harboe I, Klemp M. Medicines Used for Multiple Sclerosis – a Health Technology Assessment. Report from the Norwegian Institute of Public Health No. 2016-23. Knowledge Centre for the Health Services at The Norwegian Institute of Public Health (NIPH), Norway (2016). [PubMed] [Google Scholar]; •• Canadian model adapted.
- 19.Alsaqa'aby MF, Vaidya V, Khreis N, Khairallah TA, Al-Jedai AH. Cost–effectiveness of oral agents in relapsing-remitting multiple sclerosis compared to interferon-based therapy in Saudi Arabia. Ann. Saudi Med. 37, 433–443 (2017). [DOI] [PMC free article] [PubMed] [Google Scholar]; • Canadian model adapted.
- 20.Signori A, Saccà F, Lanzillo R, Maniscalco GT, Signoriello E, Repice AM. Cladribine vs other drugs in MS: merging randomized trial with real-life data. Neurol. Neuroimmunol. Neuroinflamm. 7, e878 (2020). [DOI] [PMC free article] [PubMed] [Google Scholar]
- 21.TreeAge Pro Healthcare 2021. TreeAge Software LCC, MA, USA. Available from: www.treeage.com (Accessed 18 December 2021).
- 22.Siddiqui MK, Khurana IS, Budhia S et al. Systematic literature review and network meta-analysis of cladribine tablets versus alternative disease-modifying treatments for relapsing-remitting multiple sclerosis. Curr. Med. Res. Opin. 34, 1361–1371 (2017). [DOI] [PubMed] [Google Scholar]
- 23.Petitti DB. Meta-Analysis, Decision Analysis, and Cost–effectiveness Analysis. Methods for Quantitative Synthesis in Medicine. Oxford University Press, NY, USA: (1994). [Google Scholar]
- 24.Su W, Kansal A, Vicente C, Deniz B, Sarda S. The Cost–effectiveness of delayed-release dimethyl fumarate for the treatment of relapsing-remitting multiple sclerosis in Canada. J. Med. Econ. 19, 718–727 (2016). [DOI] [PubMed] [Google Scholar]
- 25.INE. Tablas de mortalidad por año, sexo, edad y funciones. Resultados nacionales, por comunidades autónomas y provincias. Available from: www.ine.es/jaxiT3/Datos.htm?t=27150#!tabs-grafico (Accessed 18 June 2021).
- 26.Estrategia en Enfermedades Neurodegenerativas del Sistema Nacional de Salud. Estrategia aprobada por el Consejo Interterritorial el Sistema Nacional de Salud el 13 de abril de 2016. Ministerio de Sanidad, Servicios Sociales e Igualdad. Madrid (2016). Available from: www.mscbs.gob.es/organizacion/sns/planCalidadSNS/pdf/Est_Neurodegenerativas_ APROBADA_C_INTERTERRITORIAL.pdf (Accessed 18 June 2021).
- 27.Prosser LA, Kuntz KM, Bar-Or A, Weinstein MC. Cost–effectiveness of interferon beta-1a, interferon beta-1b, and glatiramer acetate in newly diagnosed non-primary progressive multiple sclerosis. Value Health 7, 554–568 (2004). [DOI] [PubMed] [Google Scholar]
- 28.Casado V, Bonaventura I, Brieva L et al. Direct costs of relapses in patients with relapsing-remitting multiple sclerosis. Neurol. Persp. 1(3), 160–169 (2021). [Google Scholar]; • Multiple sclerosis costs in Spain.
- 29.Casado V, Martínez-Yélamos S, Martínez-Yélamos A et al. Direct and indirect costs of multiple sclerosis in Baix Llobregat (Catalonia, Spain), according to disability. BMC Health Serv. Res. 6, 143 (2006). [DOI] [PMC free article] [PubMed] [Google Scholar]; • Multiple sclerosis costs in Spain.
- 30.BotPlus 2.0. Consejo General de Colegios Oficiales de Farmacéuticos (CGCOF) (2021). Available from: www.portalfarma.com (Accessed 18 June 2021).
- 31.Real Decreto-ley 8/2010, de 20 de mayo, por el que se adoptan medidas extraordinarias para la reducción del déficit público. BOE N° 126, Lunes 24 de mayo de 2010: 45070.
- 32.Giovannoni G, Comi G, Cook S et al. A placebo-controlled trial of oral cladribine for relapsing multiple sclerosis. N. Engl. J. Med. 362, 416–426 (2010). [DOI] [PubMed] [Google Scholar]
- 33.Giovannoni G, Soelberg Sorensen P et al. Safety and efficacy of cladribine tablets in patients with relapsing-remitting multiple sclerosis: results from the randomized extension trial of the CLARITY study. Mult. Scler. 24, 1594–1604 (2018). [DOI] [PubMed] [Google Scholar]
- 34.Giovannoni G, Leist T, Aydemir A, Verdun E. on behalf of the CLASSIC-MS Steering Committee. Long-term efficacy for patients receiving cladribine tablets in CLARITY/CLARITY extension: primary results from 9-15 years of follow-up in the CLASSIC-MS study. Presented at: ECTRIMS 2021 Virtual Congress. (13-15 October 2021). [Google Scholar]
- 35.Gold R, Arnold DL, Bar-Or A et al. Long-term safety and efficacy of dimethyl fumarate for up to 13 years in patients with relapsing-remitting multiple sclerosis: final ENDORSE study results. Mult. Scler. 28(5), 801–816 (2022). [DOI] [PMC free article] [PubMed] [Google Scholar]
- 36.CLARITY Extension Study. ClinicalTrials.gov Identifier: NCT00641537 (2020). Available from: https://clinicaltrials.gov/ct2/show/NCT00641537?term=cladribine+clarity&draw=2&rank=1 (Accessed: 17 December 2021).
- 37.Meuth SG, Ruck T, Aktas O, Hartung HP. Cladribin-Tabletten: Orale Immuntherapie der schubförmigen Multiplen Sklerose mit kurzen, jährlichen Behandlungsphasen [Cladribine tablets: Oral immunotherapy of relapsing-remitting multiple sclerosis with short yearly treatment periods]. Nervenarzt 89, 895–907 (2018). [DOI] [PubMed] [Google Scholar]
- 38.Giovannoni G, Mathews J. Cladribine tablets for relapsing-remitting multiple sclerosis: a clinician's review. Neurol. Ther. 11, 571–595 (2022). [DOI] [PMC free article] [PubMed] [Google Scholar]
- 39.Fox RJ, Miller DH, Phillips JT et al. Placebo-controlled Phase 3 study of oral BG-12 or glatiramer in multiple sclerosis. N. Engl. J. Med. 367, 1087–1097 (2012). [DOI] [PubMed] [Google Scholar]
- 40.Gold R, Kappos L, Arnold DL et al. Placebo-controlled phase 3 study of oral BG-12 for relapsing multiple sclerosis. N. Engl. J. Med. 367, 1098–1107 (2012). [DOI] [PubMed] [Google Scholar]
- 41.Cook S, Leist T, Comi G et al. Safety of cladribine tablets in the treatment of patients with multiple sclerosis: an integrated analysis. Mult. Scler. Relat. Disord. 29, 157–167 (2019). [DOI] [PubMed] [Google Scholar]
- 42.Liang G, Chai J, Ng HS, Tremlett H. Safety of dimethyl fumarate for multiple sclerosis: a systematic review and meta-analysis. Mult. Scler. Relat. Disord. 46, 102566 (2020). [DOI] [PubMed] [Google Scholar]
- 43.A Safety and Efficacy Study of Oral Cladribine in Subjects with Relapsing-remitting Multiple Sclerosis (RRMS) (CLARITY). ClinicalTrials.gov Identifier: NCT00213135 (2014). Available from: https://clinicaltrials.gov/ct2/show/NCT00213135?term=cladribine++clarity&draw=2&rank=3 (Accessed 17 December 2021).
- 44.Efficacy and Safety Study of Oral BG00012 With Active Reference in Relapsing-Remitting Multiple Sclerosis (CONFIRM). ClinicalTrials.gov Identifier: NCT00451451 (2015a). Available from: https://clinicaltrials.gov/ct2/show/NCT00451451 (Accessed 17 December 2021).
- 45.Efficacy and Safety of Oral BG00012 in Relapsing-Remitting Multiple Sclerosis (DEFINE). ClinicalTrials.gov Identifier: NCT00420212 (2015b). Available from: https://clinicaltrials.gov/ct2/show/NCT00420212 (Accessed 17 December 2021).
- 46.De Luis D, González JL, Aller R, González M, Cuellar L, Terroba MC. Hipotiroidismo: implicaciones clínicas y económicas en un área de salud. An. Med. Intern. 20, 127–133 (2003). [PubMed] [Google Scholar]
- 47.Badía X, Roset M, Francés JM, Álvarez C, Rubio Terrés C. Estudio de costes de la gripe. Aten Primaria 38, 260–267 (2006). [DOI] [PMC free article] [PubMed] [Google Scholar]
- 48.Resolución del director general del Servicio de salud de modificación del anexo I de la Orden de la Consejería de Salud y Consumo de 22 de diciembre de 2006. BOIB N° 89, 1 d julio de 2014.
- 49.Llibre-Codina JM, Casado-Gómez MA, Sánchez-de la Rosa R et al. Cost of nucleoside analogue reverse transcriptase inhibitor-related toxicity in HIV-1-infected patients. Enferm. Infecc. Microbiol. Clin. 25, 98–107 (2007). [DOI] [PubMed] [Google Scholar]
- 50.Sicras-Mainar A, Navarro-Artieda R. Cost of arterial hypertension according to levels of morbidity in primary care setting. Med. Clin. (Barc.) 133(8), 290–295 (2009). [DOI] [PubMed] [Google Scholar]
- 51.Estudio de evaluación económica de la accidentabilidad de las personas mayores en España. Madrid: Fundación Mapfre, Noviembre de 2012.
- 52.Oyagüez I, Frías C, Seguí MA et al. Eficiencia de tratamientos oncológicos para tumores sólidos en España. Farm. Hosp. 37, 240–259 (2013). [DOI] [PubMed] [Google Scholar]
- 53.Betegón L, Canal C, Escolar G et al. Cost–effectiveness analysis of apixaban versus dabigatran for prevention of stroke in patients with non-valvular atrial fibrillation in Spain. Eur. J. Clin. Pharm. 16, 325–338 (2014). [Google Scholar]
- 54.Sánchez J, Chantada V. Abordaje práctico de la patología urológica en Atención Primaria. Algoritmos diagnóstico-terapéuticos. Barcelona: EdikaMed (2014). [Google Scholar]
- 55.González Y, Sicras A, Larraínzar R, Sorio F, Canals L, Lizán L et al. Estimación de los costes sanitarios relacionados con las fracturas osteoporóticas en pacientes posmenopáusicas en España. PharmacoEcon. Span. Res. Art. 12, 1–9 (2015). [Google Scholar]
- 56.Rejas Gutiérrez J, Blanca Tamayo M, Gascón Barrachina J, Armada Peláez B. Economic evaluation of desvenlafaxine in the treatment of major depressive disorder in Spain. Rev. Psiquiatr. Salud Ment. 9, 87–96 (2016). [DOI] [PubMed] [Google Scholar]
- 57.Isla D, De Castro J, Juan O et al. Costs of adverse events associated with erlotinib or afatinib in first-line treatment of advanced EGFR-positive non-small cell lung cancer. ClinicoEcon. Outcomes Res. 9, 31–38 (2017). [DOI] [PMC free article] [PubMed] [Google Scholar]
- 58.Orden 727/2017, de 7 de agosto, del consejero de sanidad, por la que se fijan los precios públicos por la prestación de los servicios y actividades de naturaleza sanitaria de la red de centros de la Comunidad de Madrid. BOCM N° 198, 21 agosto 2017.
- 59.Tarifas para facturación de servicios sanitarios y docentes del Servicio vasco de salud para el año 2020. Servicio vasco de salud, diciembre de 2019.
- 60.Irimia P, Santos-Lasaosa S, García Bujalance L, Ramos Pinazo L, Rubio-Rodríguez D, Rubio-Terrés C. Cost of fremanezumab, erenumab, galcanezumab and onabotulinumtoxinA associated adverse events, for migraine prophylaxis in Spain. Expert Rev. Pharmacoecon. Outcomes Res. 21, 285–297 (2021). [DOI] [PubMed] [Google Scholar]
- 61.López-Bastida J, Oliva J, Antoñanzas F et al. Propuesta de guía para la evaluación económica aplicada a las tecnologías sanitarias. Gac. Sanit. 24, 154–170 (2010). [DOI] [PubMed] [Google Scholar]
- 62.Rubio-Terrés C, Rubio-Rodríguez D. Probabilistic analysis: sensitivity analysis or main result? Pharmacoeconomics 1, 2 (2016). [Google Scholar]
- 63.Briggs A, Claxton K, Sculpher M. Decision Modelling for Health Economic Evaluation. Oxford University Press, UK: (2007). [Google Scholar]
- 64.Gray AM, Clarke PM, Wolstenholme JL, Wordsworth S. Applied Methods of Cost–effectiveness Analysis in Healthcare. Oxford University Press, UK: (2012). [Google Scholar]
- 65.Sicras-Mainar A, Ruíz-Beato E, Navarro-Artieda R, Maurino J. Impact on healthcare resource utilization of multiple sclerosis in Spain. BMC Health Serv. Res. 17, 854 (2017). [DOI] [PMC free article] [PubMed] [Google Scholar]
- 66.Brazier J, Roberts J, Tsuchiya A, Busschbach J. A comparison of the EQ-5D and SF-6D across seven patient groups. Health Econ. 13, 873–884 (2004). [DOI] [PubMed] [Google Scholar]
- 67.Horsman J, Furlong W, Feeny D, Torrance G. The Health Utilities Index (HUI): concepts, measurement properties and applications. Health Qual. Life Outcomes 1, 54 (2003). [DOI] [PMC free article] [PubMed] [Google Scholar]
- 68.Walters SJ, Brazier JE. What is the relationship between the minimally important difference and health state utility values? The case of the SF-6D. Health Qual. Life Outcomes 1, 4 (2003). [DOI] [PMC free article] [PubMed] [Google Scholar]
- 69.Wee H-L, Machin D, Loke W-C et al. Assessing differences in utility scores: a comparison of four widely used preference-based instruments. Value Health 10, 256–265 (2007). [DOI] [PubMed] [Google Scholar]
- 70.Palace J, Duddy M, Bregenzer T et al. Effectiveness and Cost–effectiveness of interferon beta and glatiramer acetate in the UK Multiple Sclerosis Risk Sharing Scheme at 6 years: a clinical cohort study with natural history comparator. Lancet Neurol. 14, 497–505 (2015). [DOI] [PubMed] [Google Scholar]
- 71.Tappenden P, Chilcott J, O'Hagan T et al. Cost–effectiveness of beta interferons and glatiramer acetate in the management of multiple sclerosis: final report to the National Institute for Clinical Excellence (2001). Available from: www.academia.edu/8908699/Cost_effectiveness_of_beta_interferons_and_glatiramer_acetate_in_the_management_of_multiple_sclerosis (Accessed 31 January 2018). [Google Scholar]
- 72.Tappenden P, McCabe C, Chilcott J et al. Cost–effectiveness of disease-modifying therapies in the management of multiple sclerosis for the Medicare population. Value Health 12, 657–665 (2009). [DOI] [PubMed] [Google Scholar]
- 73.Peninsula Technology Assessment Group (PenTAG). The effectiveness and Cost–effectiveness of natalizumab for multiple sclerosis: an evidence review of the submission from Biogen (2007). Available from: www.nice.org.uk/guidance/ta127/resources/multiple-sclerosis-natalizumabevaluation-report-evidence-review-group-report2 (Accessed 31 January 2018).
- 74.Gani R, Giovannoni G, Bates D, Kemball B, Hughes S, Kerrigan J. Cost–effectiveness analyzes of natalizumab (Tysabri) compared with other disease-modifying therapies for people with highly active relapsing-remitting multiple sclerosis in the UK. Pharmacoeconomics 26, 617–627 (2008). [DOI] [PubMed] [Google Scholar]
- 75.Chilcott J, McCabe C, Tappenden P et al. Modelling the Cost–effectiveness of interferon beta and glatiramer acetate in the management of multiple sclerosis. Commentary: evaluating disease modifying treatments in multiple sclerosis. BMJ 326(7388), 522; discussion 522 (2003). [DOI] [PMC free article] [PubMed] [Google Scholar]
- 76.Hettle R, Harty G, Wong SL. Cost–effectiveness of cladribine tablets, alemtuzumab and natalizumab in the treatment of relapsing-remitting multiple sclerosis with high disease activity in England. J. Med. Econ. 21(7), 676–686 (2018). [DOI] [PubMed] [Google Scholar]
- 77.Bohlega S, Elboghdady A, Al-Johani A et al. Economic evaluation of cladribine tablets in patients with high disease activity-relapsing-remitting multiple sclerosis in the Kingdom of Saudi Arabia. Value Health Reg. Issues 25, 189–195 (2021). [DOI] [PubMed] [Google Scholar]
- 78.Maruszczak MJ, Montgomery SM, Griffiths MJ, Bergvall N, Adlard N. Cost-utility of fingolimod compared with dimethyl fumarate in highly active relapsing-remitting multiple sclerosis (RRMS) in England. J. Med. Econ. 18, 874–885 (2015). [DOI] [PubMed] [Google Scholar]
- 79.Hidalgo A, Ivanova A, Nozaya N. Análisis del gasto asociado a los tratamientos de esclerosis múltiple en España durante el periodo 2004-2016. Available from: www.aes.es/Jornadas2017/pdfs/posters/Aes_2017_14_1.pdf (Accessed 6 June 2022). [Google Scholar]