

Abstract
Background:
Disparities in readmission risk and reasons they might exist among diverse complex patients with multimorbidity, disability, and unmet social needs have not been clearly established. These characteristics may be underestimated in claims-based studies where individual-level data are limited. We sought to examine the risk of readmissions and postdischarge mortality by race and ethnicity after rigorous adjustment for multimorbidity, physical functioning, and sociodemographic and lifestyle characteristics.
Methods:
We used Health and Retirement Study (HRS) data linked to Medicare claims. To obtain ICD-9-CM diagnostic codes to compute the ICD-coded multimorbidity-weighted index (MWI-ICD) we used Medicare Parts A and B (inpatient, outpatient, carrier) files between 1991–2015. Participants must have had at least one hospitalization between January 1, 2000 and September 30, 2015 and continuous enrollment in fee-for-service Medicare Part A 1-year prior to hospitalization. We used multivariable logistic regression to assess the association of MWI-ICD with 30-day readmissions and mortality 1-year postdischarge. Using HRS data, we adjusted for age, sex, BMI, smoking, physical activity, education, household net worth, and living arrangement/marital status, and examined for effect modification by race and ethnicity.
Results:
The final sample of 10,737 participants had mean±SD age 75.9±8.7 years. Hispanic adults had the highest mean MWI-ICD (16.4±10.1), followed by similar values for White (mean 14.8±8.9) and Black (14.7±8.9) adults. MWI-ICD was associated with a higher odds of readmission, and there was no significant effect modification by race and ethnicity. For postdischarge mortality, a 1-point increase MWI-ICD was associated with a 3% higher odds of mortality (OR=1.03, 95%CI: 1.03–1.04), which did not significantly differ by race and ethnicity.
Conclusions:
Multimorbidity was associated with a monotonic increased odds of 30-day readmission and 1-year postdischarge mortality across all race and ethnicity groups. There was no significant difference in readmission or mortality risk by race and ethnicity after robust adjustment.
Keywords: multiple chronic conditions, comorbidity, hospital readmission, health disparities
INTRODUCTION
Disparities in hospital readmission risk and reasons they might exist among diverse complex patients have not been clearly established. Medically and socially complex patients, including those with multimorbidity (multiple chronic conditions), disability, and unmet health-related social needs, have among the highest rates of 30-day hospital readmissions.1, 2 Racial disparities in readmission rates have also been reported. For example, Black adults had a significantly higher risk of 30-day readmissions compared with White adults across several primary conditions including myocardial infarction, congestive heart failure, and surgical procedures3–5 after adjustment for covariates including comorbidity using the Elixhauser Comorbidity Score6 or Readmission After Heart Failure scale.4 In the National Cancer Database, Black and Native Hawaiian/Pacific Islander women had elevated readmission risk following surgical management of endometrial cancer compared with White women in models adjusted for Charlson-Deyo comorbidities.7–9
In contrast, other studies have reported no association between race and ethnicity and readmissions. Among Medicare beneficiaries with chronic obstructive pulmonary disease, similar readmission rates were observed for White, Black, and Hispanic adults after adjustment for high-risk clinical profiles, demographic variables, and prior healthcare utilization.10 Among Veterans with congestive heart failure seen within the equal-access Veterans Affairs Healthcare System, Black and White adults had the same 30-day all-cause readmission rates after adjustment for age, sex, survival days, and 15 Charlson index7 conditions.11 Similarly, Deswal and colleagues reported the same rate of 30-day readmissions in Black and White Veterans and better survival in Black versus White Veterans hospitalized with congestive heart failure.12 Thus, studies on racial disparities by race and ethnicity in readmission risk have been mixed.
Scholars hypothesize that Black-White disparities observed in mid-to-late life may reflect differences in cumulative exposure to racialized risks and psychosocial stressors throughout the lifespan.13 For example, disparities can increase risk factors upstream to readmissions such as exposure to institutional racism, chronic stress,13 social disadvantage, worse healthcare access and quality, and subsequently, increased chronic disease development. Measures to quantify multifaceted social risk factors such as institutional racism are limited. However, we hypothesize that robust measures that capture individual-level health status and cumulative illness burden up until hospital admission can be applied to improve upon prior studies examining differences by race and ethnicity on readmission risk. For example, multimorbidity is often underestimated due to incomplete disease inventories and measurement at a narrow timepoint through admission or discharge diagnoses. Fortunately, recent advances in multimorbidity measurement can mitigate this gap by successfully capturing cumulative multimorbidity through an expansive inventory of chronic conditions and lookback period that carries forward chronic conditions after positive case ascertainment. Disability and functional limitations are also important risk factors for readmissions and mortality1 but are not routinely captured in clinical settings or claims data. To help address this gap, the multimorbidity-weighted index (MWI) weights chronic conditions by their impact on physical functioning. Such models that embed physical functioning are particularly useful in large datasets such as claims, where in-person physical assessments are impractical.
To help identify the etiology of disparities in readmissions and measure equity of care, the Centers for Medicare and Medicaid Services (CMS) Guide to Reducing Disparities in Readmissions recommends stratifying data by race, ethnicity, and language, and analyzing quality measures such as 30-day readmission rates.14 Thus, in this study we aimed to examine the risk of readmissions and postdischarge mortality by race and ethnicity after rigorous adjustment for multimorbidity, physical functioning, and sociodemographic and lifestyle characteristics.
METHODS
Sample population
We included Health and Retirement Study (HRS) participants who consented to have their data linked to their CMS Medicare claims at the individual level (Supplemental Figure 1). The HRS is a nationally-representative open cohort of >38,000 US adults aged >50 years starting in 1992. HRS participants are interviewed in-person at baseline and then followed biennially through telephone or in-person interviews. Participants provide information on physician-diagnosed medical conditions, functioning and disability, behavioral and lifestyle behaviors, employment, income, and living situation. The HRS oversamples Black and Hispanic adults at twice the rate as White adults and has historically retained minority participants.
We used Medicare Parts A and B (inpatient, outpatient, carrier) files between 1991–2015 to obtain ICD-9-CM diagnostic codes to assess multimorbidity. Participants must have had at least one hospitalization between January 1, 2000 and September 30, 2015 and continuous enrollment in fee-for-service Medicare Part A 1-year prior to hospitalization. For participants with multiple admissions between January 1, 2000 and September 30, 2015, we used the date of first admission, and each participant contributed only one observation. Participants must have also completed at least one HRS interview preceding their hospital admission. Because the HRS survey is administered biennially, we used demographic information from the most recent survey preceding the initial hospital admission to adjust for individual-level covariates. We excluded participants missing complete covariate data from the HRS survey prior to admission (N=464) or an HRS interview preceding initial hospitalization (N=550). This study was approved by the UCLA and University of Michigan Institutional Review Boards (IRB#20–002145, HUM00128383).
Multimorbidity measurement and assessment
Multimorbidity was measured using a previously described person-centered ICD-9 coded multimorbidity-weighted index (MWI-ICD9). MWI is a patient-centered measure of multimorbidity that includes 84 conditions weighted by their impacts on the Short Form-36 physical functioning scale.15 MWI represents an individual’s cumulative chronic disease burden and physical functioning since chronic conditions are weighted by their average impacts on physical functioning over the life course.16–18 Thus, MWI incorporates both illness burden and functioning into a clinically meaningful measure applicable to the general population.
ICD-9 diagnostic codes to compute MWI-ICD were obtained from CMS outpatient, inpatient, and carrier files. For positive disease case ascertainment, we used the CMS Chronic Conditions Warehouse method of one inpatient or two outpatient ICD-codes within a two-year period.19 Conditions with positive case ascertainment were then considered present from the first ICD-diagnostic code and carried forward thereafter. We performed a lookback period between 1991–2015, and if conditions were discovered to have been diagnosed even earlier, we used the first date of diagnosis to begin the carry-forward.
Four of the 84 MWI conditions that could be completely reversible or definitively treated (cataract, peptic ulcer, cystitis, and thyroid nodule) were not carried forward and only considered present if diagnosed within a year prior to admission date.
We computed the predictor MWI-ICD by summing the physical functioning-weighted conditions for each participant. We assessed MWI-ICD as a continuous standardized variable, in quartiles, and per 1 standard deviation increase for the entire sample.
Race and ethnicity assessment
Race and ethnicity are self-reported in the HRS through two sequential questions. First, “Do you consider yourself Hispanic or Latino?” and second, “Do you consider yourself primarily White or Caucasian, Black or African American, American Indian, Asian, or something else?” The resulting mutually exclusive groups were non-Hispanic White (White), non-Hispanic Black (Black), and Hispanic. The remaining American Indian, Asian, and other race and ethnicity responses were categorized as “other” and were a heterogeneous and inadequate sample to disaggregate due to HRS sample size restrictions.
30-day readmission assessment
The primary outcome, 30-day readmissions, was obtained from the CMS MedPAR file. Readmissions was a binary variable that indicated whether a readmission occurred within 30 days of the first admission. If a new admission occurred after the first admission and was within 30-days from the first admission date, the patient was considered to have a 30-day readmission.
Mortality measurement and assessment
Mortality was assessed between January 1, 2000 and September 30, 2015 using the CMS Master Beneficiary Summary File outcome “date of death.” We examined mortality by race and ethnicity at 30, 90 and 365-days postdischarge following the initial admission.
Death information obtained by CMS includes data from the Social Security Administration, Medicare claims data from the Medicare Common Working File, Railroad Retirement Board, and online date of death edits submitted by family members.20 Virtually all (99%) of dates of death were validated by CMS. Due to variations in data sources, some participants only have the month and year of death documented, so their day of death was set to the end of the month.
Covariates
Covariate data were obtained from the HRS biennial survey using the most recent self-reported survey preceding the initial hospital admission. We adjusted for the following covariates: age (continuous), sex (female, male), education (<12 years, 12 years, 13–15 years, ≥16 years), living arrangement/marital status (married and/or living with domestic partner, unmarried and living with another individual, unmarried and living alone), household net worth (quartiles), body mass index (<18.5, 18.5–24.9, 25–29.9, ≥30 kg/m2), vigorous physical activity (< 3 or ≥3 times/week), and smoking status (current, former, or never smoker).
Statistical analysis
We used descriptive statistics accounting for the HRS complex survey design to report demographic and clinical participant characteristics. Continuous variables were examined for normality and outliers. Means and standard deviations were calculated for continuous variables. Frequencies and percent were tabulated for categorical variables.
We conducted analyses for two sets of outcomes, 30-day readmissions and postdischarge mortality. The two outcomes, 30-day readmission and postdischarge mortality, were binary. To assess the association between MWI-ICD with 30-day readmissions and postdischarge mortality, we used multivariable logistic regression models adjusted for potential confounders. For both sets of analyses, we adjusted for age, sex, body mass index, smoking, vigorous physical activity, education, household net worth, and living arrangement/marital status from the HRS interview.
To examine for interactions between multimorbidity with race and ethnicity for readmissions and postdischarge mortality, we examined for effect modification by race and ethnicity. Stratified analyses were conducted for each race and ethnicity category. The effect of MWI-ICD and covariates on readmission and postdischarge mortality was presented as odds ratios with 95% confidence intervals and two-sided P-values. All analyses were conducted using SAS version 9.4 (SAS Institute, Inc., Cary, NC).
RESULTS
The final sample included 10,737 adults with a mean (SD) age of 75.9 (8.7) years and a mean MWI-ICD of 14.9 (9.0) with a range of 0 to 66.1 units (Table 1). Within 1-year of discharge from the initial admission, 2129 participants (19.8%) were readmitted and 1545 (14.4%) had died.
Table 1.
Participant characteristics by race and ethnicity at baseline.
| All (N = 10,737) |
Non-Hispanic White (N = 8,422) |
Non-Hispanic Black (N = 1,466) |
Hispanic (N = 652) |
Other Race (N = 197) |
|
|---|---|---|---|---|---|
| Age (years) (Mean ± SD) | 75.9 ± 8.7 | 76.4 ± 8.5 | 74.2 ± 9.4 | 74.5 ± 9.1 | 73.7 ± 9.1 |
| Age group (N, %) | |||||
| < 65 years | 646 (6.0) | 388 (4.6) | 176 (12.0) | 56 (8.6) | 26 (13.2) |
| 65–74 years | 4,476 (41.7) | 3455 (41.0) | 637 (43.4) | 300 (46.0) | 84 (42.6) |
| 75–84 years | 3,711 (34.6) | 3027 (36.0) | 422 (28.8) | 197 (30.2) | 65 (33.0) |
| ≥ 85 | 1,904 (17.7) | 1552 (18.4) | 231 (15.8) | 99 (15.2) | 22 (11.2) |
| Sex (N, %) | |||||
| Male | 4,646 (43.3) | 3,722 (44.2) | 568 (38.7) | 272 (41.7) | 84 (42.6) |
| Female | 6,091 (56.7) | 4,700 (55.8) | 898 (61.3) | 380 (58.3) | 113 (57.4) |
| Body mass index (kg/m2) (N, %) | |||||
| < 18.5 | 297 (2.8) | 240 (2.9) | 38 (2.6) | 13 (2.0) | 6 (3.1) |
| 18.5–24.9 | 3758 (35.0) | 3125 (37.1) | 381 (26.0) | 182 (27.9) | 70 (35.3) |
| 25–29.9 | 4040 (37.6) | 3205 (38.1) | 517 (35.3) | 245 (37.6) | 73 (37.1) |
| ≥ 30 | 2642 (24.6) | 1852 (22.0) | 530 (36.2) | 212 (32.5) | 48 (24.4) |
| Smoking status (N, %) | |||||
| Never | 4448 (41.4) | 3486 (41.4) | 600 (41.0) | 278 (42.6) | 84 (42.6) |
| Former | 4876 (45.4) | 3890 (46.2) | 622 (42.4) | 285 (43.7) | 79 (40.1) |
| Current | 1413 (13.2) | 1046 (12.4) | 244 (16.6) | 89 (13.7) | 34 (17.3) |
| Vigorous physical activity (N, %) | |||||
| < 3 times per week | 8038 (74.9) | 6149 (73.0) | 1211 (82.6) | 527 (80.8) | 151 (76.7) |
| ≥ 3 times per week | 2699 (25.1) | 2273 (27.0) | 255 (17.4) | 125 (19.2) | 46 (23.4) |
| Education (years) (N, %) | |||||
| < 12 | 3,516 (32.7) | 2,164 (25.7) | 786 (53.6) | 483 (74.1) | 83 (42.1) |
| 12 | 3,639 (33.9) | 3,136 (37.2) | 372 (25.4) | 85 (13.0) | 46 (23.4) |
| 13–15 | 1,830 (17.0) | 1,571 (18.7) | 171 (11.7) | 52 (8.0) | 36 (18.3) |
| ≥ 16 | 1,752 (16.3) | 1,551 (18.4) | 137 (9.4) | 32 (4.9) | 32 (16.2) |
| Household net worth ($) (N, %) | |||||
| Q1 (<$30,500) | 2,684 (25.0) | 1,546 (18.4) | 710 (48.4) | 343 (52.6) | 85 (43.2) |
| Q2 ($30,501–121,400) | 2,683 (25.0) | 1,966 (23.3) | 464 (31.7) | 205 (31.4) | 48 (24.4) |
| Q3 ($121,401–340,000) | 2,688 (25.0) | 2,369 (28.1) | 210 (14.3) | 71 (10.9) | 38 (19.3) |
| Q4 (>$340,000) | 2,682 (25.0) | 2,541 (30.2) | 82 (5.6) | 33 (5.1) | 26 (13.2) |
| Marital status/living arrangement (N, %) | |||||
| Married | 5922 (55.2) | 4916 (58.4) | 587 (40.0) | 322 (49.4) | 97 (49.3) |
| Unmarried/lives with another individual | 1581 (14.7) | 958 (11.4) | 413 (28.2) | 165 (25.3) | 45 (22.8) |
| Unmarried/lives alone | 3234 (30.1) | 2548 (30.3) | 466 (31.8) | 165 (25.3) | 55 (27.9) |
| Multimorbidity-weighted index, ICD-coded (MWI-ICD) (Mean ± SD) | 14.9 ± 9.0 | 14.8 ± 8.9 | 14.7 ± 8.9 | 16.4 ± 10.1 | 14.2 ± 8.7 |
| MWI-ICD Median | 13.46 | 13.4 | 13.3 | 14.6 | 12.8 |
| Readmission within 30 days (N, %) | 2129 (19.8) | 1663 (19.8) | 311 (21.2) | 121 (18.6) | 34 (17.3) |
Note. Used ANOVA for continuous variables and Chi-square test for categorical variables. All p-values <0.001 except for Readmission within 30 days (p=0.35).
Participant characteristics by race and ethnicity
Participants were 78.4% White, 13.7% Black, 6.1% Hispanic, and 1.8% other race (Table 1). There were fewer Black men (38.7%) than women (61.3%), but similar male to female ratios for White, Hispanic, and other race adults. On average, White adults were about 2 years older than Black, Hispanic, and other race adults. There were more <65 year-old Black (12.0%) and other race adults (13.2%) compared with White (4.6%) and Hispanic (8.6%) adults.
White and other race adults were less overweight/obese, more vigorously physically active, and more likely to have completed a college degree than Black and Hispanic adults. White adults had the highest household net worth, on average, compared with other race, Black, and Hispanic adults.
Multimorbidity by race and ethnicity
The mean MWI-ICD was statistically significantly different (ANOVA p=0.0001) but of modest clinically meaningful difference between race and ethnicity groups. Hispanic participants had the highest mean MWI-ICD (16.4 ± 10.1) of all participants. White (mean 14.8 ± 8.9) and Black (14.7 ± 8.9) participants had a modestly higher mean MWI-ICD than other race participants (14.2 ± 8.7) (Table 1). The distribution of MWI-ICD was similar across race and ethnicity categories (Figure 1).
Figure 1.
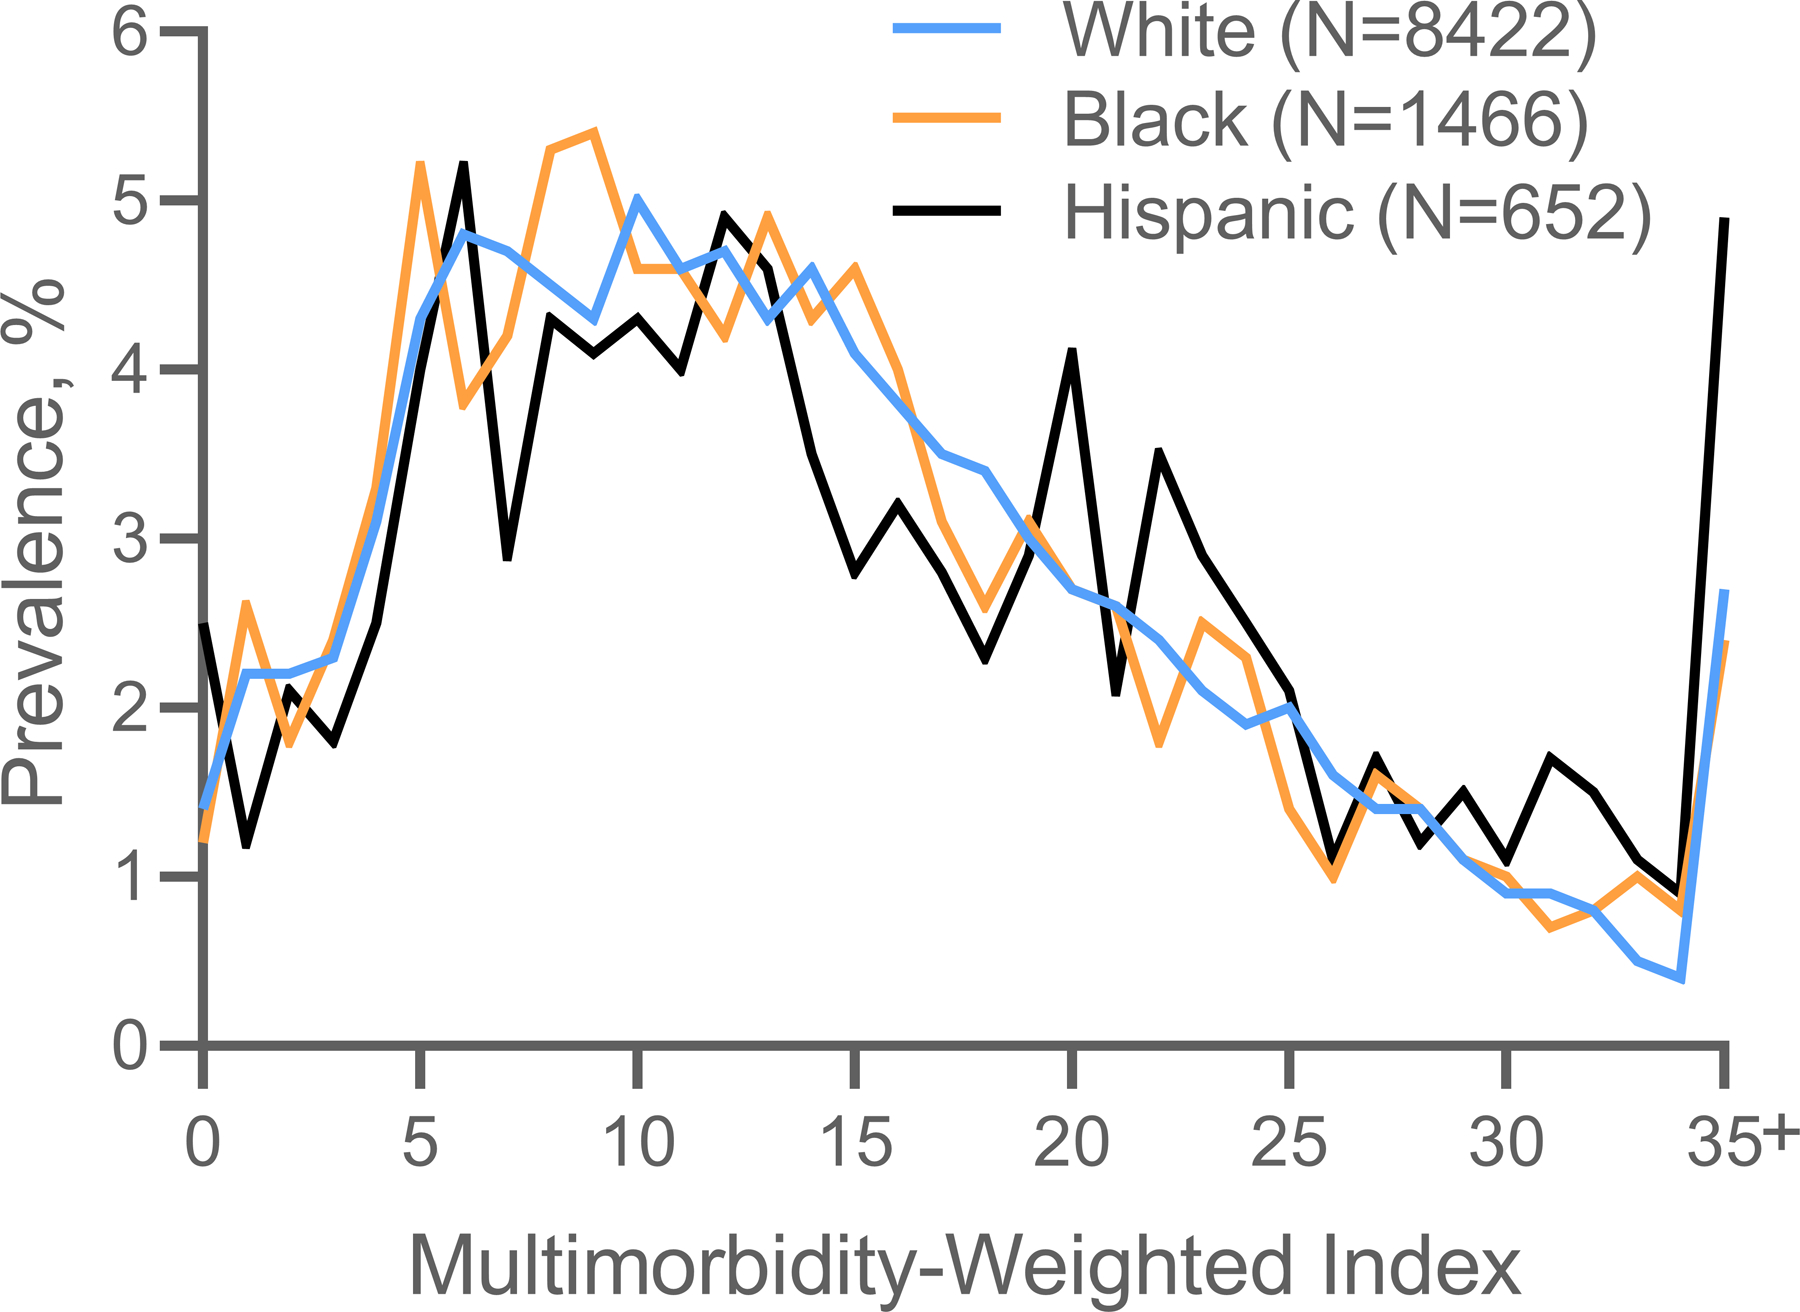
Distribution of ICD-coded multimorbidity-weighted index by race and ethnicity.
Note: ICD-coded multimorbidity-weighted index values were combined for 35 and above since unable to show small sample sizes per HRS protocol.
30-day readmissions by race and ethnicity
There was no statistically significant difference in 30-day readmissions by race and ethnicity: 1663 (19.8%) White adults, 311 (21.2%) Black adults, and 121 (18.6%) Hispanic adults experienced a readmission within 30-days of discharge from the initial admission (p=0.35) (Table 1).
As MWI-ICD quartiles increased, the odds of readmission increased (Table 2, Figure 2). This result persisted after adjustment for all covariates. Participants in the highest quartile MWI-ICD experienced a 92% higher odds of readmission compared with those in the first quartile (OR=1.92, 95% CI: 1.65–2.22) (Figure 2). A 1-point increase in MWI-ICD was associated with a 2% statistically significant higher odds of readmission (OR=1.02, 95% CI: 1.02–1.03) (Table 2).
Table 2.
30-day readmission risk across ICD-coded multimorbidity-weighted index quartiles, by race and ethnicity.
| MWI-ICD, continuous | MWI-ICD, Quartile 1 (0–8.05) |
MWI-ICD, Quartile 2 (8.06–13.44) |
MWI-ICD, Quartile 3 (13.45–20.24) |
MWI-ICD, Quartile 4 (20.25–66.09) |
P for trend | ||||||
|---|---|---|---|---|---|---|---|---|---|---|---|
| Race and Ethnicity | ORa (95% CI) | P value | ORa (95% CI) | P value | ORa (95% CI) | P value | ORa (95% CI) | P value | ORa (95% CI) | P value | |
| All, N=10,737 | 1.02 (1.02, 1.03) | <0.001 | 1.00 (reference) | 1.29 (1.12, 1.50) | <0.001 | 1.60 (1.38, 1.85) | <0.001 | 1.92 (1.65, 2.22) | <0.001 | <0.001 | |
| White, N=8,422 | 1.02 (1.01, 1.03) | <0.001 | 1.26 (1.07, 1.50) | 0.005 | 1.57 (1.34, 1.85) | <0.001 | 1.72 (1.45, 2.03) | <0.001 | <0.001 | ||
| Black, N=1,466 | 1.04 (1.02, 1.05) | <0.001 | 1.44 (0.98, 2.12) | 0.061 | 1.42 (0.96, 2.11) | 0.079 | 2.61 (1.78, 3.83) | <0.001 | <0.001 | ||
| Hispanic, N=652 | 1.03 (1.01, 1.06) | 0.002 | 0.82 (0.40, 1.68) | 0.592 | 2.02 (1.04, 3.92) | 0.038 | 2.72 (1.46, 5.07) | 0.002 | <0.001 | ||
Note. Abbreviations: CI, confidence interval; MWI-ICD, ICD-coded multimorbidity-weighted index; OR, odds ratio
Adjusted for age, sex, education, household net worth, body mass index, smoking status, vigorous physical activity, and marital status/living arrangement.
Figure 2.
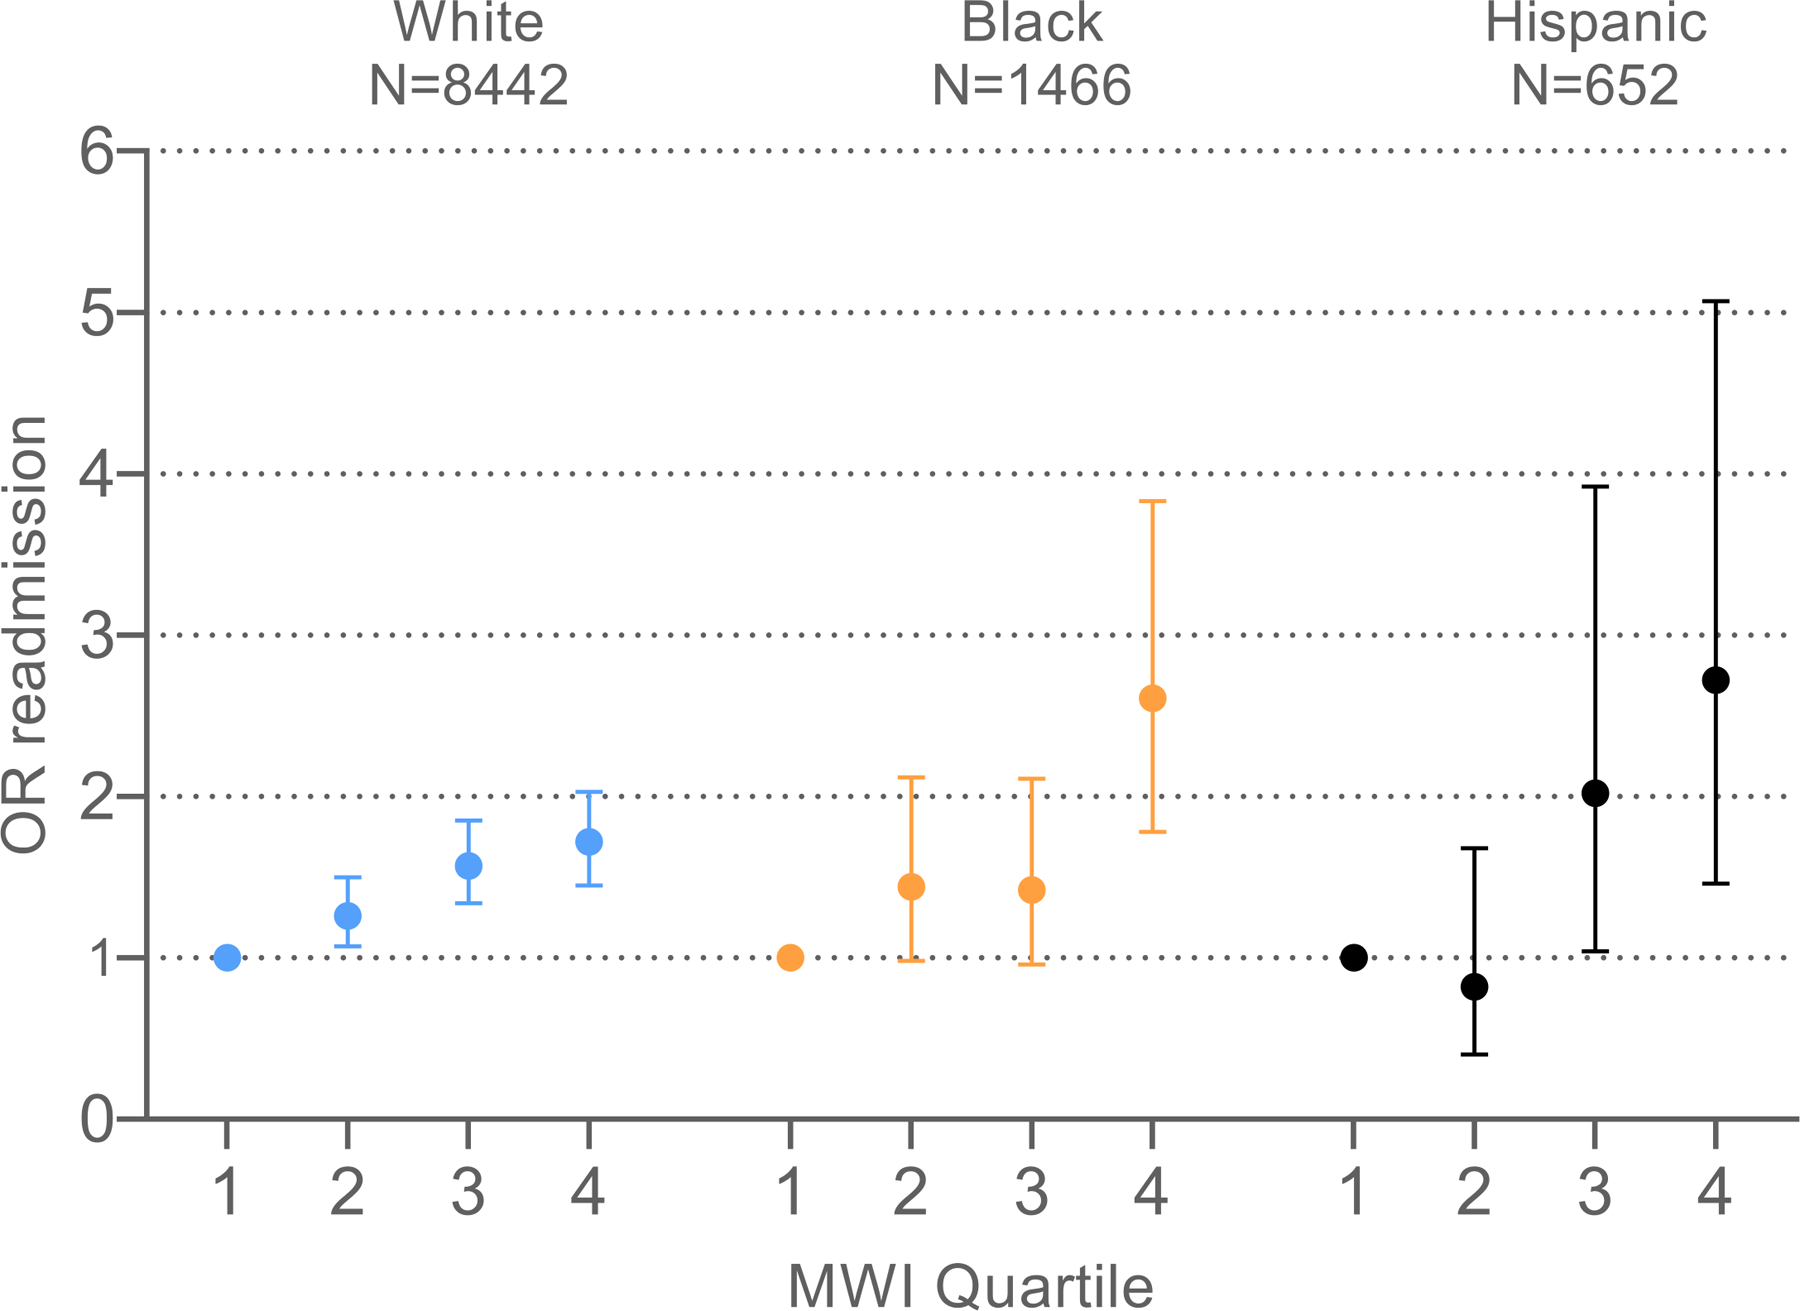
30-day readmission risk across ICD-coded multimorbidity-weighted index quartiles, by race and ethnicity. Abbreviations: MWI, multimorbidity-weighted index; OR, odds ratio
There was no significant effect modification for MWI-ICD with 30-day readmission risk by race and ethnicity for Black, White, Hispanic, and other race participants in fully adjusted models (p=0.27) (Table 2).
Mortality after discharge by race and ethnicity
The sample sizes for postdischarge mortality at 30 and 90 days, stratified by race and ethnicity, were small so our analysis focuses on mortality at 365 days postdischarge (Supplemental Tables 1 and 2). Black and White participants with the highest quartile MWI-ICD in the entire sample had more than double the odds of mortality compared with those in the first quartile (Black participant OR=2.08, 95% CI: 1.34–3.22; White participant OR=2.12, 95% CI: 1.72–2.60) (Supplemental Table 1, Figure 3). Hispanic participants with the highest MWI-ICD had nearly triple the odds of mortality compared with those in the first quartile (OR=2.83, 95% CI: 1.28–6.25). A 1-point increase in MWI-ICD was associated with a statistically significant 3% higher odds of mortality (OR=1.03, 95% CI: 1.03–1.04) for the total sample.
Figure 3.
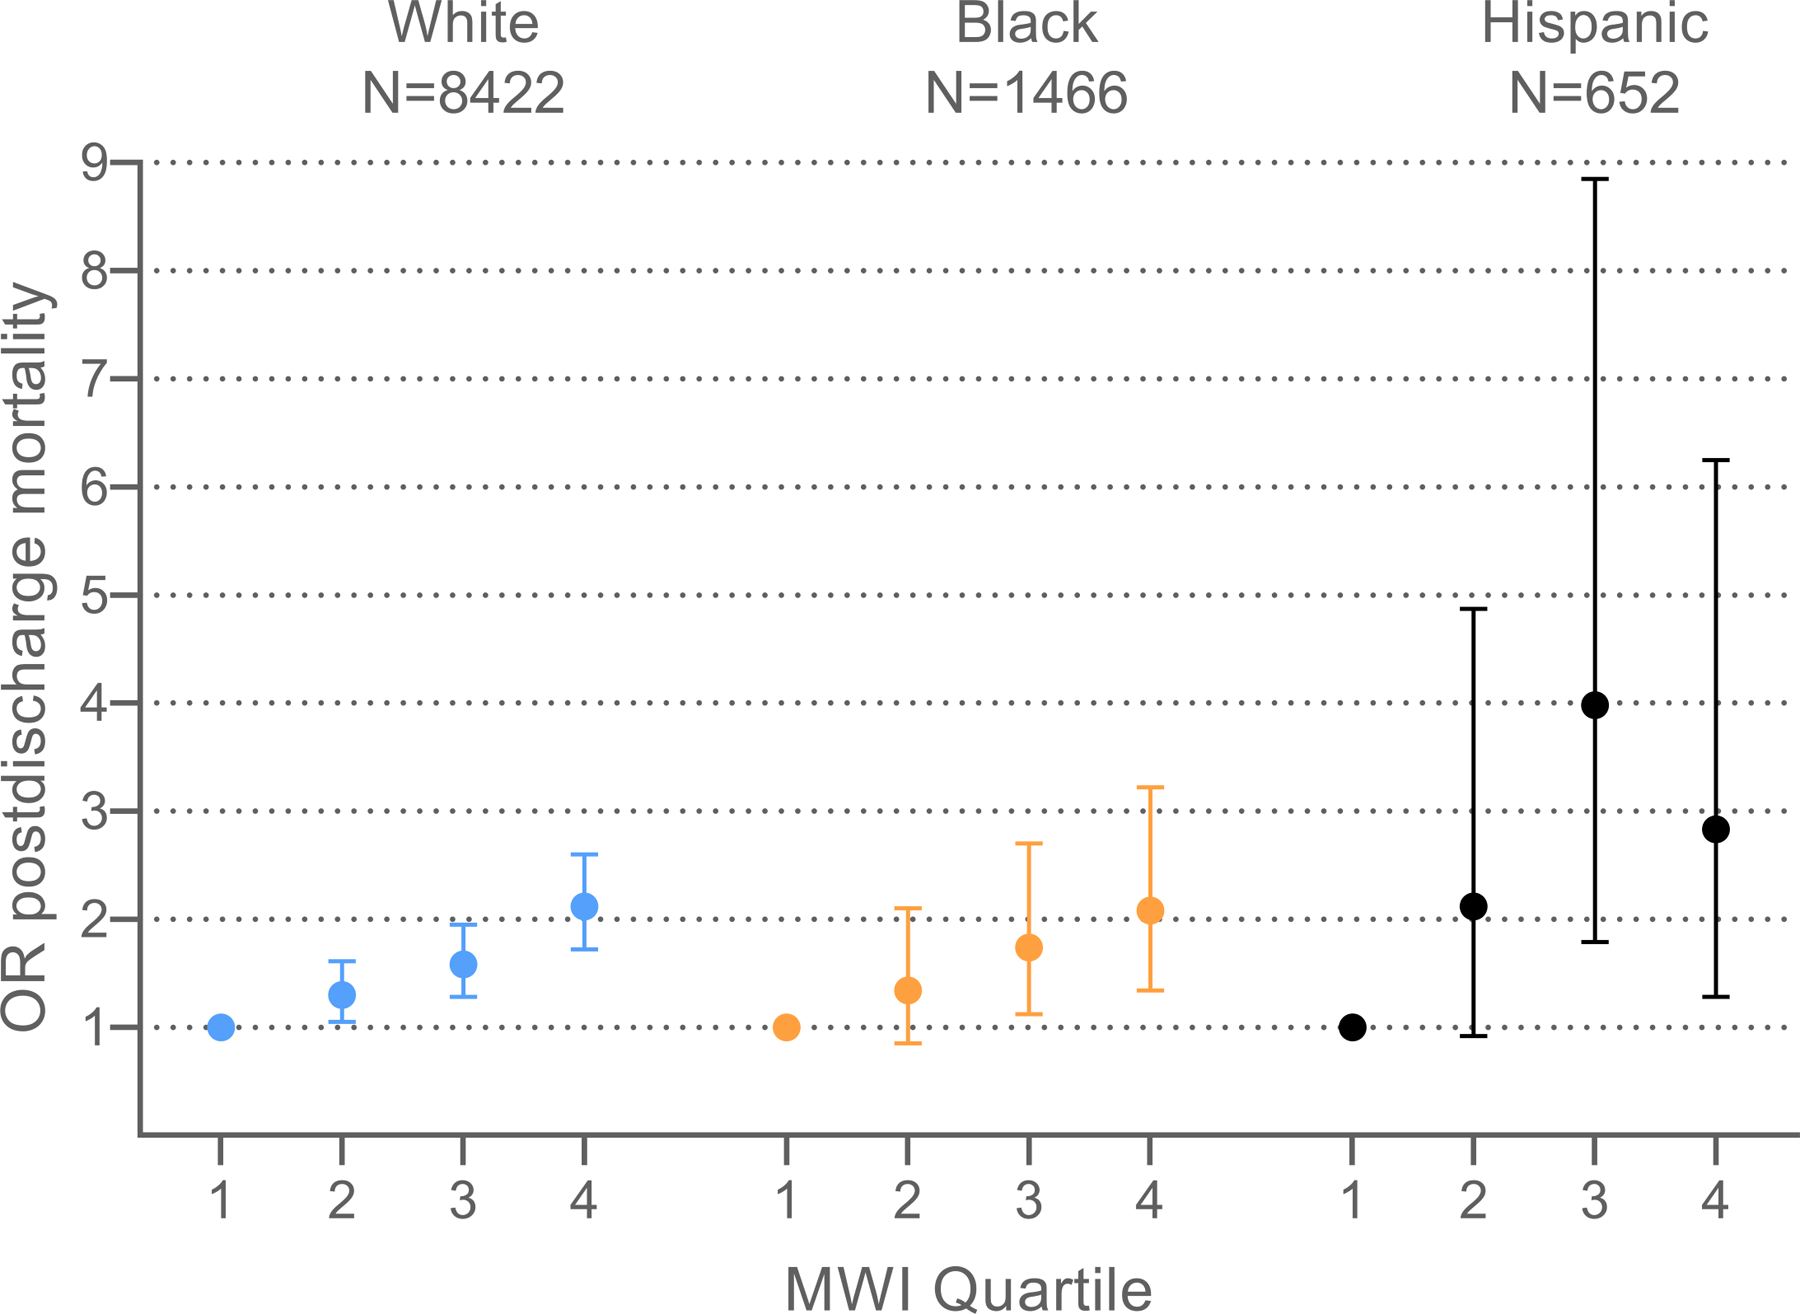
1-year postdischarge mortality risk following initial hospital admission across ICD-coded multimorbidity-weighted index quartiles, by race and ethnicity. Abbreviations: MWI, multimorbidity-weighted index; OR, odds ratio
There was no significant effect modification for MWI-ICD with 1-year postdischarge mortality by race and ethnicity for Black, White, and Hispanic participants in fully adjusted models (p=0.89). The sample of participants of other race (N=195, including 26 participants with 1-year postdischarge mortality) was small and did not achieve statistical convergence (Supplemental Table 1).
DISCUSSION
Using unique data linkages between the nationally-representative HRS and CMS Medicare data, we conducted rigorous adjustment for individual-level factors to examine the association of multimorbidity with 30-day readmissions and postdischarge mortality by race and ethnicity. Hispanic participants had the highest multimorbidity on average, followed by Black and White participants, who had similar multimorbidity values on average. Multimorbidity was associated with a monotonic increased odds of readmissions and postdischarge mortality across all race and ethnicity groups. There was no significant effect modification by race and ethnicity in associations of multimorbidity with readmissions and postdischarge mortality after robust adjustment.
Prior studies have reported racial and ethnic disparities in healthcare access, chronic disease burden, and resulting healthcare outcomes including disability, hospital readmissions, and premature mortality. However, we report no differences by race and ethnicity for readmissions and postdischarge mortality risk. This may be due to three major differences in our analysis, in which we accounted for physical functioning and other individual-level covariates through the MWI-ICD and unique data linkages. First, functional impairment is an independent risk factor for increased 30-day hospital readmissions1, 22 and mortality risk postdischarge.23 A prior study that adjusted for disability status in Medicare beneficiaries reported no differences in chronic obstructive pulmonary disease readmissions for Black, White, and Hispanic beneficiaries. However, studies using claims data do not consistently adjust for physical functioning since such measures are not readily available. Claims must be linked to individual-level data or use unique measures that embed physical functioning, such as MWI-ICD that weights chronic conditions by physical functioning. Second, many studies underestimate multimorbidity when using comorbidity measures with limited disease inventories that are typically assessed at specific, narrow timepoints. In contrast, MWI-ICD is a cumulative updated measure that includes 84 chronic conditions and carries forward chronic conditions using the first date of diagnosis after positive case ascertainment. Third, we adjusted for proxies for socioeconomic status (education, household net worth) and behavioral and lifestyle habits (physical activity, smoking status, body mass index) to better control for potential predictors of hospital readmissions and mortality.
As race and ethnicity are social constructs, our results (from nationally-representative data with a higher or comparable percentage of Black and Hispanic adults than many prior studies) suggest that differences in readmissions risk by race and ethnicity reported in prior studies could reflect methodologic differences such as incompletely measured individual or health system level factors such as multimorbidity, functional status, social risk factors, and lower rates of access and quality of care. For example, one study reported greater Black-White disparities in stroke readmissions in hospitals with less nursing staff but no significant differences in outcomes between Black and White patients in the best staffed hospitals.24 Since incipient health disparities have been reported in all age groups,25 including national studies of children ages 0–17 years,26, 27 we posit that by late adulthood when severe multimorbidity resulting in functional impairment and hospitalization has already occurred, such as in our sample population, for older adults with the same multimorbidity, functional impairment, and Medicare eligibility, there are minimal to no measurable differences by race and ethnicity once on the trajectory toward readmission and mortality.
Another potential explanation for our findings is that this trajectory of multimorbidity sequelae starts earlier for Black compared with White individuals so would not be captured in this sample of older Medicare beneficiaries. We included a comprehensive lookback period, carried forward positive disease cases, and weighted diseases by their average impacts on physical functioning over the disease life course. However, a limitation of multimorbidity measures is that they assess diseases in a binary manner (present or absent) and do not account for granular disease duration and severity over the life course. A prior study using HRS data evaluated disparities by race and ethnicity in disease accumulation and reported that Black adults had higher initial burden and faster accumulation of disease over time than did White participants regardless of BMI.28 Middle-aged Black adults (aged 51–55 years at baseline) developed multimorbidity 5–6 years earlier than White adults and had higher multimorbidity at end of follow-up, while Hispanic adults had lower initial burden and a similar accumulation rate compared with White adults. This suggests that disease prevention efforts in Black individuals are needed earlier in life to help reduce disparities in multimorbidity onset and sequelae. Further, multimorbidity progression may be delayed by reducing obesity and cardiometabolic risk factors before midlife.
Numerous factors create and sustain health disparities resulting in earlier multimorbidity onset and increased mortality risk among Black compared with White adults.29–31 According to the cumulative advantage-disadvantage theory, social and structural forces produce or sustain inequalities at every life stage, and the resulting cumulative disadvantage may manifest as multimorbidity over the life course.31, 32
Recent guidelines support the need for early intervention to understand and reduce health disparities. The National Institute on Aging Research Framework considers biological, behavioral, sociocultural, and environmental contributors to health disparities33 and encourages a life course perspective to explain variation in risk factor and outcome trajectories at multiple levels. With a longitudinal lifespan approach, the timing of multimorbidity onset and progression can be more effectively identified and targeted earlier for intervention, years before irreversible sequelae such as hospitalization, readmission, and mortality.
Our study has limitations. First, chronic conditions to compute multimorbidity come from diagnostic codes from claims data, which are subject to coding error and bias.34 However, claims remain an important source of data and are necessary to study readmissions. Further, studies that use claims data to measure multimorbidity tend to underestimate multimorbidity since data typically originate from a cross-sectional snapshot in time. To overcome this, we used a comprehensive lookback period starting in 1991 and carried forward chronic conditions (after positive case ascertainment) up until the date of admission. Further studies are needed on the precise duration needed for adequate lookback and whether this differs by race and ethnicity.
Second, it is possible that no differences were observed by race and ethnicity in the associations of MWI-ICD with readmissions and postdischarge mortality due to possible underdiagnosis of chronic conditions, which occurs more frequently in minorities than White adults. In the National Health and Nutrition Examination Survey, all minorities had higher rates of underdiagnosed diabetes, and Asian adults also had higher rates of undiagnosed hypertension based on laboratory and physical measurements.35 Among Black adults, coronary heart disease, dementia,36 and cancers such as multiple myeloma37, 38 may be more likely to be underdiagnosed than in White adults. While we applied a lookback period and carried forward conditions in MWI-ICD using both inpatient and outpatient encounters, if conditions were never diagnosed, they would not be counted in multimorbidity.
Third, the data linkage between HRS covariates and the CMS Medicare exposure and outcomes is asynchronous. However, most claims studies are not linked to granular individual-level data so the unique merge with HRS data provided more robust adjustment for confounding by individual factors such as socioeconomic status. Fourth, there is potential residual confounding from heterogeneity in hospitalizations and unavailable covariates including discharge planning and primary care access (minorities are less likely to have a usual source of care), language barriers and access to interpreter services, culturally competent patient education, and family and/or caregiver support.14, 39 Future studies are needed to understand how cultural customs and beliefs may impact selfcare, adherence, and readmission risk. Finally, the HRS sample of other races and ethnicities including American Indian and Alaska Native, and Asian American, Native Hawaiian, and Pacific Islander populations could not be disaggregated due to sample size restrictions. Future studies are needed in these populations.
Our study highlights the importance of rigorous adjustment for multimorbidity, physical functioning, and other individual-level covariates such as socioeconomic status and behavioral and lifestyle habits, in evaluating the association between multimorbidity and risk of hospital readmission and postdischarge mortality. While we report no difference among White, Black, and Hispanic adults, we postulate that health disparities originate earlier than our sample of older Medicare beneficiaries with high multimorbidity requiring at least one hospitalization. Thus, our results suggest that future studies and interventions should be targeted prior to when patients have already experienced hospitalization due to multimorbidity and functional decline. Potential implications of this work are that primary disease prevention and interventions to reduce health disparities are urgently needed prior to multimorbidity sequelae including functional decline, hospitalization, and premature mortality.
Supplementary Material
Supplemental Figure 1. Flow diagram of final dataset creation.
Supplemental Table 1. One-year postdischarge mortality after initial hospital admission by ICD-coded multimorbidity-weighted index and race and ethnicity.
Supplemental Table 2. Mortality at 30-, 90-, and 365-days postdischarge after initial hospital admission, by ICD-coded multimorbidity-weighted index, and race and ethnicity.
Key points box:
- Key points:
Multimorbidity was associated with a monotonic increased odds of 30-day readmissions and 1-year postdischarge mortality across all race and ethnicity subgroups.
There was no difference by race and ethnicity in associations between multimorbidity with 30-day readmissions and 1-year postdischarge mortality risk after adjustment for multimorbidity, functional status, socioeconomic status, and lifestyle habits among Medicare beneficiaries.
- Why does this matter?
To reduce health disparities, interventions and policies must be implemented and targeted earlier in multimorbidity onset and progression, prior to less modifiable sequelae such as hospitalization, readmission, and mortality.
ACKNOWLEDGEMENTS
We thank Suja Kumar and Mohammed Kabeto for assistance with the analysis.
Funding information:
This work was supported by the National Institute on Aging at the National Institutes of Health (K23AG056638 to MYW). The NIH played no role in the conduct of this study.
Footnotes
Conflicts of interest: The authors have no conflicts.
REFERENCES
- 1.Greysen SR, Stijacic Cenzer I, Auerbach AD, Covinsky KE. Functional impairment and hospital readmission in Medicare seniors. JAMA Intern Med Apr 2015;175(4):559–65. doi: 10.1001/jamainternmed.2014.7756 [DOI] [PMC free article] [PubMed] [Google Scholar]
- 2.Murray F, Allen M, Clark CM, Daly CJ, Jacobs DM. Socio-demographic and -economic factors associated with 30-day readmission for conditions targeted by the hospital readmissions reduction program: a population-based study. BMC Public Health 2021;21(1):1922. doi: 10.1186/s12889-021-11987-z [DOI] [PMC free article] [PubMed] [Google Scholar]
- 3.Joynt KE, Orav EJ, Jha AK. Thirty-day readmission rates for Medicare beneficiaries by race and site of care. JAMA Feb 16 2011;305(7):675–81. doi: 10.1001/jama.2011.123 [DOI] [PMC free article] [PubMed] [Google Scholar]
- 4.Chamberlain RS, Sond J, Mahendraraj K, Lau CS, Siracuse BL. Determining 30-day readmission risk for heart failure patients: the Readmission After Heart Failure scale. Int J Gen Med 2018;11:127–141. doi: 10.2147/IJGM.S150676 [DOI] [PMC free article] [PubMed] [Google Scholar]
- 5.Tsai TC, Orav EJ, Joynt KE. Disparities in surgical 30-day readmission rates for Medicare beneficiaries by race and site of care. Ann Surg Jun 2014;259(6):1086–90. doi: 10.1097/SLA.0000000000000326 [DOI] [PMC free article] [PubMed] [Google Scholar]
- 6.Elixhauser A, Steiner C, Harris DR, Coffey RM. Comorbidity measures for use with administrative data. Med Care 1998;36(1):8–27. [DOI] [PubMed] [Google Scholar]
- 7.Charlson ME, Pompei P, Ales KL, MacKenzie CR. A new method of classifying prognostic comorbidity in longitudinal studies: development and validation. J Chronic Dis 1987;40(5):373–383. [DOI] [PubMed] [Google Scholar]
- 8.Deyo RA, Cherkin DC, Ciol MA. Adapting a clinical comorbidity index for use with ICD-9-CM administrative databases. J Clin Epidemiol 1992;45(6):613–619. [DOI] [PubMed] [Google Scholar]
- 9.Barrington DA, Meade CE, Cosgrove CM, Cohn DE, Felix AS. Racial and ethnic disparities in readmission risk following the surgical management of endometrial cancer. Gynecol Oncol 2022;166(3):543–551. doi: 10.1016/j.ygyno.2022.07.014 [DOI] [PubMed] [Google Scholar]
- 10.Nastars DR, Rojas JD, Ottenbacher KJ, Graham JE. Race/Ethnicity and 30-Day Readmission Rates in Medicare Beneficiaries With COPD. Respir Care 2019;64(8):931–936. doi: 10.4187/respcare.06475 [DOI] [PubMed] [Google Scholar]
- 11.Kheirbek RE, Wojtusiak J, Vlaicu SO, Alemi F. Lack of Evidence for Racial Disparity in 30-Day All-Cause Readmission Rate for Older US Veterans Hospitalized with Heart Failure. Qual Manag Health Care 2016;25(4):191–196. doi: 10.1097/QMH.0000000000000108 [DOI] [PubMed] [Google Scholar]
- 12.Deswal A, Petersen NJ, Souchek J, Ashton CM, Wray NP. Impact of race on health care utilization and outcomes in veterans with congestive heart failure. J Am Coll Cardiol 2004;43(5):778–784. doi: 10.1016/j.jacc.2003.10.033 [DOI] [PubMed] [Google Scholar]
- 13.Boen C. Death by a Thousand Cuts: Stress Exposure and Black-White Disparities in Physiological Functioning in Late Life. J Gerontol B Psychol Sci Soc Sci 2020;75(9):1937–1950. doi: 10.1093/geronb/gbz068 [DOI] [PMC free article] [PubMed] [Google Scholar]
- 14.Centers for Medicare & Medicaid Services. Guide to reducing disparities in readmissions 2018. [Google Scholar]
- 15.Ware JE, Snow KK, Kosinski M, Gandek B. SF-36 Health Survey: Manual and Interpretation Guide Health Institute, New England Medical Center; 1997. [Google Scholar]
- 16.Wei MY, Kawachi I, Okereke OI, Mukamal KJ. Diverse cumulative impact of chronic diseases on physical health-related quality of life: implications for a measure of multimorbidity. Am J Epidemiol 2016;184(5):357–365. [DOI] [PMC free article] [PubMed] [Google Scholar]
- 17.Wei MY, Kabeto MU, Langa KM, Mukamal KJ. Multimorbidity and Physical and Cognitive Function: Performance of a New Multimorbidity-Weighted Index. J Gerontol A Biol Sci Med Sci 2018;73(2):225–232. doi: 10.1093/gerona/glx114 [DOI] [PMC free article] [PubMed] [Google Scholar]
- 18.Wei MY, Ratz D, Mukamal KJ. Multimorbidity in Medicare Beneficiaries: Performance of an ICD-Coded Multimorbidity-Weighted Index. J Am Geriatr Soc 2020;68(5):999–1006. doi: 10.1111/jgs.16310 [DOI] [PMC free article] [PubMed] [Google Scholar]
- 19.Chronic Conditions Data Warehouse. Centers for Medicare & Medicaid Services Accessed October 2022. https://www2.ccwdata.org/web/guest/condition-categories-chronic
- 20.Jarosek S. Death Information in the Research Identifiable Medicare Data Research Data Assistance Center,. Accessed 02/15/2022, 2022. https://resdac.org/articles/death-information-research-identifiable-medicare-data [Google Scholar]
- 21.Forrester SN, Taylor JL, Whitfield KE, Thorpe RJ Jr. Advances in Understanding the Causes and Consequences of Health Disparities in Aging Minorities. Curr Epidemiol Rep 2020;7(2):59–67. doi: 10.1007/s40471-020-00234-5 [DOI] [PMC free article] [PubMed] [Google Scholar]
- 22.Soley-Bori M, Soria-Saucedo R, Ryan CM, et al. Functional Status and Hospital Readmissions Using the Medical Expenditure Panel Survey. J Gen Intern Med Jul 2015;30(7):965–72. doi: 10.1007/s11606-014-3170-9 [DOI] [PMC free article] [PubMed] [Google Scholar]
- 23.Robinson TN, Wu DS, Sauaia A, et al. Slower walking speed forecasts increased postoperative morbidity and 1-year mortality across surgical specialties. Ann Surg Oct 2013;258(4):582–8; discussion 588–90. doi: 10.1097/SLA.0b013e3182a4e96c [DOI] [PMC free article] [PubMed] [Google Scholar]
- 24.Carthon JMB, Brom H, McHugh M, et al. Racial Disparities in Stroke Readmissions Reduced in Hospitals With Better Nurse Staffing. Nurs Res 2022;71(1):33–42. doi: 10.1097/nnr.0000000000000552 [DOI] [PMC free article] [PubMed] [Google Scholar]
- 25.Health Disparities. Centers for Disease Control and Prevention Updated 2017. Accessed November, 2022. https://www.cdc.gov/aging/disparities/index.htm
- 26.Flores G, Lin H. Trends in racial/ethnic disparities in medical and oral health, access to care, and use of services in US children: has anything changed over the years? Int J Equity Health 2013;12:10. doi: 10.1186/1475-9276-12-10 [DOI] [PMC free article] [PubMed] [Google Scholar]
- 27.Akinbami LJ, Moorman JE, Simon AE, Schoendorf KC. Trends in racial disparities for asthma outcomes among children 0 to 17 years, 2001–2010. J Allergy Clin Immunol 2014;134(3):547–553.e5. doi: 10.1016/j.jaci.2014.05.037 [DOI] [PMC free article] [PubMed] [Google Scholar]
- 28.Botoseneanu A, Markwardt S, Nagel CL, et al. Multimorbidity Accumulation among Middle-Aged Americans: Differences by Race/Ethnicity and Body-Mass Index. J Gerontol A Biol Sci Med Sci 2021;doi: 10.1093/gerona/glab116 [DOI] [PMC free article] [PubMed] [Google Scholar]
- 29.LaVeist TA, Bowie JV, Cooley-Quille M. Minority health status in adulthood: the middle years of life. Health Care Financ Rev 2000;21(4):9–21. [PubMed] [Google Scholar]
- 30.Nuru-Jeter AM, Thorpe RJ Jr., Fuller-Thomson E. Black-white differences in self-reported disability outcomes in the U.S.: early childhood to older adulthood. Public Health Rep Nov-Dec 2011;126(6):834–43. doi: 10.1177/003335491112600609 [DOI] [PMC free article] [PubMed] [Google Scholar]
- 31.Thorpe RJ Jr., Fesahazion RG, Parker L, et al. Accelerated Health Declines among African Americans in the USA. J Urban Health 2016;93(5):808–819. doi: 10.1007/s11524-016-0075-4 [DOI] [PMC free article] [PubMed] [Google Scholar]
- 32.Glymour MM, Ertel KA, Berkman LF. What Can Life-Course Epidemiology Tell Us About Health Inequalities in Old Age? Annual Review of Gerontology and Geriatrics: Life-Course Perspectives on Late-Life Health Inequalities, Vol 29, 2009 2010;29:27–56. [Google Scholar]
- 33.Hill CV, Perez-Stable EJ, Anderson NA, Bernard MA. The National Institute on Aging Health Disparities Research Framework. Ethn Dis Aug 7 2015;25(3):245–54. doi: 10.18865/ed.25.3.245 [DOI] [PMC free article] [PubMed] [Google Scholar]
- 34.Schneeweiss S, Avorn J. A review of uses of health care utilization databases for epidemiologic research on therapeutics. Journal of clinical epidemiology Apr 2005;58(4):323–37. doi: 10.1016/j.jclinepi.2004.10.012 [DOI] [PubMed] [Google Scholar]
- 35.Kim EJ, Kim T, Conigliaro J, Liebschutz JM, Paasche-Orlow MK, Hanchate AD. Racial and Ethnic Disparities in Diagnosis of Chronic Medical Conditions in the USA. J Gen Intern Med 2018;33(7):1116–1123. doi: 10.1007/s11606-018-4471-1 [DOI] [PMC free article] [PubMed] [Google Scholar]
- 36.Gianattasio KZ, Prather C, Glymour MM, Ciarleglio A, Power MC. Racial disparities and temporal trends in dementia misdiagnosis risk in the United States. Alzheimers Dement (N Y) 2019;5:891–898. doi: 10.1016/j.trci.2019.11.008 [DOI] [PMC free article] [PubMed] [Google Scholar]
- 37.Jones NR, Williamson A, Foote M, et al. Cancer health disparities persist among African Americans in Wisconsin Wisconsin Medical Journal 2010;109(5):267–273. [PMC free article] [PubMed] [Google Scholar]
- 38.Marinac CR, Ghobrial IM, Birmann BM, Soiffer J, Rebbeck TR. Dissecting racial disparities in multiple myeloma. Blood Cancer J 2020;10(2):19. doi: 10.1038/s41408-020-0284-7 [DOI] [PMC free article] [PubMed] [Google Scholar]
- 39.Access to Health Services. Office of Disease Prevention and Health Promotion Updated 02/06/22. Accessed June 22, 2022. https://www.healthypeople.gov/2020/topics-objectives/topic/Access-to-Health-Services/objectives?topicId=1
Associated Data
This section collects any data citations, data availability statements, or supplementary materials included in this article.
Supplementary Materials
Supplemental Figure 1. Flow diagram of final dataset creation.
Supplemental Table 1. One-year postdischarge mortality after initial hospital admission by ICD-coded multimorbidity-weighted index and race and ethnicity.
Supplemental Table 2. Mortality at 30-, 90-, and 365-days postdischarge after initial hospital admission, by ICD-coded multimorbidity-weighted index, and race and ethnicity.