

Abstract
Background:
Changes in physical health and cognition during aging can result in some older adults to stop driving. In this population-based longitudinal study, we describe potential predictors of driving cessation in older adults.
Methods:
Age-stratified random population cohort of 1,982 adults aged 65 years and older drawn from voter registration lists. Participant characteristics were measured using demographics, physical and self-rated health, sleeping habits, driving status, cognitive screening, modified Center for Epidemiologic Studies-Depression scale (mCES-D), Clinical Dementia Rating (CDR®), and Mini-Mental State Examination (MMSE).
Results:
Over 12 years of follow-up, 390 participants stopped driving. These individuals were older, more likely to be women and to have a CDR score >=1, had worse self-reported health, and more symptoms of depression, compared to those who were still driving. Additionally, individuals with lower test performance in all cognitive domains, loss of visual acuity and fields, and bilateral hearing loss were more likely to stop driving.
Conclusions:
Age, sex, cognitive impairments, physical health, and depressive symptoms were associated with driving cessation in this cohort. By identifying potential driving cessation predictors, health care providers and families may better recognize these risk factors and begin the driving cessation discussion early.
Keywords: aging, community, driving, epidemiology
INTRODUCTION
A concern of many older adults experiencing normal aging, mild cognitive impairment, or dementia is their ability to continue driving motor vehicles. Several aspects of cognition such as attention and processing speed, memory, and executive function all change with age and can affect the ability to drive. As a result, a dementia diagnosis implies that the patient will soon be required to cease driving. Patients and families may make that decision on their own. However, quite often it is left to the health care provider to inform patients that they need to stop driving, and if necessary or legally mandated, to report them to the appropriate authorities such as the Department of Motor Vehicles (DMV). It can be difficult to decide when an older adult should stop driving, especially when the rate of progression of cognitive impairment varies significantly among individuals. Further, these cognitive changes of aging are accompanied by changes in various motor and sensory domains which are required for operating motor vehicles. Changes in visual acuity, visual fields, contrast sensitivity, and night vision can limit driving ability1. Reduction in motor and grip strength, impaired posture and balance, and decrease in neck rotation affect the ability to grip the steering wheel, apply sufficient pressure on the brakes, and turn the neck to check the “blind spot” while changing lanes1,2. The aging process can result in cognitive and physical impairments that impact driving ability, which may prompt a careful consideration of driving cessation.
In most of the US, driving is considered a key instrumental activity of daily living (IADL); it is a symbol of autonomy and responsibility and an important facet of independence3, meaning that the decision to stop driving can adversely affect an individual in complex ways. Implications of driving cessation include increased depressive symptoms4,5, reduced social engagement6, worse health outcomes4 and functional limitations7. For clinicians, these factors exemplify the importance of carefully evaluating multiple considerations before arriving at a decision to recommend when an older patient should stop driving.
Geriatric practitioners face the twin challenges of diagnosing dementia and evaluating driving ability, both of which can be difficult to discuss with patients and their family. Not surprisingly, there is no simple cognitive or other objective test threshold to recommend driving cessation. Understanding the predictors of future driving cessation, whether self- or family-imposed or health care provider-recommended, can be important for planning and assistance in making these recommendations to the patient and family. Current literature indicates that severe dementia8 and demographics, such as older age and female sex9, may be associated with an individual’s stopping driving. Few studies, however, have investigated these predictors longitudinally.
Previous literature has reported driving habits and cessation predictors in the older population in clinical settings10,11, with limited studies from population-based cohorts. We have previously reported, from a population-based aging cohort in southwestern Pennsylvania, the proportions and characteristics of older adults who had never driven motor vehicles, those who had previously driven and then ceased driving, and those who were still driving but were experiencing difficulties when they drove12. In the same cohort, among participants who were still driving at study entry, we investigated the factors that predicted driving cessation over 12 years of follow-up.
METHODS
Study site and population
The Monongahela-Youghiogheny Healthy Aging Team (MYHAT) is an age-stratified random population-based cohort that was recruited from the publicly available voter registration lists for small-town, economically disadvantaged communities in southwestern Pennsylvania (USA). These towns were once vibrant steel manufacturing areas, but were devastated by the collapse of the steel industry in the 1970s. Sampling, recruitment, and cohort characteristics details have been previously reported13.
Standard Protocol Approvals, Registrations and Consents
Community outreach, participant recruitment, and assessment procedures were approved by the University of Pittsburgh Institutional Review Board for protection of human subjects, and all participants provided written informed consent at study entry. The inclusion criteria for this cohort were (a) age 65 years and older, (b) living within the selected small towns, (c) not already in long-term care institutions. Individuals were ineligible to enter the study if they (d) described themselves or were described by their families as too ill to participate, (e) had vision or hearing impairments severe enough to preclude neuropsychological testing, (f) lacked decisional capacity. During the baseline recruitment period between 2006 and 2008, a total of 2036 individuals provided consent. All individuals were screened with the Mini-Mental State Evaluation (MMSE);14,15 if they exhibited substantial cognitive impairment by scoring less than 21/30 on the age-education corrected MMSE, we excluded them from further assessment. The remaining 1982 participants underwent detailed evaluations described below.
Assessments
Assessments at study entry included, but were not limited to, demographics, living arrangements, independence in IADL measured by the Older Americans Resources and Services scale (OARS)16, depressive symptoms using a modified Center for Epidemiologic Studies-Depression scale (mCES-D)17,18, self-reported health history, social support and engagement, hearing and vision difficulties, and a neuropsychological evaluation. The neuropsychological test battery evaluated the cognitive domains of attention/processing speed, executive function, memory, language, and visuospatial function. Composite z-scores were calculated for each, as previously described13. With this information, excluding the neuropsychological tests, each participant was rated on the Clinical Dementia Rating (CDR) Staging Instrument® on which ratings of 0, 0.5 and >=1 indicate normal cognition, mild cognitive impairment or very mild dementia, and dementia19.
Participants were annually invited to undergo a repeat assessment. At follow-up, we asked participants about changes since the previous visit.
Predictor variables and adjusting covariates
Study assessments included demographic information, including age, sex, race (white v. non-white), education (less than high school, high school, more than high school), and living arrangements (alone v. not alone). Physical health information, including the number of regularly taken prescription drugs, vision difficulties, hearing loss, self-reported medical diagnosis of several conditions including arthritis, and self-rated health (poor/fair, good, very good/excellent), was also collected. Information about sleep habits was gathered through questions about falling and staying asleep, waking up too early and sleepiness during the day. Cognitive functioning was assessed with the MMSE14, subjective cognitive concerns, CDR, and neuropsychological test performance. Cognitive domain composite scores of attention and processing speed, executive function, memory, language, and visuospatial function were calculated from the neuropsychological test battery. To understand everyday functioning, individuals were asked about IADLs16, which were categorized as no help needed (independent) or any help needed. Tobacco and alcohol use were recorded as lifetime and current/past year use at baseline and current/past year use at follow-up assessments. The modified Center for Epidemiologic Studies-Depression scale (mCES-D)17,18 was utilized to measure depressive symptoms. Social support and social engagement were evaluated through questions about belonging to organizations (yes/no) and number of confidantes (people in whom they can confide).
Outcome variable
Driving cessation was defined as participants reporting at a given annual visit that they had stopped driving, while at the previous visit they had reported still driving. Those who reported having stopped driving were asked to report all of their reasons for giving up driving.
Statistical Methods
We examined frequencies and percentages for categorical variables and means and standard deviations for normally distributed continuous variables of interest. Chi-squared test, Fisher’s exact test, or t-tests were used to compare characteristics of participants who continued driving to those who stopped driving during the 12-year study period.
For the survival models, excluding participants with only baseline assessments, we used Cox proportional hazards models and adjusted for demographics to assess the effect of each predictor variable separately on time to driving cessation, defined as the assessment at which a participant first reported having stopped driving. For each potential predictor variable, we fit a model with time-dependent covariates measured at each assessment cycle during follow-up. We also performed a sensitivity analysis with the outcome variable changed to the second instance of driving cessation for 27 participants who stopped, then resumed, and then stopped driving again.
RESULTS
The baseline study sample had a mean (SD) age of 77.6 (7.6) years, was 61.0% female, 94.7% European American, and 86.2% had a high school or greater education.
Attrition
Among the 1982 fully assessed participants at baseline (Cycle 1), we included 1716 participants who had at least one follow-up visit. Their mean baseline age (SD) was 77.7 (7.4) years. At Cycle 13, the active cohort had decreased to 360 with mean (SD) age 84.8 (5.7) years. Attrition from the cohort was treated as censored; for the survival analyses we used the complete cases for each covariate separately. In general, those who had no follow-up visits were more likely to be older and male, more likely at baseline to have higher CDRs and lower scores on the MMSE and in all cognitive domains. They were also more likely to report more IADL impairments and depression symptoms, to feel lonely, have fewer confidants, and not belong to any organizations (data not shown).
Driving habits and cessation
A total of 390 participants stopped driving over the course of the study; 27 of them stopped twice (stopping, then resuming driving, then stopping again), while 2 of them stopped three times during the study period. The mean (SD) time to first driving cessation is 6.65 (3.31) years, and the range is 2–13 years.
The proportion of participants in each category (never drove, currently driving, stopped driving in the preceding year) remained similar across assessment cycles: 7.4% at Cycle 1 and 5.6% at Cycle 13 had never driven; 78.5% at Cycle 1 and 71.7% at Cycle 13 were currently driving; 3.2% at Cycle 2 and 3.3% at Cycle 13 had ceased driving during the preceding year (Figure 1).
Figure 1.
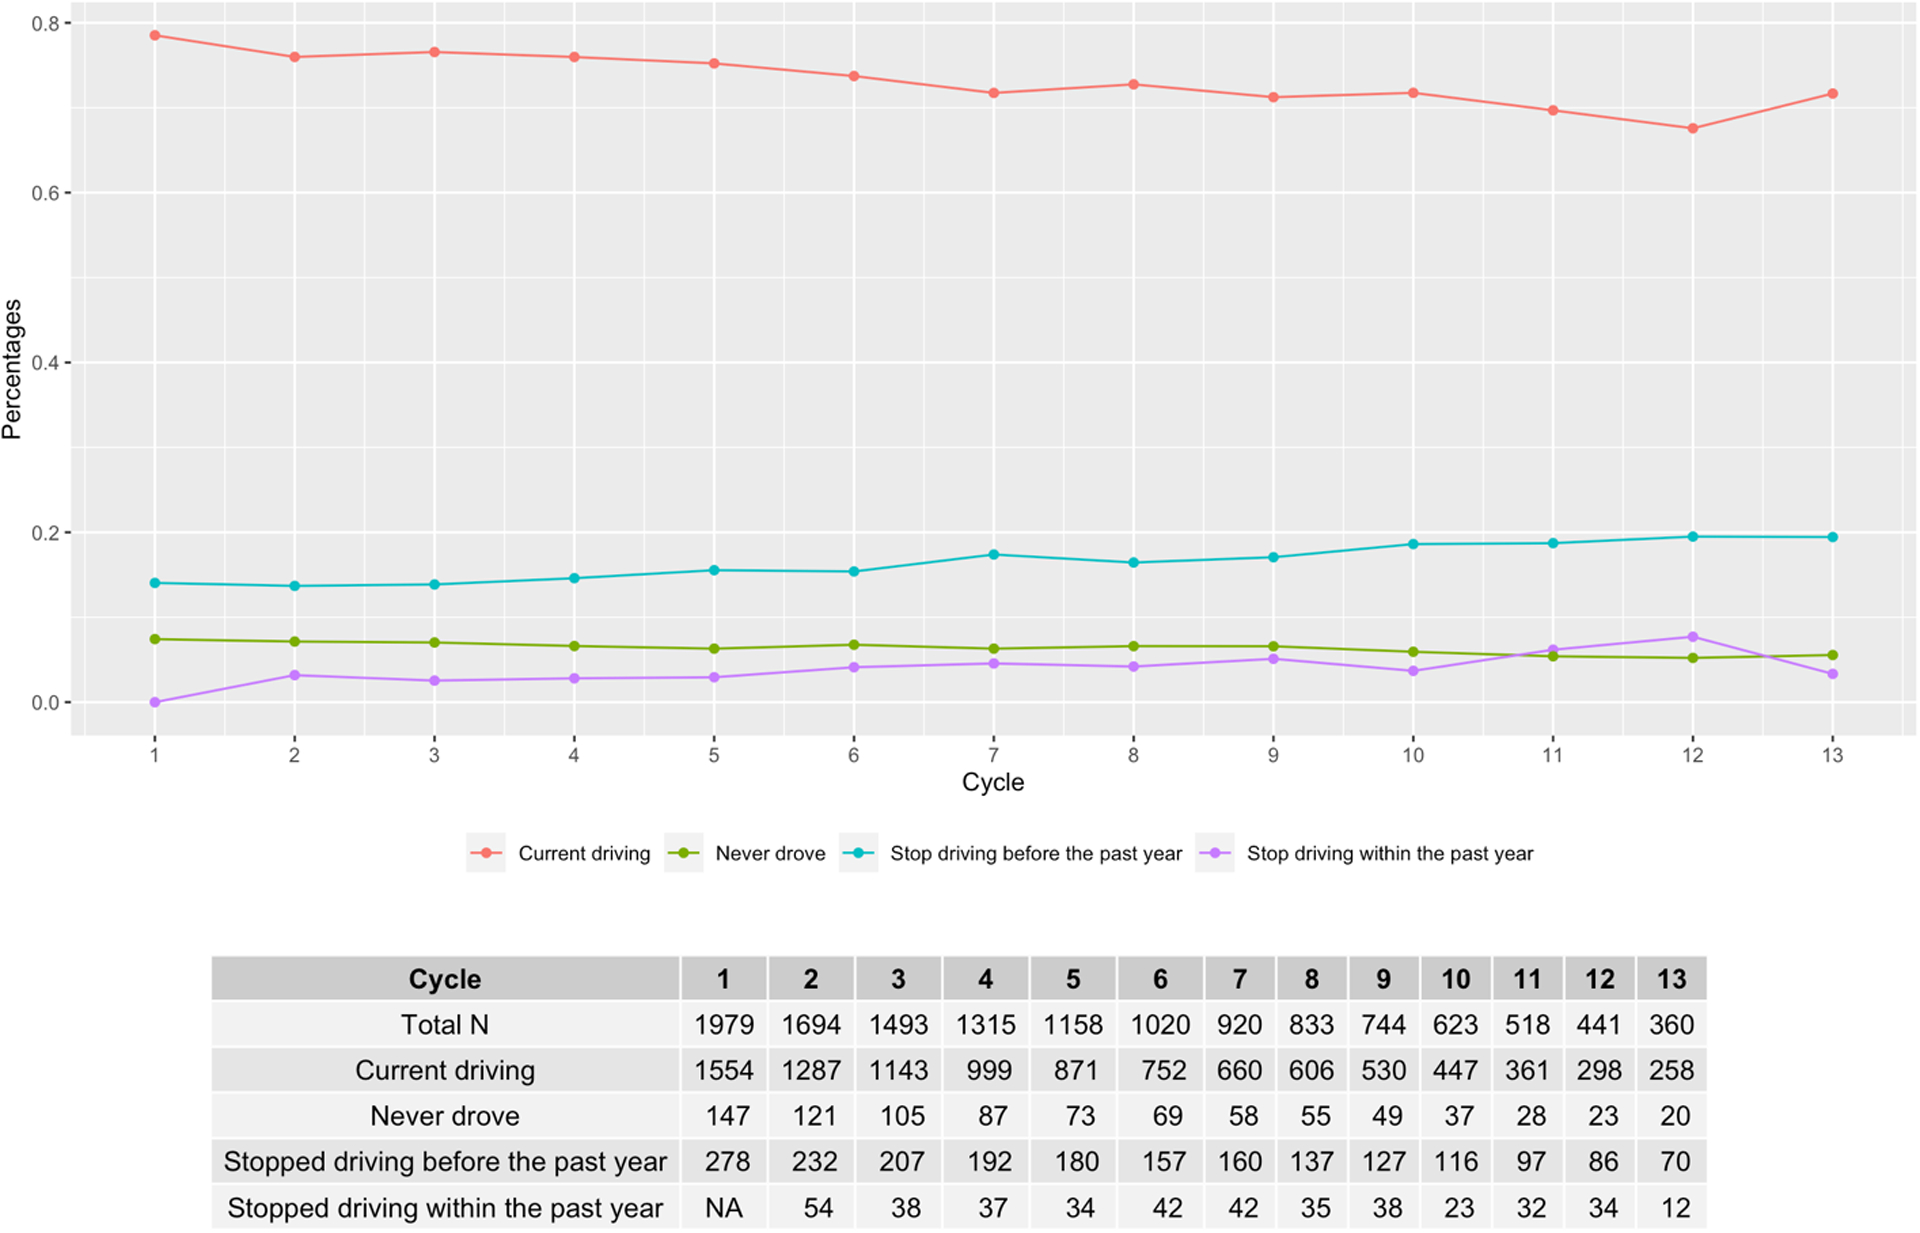
Driving status by annual study cycle
At annual follow-up visits, participants who stopped driving were asked to provide reasons for their driving cessation. Over the entire course of the observational period, participants gave the following reasons for having ceased driving: 49% because of physical health problems, 16% for vision problems, 5% for memory/cognitive difficulties, and 5% because of motor vehicle crashes or near-misses (Figure 2). Although few acknowledged having stopped for legal and financial reasons, 13% reported having been told to stop driving by their family, health care provider or the Department of Motor Vehicles. Additionally, 11% of participants who stopped driving gave other reasons, which included giving away the car, car-related issues, someone else being able to drive them, and feeling that driving was no longer necessary. These reasons were not mutually exclusive, as we encouraged participants to report all of their reasons for driving cessation.
Figure 2.

Percentages for each reason for driving cessation over the entire course of the study
Descriptive statistics
In the unadjusted analysis (Table 1), compared to participants who were still driving, those who had stopped driving were significantly older, had worse self-rated general health, were more likely to live alone, to report feeling lonely, have arthritis, and less likely to report current smoking. They also had significantly lower test performance in the cognitive domains of attention, memory, and visuospatial functions.
Table 1.
Descriptive statistics of baseline covariates by driving cessation
| Baseline covariates | Current driver (N = 1326) |
Past driver (N = 390) |
P - value |
|---|---|---|---|
| Age in years, mean (SD) | 76.86 (7.49) | 79.49 (6.53) | <0.001 |
| Female (%) | 808 (60.9) | 257 (65.9) | 0.086 |
| Education (%) | 0.54 | ||
| < High School | 176 (13.3) | 52 (13.3) | |
| High Sschool | 590 (4.5) | 185 (47.4) | |
| > High School | 560 (42.2) | 153 (39.2) | |
| Married (%) | 666 (50.2) | 188 (48.2) | 0.519 |
| Clinical Dementia Rating (CDR) (%) | 0.312 | ||
| 0 | 984 (74.2) | 275 (70.5) | |
| 0.5 | 330 (24.9) | 112 (28.7) | |
| >=1 | 12 (0.9) | 3 (0.8) | |
| Instrumental Activities of Daily Living (IADL) > 0 (%) | 220 (16.6) | 61 (15.6) | 0.713 |
| Self-rated health (%) | 0.046 | ||
| Poor and fair | 213 (16.1) | 64 (16.4) | |
| Good | 585 (44.2) | 197 (50.5) | |
| Very good and excellent | 526 (39.7) | 129 (33.1) | |
| Depression symptoms (mCES-D)>=3, (%) | 139 (10.5) | 54 (13.9) | 0.078 |
| Subjective cognitive concerns (%) | 862 (65.6) | 278 (71.5) | 0.034 |
| Mini-Mental State Examination (MMSE) >23 (%) | 1213 (91.5) | 364 (93.3) | 0.282 |
| # of regularly taken prescription drugs > 3 (%) | 704 (53.1) | 228 (58.6) | 0.064 |
| Ever smoked (%) | 720 (54.4) | 180 (46.2) | 0.005 |
| Ever consumed alcohol (%) | 1146 (86.5) | 325 (83.3) | 0.137 |
| Live alone (%) | 503 (38.0) | 172 (44.1) | 0.034 |
| Feel lonely (%) | 89 (6.7) | 42 (10.8) | 0.011 |
| # of confidants, mean (SD) | 4.28 (3.04) | 4.36 (3.06) | 0.66 |
| Belong to organization (%) | 1140 (86.0) | 342 (87.7) | 0.451 |
| Arthritis (%) | 877 (66.2) | 282 (72.3) | 0.029 |
| Vision acuity: Right (%) | 0.540 | ||
| High (20/25 – 20/20) | 293 (22.5) | 76 (19.8) | |
| Average (20/40 – 20/30) | 474 (36.4) | 145 (37.9) | |
| Low (20/800 – 20/50) | 535 (41.1) | 162 (42.3) | |
| Vision acuity: Left (%) | 0.744 | ||
| High (20/25 – 20/20) | 311 (24.1) | 86 (22.6) | |
| Average (20/40 – 20/30) | 471 (36.5) | 137 (36.0) | |
| Low (20/800 – 20/50) | 510 (39.5) | 158 (41.5) | |
| Extraocular movement problem: Right (%) | 15 (1.1) | 3 (0.8) | 0.778 |
| Extraocular movement problem: Left (%) | 10 (0.8) | 5 (1.3) | 0.354 |
| Visual field deficits: Right (%) | 50 (3.8) | 17 (4.4) | 0.554 |
| Visual field deficits: Left (%) | 52 (4.0) | 18 (4.7) | 0.561 |
| Hearing loss (%) | 0.503 | ||
| None | 1051 (79.3) | 298 (76.4) | |
| Right | 92 (6.9) | 35 (9.0) | |
| Left | 93 (7.0) | 28 (7.2) | |
| Bilateral | 89 (6.7) | 29 (7.4) | |
| Difficulty falling asleep (%) | 486 (36.7) | 162 (41.5) | 0.093 |
| Sleep continuity disturbance (%) | 536 (40.5) | 160 (41.1) | 0.857 |
| Early morning awakening (%) | 367 (27.7) | 103 (26.4) | 0.662 |
| Excessive daytime sleepiness (%) | 377 (28.5) | 125 (32.1) | 0.193 |
| Attention, mean (SD) | 0.04 (0.79) | −0.06 (0.71) | 0.02 |
| Executive, mean (SD) | 0.02 (0.80) | −0.05 (0.65) | 0.131 |
| Language, mean (SD) | 0.04 (0.83) | −0.02 (0.71) | 0.214 |
| Memory, mean (SD) | 0.05 (0.81) | −0.06 (0.75) | 0.014 |
| Visuospatial, mean (SD) | 0.08 (1.01) | −0.12 (0.98) | 0.001 |
For continuous variables, p-values were obtained from ANOVA. For categorical variables, p-values were obtained from Pearson’s chi-squared test except for CDR, extraocular movement problem, visual fields deficits and hearing loss, p-values were obtained from Fisher’s exact test.
Bonferroni corrected alpha level is 0.05/34 = 0.0015
Abbreviations: mCESD - modified Center for Epidemiologic Studies-Depression scale
Survival analysis with time-varying covariates
In the survival model of time to driving cessation (Table 2) with time-varying covariates including age, and adjusting for other demographics, the risk of first-time driving cessation remained significantly higher among participants with the following characteristics that had developed since baseline: CDR>=0.5, having greater difficulty with IADLs, having poor or fair self-rated health, more symptoms of depression, feeling lonely, reporting arthritis, having a lower MMSE score, reporting that they regularly took a larger number of prescription medications, loss of visual acuity and visual fields, bilateral hearing loss, having lower test performance in all cognitive domains, and not belonging to any organizations.
Table 2.
Survival analyses using Cox models on time to driving cessation adjusting for demographics (age, sex and education)
| Time-varying covariates | HR (95% CI) | P-value |
|---|---|---|
| Married (ref: = 0) | 1.08 (0.85, 1.38) | 0.520 |
| Clinical Dementia Rating (CDR) = 0.5 (ref: = 0) | 2.56 (2.05, 3.19) | <0.001 |
| Clinical Dementia Rating (CDR) ≥ 1 (ref: = 0) | 3.84 (2.54, 5.80) | <0.001 |
| Instrumental Activities of Daily Living (IADL) (ref: = 0) | 6.07 (4.77, 7.72) | <0.001 |
| Subjective Health Good (ref: Poor and Fair) |
0.53 (0.42, 0.67) | <0.001 |
| Subjective Health Very good and excellent (ref: Poor and Fair) |
0.30 (0.22, 0.40) | <0.001 |
| mCES-D score >=3 (ref: <3) | 2.05 (1.56, 2.69) | <0.001 |
| Subjective cognitive concerns (ref: = 0) | 1.82 (1.44, 2.31) | <0.001 |
| Mini-Mental State Examination (MMSE) > 23 (ref: < = 23) | 0.55 (0.43, 0.71) | <0.001 |
| # of prescription meds > 3 (ref: <=3) | 2.41 (1.27, 4.56) | 0.007 |
| Current Smoking (ref: = 0) | 0.99 (0.80, 1.23) | 0.958 |
| Current Drinking (ref: = 0) | 0.87 (0.65, 1.15) | 0.322 |
| Live alone (ref: = 0) | 0.87 (0.70, 1.08) | 0.200 |
| Feel lonely (ref: = 0) | 1.57 (1.13, 2.18) | 0.007 |
| # of confidantes | 0.97 (0.94, 1.01) | 0.193 |
| Belong to organization (ref: = 0) | 0.56 (0.42, 0.74) | <0.001 |
| Arthritis (ref: = 0) | 1.65 (1.27, 2.13) | <0.001 |
| Vision acuity, Right eye Average (ref: High) |
1.15 (0.82, 1.63) | 0.420 |
| Vision acuity, Right eye Low (ref: High) |
1.78 (1.27, 2.49) | <0.001 |
| Vision acuity, Left eye Average (ref: High) |
1.43 (0.99,2.05) | 0.054 |
| Vision acuity, Left eye Low (ref: High) |
2.28 (1.60, 3.23) | <0.001 |
| Extraocular movement problem: Right (ref: = 0) | 1.58 (0.70, 3.55) | 0.269 |
| Extraocular movement problem: Left (ref: = 0) | 1.51 (0.67, 3.40) | 0.320 |
| Visual field deficits: Right (ref: = 0) | 1.64 (1.04, 2.59) | 0.034 |
| Visual field deficits: Left (ref: = 0) | 2.08 (1.36, 3.16) | 0.001 |
| Hearing loss Right (ref: None) |
1.26 (0.84, 1.89) | 0.264 |
| Hearing loss Left (ref: None) |
1.57 (1.12, 2.21) | 0.009 |
| Hearing loss Bilateral (ref: None) |
1.69 (1.31, 2.2) | <0.001 |
| Difficulty falling asleep (ref: never/rarely) | 1.07 (0.61, 1.86) | 0.820 |
| Sleep continuity disturbance (ref: never/rarely) | 0.78 (0.44, 1.36) | 0.375 |
| Early morning awakening (ref: never/rarely) | 1.69 (0.98, 2.93) | 0.059 |
| Excessive daytime sleepiness (ref: never/rarely) | 1.67 (0.96, 2.92) | 0.070 |
| Domain score: Attention | 0.58 (0.51, 0.67) | <0.001 |
| Domain score: Executive | 0.67 (0.61, 0.73) | <0.001 |
| Domain score: Language | 0.71 (0.65, 0.78) | <0.001 |
| Domain score: Memory | 0.6447 (0.59, 0.71) | <0.001 |
| Domain score: Visuospatial | 0.55 (0.46, 0.65) | <0.001 |
Note each model includes the given covariates for that row + age + sex + education
Bonferroni corrected alpha level is 0.05/37 = 0.0014
Abbreviations: mCESD - modified Center for Epidemiologic Studies-Depression scale
The sensitivity analysis used the time of second driving cessation for 27 participants, and the results remain unchanged except that daytime sleepiness became a statistically significant predictor of driving cessation (Supplemental Digital Content 1).
DISCUSSION
We identified predictors of driving cessation over 12 years among older adults participating in a population-based cohort recruited from small-town, economically disadvantaged communities in southwestern Pennsylvania. Individuals who reported having ceased driving over the preceding year of follow-up were significantly older than those still driving. This finding is consistent with previously reported characteristics of older adults who have stopped driving9–11. More women (65.0%) than men had stopped driving in the MYHAT cohort; the gender effect is not statistically significant but is similar to results in the previous literature, and possibly an effect of women tending to self-regulate driving more than men9. Earlier generations of women also may be less confident in their driving abilities, have less experience driving and be less likely than men to view driving as an integral part of their identity. This could produce a cohort effect that might change as future generations of women are more likely to become the primary driver in their households12.
Additionally, participants who had poor and fair self-rated health were at higher risk for driving cessation. Physical health declines with age, and our results indicate that past drivers were more likely to report ‘poor’, ‘fair’ or ‘good’ health and less likely to report ‘very good’ and ‘excellent’ health than current drivers. Previous literature has shown that individuals with more chronic medical conditions may be more likely to avoid or stop driving20. The Pennsylvania DMV provides a list of medical conditions which mandates reporting of patients by their health care providers21. Changes in physical health, such as reduced strength, vision, and flexibility, may make the driving experience more physically challenging for older drivers, and thus influence the decision to stop driving. Participants who took more than three prescription medications were more likely to stop driving than those who took fewer medications. Some prescription medications could lead to side effects, such as sedation, which could impair attention and lead drivers to discontinue driving sooner. On the other hand, taking more prescription medications could also be an indicator of worse health and higher medical burden.
Individuals who reported three or more symptoms of depression, and responded “yes” to feeling lonely, were more likely to have stopped driving. It has been previously found that increased depression can be a consequence of driving cessation4,6. Here, we found depression to be a significant predictor of driving cessation in older adults. It could be that social isolation due to depression influences a decision to stop driving or that depressed individuals may have impairments in complex attention, speed of information processing, and executive function as well as motivation which could affect their ability to drive12.
In the survival models including time-varying covariates, the hazard ratio of driving cessation associated with mild cognitive impairment (CDR=0.5) was 2.56 and with dementia (CDR >=1) was 3.84. As cognitive function worsens, individuals may be more likely to pose risk to themselves and others on the road2 and thus to eventually face the decision to stop driving. This corresponds with a previous finding that the prevalence of driving declines with level of cognitive functioning22.
The associations between self-reported sleeping habits and driving cessation were not statistically significant. However, early awakening and excessive daytime sleepiness had relatively large effect sizes and were borderline significant. Poor sleep quality and not getting enough sleep can increase risk of impaired driving and motor vehicle crashes23. A recent study showed that sleep apnea was associated with a higher incidence of adverse driving behaviors in individuals with Alzheimer’s disease23; such incidents may lead older adults to discontinue driving.
In this cohort, driving cessation was associated with worse cognitive performance across all domains including attention, memory, and executive function, in both the adjusted and unadjusted analyses. Impaired attention, especially visual attention, has been associated with increased crash risk and driving performance24 and could explain why older drivers in our cohort ceased driving. Processing speed is an important component of attention tasks and is impaired with aging. Slowed processing speed, both in physical and cognitive tasks could impair driving ability and influence driving cessation. Executive functioning impacts the ability to shift sets, plan and be cognitively flexible, which are all important for the complex process of driving. Impaired executive function has consistently been the most reliable finding associated with driving difficulties24. Our finding of an association between driving cessation and impaired executive function further confirms this relationship. This also replicates findings from a cross-sectional study in the same study cohort12 where impaired performance across various cognitive domains was noted in former drivers and current drivers with difficulties.
Associations of driving cessation and sensory deficits were found in this cohort. Individuals with bilateral hearing loss, low visual acuity and visual field deficits were significantly more likely to stop driving. Visual attention and visual perception are crucial for driving, specifically for identifying other vehicles, pedestrians, animals and roadside targets and for reading traffic signs24. Impairment in the useful field of view (UFOV) has been found to be associated with increased crash risk and poorer on-road driving performance1.
The relationship between hearing loss and driving cessation is less clear and warrants further investigation. Presbycusis and loss of pitch discrimination occur as part of the aging process25,26; hearing deficits may affect driving performance through diminished ability to hear horns and sirens or distinguish these sounds from background noises. However, general hearing impairment is a risk factor for dementia27 and the observed association with driving cessation may also reflect underlying cognitive deficits.
Both strengths and limitations of this study stem from the research design and large cohort. Participants were randomly recruited from the community, which minimized selection bias related to health issues or access to medical care. Driving cessation was modeled as a function of time-varying covariates, in addition to baseline covariates, because many of these variables change over time. Like other population-based studies, the participant-level information collected for this study was by self-report, except for the neuropsychological test data and vision and hearing assessments. The MYHAT cohort is demographically representative of older adults in our target communities and thus of largely European descent; our findings should be replicated in cohorts drawn from more ethnically diverse populations.
Identifying potential driving cessation predictors early on may aid older adults, their families, and their health care providers in paying more attention to these factors and to inquire in more detail about patients’ driving history. Our findings contribute to a better understanding of when sufficient risk factors have accumulated that it is time to begin discussing the decision for an older adult to stop driving.
Supplementary Material
Supplemental Digital Content 1. Survival analyses using Cox models on time to driving cessation (using second time noting driving cessation) adjusting for demographics (age, sex and education)
ACKNOWLEDGMENTS
The authors thank all MYHAT study participants for their cooperation, and all study personnel for their efforts which made this manuscript possible.
The work reported here was supported in part by grant # AG023651 from the National Institute on Aging, US Department of Health and Human Services. Dr. Ganguli reports grants from National Institute on Aging during the conduct of the study. Dr. Chang reports grants from NIH during the conduct of the study. Ms. Jacobsen reports grants from National Institute on Aging during the conduct of the study. Dr. Snitz reports grants from National Institute on Aging during the conduct of the study. Ms. Wood, Dr. Bhojak and Ms. Jia report no conflicts with any product mentioned or concept discussed in this article.
REFERENCES
- 1.Anstey KJ, Wood J, Lord S, et al. Cognitive, sensory and physical factors enabling driving safety in older adults. Clin Psychol Rev. Jan 2005;25(1):45–65. doi: 10.1016/j.cpr.2004.07.008 [DOI] [PubMed] [Google Scholar]
- 2.Ball K, Rebok G. Evaluating the Driving Ability of Older Adults. Journal of Applied Gerontology. 1994;13(1):20–38. doi: 10.1177/073346489401300103 [DOI] [Google Scholar]
- 3.Yu J, Kahana E, Kahana B, et al. Driving Cessation in Old Age: Gender Influences on Mortality. J Aging Health. Aug-Sep 2021;33(7–8):447–457. doi: 10.1177/0898264321991254 [DOI] [PubMed] [Google Scholar]
- 4.Ragland DR, Satariano WA, MacLeod KE. Driving cessation and increased depressive symptoms. J Gerontol A Biol Sci Med Sci. Mar 2005;60(3):399–403. doi: 10.1093/gerona/60.3.399 [DOI] [PubMed] [Google Scholar]
- 5.Windsor TD, Anstey KJ, Butterworth P, et al. The role of perceived control in explaining depressive symptoms associated with driving cessation in a longitudinal study. Gerontologist. Apr 2007;47(2):215–23. doi: 10.1093/geront/47.2.215 [DOI] [PubMed] [Google Scholar]
- 6.Marottoli RA, Mendes de Leon CF, Glass TA, et al. Driving cessation and increased depressive symptoms: prospective evidence from the New Haven EPESE. Established Populations for Epidemiologic Studies of the Elderly. J Am Geriatr Soc. Feb 1997;45(2):202–6. doi: 10.1111/j.1532-5415.1997.tb04508.x [DOI] [PubMed] [Google Scholar]
- 7.Shimada H, Makizako H, Tsutsumimoto K, et al. Driving and Incidence of Functional Limitation in Older People: A Prospective Population-Based Study. Gerontology. 2016;62(6):636–643. doi: 10.1159/000448036 [DOI] [PubMed] [Google Scholar]
- 8.Talbot A, Bruce I, Cunningham CJ, et al. Driving cessation in patients attending a memory clinic. Age Ageing. Jul 2005;34(4):363–8. doi: 10.1093/ageing/afi090 [DOI] [PubMed] [Google Scholar]
- 9.Connors MH, Ames D, Woodward M, et al. Predictors of Driving Cessation in Dementia: Baseline Characteristics and Trajectories of Disease Progression. Alzheimer Dis Assoc Disord. Jan-Mar 2018;32(1):57–61. doi: 10.1097/WAD.0000000000000212 [DOI] [PubMed] [Google Scholar]
- 10.Gallo JJ, Rebok GW, Lesikar SE. The driving habits of adults aged 60 years and older. J Am Geriatr Soc. Mar 1999;47(3):335–41. doi: 10.1111/j.1532-5415.1999.tb02998.x [DOI] [PubMed] [Google Scholar]
- 11.Dellinger AM, Sehgal M, Sleet DA, et al. Driving cessation: what older former drivers tell us. J Am Geriatr Soc. Apr 2001;49(4):431–5. doi: 10.1046/j.1532-5415.2001.49087.x [DOI] [PubMed] [Google Scholar]
- 12.Bhojak T, Jia Y, Jacobsen E, et al. Driving Habits of Older Adults: A Population-based Study. Alzheimer Dis Assoc Disord. Jul-Sep 01 2021;35(3):250–257. doi: 10.1097/WAD.0000000000000443 [DOI] [PMC free article] [PubMed] [Google Scholar]
- 13.Ganguli M, Snitz B, Vander Bilt J, et al. How much do depressive symptoms affect cognition at the population level? The Monongahela-Youghiogheny Healthy Aging Team (MYHAT) study. Int J Geriatr Psychiatry. Nov 2009;24(11):1277–84. doi: 10.1002/gps.2257 [DOI] [PMC free article] [PubMed] [Google Scholar]
- 14.Folstein MF, Folstein SE, McHugh PR. “Mini-mental state”. A practical method for grading the cognitive state of patients for the clinician. J Psychiatr Res. Nov 1975;12(3):189–98. doi: 10.1016/0022-3956(75)90026-6 [DOI] [PubMed] [Google Scholar]
- 15.Mungas D, Marshall SC, Weldon M, et al. Age and education correction of Mini-Mental State Examination for English and Spanish-speaking elderly. Neurology. Mar 1996;46(3):700–6. doi: 10.1212/wnl.46.3.700 [DOI] [PubMed] [Google Scholar]
- 16.Fillenbaum GG, Duke University. Center for the Study of Aging and Human Development. Multidimensional functional assessment of older adults : the Duke Older Americans Resources and Services procedures. L. Erlbaum Associates; 1988:xii, 179 p. [Google Scholar]
- 17.Ganguli M, Gilby J, Seaberg E, et al. Depressive Symptoms and Associated Factors in a Rural Elderly Population: The MoVIES Project. Am J Geriatr Psychiatry. Spring 1995;3(2):144–160. doi: 10.1097/00019442-199500320-00006 [DOI] [PubMed] [Google Scholar]
- 18.Radloff LS. The CES-D scale: A self-report depression scale for research in the general population. Applied psychological measurement. 1977;1(3):385–401. [Google Scholar]
- 19.Morris JC. The Clinical Dementia Rating (CDR): current version and scoring rules. Neurology. Nov 1993;43(11):2412–4. doi: 10.1212/wnl.43.11.2412-a [DOI] [PubMed] [Google Scholar]
- 20.Marshall SC, Man-Son-Hing M. Multiple chronic medical conditions and associated driving risk: a systematic review. Traffic Inj Prev. Apr 2011;12(2):142–8. doi: 10.1080/15389588.2010.551225 [DOI] [PubMed] [Google Scholar]
- 21.Vehicles PDoM. Medical Criteria and Regulations. PennDot. 2022. https://www.dmv.pa.gov/Information-Centers/Medical-Reporting/Pages/Medical-Criteria.aspx [Google Scholar]
- 22.Foley DJ, Masaki KH, Ross GW, et al. Driving cessation in older men with incident dementia. J Am Geriatr Soc. Aug 2000;48(8):928–30. doi: 10.1111/j.1532-5415.2000.tb06889.x [DOI] [PubMed] [Google Scholar]
- 23.Doherty JM, Roe CM, Murphy SA, et al. Adverse driving behaviors are associated with sleep apnea severity and age in cognitively normal older adults at risk for Alzheimer’s disease. Sleep. Mar 18 2022; doi: 10.1093/sleep/zsac070 [DOI] [PMC free article] [PubMed] [Google Scholar]
- 24.Wagner JT, Muri RM, Nef T, et al. Cognition and driving in older persons. Swiss Med Wkly. 2011;140:w13136. doi: 10.4414/smw.2011.13136 [DOI] [PubMed] [Google Scholar]
- 25.Gates GA, Mills JH. Presbycusis. Lancet. Sep 24–30 2005;366(9491):1111–20. doi: 10.1016/S0140-6736(05)67423-5 [DOI] [PubMed] [Google Scholar]
- 26.Clinard CG, Tremblay KL, Krishnan AR. Aging alters the perception and physiological representation of frequency: evidence from human frequency-following response recordings. Hear Res. Jun 1 2010;264(1–2):48–55. doi: 10.1016/j.heares.2009.11.010 [DOI] [PMC free article] [PubMed] [Google Scholar]
- 27.Lin FR, Albert M. Hearing loss and dementia - who is listening? Aging Ment Health. 2014;18(6):671–3. doi: 10.1080/13607863.2014.915924 [DOI] [PMC free article] [PubMed] [Google Scholar]
Associated Data
This section collects any data citations, data availability statements, or supplementary materials included in this article.
Supplementary Materials
Supplemental Digital Content 1. Survival analyses using Cox models on time to driving cessation (using second time noting driving cessation) adjusting for demographics (age, sex and education)