

Abstract
Objective:
The study aims to investigate whether machine learning-based predictive models for cardiovascular disease (CVD) risk assessment show equivalent performance across demographic groups (such as race and gender) and if bias mitigation methods can reduce any bias present in the models. This is important as systematic bias may be introduced when collecting and preprocessing health data, which could affect the performance of the models on certain demographic sub-cohorts. The study is to investigate this using electronic health records data and various machine learning models.
Methods:
The study used large de-identified Electronic Health Records data from Vanderbilt University Medical Center. Machine learning (ML) algorithms including logistic regression, random forest, gradient-boosting trees, and long short-term memory were applied to build multiple predictive models. Model bias and fairness were evaluated using equal opportunity difference (EOD, 0 indicates fairness) and disparate impact (DI, 1 indicates fairness). In our study, we also evaluated the fairness of a non-ML baseline model, the American Heart Association (AHA) Pooled Cohort Risk Equations (PCEs). Moreover, we compared the performance of three different de-biasing methods: removing protected attributes (e.g., race and gender), resampling the imbalanced training dataset by sample size, and resampling by the proportion of people with CVD outcomes.
Results:
The study cohort included 109,490 individuals (mean [SD] age 47.4 [14.7] years; 64.5% female; 86.3% White; 13.7% Black). The experimental results suggested that most ML models had smaller EOD and DI than PCEs. For ML models, the mean EOD ranged from −0.001 to 0.018 and the mean DI ranged from 1.037 to 1.094 across race groups. There was a larger EOD and DI across gender groups, with EOD ranging from 0.131 to 0.136 and DI ranging from 1.535 to 1.587. For debiasing methods, removing protected attributes didn’t significantly reduced the bias for most ML models. Resampling by sample size also didn’t consistently decrease bias. Resampling by case proportion reduced the EOD and DI for gender groups but slightly reduced accuracy in many cases.
Conclusions:
Among the VUMC cohort, both PCEs and ML models were biased against women, suggesting the need to investigate and correct gender disparities in CVD risk prediction. Resampling by proportion reduced the bias for gender groups but not for race groups.
Keywords: Machine learning, Fairness, Electronic health records, Clinical predictive models, Bias mitigation, Cardiovascular diseases
1. Introduction
Using predictive models for risk assessment is a fundamental component of precision medicine, which can identify high-risk patients for early prevention. Machine learning (ML) has been increasingly used to learn from massive, complex health data such as Electronic Health Records (EHR) data to inform clinical decisions such as diagnosis, adverse outcome prediction, and treatment recommendation [1,2,3]. However, in practice, a dataset used to train models may involve systematic bias such as sampling bias (e.g., underrepresentation of subcohort), differential missingness, or statistical estimation errors through the collection and preprocessing [4]. Whether ML models trained on such data amplify the bias and yield decisions skewed toward some groups of people (e.g., age, gender, and race) remains uncertain [5,6,16]. Any unfairness produced by clinical predictive models would affect health equity and transportability.
Evaluating the bias and fairness of ML models has drawn much attention in the machine learning and statistics community. Researchers have proposed methods to assess and mitigate the bias for various applications that could adversely affect underrepresented groups, like recidivism prediction, credit risk prediction, and income prediction [7,8]. However, systematic research on the bias of clinical predictive models remains scarce because real-world health data is not widely available, and the underlying causal structures of high-dimensional health data need to be better understood [9,10]. Metrics and methods designed for identifying and mitigating biases in clinical settings need to be explored [11].
As CVD is the leading cause of death in the United States and worldwide [13,14], early detection and prevention are vital in extending living years and reducing mortality, disability, and costs related costs. In this study, we examined the fairness among race and gender groups of ML-based models for predicting cardiovascular disease (CVD) and compared it to the widely used American Heart Association’s Pooled Cohort Risk Equations (PCEs) [12]. In addition, we tested several bias mitigation methods to evaluate the effectiveness of reducing the bias and the effect on accuracy. The goal of the study was to 1) understand the importance of detecting the bias and assessing the fairness of ML-based models, 2) evaluate metrics that can quantify the fairness of ML-based clinical predictive models, and 3) apply methods to mitigate the bias of ML models. The metrics and approaches were not only limited to CVD prediction and could extend to other types of disease.
2. Materials and method
2.1. Setting and data
We used a large cohort and dataset from Vanderbilt University Medical Center (VUMC) de-identified EHR. The cohort included outpatient individuals (age>=18) with 10-year follow-ups from Jan. 2007 to Dec. 2016. We exclude patients who have a previous CVD history before Jan. 2007. The study was limited to White and Black adults. Details of cohort selection have been described in our previous paper [15]. This project was approved by VUMC Institutional Review Board (IRB #210607).
The primary outcome was CVD, including coronary heart disease, myocardial infarction, and stroke. The CVD diagnosis was defined using the phecode 411. * and 433. * [15,17]. Phecodes are one strategy for defining phenotypes using EHR data [15,17], mapped from International Classification of Diseases (ICD) Ninth Revision Clinical Modification (ICD-9-CM), ICD-10, and ICD-10-CM codes. The outcome was defined as having ≥ 1 phecodes of CVD from 01/01/2007 to 12/31/2016.
We trained the ML models using 7-year baseline EHR data recorded prior to 01/01/2007 to predict CVD in the 10-year follow-up period. We excluded patients who have a CVD history before the baseline date of 01/01/2007. To ensure patients have sufficient data for training, we restricted individuals to those with at least one outpatient blood pressure measured during the 7-year EHR period. Patients with no CVD outcome must have at least one outpatient visit after 2016 (a year before the follow-up window expires) to ensure adequate follow-up time [15].
Predictors included demographic (age, gender, race, and EHR length), lifestyle factors (e.g., smoking, body mass index [BMI]), laboratory tests (e.g., total cholesterol, high/low-density lipoprotein), physical measurements (e.g., systolic/diastolic blood pressures), diagnosis (e.g., diabetes and hypertension), and medications. For diagnosis history, we used phecodes. The detailed feature list is in Supplementary Table 1. For physical measurement and lab values, if an individual had no such measure available within the EHR, we imputed the missing value with the median value of the group with the same age and gender [15]. We also added a dummy variable for each measure to indicate whether the test value was imputed. The summary of these dummy variables is in Supplementary Table 2. We treated the missing for smoking, diagnosis, and medication as a “no”.
2.2. Fairness evaluation
We defined a few terms used throughout the paper (Table 1). Because predictive models are applied to the context of decision-making, we focused on the fairness of prediction performance. We used the term bias to refer to the disparity observed in underlying data and prediction model outcomes trained with the data. We defined disparity as discrepancies in measures of interest unexplained by clinical need, in line with the Institute of Medicine’s definition [27]. Fairness is defined as the controversy of bias. A model was fair if its prediction errors were similar between the privileged and unprivileged groups. In contrast, an algorithm is unfair if its decisions skew toward a particular group of people without being explained by clinical need [18,19].
Table 1.
Definition of the terminology.
| Terminology | Definition |
|---|---|
|
| |
| Protected attribute | A protected attribute divides a population into groups that should have parity in their outcomes. In this study, race and gender were two protected attributes that we investigated. |
| Privileged group | A privileged group was defined as a group of people whose protected attributes have the privileged value. [6] The White and the male groups were privileged compared to the Black and the female groups, respectively. |
| Label | The outcome label for individual. 1 indicates the CVD diagnosis (case); 0 means control. |
| Favorable label | A favorable label is the one whose value corresponds to an outcome that benefits the recipient. Positive CVD prediction was the favorable label because high-risk patients can be identified early and treated to reduce their risk of adverse outcomes. |
Based on the definition of fairness, we utilized two metrics to assess fairness – equal opportunity difference (EOD) and disparate impact (DI).
1) Equal opportunity difference (EOD) measures the difference in true positive rates between the privileged and unprivileged groups. Mathematically, EOD is defined as:
| (1) |
where : predicted label, : protected attribute, : privileged value (i.e., White or Men), : unprivileged value, : actual label [5].
An EOD value of 0 indicates fairness as it shows equal true positive rates for both privileged and unprivileged groups, meaning that the probability of correctly identifying individuals with CVD is equal for both groups. If the EOD value is greater than 0, it means that the model is more likely to underestimate the risk of CVD for unprivileged groups, indicating a failure to meet the definition of fairness.
2) Disparate impact (DI) measures the ratio of predicted favorable label percentage between the privileged and unprivileged groups, defined as:
| (2) |
where have the same meaning as defined in (1).
A DI value of 1 indicates fairness if the predicted favorable outcome percentage is the same for both privileged and unprivileged groups. The concept behind the DI was that all people should have an equal opportunity to obtain a favorable prediction regardless of race and gender.
We chose EOD and DI as the primary metrics of fairness as they were suggested in multiple studies related to bias assessment. [6,7,18]. True positive rates and positive prediction rates are also essential concerns for fairness in clinical prediction models.
2.3. Bias mitigation
Bias mitigation, or debiasing, attempts to improve the fairness metrics by modifying the training data distribution, the learning algorithm, or the predictions. Because protected attributes and data imbalance were considered as primary causes of bias, we investigated the following types of debiasing methods – removing protected attributes from the model and resampling to balance the group distribution of training data across the protected attribute before training the ML models.
2.3.1. Removing protected attributes
Since race and gender were the protected attributes, we excluded them for comparison when training the models. Previous studies showed that removing the race or gender attribute from the prediction model can reduce bias through a mechanism called fairness through unawareness. [5,6] Therefore, we compared the models trained with and without the protected attributes.
2.3.2. Resampling approaches
For ML models, bias is most likely caused by either of the following imbalanced cases: (1) Training data in each group has an imbalanced sample size. (2) Class distributions are not the same across all groups. The resampling approach aims to mitigate the bias caused by these two imbalanced cases. We applied two resampling methods: 1) resampling by group size, which oversampled the minority group (smaller sample size) to match the size of the majority group, and 2) resampling by proportion, which resampled only positive samples in the group with a lower ratio of positive class to balance ratios across groups.
2.4. Model training and statistical analysis
We assessed the fairness of ML models and a widely used clinical model – the ACC/AHA PCEs [16]. The PCE was based on a fixed set of cross-sectional factors, including age, gender, race/ethnicity, systolic blood pressure, hypertension treatment, diabetes, cholesterol, and smoking status. We applied three commonly used ML models – logistic regression (LR), random forest (RF), and gradient boosting trees (GBT). Since the PCE model only included some conventional risk factors and there were more informative features in our EHR data, we trained our ML models using PCE features only and using additional EHR features (Supplementary Table 1). In addition, we applied a deep learning model – Long short-term memory (LSTM) – using our longitudinal raw data. The implementation of LSTM was presented in the Supplement, and the results were shown in Supplementary Table 6.
For each ML model, our cohort was randomly split into training (60%), validation (20%), and testing (20%). First, we applied 5-fold cross-validation, in each of which we split the training set for hyperparameter tuning using random search. We chose an optimal hyperparameter set with the highest AUROC score. The candidate and best hyperparameters were presented in Supplementary Table 3. The validation set was used to determine the threshold on the predicted risk of CVD for binary outcome prediction. The cut-off point for risk probability was determined using Youden’s J statistic (also known as Youden’s index or J-score), which maximizes sensitivity and specificity combined [20]. The test set was used to evaluate the accuracy and fairness of the model. We also calculated the probability of getting CVD using the PCEs on each test set. The threshold for high- and low-risk cut-off (7.5%) was recommended by the ACC/AHA Pool Equation guidelines [12,28]. We repeated the train-validation-test splits ten times to assess the models’ robustness in predictive capability [15,29,32]. Based on the ten-time results from each test set, we calculated the mean and standard deviation for the metrics of interest.
To investigate model generalizability, we performed an external validation. We used the All of Us Research Program data, a national initiative that targets one million diverse participants and includes surveys, physical measurements, and EHR information [26]. We followed the same criteria to select the cohort from All-of-Us data.
We assessed model performance using the area under the receiver operating characteristic (AUROC) and the balanced accuracy score (BA), where balanced accuracy = (Sensitivity + Specificity) / 2. The existence of bias was tested with a one-sample t-test for each model. The null hypothesis was EOD = 0 and DI = 1, which means there was no bias. The difference before and after using each bias mitigation method was tested with paired t-tests. The null hypothesis was that bias mitigation did not change the EOD or DI. We conducted Bonferroni correction on the p-values for multiple testing. The significance threshold was adjusted p-value < 0.05.
The ML models and fairness assessment algorithms were implemented with Python 3.8.3, and Scikit-Learn 0.19.1 (http://scikit-learn.org/stable/). The detailed codes are available on GitHub (https://github.com/Fuchen-Li/Evaluating-and-Mitigating-Bias-in-ML-Models-for-CVD).
3. Results
3.1. Demographic and risk factor comparison
The study cohort included 109,490 individuals. Of these, 9,824 (9.0%) patients were diagnosed with CVD. The mean age of the patients was 47.4 ± 14.7 years. The cohort included 94,506 (86.3%) White, 14,984 (13.7%) Black adults; 38,853 (35.5%) males, and 70,637 (64.5%) females. We summarized the characteristics of the cohort in Table 2. The Black group had a younger mean age (43.4 ± 13.4 vs. 48.0 ± 14.7), a longer EHR length (5.8 ± 4.7 vs. 4.8 ± 4.3), and a lower prevalence of CVD (1302 [8.7%] vs. 8522 [9.0%]) compared to the White group. The female group had a younger mean age (46.9 ± 14.8 vs. 48.3 ± 14.4), a longer EHR length (5.2 ± 4.5 vs. 4.4 ± 4.1), and a lower CVD incidence (5574 [7.9%]) compared to the male group (4250 [10.9%]). Most conventional risk factors showed significant differences among racial and gender groups. Missing rates for physical measurement and lab values can be found in Supplementary Table 2.
Table 2.
Comparison between Black and White, as well as the male and female subgroups in demographic and conventional CVD risk factors.
| Characteristic | Overall | White / Black | Male / Female | ||
|---|---|---|---|---|---|
|
|
|
||||
| Value | Adjusted p-value | Value | Adjusted p-value | ||
|
| |||||
| Population size (%) | 109,490 (100) | 94,506 (86.3) / 14,984 (13.7) | < 0.0001 | 38,853 (35.5) / 70,637 (64.5) | < 0.0001 |
| Number of case (%) | 9824 (9.0) | 8522 (9.0) / 1302 (8.7) | < 0.0001 | 4250 (10.9) / 5574 (7.9) | < 0.0001 |
| Age, mean years (SD) | 47.4 (14.7) | 48.0 (14.7) / 43.4 (13.4) * | < 0.0001 | 48.3 (14.4) / 46.9 (14.8) * | < 0.0001 |
| EHR length, mean years (SD) | 4.9 (4.3) | 4.8 (4.3)/5.8 (4.7) * | < 0.0001 | 4.4 (4.1)/5.2 (4.5) * | < 0.0001 |
| Smoking, % | 26 | 26.0 / 25.7 | 14.603 | 29.8 / 23.9 * | < 0.0001 |
| Systolic pressure, mean mmHg (SD) | 123.6 (16.7) | 123.3 (16.5)/125.6 (17.6) * | < 0.0001 | 127.2 (16.0)/121.6 (16.7) * | < 0.0001 |
| Diastolic pressure, mean mmHg (SD) | 75.7 (10.3) | 75.5 (10.2)/77.4 (11.1) * | < 0.0001 | 78.3 (10.3)/74.3 (10.1) * | < 0.0001 |
| BMI, mean (SD) | 28.4 (7.0) | 28.0 (6.7) / 30.5 (8.2) * | < 0.0001 | 28.5 (5.7)/28.3 (7.5) * | 0.005 |
| Cholesterol, mean mg/dL (SD) | 192.9 (24.0) | 193.4 (23.8)/190.1 (25.3) * | < 0.0001 | 190.4 (24.3)/194.3 (23.7) * | < 0.0001 |
| Triglycerides, mean mg/dL (SD) | 128.0 (81.3) | 129.8 (84.2)/116.7 (58.7) * | < 0.0001 | 148.0 (102.4)/117.0 (64.4) * | < 0.0001 |
| Creatinine, mean mg/dL (SD) | 0.9 (0.4) | 0.9 (0.3)/0.9 (0.8) * | < 0.0001 | 1.0 (0.5)/0.8 (0.3) * | < 0.0001 |
| Glucose, mean mg/dL (SD) | 96.4 (25.9) | 96.2 (24.0)/97.8 (35.8) * | < 0.0001 | 99.6 (29.6)/94.7 (23.5) * | < 0.0001 |
| HDL, mean mg/dL (SD) | 55.2 (10.5) | 55.0 (10.4)/56.0 (10.8) * | < 0.0001 | 46.7 (7.2)/59.8 (9.0) * | < 0.0001 |
| LDL, mean mg/dL (SD) | 108.7 (17.8) | 108.8 (17.2)/107.8 (21.2) * | < 0.0001 | 110.3 (18.0)/107.7 (17.6) * | < 0.0001 |
| Diabetes, % | 9.3 | 8.5 / 14.2 * | < 0.0001 | 10.7 / 8.5 * | < 0.0001 |
| Hypertension, % | 26 | 26 / 25.7 * | < 0.0001 | 29.8 / 23.9 * | < 0.0001 |
Note: SD, standard deviation.
Significance level: Bonferroni-corrected adjusted p-value < 0.05. The Bonferroni-corrected adjusted p-value was calculated using (uncorrected) p-value and multiplying it by the number of comparisons made (i.e., 30). For continuous variables, two-sample t-tests were used. For categorical variables (smoking, diabetes, and hypertension), two-sample proportion z-tests were used. The p-values were adjusted for multiple comparisons using Bonferroni correction.
The external validation cohort from All-of-Us included 8,862 individuals with a mean age of 50.1 ± 13.1 years, 7,583 (85.6%) White, 1,279 (14.4%) Black; 3,052 (34.4%) male and 5,810 (65.6%) female.
3.2. Performance evaluation
ML models were trained separately using the features in the PCE model and with the complete set of EHR variables (as detailed in Supplementary Table 1). Compared to the ACC/AHA equation, the ML models trained with PCE features achieved higher AUROCs (0.746–0.756 vs 0.734, p-values < 0.01) and balanced accuracy values (0.680–0.691 vs 0.654, p-values < 0.01).
The ML models trained with the EHR variables had higher AUROCs (0.763–0.781) and balanced accuracy values (0.680–0.706) than those trained with PCE features (Supplementary Table 4). Over the same variable space, GBT demonstrated the best AUROC (0.781 ± 0.005) and balanced accuracy (0.706 ± 0.004) compared with LR and RF.
3.3. Fairness evaluation
Overall, in evaluating the bias among race and gender categories, the PCE model showed significant bias in terms of both EOD and DI on gender and race. ML models trained with PCE features had an opposite direction of bias across race and a similar-direction but significantly smaller bias across gender (Fig. 1). ML models trained with the additional EHR variables resulted in smaller mean of EOD and DIs (except for RF), while the differences were not significant for all models.
Fig. 1.
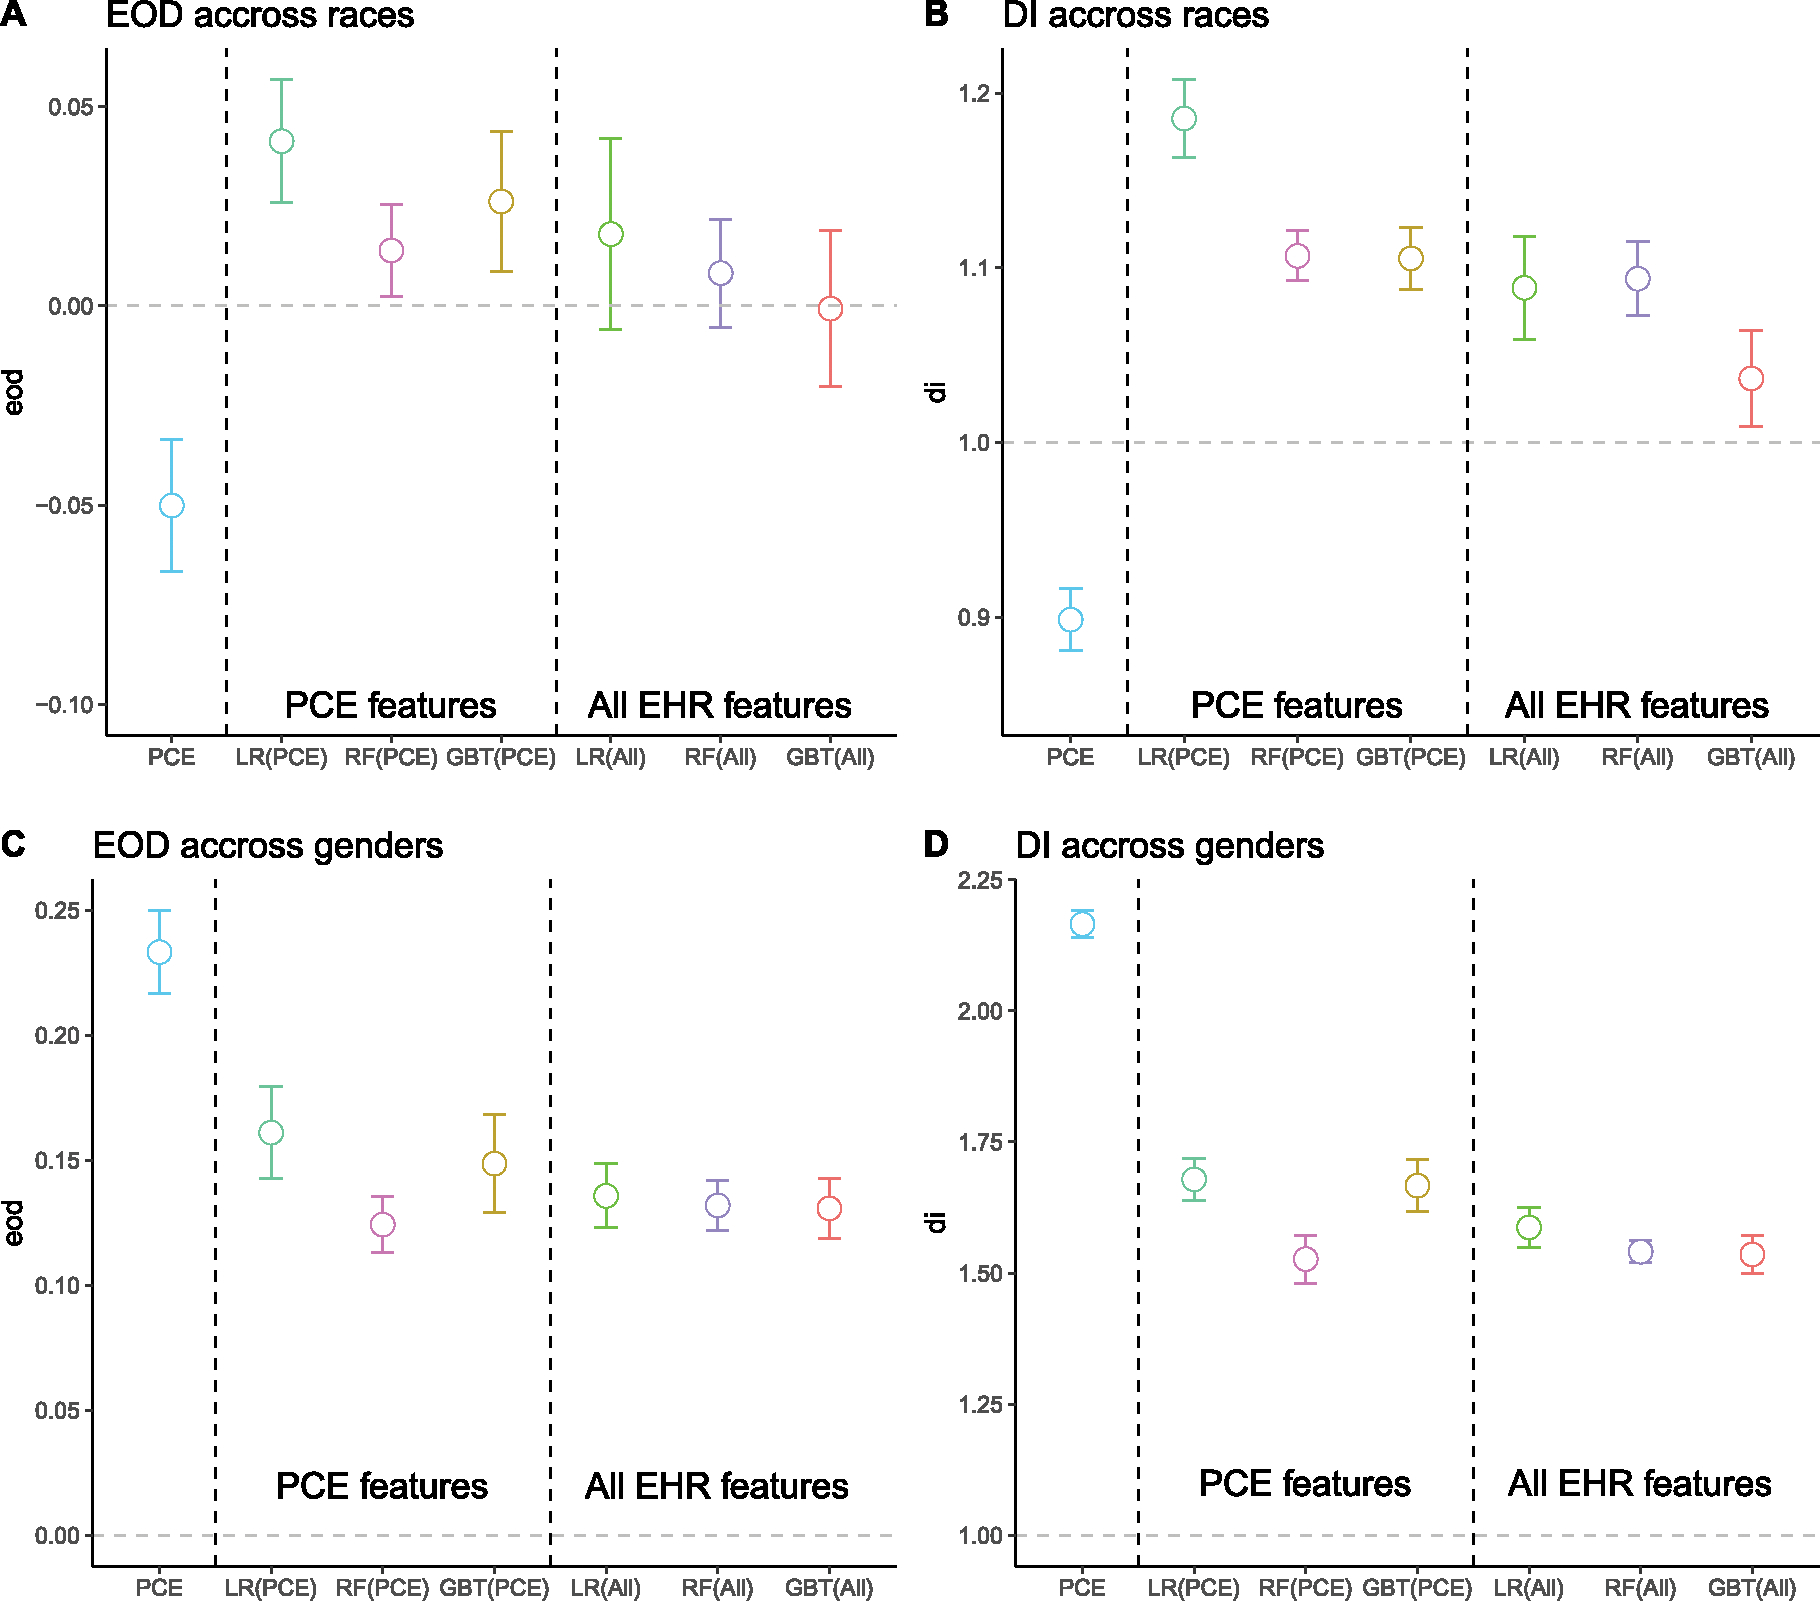
Comparison of the mean and 95% confidence interval (CI) of fairness metrics for the ACC/AHA model, ML models trained with PCE features, and ML models trained with all EHR features. The bars represent 95% CI calculated from 10-time results using a t-distribution with a degree of freedom = 9. A: Equal opportunity (EOD) difference across two race groups (Black and White). B: Disparate impact (DI) across race groups. C: Equal opportunity difference across two gender groups (male and female). D: Disparate impact across gender groups. The reference value (the gray dashed line) for fairness is 0 for EOD and 1.0 for DI.
Across race groups (Fig. 1 A–B), the mean EOD of ML models using all EHR features ranged from −0.001 (GBT) to 0.018 (LR), and the mean DI ranged from 1.037 (GBT) to 1.094 (RF). The DIs achieved by all models were significantly higher than the reference fairness value (DI = 1), indicating that the White group has a higher predicted positive class ratio than the Black group. However, the EODs were not significantly different from the reference fairness value (EOD = 0).
Across gender groups (Fig. 1 C–D), the mean EOD of ML models ranged from 0.131 (GBT) to 0.136 (LR), and the mean DI ranged from 1.535 (GBT) to 1.587 (LR). Both were significantly higher than the corresponding reference fairness value. Accordingly, models produced lower true positive rates and predicted positive ratios for women than men.
We also observed significant bias across race and gender in the LSTM model (Supplementary Table 6). Across races, the EOD was 0.111, and the DI was 1.305, which was larger than all other models. Across gender, the bias was larger (EOD = 0.123 and DI = 1.502). The magnitude was similar to other ML models.
3.4. External validation
We conducted external validation using de-identified All-of-Us data. We presented the result in Supplementary Table 3. Overall, the AUROC dropped, possibly due to data shifts or different protocols for diagnosis code and medication assignment, especially for the LR model. RF and GBT outperformed PCE, but not so much as in the VUMC cohort.
In terms of fairness, almost all ML models had less bias than the PCE (EOD = 0.052 and DI = 1.321 across races; EOD = 0.207 and DI = 3.438 across gender). The only exception was the EOD across races of the RF model (Supplementary Table 5). Specifically, across races, the EOD of ML models ranged from 0 to 0.094, and the DI ranged from 1.001 to 1.178., The bias across gender became smaller in external validation data than in the internal VUMC test set. The EOD of ML models ranged from −0.001 to 0.027, and the DI ranged from 1.008 to 1.044.
3.5. Bias mitigation
We compared fairness metrics for three bias mitigation methods (Fig. 2). The reference methods (baselines) were ML models trained with additional EHR features without debiasing methods. Two sample t-test was used to compare the fairness metrics achieved by the debiasing results with the reference method, and the p-values were adjusted with Bonferroni correction. Among race groups (Fig. 2A–B), removing race from the model did not significantly reduce the EOD and DI. Resampling by size did not reduce the EOD and DI but enlarged them. Resampling by proportion slightly decreased the EOD and DI, but the difference was only significant for the LR model.
Fig. 2.
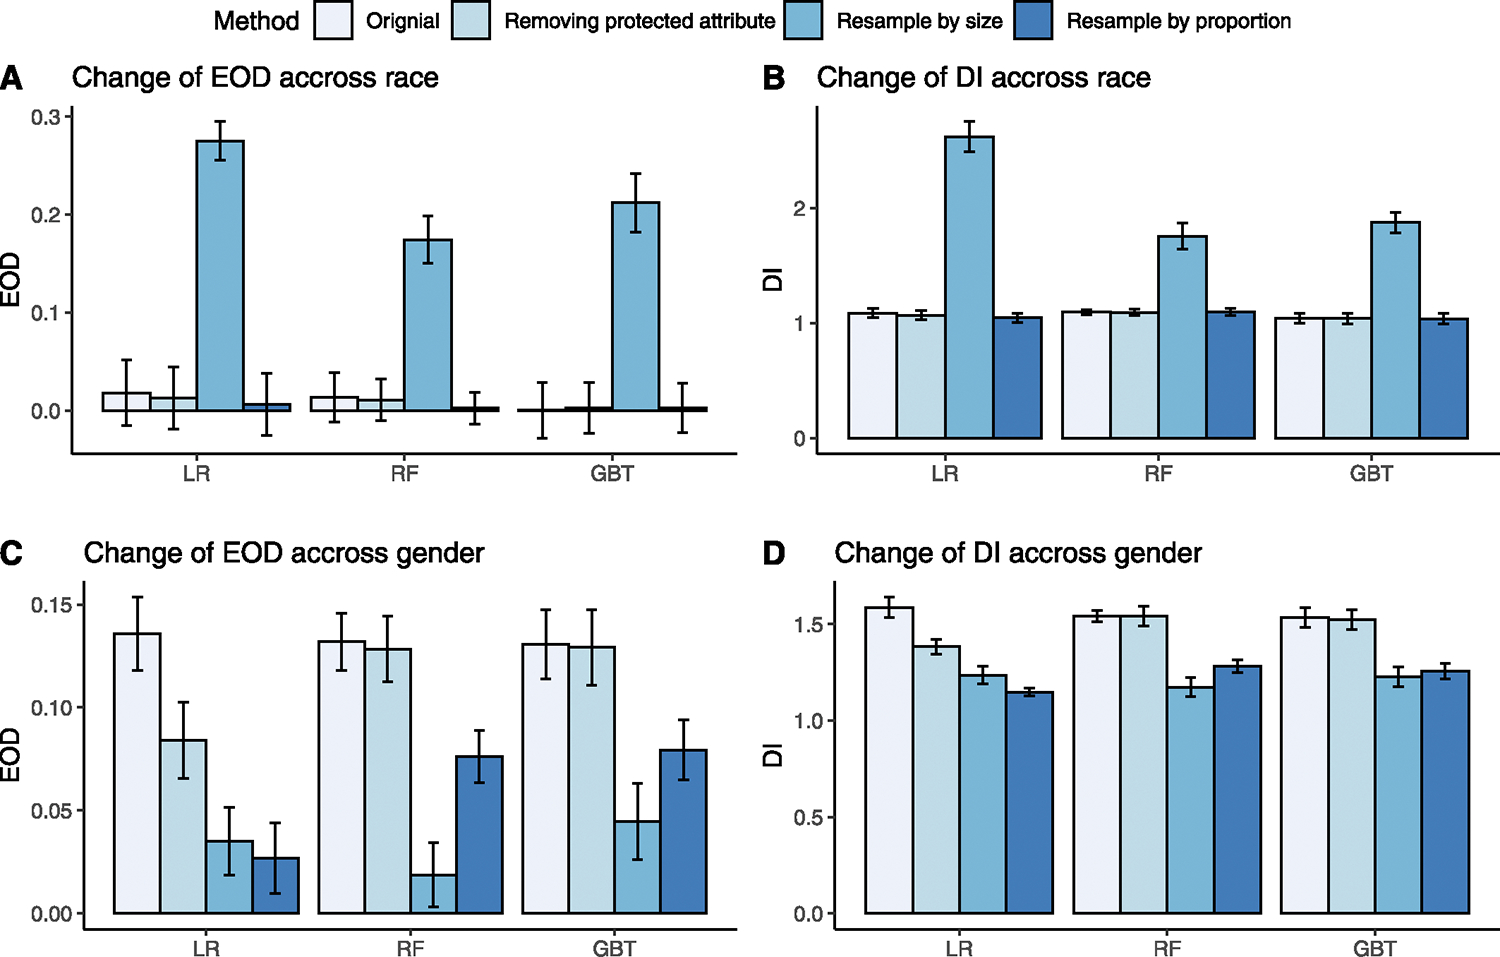
A comparison of EODs and DIs for three ML models before and after debiasing. The error bar represents standard deviation. A: Change of EOD across race groups before (original) and after removing protected attribute, resampling by size, and resampling by proportion compared to the original value before debiasing for each model. B: Change of DI across races before and after debiasing. C: Change of EOD across gender before and after debiasing. D: Change of DI across gender before and after debiasing.
Among gender groups (Fig. 2C–D), removing gender from the model significantly reduced the EOD of the LR model from 0.136 to 0.084 and DI from 1.587 to 1.382. But the reduction was not significant for the RF and GBT model. Resampling by size significantly improved the EOD and DI for all models, especially improving the EOD of RF from 0.132 to 0.019 and DI from 1.541 to 1.174. Similarly, resampling by proportion significantly improved the EOD and DI for all models. Specifically, for the LR model, the EOD dropped from 0.136 to 0.027, and DI dropped from 1.587 to 1.148.
For the LSTM model (Supplementary Table 6), resampling by size and proportion decreased the bias across races, but the changes were not statistically significant. However, across gender, resampling by proportion significantly reduced the bias, matching our observation in the ML models.
We illustrated the effect of debiasing methods on fairness versus the AUROC (Fig. 3). Since models had large EOD and DI on gender groups, we demonstrated the impact of debiasing on gender groups. As shown in Fig. 3, removing protected attributes from the model reduced the EOD and DI by a small magnitude and did not affect AUROC. Resampling by size reduced the EOD and DI while slightly decreased the AUROC (significant for LR and GBT). Finally, resample by proportion reduced the EOD and DI but at a compromise of AUROC. The detailed changes for AUROC and BA for all ML models are shown in Supplementary Table 7.
Fig. 3.
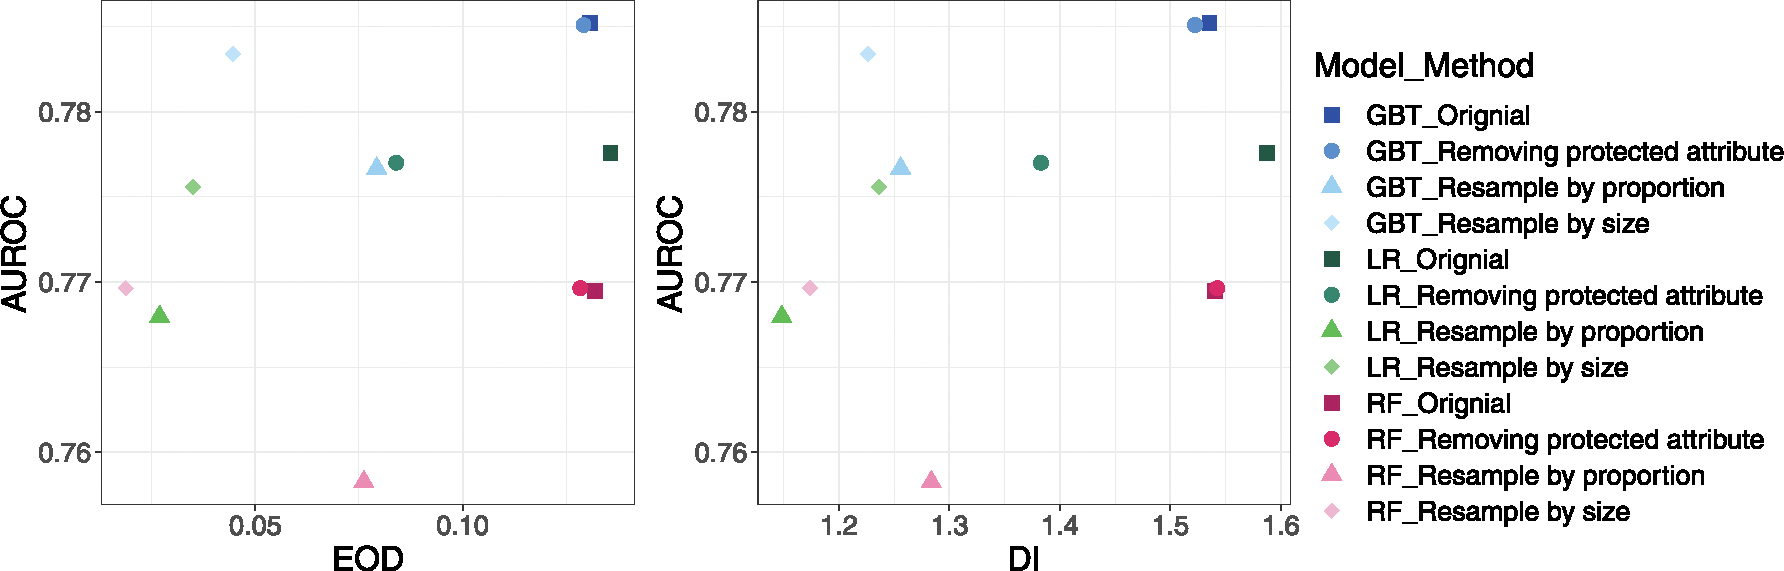
Fairness vs. AUROC before and after debasing for gender group. The point is the mean value of 10 times splits. The shape represents the debias method used (or none), and the color represents the ML model used.
4. Discussion
CVD is a complex disease with an array of known risk factors that evolve over time. Studies have suggested that ML models using longitudinal EHR data improved the accuracy of 10-year CVD risk prediction for early intervention [15,21]. The application of predictive models in identifying patients at high risk of adverse outcomes in clinical practice is becoming increasingly prevalent. In order to provide preventative care that minimizes health disparities, it is crucial that these models produce fair and accurate predictions. Biased predictions can result in some individuals being deprived of the opportunity to receive early interventions or prognoses, which can further exacerbate existing health disparities. Our study had several strengths. We evaluated the bias across a variety of clinical models, including a classic clinical tool (PCE, a non-ML model), ML models, and a deep learning model. We also externally evaluated the PCE and ML models on a nationally represented cohort – All-of-Us and evaluated three debiasing methods. This is one of the first studies to comprehensively examine fairness across demographic subgroups in CVD predictive models and provided a generalizable framework for investigating biases in predictive models for other diseases.
The PCE model and ML models trained with PCE features all had significant bias across race and gender. The bias was in the opposite direction across races, which could be due to the demographic differences between the cohort used in this study and the larger national cohort used to train the PCE model. Notably, all models exhibited larger biases among gender groups, yielding a lower true positive rate and a lower positive prediction rate in the female group than in the male group. These findings were consistent with the results in the external validation using All-of-Us data. ML models trained with additional EHR variables resulted in smaller biases, but the reductions were not consistently statistically significant for all models and metrics. The LSTM deep learning model did not show any improvement in bias across both race and gender.
Removing race or gender information from clinical tools was debatable in the medical field [24,30]. Our findings suggested that excluding gender or race did not significantly change fairness and performance. This, to some extent, contradicted previous studies suggesting that excluding race or gender would lead to less accurate predictions when predicting outcomes such as CVD [25]. A possible explanation is that our models captured predictors correlated to race or gender.
Imbalanced data was a potential reason for biased models [6,7,9]. In our dataset, women were well represented in the cohort, but their proportion of CVD diagnoses was lower than men’s. Our debiasing results showed that resampling data by case proportion reduced the EOD and DI for gender groups while slightly reducing performance for some models. Resampling by sample size didn’t consistently decrease bias, suggesting that resampling needs to be used with caution.
We observed that models exhibit large biases across gender. There could be several reasons. One underlying reason could be a higher missing rate of a few features in women that might cause inaccurate prediction. Another reason was that women are likely to present fewer symptoms [22] or receive fewer cardiac investigations in ambulatory care when experiencing chest pain [23], which could lead to an underestimated risk of cardiovascular disease or underdiagnoses. In addition, the existing models did not include risk factors during women’s pregnancy, such as menopause and adverse pregnancy outcomes, which have been suggested to be associated with long-term CVD [31].
The EOD (Equal Opportunity Difference) and DI (Disparate Impact) are measures of fairness used in machine learning models. The EOD compares the true positive rate between different groups, while the DI compares the positive prediction rate between groups. The specific implementation of these measures may vary depending on the application and which performance metric is most important. Additionally, the ideal fair value for the DI may vary across different racial and ethnic groups, particularly in the context of diseases that have different etiologies in different groups [24].
The limitations of the studies include difficulty in identifying the source of bias in the model, where further investigation would be needed to determine if certain factors that increase women’s risk of CVD, such as adverse pregnancy outcomes, were causing the bias. Additionally, the study only explored pre-processing methods for bias mitigation and lacked data diversity, acknowledging the limited innovation in the approach. Future studies should aim to dig deeper into the source of bias, increase the diversity of the data in the training cohort, and propose new methods for bias mitigation.
5. Conclusion
Our results showed that the ACC/AHA PCEs and machine learning models did not produce equalized predictions on CVD across race and gender groups, with the ML models favoring towards the White and male groups. The bias across gender was found to be larger than that across races. The study also evaluated the effect of three bias mitigation approaches, including removing protected attributes, resampling sample size, and by proportion. The results showed that removing protected attributes had little influence on both bias and accuracy. In addition, the resampling approach was found to be more effective in reducing bias for gender groups where the initial bias was large but less effective for racial groups where the initial bias was small.
Supplementary Material
Funding
The project was supported by the National Institutes of Health (NIH), National Institute of General Medical Studies (P50 GM115305), National Heart, Lung, and Blood Institute (R01 HL133786), National Library of Medicine (T15 LM007450, R01 GM139891), and the American Heart Association (18AMTG34280063), as well as the Vanderbilt Biomedical Informatics Training Program, Vanderbilt Faculty Research Scholar Fund, and the Vanderbilt Medical Scientist Training Program. The datasets used for the analyses described were obtained from Vanderbilt University Medical Center’s resources and the Synthetic Derivative, which are supported by institutional funding and the Vanderbilt National Center for Advancing Translational Science grant (UL1 TR000445) from NCATS/NIH. The funders had no role in study design, data collection, and analysis, decision to publish, or manuscript preparation.
Footnotes
Declaration of Competing Interest
The authors declare that they have no known competing financial interests or personal relationships that could have appeared to influence the work reported in this paper.
Appendix A. Supplementary material
Supplementary data to this article can be found online at https://doi.org/10.1016/j.jbi.2023.104294.
References
- [1].Johnson KB, Wei W, Weeraratne D, Frisse ME, Misulis K, Rhee K, et al. , Precision medicine, AI, and the future of personalized health Care, Clin Transl Sci. 14 (1) (2021) 86–93. [DOI] [PMC free article] [PubMed] [Google Scholar]
- [2].Rajkomar A, Dean J, Kohane I, Machine learning in medicine, N Engl J Med. 380 (14) (2019) 1347–1358. [DOI] [PubMed] [Google Scholar]
- [3].Singh A, Nadkarni G, Gottesman O, Ellis SB, Bottinger EP, Guttag JV, Incorporating temporal EHR data in predictive models for risk stratification of renal function deterioration, J. Biomed. Inform. 53 (2015) 220–228. [DOI] [PMC free article] [PubMed] [Google Scholar]
- [4].Gianfrancesco MA, Tamang S, Yazdany J, Schmajuk G, Potential biases in machine learning algorithms using electronic health record data, JAMA Intern. Med. 178 (11) (2018) 1544–1547. [DOI] [PMC free article] [PubMed] [Google Scholar]
- [5].Obermeyer Z, Powers B, Vogeli C, Mullainathan S, Dissecting racial bias in an algorithm used to manage the health of populations, Sci Am Assoc Adv Sci. 366 (6464) (2019) 447–453. [DOI] [PubMed] [Google Scholar]
- [6].Park Y, Hu J, Singh M, Sylla I, Dankwa-Mullan I, Koski E, et al. , Comparison of methods to reduce bias from clinical prediction models of postpartum depression, J. Am. Med. Assoc.Netw Open. 4 (4) (2021. Apr 15) e213909–e. [DOI] [PMC free article] [PubMed] [Google Scholar]
- [7].Bellamy RKE, Dey K, Hind M, Hoffman SC, Houde S, Kannan K, et al. , AI Fairness 360: an extensible toolkit for detecting and mitigating algorithmic bias, IBM J. Res. Dev. 1 (2019) 15. [Google Scholar]
- [8].Friedler S, Scheidegger C, Venkatasubramanian S, Choudhary S, Hamilton E, Roth D, A comparative study of fairness-enhancing interventions in machine learning. In ACM; 2019. p. 329–3(FAT ‘19). [Google Scholar]
- [9].Rajkomar A, Hardt M, Howell MD, Corrado G, Chin MH, Ensuring fairness in machine learning to advance health equity, Ann. Intern. Med. 169 (12) (2018) 866–872. [DOI] [PMC free article] [PubMed] [Google Scholar]
- [10].McCradden M, Mazwi M, Joshi S, Anderson J, When your only tool is a hammer: ethical limitations of algorithmic fairness solutions in healthcare machine learning. In ACM; 2020. p. 109–109. (AIES ‘20). [DOI] [PubMed] [Google Scholar]
- [11].Fletcher RR, Nakeshimana A, Olubeko O, Addressing fairness, bias, and appropriate use of artificial intelligence and machine learning in global health, Front Artif Intell. 3 (2021) 116. [DOI] [PMC free article] [PubMed] [Google Scholar]
- [12].Goff DC, Lloyd-Jones DM, Bennett G, Coady S, D’Agostino RB, Gibbons R, Greenland P, Lackland DT, Levy D, O’Donnell CJ, Robinson J, Schwartz JS, Shero ST, Smith SC, Sorlie P, et al. , ACC/AHA Guideline on the Assessment of Cardiovascular Risk: A Report of the American College of Cardiology/American Heart Association Task Force on Practice Guidelines. Circulation. 2013;63(25 0 0): 2935–2959. [DOI] [PMC free article] [PubMed] [Google Scholar]
- [13].Virani SS, Alonso A, Aparicio HJ, Benjamin EJ, Bittencourt MS, Callaway CW, et al. , Heart disease and stroke statistics-2021 update: a report from the American heart association, Circ N Y N. 143 (8) (2021) e254–e743. [DOI] [PubMed] [Google Scholar]
- [14].Centers for Disease Control and Prevention. Underlying Cause of Death, 1999–2018 [Internet]. [cited 2020 Mar 12]. Available from: https://wonder.cdc.gov/ucd-icd10.html.
- [15].Zhao J, Feng Q, Wu P, Lupu RA, Wilke RA, Wells QS, et al. , Learning from longitudinal data in electronic health record and genetic data to improve cardiovascular event prediction, Sci. Rep. 9(1) (2019) 717–717. [DOI] [PMC free article] [PubMed] [Google Scholar]
- [16].Gijsberts CM, Groenewegen KA, Hoefer IE, Eijkemans MJ, Asselbergs FW, Anderson TJ, et al. , Race/ethnic differences in the associations of the Framingham risk factors with carotid IMT and cardiovascular events, PLoS One. 10 (7) (2015) e0132321–e. [DOI] [PMC free article] [PubMed] [Google Scholar]
- [17].Wu P, Gifford A, Meng X, Li X, Campbell H, Varley T, et al. Mapping ICD-10 and ICD-10-CM Codes to Phecodes: Workflow Development and Initial Evaluation. 2019. [DOI] [PMC free article] [PubMed] [Google Scholar]
- [18].Mehrabi N, Morstatter F, Saxena N, Lerman K, Galstyan A, A survey on bias and fairness in machine learning, ACM Comput Surv. 54 (6) (2021) 1–35. [Google Scholar]
- [19].Smedley BD, Stith AY, Care C on U and ER and ED in H. Unequal Treatment: Confronting Racial and Ethnic Disparities in Health Care. National Academies Press, Washington, 2002. [PubMed] [Google Scholar]
- [20].Ruopp MD, Perkins NJ, Whitcomb BW, Schisterman EF, Youden index and optimal cut-point estimated from observations affected by a lower limit of detection, Biom J. 50 (3) (2008) 419–430. [DOI] [PMC free article] [PubMed] [Google Scholar]
- [21].Krittanawong C, Virk HUH, Bangalore S, Wang Z, Johnson KW, Pinotti R, et al. , Machine learning prediction in cardiovascular diseases: a meta-analysis, Sci Rep. 10 (1) (2020) 16057. [DOI] [PMC free article] [PubMed] [Google Scholar]
- [22].Martínez-Nadal G, Miró Ò, Matas A, Cepas P, Aldea A, Izquierdo M, et al. , An analysis based on sex&gender in the chest pain unit of an emergency department during the last 12 years, Eur. Heart J. Acute Cardiovasc Care. (2021) 10. [Google Scholar]
- [23].Clerc Liaudat C, Vaucher P, De Francesco T, Jaunin-Stalder N, Herzig L, Verdon F, et al. , Sex/gender bias in the management of chest pain in ambulatory care. Womens Health Lond Engl. 2018;14: 1745506518805641–1745506518805641. [DOI] [PMC free article] [PubMed] [Google Scholar]
- [24].Paulus JK, Kent DM, Predictably unequal: understanding and addressing concerns that algorithmic clinical prediction may increase health disparities, NPJ Digit Med. 3(1) (2020) 99–99. [DOI] [PMC free article] [PubMed] [Google Scholar]
- [25].Steyerberg E, Vickers A, Cook N, Gerds T, Gonen M, Obuchowski N, et al. , Assessing the performance of prediction models: a framework for traditional and novel measures, Epidemiol Camb Mass. 21 (1) (2010) 128–138. [DOI] [PMC free article] [PubMed] [Google Scholar]
- [26].Denny JC, Rutter JL, Goldstein DB, Philippakis A, Smoller JW, Jenkins G, et al. , The all of us research program, N Engl J Med. 381 (7) (2019) 668–676. [DOI] [PMC free article] [PubMed] [Google Scholar]
- [27].Institute of Medicine Committee on Understanding and Eliminating Racial and Ethnic Disparities in Health Care. Unequal Treatment: Confronting Racial and Ethnic Disparities in Health Care. National Academies Press; 2003. [PubMed] [Google Scholar]
- [28].Arnett DK, Blumenthal RS, Albert MA, Buroker AB, Goldberger ZD, Hahn EJ, et al. , 2019 ACC/AHA guideline on the primary prevention of cardiovascular disease: a report of the American College of Cardiology/American Heart Association Task Force on Clinical Practice Guidelines, Circulation 140 (11) (2019. Sep 10) e596–e646. [DOI] [PMC free article] [PubMed] [Google Scholar]
- [29].Afrose S, Song W, Nemeroff CB, Lu C, Yao D (Daphne), Subpopulation-specific machine learning prognosis for underrepresented patients with double prioritized bias correction. Commun. Med. 2(1) (2022) 1–14. [DOI] [PMC free article] [PubMed] [Google Scholar]
- [30].Vyas DA, Eisenstein LG, Jones DS, Hidden in plain sight - reconsidering the use of race correction in clinical algorithms, New England J. Med. 383 (9) (2020) 874–882. [DOI] [PubMed] [Google Scholar]
- [31].O’Kelly AC, Michos ED, Shufelt CL, Vermunt JV, Minissian MB, Quesada O, et al. , Pregnancy and Reproductive Risk Factors for Cardiovascular Disease in Women, Circ. Res. 130 (4) (2022) 652–672. [DOI] [PMC free article] [PubMed] [Google Scholar]
- [32].Landi I, Glicksberg BS, Lee H-C, Cherng S, Landi G, Danieletto M, Dudley JT, Furlanello C, Miotto R, Deep representation learning of electronic health records to unlock patient stratification at scale, NPJ Digit. Med. 3 (1) (2020) 1–11. [DOI] [PMC free article] [PubMed] [Google Scholar]
Associated Data
This section collects any data citations, data availability statements, or supplementary materials included in this article.