


Keywords: acute renal failure, chronic renal failure, clinical nephrology, congestive heart failure, transcriptional profiling, transcription regulation
Abstract
Significance Statement
Understanding the mechanisms underlying adaptive and maladaptive renal repair after AKI and their long-term consequences is critical to kidney health. The authors used lineage tracing of cycling cells and single-nucleus multiomics (profiling transcriptome and chromatin accessibility) after AKI. They demonstrated that AKI triggers a cell-cycle response in most epithelial and nonepithelial kidney cell types. They also showed that maladaptive proinflammatory proximal tubule cells (PTCs) persist until 6 months post-AKI, although they decreased in abundance over time, in part, through cell death. Single-nucleus multiomics of lineage-traced cells revealed regulatory features of adaptive and maladaptive repair. These included activation of cell state–specific transcription factors and cis-regulatory elements, and effects in PTCs even after adaptive repair, weeks after the injury event.
Background
AKI triggers a proliferative response as part of an intrinsic cellular repair program, which can lead to adaptive renal repair, restoring kidney structure and function, or maladaptive repair with the persistence of injured proximal tubule cells (PTCs) and an altered kidney structure. However, the cellular and molecular understanding of these repair programs is limited.
Methods
To examine chromatin and transcriptional responses in the same cell upon ischemia-reperfusion injury (IRI), we combined genetic fate mapping of cycling (Ki67+) cells labeled early after IRI with single-nucleus multiomics—profiling transcriptome and chromatin accessibility in the same nucleus—and generated a dataset of 83,315 nuclei.
Results
AKI triggered a broad cell cycle response preceded by cell type–specific and global transcriptional changes in the nephron, the collecting and vascular systems, and stromal and immune cell types. We observed a heterogeneous population of maladaptive PTCs throughout proximal tubule segments 6 months post-AKI, with a marked loss of maladaptive cells from 4 weeks to 6 months. Gene expression and chromatin accessibility profiling in the same nuclei highlighted differences between adaptive and maladaptive PTCs in the activity of cis-regulatory elements and transcription factors, accompanied by corresponding changes in target gene expression. Adaptive repair was associated with reduced expression of genes encoding transmembrane transport proteins essential to kidney function.
Conclusions
Analysis of genome organization and gene activity with single-cell resolution using lineage tracing and single-nucleus multiomics offers new insight into the regulation of renal injury repair. Weeks to months after mild-to-moderate IRI, maladaptive PTCs persist with an aberrant epigenetic landscape, and PTCs exhibit an altered transcriptional profile even following adaptive repair.
Introduction
AKI, an abrupt decrease in kidney function, affects >20% of hospitalized patients in North America.1 Kidney function fully recovers in some patients, whereas, in others, an initial recovery is followed by progression to CKD.2 Fully understanding the molecular and cellular mechanisms driving both recovery from AKI and progression to CKD is therefore of critical importance.
AKI results in renal tubule cell death, predominantly in proximal tubules (PT), and triggers an intrinsic repair process characterized by dedifferentiation and proliferation of surviving proximal tubule cells (PTCs).3,4 In addition to injury-induced PTC proliferation, clonal expansion in epithelia of distal tubules and the collecting system has been reported.5 The AKI response can lead to adaptive or maladaptive renal repair.6,7 On the tissue and functional level, adaptive repair is defined as normal kidney structure and function, 90 days post-AKI.8 Maladaptive repair describes a process associated with altered renal structure and persistent reduction of kidney function.8 Recent single-cell and single-nucleus RNA-sequencing (snRNA-seq) studies have provided a new resolution to AKI,9–17 allowing for the definition of maladaptive PT repair on the cellular level as a persistent expression of injury markers, such as Havcr1, Krt20, and/or Vcam1, and downregulation of normal PT gene expression. More specifically, snRNA-seq studies identified a maladaptive Vcam1+/Ccl2+ population of failed-repair-PTCs (FR-PTCs) in mouse kidneys weeks after kidney function normalized following bilateral ischemia-reperfusion injury (IRI)9,10; Vcam1+ PTCs persist at least 6 months post-AKI in a unilateral IRI model.15
In addition to snRNA-seq, single-nucleus transposase-accessible chromatin sequencing (snATAC-seq) studies have enhanced our understanding of kidney (patho-) physiology by predicting genomic regulatory features controlling healthy and diseased cell states.12,18–20 However, the epigenetic changes in maladaptive PTCs and the long-term outcome of proliferating reparative cells have not been systematically assessed after AKI. Combining genetic lineage tracing of cells activating a cell-cycle response to AKI with recent technological advances permitting the analysis of chromatin accessibility and transcription in the same cell,12,21 we explored the long-term outcomes of PTCs after AKI.
Methods
Mice, IRI Model, Serum Creatinine Measurement, and Tissue Collection
All surgical procedures, mouse handling, and husbandry were performed according to the guidelines of the Institutional Animal Care and Use Committee at the University of Southern California (protocol numbers 11911 and 20894). Warm renal bilateral IRI was performed as previously described22 on male Ki67cre/ERT2;Isolation of Nuclei TAgged in specific Cell Types (INTACT) mice (Jackson Laboratory: #02980323 and #021039,24 age: 9–13 weeks, weight 24–30 g, Tamoxifen injection on day 2 and 3 post-IRI, dose 0.0375 mg/g); for Ki67INTACT and 5-ethynyl-2′-deoxyuridine (EdU) colabeling experiment: EdU (Sigma-Aldrich, 900584) injection at 2, 2.5, and 3 days post-IRI, dose 0.05 mg/g), Krt20cre/ERT2; INTACT mice (Jackson Laboratory: #03060010 and #021039,24 age: 11–18 weeks, weight 26–32 g, Tamoxifen injection on day 26 and 27 post-IRI, dose 0.05 mg/g) and Slc34a1GCE/+ Rosa26Tdt mice (Jackson Laboratory: #03228525 and #007914,26 age: 12 weeks, weight 26–30 g, Tamoxifen injection on day 7, 5, and 3 before IRI, dose 0.05 mg/g) using a clamping time of 18 minutes. For the Six2GFP-cre, Rosa26tdTomato, and tgHoxb7-Venus strain (Jackson Laboratory: #009606,27 #00791426, and #016252,28 age: 14 weeks, weight 27–34 g), a clamping time of 18.5 minutes was used to validate observations from comparison to a 12-hour post-IRI snRNA-seq dataset.9 For sham surgeries, an identical surgical procedure was performed with no clamping of the renal pedicles. Serum was collected 48-hour post-IRI. Serum creatinine levels were measured by capillary electrophoresis (PA 800 plus Pharmaceutical Analysis System, Beckman Coulter) at the UT Southwestern Medical Center O'Brien Center for Kidney Disease Research. Kidney tissues were collected after organ perfusion with ice-cold Dulbecco's phosphate buffered saline (DPBS [HyClone]). After removal of the kidney capsule, one half of a kidney was flash-frozen in liquid nitrogen, whereas the other was fixed in 4% paraformaldehyde-DPBS for 1 hour at 4°C. Kidneys were then equilibrated overnight in 30% sucrose-DPBS and embedded in O.C.T. compound (Tissue-Tek) in a dry-ice ethanol bath.
Nuclei Isolation, FACS Sorting, and Library Preparation
Nuclei were isolated from flash-frozen kidney tissue and processed for single-cell multiome Assay for Transposase-Accessible Chromatin (ATAC)+gene expression (GEX) sequencing according to the 10× Genomics protocol. All reagents were prepared according to the online protocol. In brief, the tissue of a half kidney was thawed and minced on ice, transferred into NP40 lysis buffer (including Nonidet P40 Substitute, Sigma-Aldrich, 98379), homogenized using a pellet pestle and incubated for 5 minutes on ice. Subsequently, the nuclear suspension was filtered through a 70-µm strainer, the flow through was centrifuged, the supernatant removed, and the pellet incubated with 1% BSA-PBS+1-U/µl Rnase inhibitor (Sigma-Aldrich, 3335402001) for 5 minutes on ice. After centrifugation, the pellet was resuspended in 500-µl 1% BSA-PBS+1 U/µl Rnase Inhibitor supplemented with 5-µl 7-Aminoactinomycin D (7AAD) readymade solution (Sigma-Aldrich, SML1633). Nuclei were sorted according to the gating strategy provided in Supplemental Figure 5 on a cooled BD Aria I with a 100-µm nozzle into BSA-PBS+Rnase inhibitor to achieve a final concentration of 1% BSA-PBS+1-U/µl Rnase inhibitor.
Sorted nuclei were counted on an Invitrogen Countess 3 Automated Cell Counter, concentrated by centrifugation and permeabilized by incubation in 0.1× lysis buffer for 2 minutes on ice. Nuclei were then washed in wash buffer, centrifuged and resuspended in chilled diluted nuclei buffer (10× Genomics, PN-2009153, PN-2000207) targeting a nuclei concentration of 3000–8000/µl. Nuclei were immediately processed according to the 10× Chromium Single Cell Multiome+Gene Expression protocol to prepare an ATAC and a gene expression library from the same nuclei.
Preprocessing and Data Analysis Workflow of Single-Nucleus Multiomics (ATAC+GEX) Data
In total 12 samples from Ki67cre/ERT2, INTACT mice were processed for snRNA-seq+snATAC-seq: FACS-sorted 7AAD+, green fluorescent protein (GFP)+ nuclei from three mice at 4 weeks and four mice at 6 months post-IRI (AKI_GFP+); FACS-sorted 7AAD+, GFP- nuclei from one mouse at 4 weeks and one mouse at 6 months post-IRI (AKI_GFP−); and 7AAD+ nuclei from three control mice. 10× libraries were sequenced using a Illumina NovaSeq 6000 Sequencing System. Sequencing reads were aligned to the mouse genome (mm10) including the INTACT-GFP sequence with the Cell Ranger ARC software (version 2.0.1) using spliced transcripts alignment to a reference aligner29 on the University of Southern California High Performance Cluster. The samples were aggregated using cellranger-arc aggr. See Supplemental Table 2 and Supplemental Figure 6 for details on sequencing depths and quality control metrices. The R packages Seurat30 (version 4.1.0) and Signac31 (version 1.6.0) were used to process the data. SoupX32 was used to remove ambient RNA (with default settings) and DoubletFinder33 was used to remove heterotypic doublets on the basis of the RNA assay of individual samples (assumed doublet rate 10% in samples with <11,000 nuclei, 15% in samples with 11,000–13,000, and 25% in one sample with 16,093 nuclei). The Seurat object containing the RNA and ATAC data for every nucleus was filtered to keep only nuclei that fulfilled the following quality control criteria: genes/cell >350 and <3500, RNA count >500 and <8000, percent mitochondrial genes <1, percent ribosomal genes <3, ATAC count >1000 and <100,000, transcriptional start site enrichment score calculated by transcriptional start site enrichment score() >2, and nucleosome signal calculated by NucleosomeSignal()<3. The RNA data were normalized and scaled using the NormalizeData() and ScaleData() functions in Seurat and variable features identified with FindVariableFeatures(); the ATAC data were normalized using the RunTFIDF (Run term frequency inverse document frequency)() function in Signac. Batch effects in the RNA and ATAC data were corrected separately using the run term frequency inverse document frequency function.34 The function FindMultiModalNeighbors()30 was used to calculate a weighted combination of the RNA and the ATAC data on the basis of the principle component analysis (RunPCA()) of the RNA assay and a singular value decomposition analysis (RunSVD()) of the ATAC assay, dimensionality reduction was performed using RunUMAP(), and clusters identified using FindClusters() (resolution 0.8). Cluster identities were assigned using expression of known marker genes. Two clusters containing remaining heterotypic doublets on the basis of coexpression of marker genes for different cell types and one cluster containing <10 nuclei were removed for further analyses. The final Seurat object contained 83,315 nuclei. Differentially expressed genes between clusters were determined using the FindAllMarkers() function with a Wilcoxon Rank Sum test for transcripts present in at least 10% of cells with an absolute log2-fold-change (log2FC) threshold of 0.25. A Bonferroni adjusted P-value (Padj)<0.01 was considered statistically significant. For analysis of differentially accessible regions (DARs) and motif enrichment analysis peaks were called using Model-based Analysis of ChIP-Seq 235 with the CallPeaks() function in Signac on each cluster divided by group (AKI_GFP+, AKI_GFP−, and control). Cell type–specific peaks were visualized using the CoveragePlot() function. AKI_GFP+ were compared with control nuclei in a cluster-specific analysis by subsetting each cluster and running FindMarkers() with ident.1=“AKI_GFP+” and ident.2=“control” on the RNA assay (test.use=“wilcox”, min.pct=0.1, |avg_log2FC|≥0.25, Padj<0.01) and the ATAC assay (test.use=“LR” (LR = logistic regression), min.pct=0.05, |avg_log2FC|≥0.1, Padj<0.01). Differentially expressed genes and DARs were visualized using the UpSetR36 package. Gene ontology analysis was performed using ClusterProfiler.37
Subclustering Analysis
AKI_GFP+ PTC and thin descending limb of the loop of Henle (LOH-TL) clusters were subsetted using the subset() function. The new Seurat object was processed as described above. Using the FindClusters() function (resolution of 0.5), four PT clusters, one injured PT cluster and two LOH-TL clusters were identified and one small cluster containing residual heterotypic doublets and one PT cluster containing lower quality nuclei. The latter two clusters were removed for further analysis. To enhance the resolution of the injured PT cluster, the FindSubCluster() function (resolution 0.2) was used on the identified injured PT cluster resulting in three injured PT subclusters. Differentially expressed genes were determined using the FindAllMarkers() function for transcripts present in at least 10% of cells (|avg_log2FC|≥0.25, Padj<0.01). Pathway enrichment analysis for up- and downregulated genes in FR-PTCs was performed using ToppFun (https://toppgene.cchmc.org/enrichment.jsp). DARs were determined using the FindAllMarkers() function with a likelihood ratio test for peaks in at least 5% of cells (|avg_log2FC|≥0.25, Padj<0.01). DARs were annotated using the R package ChiPseeker.38 Correlation of gene expression with closeby peaks was calculated using LinkPeaks() in Signac after computing the GC content for each peak with RegionStats() on the basis of BSgenome.Mmusculus.UCSC.mm10.
Transcription Factor Motif Analysis
Transcription factor (TF) motif activity was calculated using the R package chromVAR39 (version 1.14.0) and the JASPER202040 database with RunChromVAR() in Signac. Differential TF motif activity was determined with a likelihood ratio test using the FindAllMarkers() function, setting mean.fx=rowMeans, and fc.name=“motif.avg_diff.” (threshold |motif.avg_diff.|≥0.1, Padj<0.01). The list of differentially active TFs between PT and LOH-TL clusters was filtered by retaining only the TFs that were also differentially expressed in the same cell type (Supplemental Table 7). The difference in motif activity (motif_avg_diff.) and the difference in gene expression (GEX_avg_log2FC) between clusters for a given TF were multiplied to calculate a Motif_GEX_score, TFs were ranked on the basis of the Motif_GEX_score, and average motif activity and gene expression of the top 10 TFs per cell type were visualized using pheatmap41 version 1.0.12 (Figure 5, C and D). Between cluster differences in gene expression of a TF (log2FC) and TF chromVAR motif activity (deviation score) were correlated using code adapted from Muto et al.20 Footprint analysis for selected TFs was performed using the Footprint() function in Signac with genome=BSgenome.Mmusculus.UCSC.mm10 genome. The position weight matrix for the footprint analysis was extracted from the JASPER202040 database using the R package TFBSTools.42
Figure 5.

Chromatin accessibility and TF activity define adaptive and maladaptive proximal tubule cell states. (A) Heatmaps of average fragment counts within DAR in promotor regions (defined as transcription start site [TSS] ±1000 bp) or distal intergenic regions. Clusters correspond to Figure 4A. (B) Coverage plots around the Vcam1 locus are shown. DARs between the clusters identified in Figure 4A are highlighted in gray. DARs that correlate with Vcam1 gene expression in the same cluster are shown as arcs linking the DAR to the TSS of Vcam1. The intensity of the blue indicates the correlation coefficient (score). (C) Heatmap showing the average chromVAR motif activity per cluster. Only the top TF motifs with differential activity on the basis of the chromVAR analysis and differential expression on the basis of the RNA assay are shown. (D) Heatmap showing the average expression of the genes encoding the TFs for which differential motif activity was found between clusters (shown in panel C). DARs, differentially accessible regions; TF, transcription factor.
Gene Regulatory Network
DoRothEA,43,44 a highly curated TF-target gene database, was used to extract high-confidence TF-target gene interaction (confidence level A). The list of TFs and target genes was filtered to retain only the top ten differentially active motifs per cluster (Figure 5C) with high confidence information on TF-target gene interactions and the target genes that were differentially expressed between clusters as identified in Figure 4A. TF-target gene interactions were visualized on a network using Gephi45 0.9.4. Clusters were pooled in four categories for this analysis: PT-S1/S2/S3, injured PTS1-S2/injured PTS3, FR-PTC, and LOH-TL. The nodes of the network were colored by the z-score of the average expression of the represented genes across the four categories.
Figure 4.

Ki67-lineage-traced injured PTCs are heterogeneous and decrease in abundance in time post-AKI. (A) Subclustering of the AKI_GFP+ proximal tubule and thin limb of the loop of Henle clusters highlighted in Figure 3B. FR-PTC, failed-repair PTCs, remaining abbreviations as in Figure 3B. (B) Dot plot of marker genes arranged by cell type and stacked bar plot showing the composition of clusters by group normalized for the total cell number in each group. (C) Colocalization of GFP reporter with the proximal tubule marker Megalin only, indicating adaptive repair, or the injury markers Vcam1 and Havcr1, indicating failed repair at 4 weeks and 6 months post-IRI. Scale bar 10 μm. (D) Experimental setup to assess, if cell death contributes to the decrease of FR-PTCs in time post-AKI. (E) Colocalization of the Krt20INTACT GFP reporter with the injury marker Vcam1 in PTCs that have lower Megalin expression than surrounding cells at 4 weeks and 6 months post-IRI. At 6 months post-IRI some Krt20INTACT GFP+/Vcam1-PTCs are found. Scale bar 50 μm. (F) Quantification of the number of Krt20INTACT GFP+, Vcam1+ nuclei at 4 weeks (n=5) and 6 months (n=4) post-IRI. Bar plot shows the mean, error bars indicate the standard deviation. **P<0.001. PTCs, proximal tubule cells.
Analysis of Published snRNA-seq Dataset
The Seurat object containing snRNA-seq data of mouse kidneys collected at different time points post-IRI was kindly provided by Humphreys Laboratory.9 A cluster-specific comparison of 12-hour post-IRI with control data were performed by subsetting each cluster using the subset() function and then identifying differentially expressed genes using FindMarkers() in Seurat for all transcripts present in at least 5% of cells; the average expression values of the identified genes for the control and 12-hour post-IRI nuclei in each cluster were determined using the AverageExpression() function. The macula densa cluster was excluded from this analysis since it comprised <30 nuclei per time point. Weighted correlation network analysis (WGCNA) was performed using the WGCNA R package46 on all identified upregulated genes (avg_log2FC ≥0.25, Padj <0.01) and all identified downregulated genes (avg_log2FC ≤−0.25, Padj<0.01) separately. The blockwiseModules() function was used to identify modules of coexpressed genes. The soft threshold power was set to 7, the minimum module size to 20 genes, and the mergeCutHeight parameter to 0.25. To determine, if the identified downregulated genes were cell type–specific marker genes, the top 20 differentially expressed genes between clusters in the control data were defined as marker gene sets and a gene set enrichment analysis of these marker gene sets among the downregulated genes in each cluster was performed using a Fisher's exact test with Benjamini–Hochberg correction for multiple testing. To assess long-term transcriptional changes in PT segment 3, the PT segment 3 cluster was subsetted and 6 weeks post-IRI nuclei compared with controls using the FindMarkers() function.
Immunofluorescence, RNAscope, Histology, and Microscopy
The O.C.T. embedded kidney tissue was sectioned as previously described22; sections were equilibrated at room temperature, washed in PBS+0.25% Triton X-100 (PBS-T), blocked with 1.5% sea block (ThermoFisher, 37527) in PBS-T and incubated in primary antibody overnight at 4°C. Subsequently, sections were washed and incubated for 1 hour in Alexa Fluor secondary antibodies at room temperature, washed again and stained with Hoechst 33342 (Life Technologies, H3570) before mounting with Prolong Gold (Invitrogen). RNAscope experiments were performed according to the Manufacturer's Protocol (advanced cell diagnostics 323100-USM, section fixed frozen tissues) with TSA Plus fluorophores (1:1000, Life Technologies). For subsequent immunofluorescence, staining sections were blocked, antibodies were diluted in tris-buffered saline-1% BSA 1.5% sea block, and washes were performed with tris-buffered salone with Tween-20. The following antibodies and probes were used in this study: chicken anti-GFP (1:500, Aves Labs, GFP-1020), mouse IgG1 anti-Lrp2 (1:100, Santa Cruz, sc-515772), rabbit anti-Aqp1 (1:100, Abcam, ab168387), rabbit anti-Atp6v1b1 (1:300, Abcam, ab192612), mouse IgG1 anti-Aqp2 (1:500, Santa Cruz, sc-515770), rabbit anti-Slc12a3 (1:500, Sigma-Aldrich, HPA028748), goat anti-Slc12a1 (1:500, Abcam, ab240542), goat anti-Cd45 (1:1000, R&D Systems, AF114), mouse IgG2a anti-alpha Smooth Muscle Actin (aSMA, 1:2000, Sigma-Aldrich, A5228), rat IgG2a anti-Plvap (1:200, BioRad, MCA2539), rat IgG2a anti-Cd31 (1:750, BD Pharmingen, 553370), rabbit anti-Sox9 (1:1000, Abcam, ab185230), mouse IgG1 anti-pStat3 (Tyr 705) (1:100, Cell signaling, 4113, with antigen retrieval using citrate buffer [Sigma-Aldich, C9999]), goat anti-tdTomato (1:2000, Sicgen, AB8181-200), goat anti-Megalin (1:500, Santa Cruz, sc-16478), goat anti-Havcr1 (1:500, R&D Systems, MAB1817), rabbit anti-Vcam1 (1:500, Abcam, ab134047), goat anti-nNos1 (1:500, Novus Biologicals, NB100-858), rabbit anti-Wt1 (1:500, Abcam, ab89901), rabbit anti-Ki67 (1:200, Vector Laboratories, VP-RM04), lotus tetragonolobus lectin-FITC conjugate (1:100, Vector Labs, FL-1321), donkey anti-chicken AlexaFluor 488 (1:500, Jackson Immuno Research, 703-545-155), donkey anti-goat AlexaFluor 555 (1:500, Invitrogen, A21432), goat anti-rat IgG (H+L) AlexaFluor 555 (1:500, Invitrogen, A21434), donkey anti-rabbit AlexaFluor 594 (1:500, Molecular probes, A21207), donkey anti-rabbit AlexaFluor 647 (1:500, Life Technologies, A31573), donkey anti-goat AlexaFlour 555 (1:500, Invitrogen, A21432), donkey anti-goat AlexaFlour 594 (1:500, Life Technologies, A11058), donkey anti-rabbit AlexaFluor 555 (1:500, Abcam, ab150074), rat anti-mouse IgG1 AlexaFluor 647 (1:500, BioLegend, 406618), rat anti-mouse IgG2a AlexaFluor 647 (1:500, BioLegend, 407116), RNAscope Probe-Mm-Maf (412951), RNAscope Probe-Mm-Pou3f3 (441521-C2), RNAscope Probe-Mm-Slc34a1 (428141-C3), RNAscope Probe-Mm-EGFP-04 (538851-C2), RNAscope Probe-Mm-Klf6 (426901), RNAscope Probe-Mm-Aadat (422121), RNAscope Probe-Mm-Gclc (547721-C3). Kidney sections from EdU-injected mice were analyzed using the Click-iT Plus EdU Alexa Fluor 594 Imaging Kit (ThermoFisher, C10639). H&E staining was performed on frozen sections at the University of Southern California Histology Laboratory. Masson's trichrome staining was performed at the University of Southern California Norris Cancer Center Translational Pathology Core Facility. Images were acquired on Zeiss Axio Scan Z1 slide scanner and Leica Sp8. Image quantification was performed using Fiji.47
Statistics
Data were represented as median in Figure 1B and as mean with standard deviation in Figure 4F, Supplemental Figures 13B and 14B. Individual data points are also shown. Values in Figures 1B and 4F and Supplemental Figures 13B and 14B were compared in GraphPad Prism version 9.2.0 using an unpaired two-tailed Student's t-test if the normality assumption was met, or a Mann-Whitney test if the data were not normally distributed.
Figure 1.

Ki67-lineage tracing shows broad cell-cycle response to AKI. (A) Experimental setup. (B) Serum creatinine values in control mice, 48 hours, 4 weeks, and 6 months after ischemia-reperfusion injury (IRI). The horizontal line indicates the median. ***P<0.001. (C) Colocalization of GFP reporter with markers for proximal tubule (Lrp2), thin descending limb of the loop of Henle (Aqp1), thick ascending limb of the loop of Henle (Slc12a1), distal tubule (Slc12a3), principal cells (Aqp2), and intercalated cells (Atp6v1b1). (D) Mice were injected with Tamoxifen at day 2 and 3 post-IRI to induce nuclear membrane GFP-labeling of Ki67-expressing cells. 5-ethynyl-2′-deoxyuridine (EdU) was injected at day 2, 2.5 and 3 post-IRI to label cells in the S-phase of the cell cycle. Kidneys were collected at day 7 post-IRI for immunofluorescence staining. Colocalization of GFP reporter with EdU, Atp6v1b1, and Aqp2. All scale bars 25 μm. Tam., Tamoxifen.
Data Availability
All sequencing data have been deposited in the Gene Expression Omnibus (GEO) database (accession number GSE209610). Gene expression, chromatin accessibility, and transcription factor motif activity can be viewed on this interactive website: https://humphreyslab.com/SingleCell/.
Code Availability
The analysis code is available on GitHub (https://github.com/lmsgerhardt/Gerhardt_JASN_2022).
Results
Most Kidney Cell Types Enter the Cell Cycle in Response to AKI
Mki67 is specifically expressed in cycling cells.48,49 Crossing Ki67cre/ERT2 mice23 to the Gt(ROSA)26Sortm5(CAG-Sun1/sfGFP)Nat) INTACT (Isolation of Nuclei TAgged in specific Cell Types) reporter line24,50 enables Tamoxifen-dependent, GFP-labeling of the nuclear membrane in Ki67+ cycling cells. We performed bilateral IRI on Ki67cre/ERT2; INTACT mice as previously established.10,22 Tamoxifen injection on days 2 and 3 post-IRI, coinciding with the time of maximum cell-cycle entry in response to IRI, enabled GFP-labeling and fate-tracking of cycling cells from the onset of renal repair (Figure 1A). See Supplemental Text for characterization of the system using EdU-colabeling and Ki67-antibody staining.
A mild-to-moderate IRI was associated with fibrotic changes, restored kidney function (measuring serum creatinine), and, in contrast to more severe injury models,22 no extensive cyst formation 6 months post-IRI (Figure 1B, Supplemental Figure 2). Immunofluorescence staining at 4 weeks revealed historical evidence of widespread IRI-invoked cell-cycle entry: Ki67INTACT-GFP-labeled cells were present throughout the epithelial nephron and collecting system, and within endothelial, interstitial, and immune cell types (Figure 1C, Supplemental Figure 3A). In contrast, Wt1+ podocytes and Nos1+ macula densa cells were only rarely labeled. EdU-labeling of cells undergoing DNA-replication provided additional evidence that Ki67INTACT-GFP+ cells included actively dividing cells in the S-phase of the cell cycle (Figure 1D, Supplemental Figure 3, B and C). Analysis of snRNA-seq data collected at different time points post-IRI9 corroborated these findings: Mki67 was upregulated 2 days post-AKI in all identified cell types, except for podocytes and macula densa cells (Supplemental Figure 3D).
The Early Transcriptional Response to AKI Is Partially Conserved across Cell Types
The broad upregulation of Mki67 at day 2 post-AKI raises the question if AKI triggers a similar transcriptional response across kidney epithelial cell types preceding cell-cycle entry. To address this question, we compared kidney snRNA-seq data collected 12 hours post-IRI with control data in each cell type (Supplemental Table 1).9
WGCNA on genes downregulated 12 hours post-AKI predominantly identified cell type–specific modules (Figure 2A). Enrichment analysis of cell type–specific marker gene sets among all downregulated genes per cell type showed that most kidney cell types downregulated expression of key genes indicative of cell type and/or cell function in response to AKI (Figure 2B).
Figure 2.

The immediate-early transcriptional response to AKI is partially conserved across kidney cell types. (A) Heatmaps showing downregulated (left) and upregulated (right) genes identified in a per cell type comparison of 12 hours post-IRI kidney snRNA-seq with control data from Kirita et al.9 Genes are arranged in the gene modules identified by weighted correlation network analysis. Control samples are shown in the upper, 12 hours post-IRI samples in the lower part of the heatmap. The black box highlights the module containing genes upregulated across most kidney cell types (Module 4). CNT, connecting tubule; CTAL, tick ascending limb of the loop of Henle in cortex; DCT, distal convoluted tubule; DTL-ATL, thin descending and thin ascending limb of the loop of Henle; EC, endothelial cells; Fib, fibroblasts; ICA, type A intercalated cell; ICB, type B intercalated cell; Mø, macrophages; MTAL, tick ascending limb of the loop of Henle in medulla; NewPT1, Havcr1+ injured proximal tubule cluster; NewPT2, Vcam1+ injured proximal tubule cluster; PC, principal cell; PEC, parietal epithelial cells; Per, pericytes; Pod, podocytes; PTS1, proximal tubule segment 1; PTS2, proximal tubule segment 2; PTS3, proximal tubule segment 3; Uro, urothelium. (B) Bar plot showing gene set enrichment analysis of cell type–specific marker genes among genes that are downregulated at 12 hours post-IRI (Figure 2, panel A). Marker genes are defined as the top 20 differentially expressed genes between cell types in the control samples. (C) and (D) IRI was performed on Six2GFP-cre; Rosa26tdTomato; tgHoxb7-Venus mice, in which cells of nephron progenitor origin are labeled with Tdt and all cells of ureteric progenitor origin are labeled with Venus. Kidneys were collected 12 hours post-IRI. Immunofluorescence staining showing colocalization of Sox9 and pStat3 (Tyr705) with Tdt and Venus, respectively. Scale bar 50 μm.
WGCNA of genes differentially upregulated in at least one cell type 12 hours post-IRI, showed both cell type–specific and global gene expression changes (Figure 2A). The PT-specific module 1 comprised most differentially expressed genes, including known injury markers (Havcr1, Krt20), but also genes encoding heat shock proteins and immediate-early response factors. Module 2, most strongly activated in fibroblast-like cells, contained genes encoding growth factors (Ngf, Fgf2, Csf1), cytokines (Il6, Il11, Crlf1), extracellular matrix proteins (Col4a1, Col4a2, Col8a1), integrins (Itgb1, Itga5), and members of the ADAMs (A Disintegrin And Metalloproteinases) family of proteases (Adam19, Adam12, Adamts2). Thus, activated fibroblasts present within hours of IRI likely contribute to the early injury response through paracrine secretion of growth factors and cytokines.
Interestingly, Module 4 (highlighted by a box in Figure 2A) showed broad upregulation of a gene set across multiple renal epithelial cell types, endothelial cells, and fibroblasts. This module included Eda2r, encoding tumor necrosis factor receptor superfamily member 27, thrombopoietin receptor Mpl, leukemia inhibitory factor Lif, pyruvate dehydrogenase kinase-4 Pdk4, vacuole membrane protein-1 (Vmp1), which triggers autophagy in mammalian cells, and several transcriptional regulators including Nfil3 and Sox9 and signal transducer and transcription activator-3 (Stat3) (Supplemental Figure 4).51 Stat3 was reported to be involved in CKD progression, whereas Sox9 is an important player in renal repair.52-54 The predicted broad upregulation of Sox9 and Stat3 in the nephron and ureteric lineages was validated by immunofluorescence in a dual lineage reporter strain (Figure 2, C and D).
Combined snRNA- and snATAC-Sequencing of Ki67-Lineage-Traced Cells Post-AKI
To assess the long-term outcome and regulatory state of cells that entered the cell cycle early after AKI, Mki67+ cells were labeled by Tamoxifen injection into Ki67cre/ERT2; INTACT mice 2 and 3 days post-IRI. GFP+ and GFP- nuclei were isolated by fluorescence-activated cell sorting 4 weeks (n=3) or 6 months (n=4) post-IRI and combined snRNA- and snATAC-seq was performed (Figure 3A, Supplemental Figure 5). Sham-operated (n=2) and nonsurgery (n=1) Ki67cre/ERT2; INTACT mice were used as controls.
Figure 3.
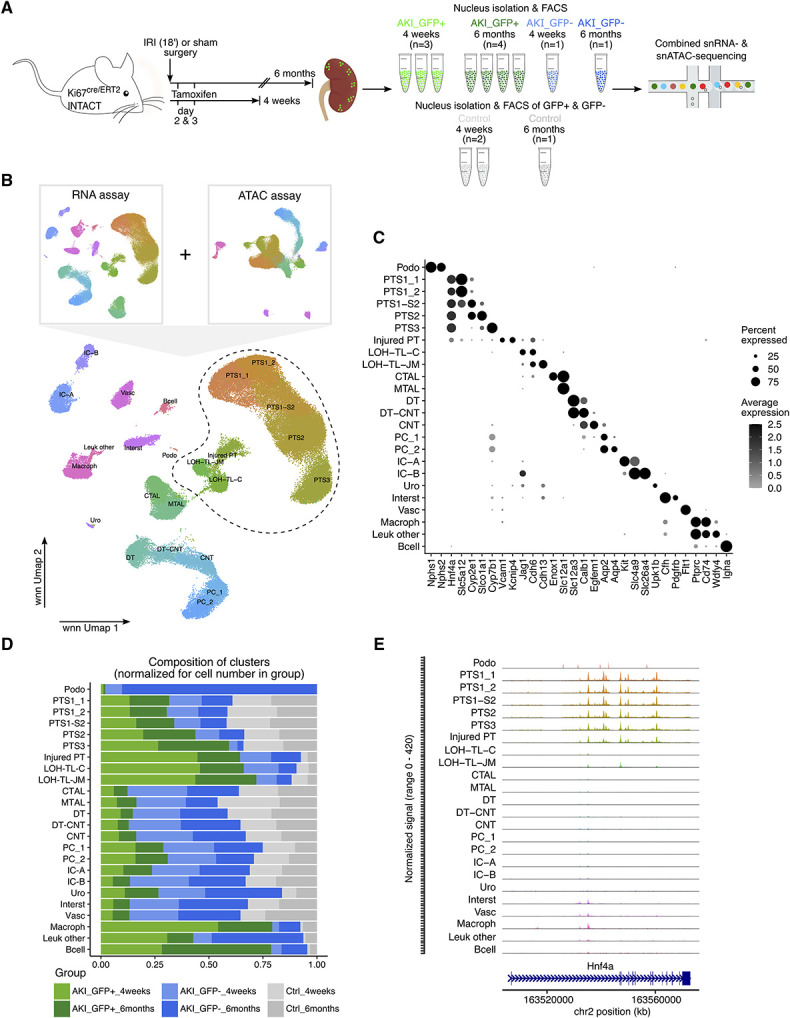
Single-nucleus multiomics (RNA+ATAC) of Ki67-lineage-traced cells to profile the long-term response to AKI. (A) Experimental setup. FACS, fluorescence-activated cell sorting. (B) Umap plots of the integrated AKI_GFP+, AKI_GFP−, and control samples showing the unsupervised clustering on the basis of RNA data only, ATAC data only, and both RNA and ATAC data combined using a weighted nearest neighbor (wnn) analysis. DT, distal tubule; injured PT, injured proximal tubule; Interst, interstitital cells; Leuk, leukocytes; LOH-TL-C, loop of Henle thin limb of cortical nephron; LOH-TL-JM, loop of Henle thin limb of juxtamedullary nephron; Macroph, macrophages; Podo, podocytes; Vasc, vascular cells, remaining abbreviations as in Figure 2A. (C) Dot plot of marker genes arranged by cell type. (D) Stacked bar plot showing the composition of clusters by group normalized for the total cell number in each group. (E) Coverage plots of the Hnf4a gene body are shown for all cell types identified in panel (B).
After quality control filtering, doublet removal, and sample integration using the Harmony algorithm within Seurat and Signac,30,31,34 unsupervised clustering resolved 24 high-quality clusters comprising 43,751 GFP+ (AKI_GFP+) and 15,858 GFP− nuclei (AKI_GFP−) from AKI samples and 23,706 nuclei from control samples, identifying all major kidney cell types, except parietal epithelial cells (Figure 3, B and C, Supplemental Table 3, see Methods for details). As predicted, AKI_GFP+ nuclei comprised a significant fraction of all but the podocyte cluster although the labeling frequency varied widely between cell types (Figure 3D). The highest percentage of AKI_GFP+ cells was observed within PTC, LOH-TL, and immune cell clusters. In addition, we identified one injured PTC cluster, characterized by reduced expression of Hnf4a, a key TF involved in PT differentiation,55 and increased expression of Vcam1 and Kcnip4, genes previously indicative of injured PTCs.9,10 In agreement with the gene expression profile, chromatin accessibility within the Hnf4a gene body was markedly reduced in injured compared to normal PTCs (Figure 3E).
Ki67-Lineage-Traced Injured Proximal Tubule Cells Are Heterogeneous and Numbers Decrease over the Long-Term Post-AKI
The subsequent analysis focused on AKI_GFP+ PTCs and LOH-TL cells. Subclustering AKI_GFP+ PTC and LOH-TL clusters (highlighted by a dotted line in Figure 3B; see Methods for details) yielded four PTC clusters with normal PT expression profiles suggesting completed adaptive repair, two LOH-TL clusters, and three injured PT clusters (Supplemental Table 4). Marker gene analysis suggested that injured PTCs are derived from all PT segments: the injured PTS1-S2 cluster showed weak expression of segment 1 and 2 marker gene Slc34a1, whereas the injured PTS3 cluster expressed both Cyp7b1, a male-specific, and Slc7a12, a female-enriched PTS3 gene previously reported as upregulated in less severely injured or repairing PTCs in male kidneys (Figure 4B).10,56 The third injured PT cluster resembled FR-PTCs9,10 characterized by low Hnf4a expression, expression of Havcr1, Krt20 and Ccl2, and the strongest Vcam1 expression. The majority of FR-PTCs were isolated from 4 weeks samples indicating a loss of FR-PTCs by 6 months post-AKI.
The presence of Ki67INTACT-GFP-labeled Vcam1+, Havcr1+ PTCs at both time points was validated by immunofluorescence staining (Figure 4C). Because injured PTCs show little or no expression of PT segment-specific marker genes, we used Slc34a1GCE/+Rosa26Tdt mice to label PTS1/S2 before surgery and validated the presence of Vcam1+, Havcr1+ PTCs within Tdt+ PTS1/S2 and adjoining Tdt− PTS3 cells (Supplemental Figure 7). To independently assess if cell death contributes to the decrease of FR-PTCs in time post-AKI, we genetically labeled cells expressing the injury marker Krt2022 at day 26 and 27 post-AKI and traced these cells to either 4 weeks or 6 months post-AKI (Figure 4, D–F). Quantification of the total number of Krt20INTACT-GFP+, Vcam1+ cells at 4 weeks and 6 months showed a 90% decrease over this period, indicating that the observed loss of FR-PTCs at 6 months is, at least in part, attributable to cell death.
Chromatin Accessibility and Transcription Factor Activity Define Proximal Tubule Cell States
To examine chromatin organization, we identified 13,753 unique differentially accessible open chromatin regions (DARs) between PT and LOH-TL subclusters using Signac (Supplemental Table 5). On average, 13.9% of DARs were located within promotor and 36.9% in distal intergenic regions (Figure 5A, Supplemental Figure 8A). Most DARs localized to FR-PTCs consistent with a role for enhancer regulatory elements controlling the distinct gene activity that defines FR-PTCs, highlighting the importance of epigenetic regulatory control of the FR-PTC phenotype. The combined snRNA- and snATAC-seq dataset allowed for the correlation of chromatin accessibility with an expression of nearby genes identifying putative enhancers of the injury response for the cell type identifiers Vcam1 and Ccl2 (Figure 5B, Supplemental Figure 8B).
As TF activity determines transcriptional cell states, we set out to infer TF activity scoring for the presence of TF binding motifs in open chromatin regions using chromVAR39 and identifying differentially active TF motifs between cell types. The simultaneous acquisition of chromatin accessibility and gene expression data from the same nucleus allowed us to test if motif activity of differentially active TF motifs (deviation score) correlated with TF gene expression changes (log2-fold-change) in that cell type (Supplemental Figure 8C). Considering only those TFs with differential motif activity and gene expression between clusters, we observed a positive correlation in 20%, a negative correlation in 8%, potentially reflecting repressive gene silencing, and no correlation in the remainder.
Focusing on TFs with significantly increased motif activity and gene expression, TFs, which likely play a regulatory role in defining the identified cell states (Figure 5, C and D), predicted Hnf4a activity across all adaptive PT segments and reduced activity in injured PT clusters, as expected. The TF Maf showed high motif activity and gene expression in PTS1/S2 and injured PTS1-S2 compared to PTS3, suggesting a potential role for Maf in defining PTS1/S2 identity (Figures 5, C and D and 6, A and B). Interestingly, a reduction of PTC volume has been reported in Maf knock-out mice although PT segment identities were not examined in the mutant.57 In adaptive PTS2/S3, the activity of several hormone receptors was predicted to be enhanced, including Thrb (thyroid hormone receptor beta), Ar (androgen receptor), Esr1 (estrogen receptor-1), Vdr (vitamin D3 receptor), and the circadian-clocked controlled PARbZip TF Tef (thyrotroph embryonic factor).58 Developmental studies have linked Pou3f3 to distal nephron development.59 A stronger Pou3f3 activity was predicted in PTS2/S3 relative to PTS1 and confirmed by RNAscope (Figure 6, A and C), consistent with the potential contribution of Pou3f3 to diversification of PT segment fates. Validation studies showed downregulation of Hnf4a and Maf in maladaptive Ki67INTACT-GFP+, Vcam1+ PTCs compared to adaptive Ki67INTACT-GFP+, Vcam1− PTCs (Figure 6D).
Figure 6.

Validation of identified transcription factors in adaptive and maladaptive proximal tubule cells. (A–C) RNAscope (Slc34a1, Maf, Pou3f3) and immunofluorescence staining (Hnf4a) show strong expression of Maf in PT segment 1 and 2 (Hnf4a+, Slc34a1+), whereas Pou3f3 is increasingly activated distal of PT segment 1. ISOM, inner stripe of outer medulla; OSOM, outer stripe of outer medulla. (D) Maf and Hnf4a are downregulated in maladaptive PTCs (Ki67INTACT-GFP+, Vcam1+, red arrowhead) compared to adjacent adaptive PTCs (Ki67INTACT-GFP+, Vcam1−, white arrowhead). RNAscope (Klf6) and immunofluorescence show upregulation of Creb5 (E) and Klf6 (F) in maladaptive (Ki67INTACT-GFP+, Vcam1+, red arrowhead) compared to adjacent adaptive (Ki67INTACT-GFP+, Vcam1−, white arrowhead) PTCs. Scale bar in (A) 50 μm and in (B–F) 25 μm.
Interestingly, TF activity patterns were similar between injured PT clusters, particularly FR-PTCs, and LOH-TL clusters (Figure 5, C and D). The most differentially expressed TFs with increased motif activity in FR-PTCs were members of the NF-κB (Nfkb1, Nfkb2, Rela, Relb) and the activator protein-1 (Jun, Junb, Jund, Fosl2) family, Rbpj, Runx1, Creb5, and Klf6. Rbpj is an effector of Notch signaling but acts as a repressor in the absence of active Notch signaling.60,61 Runx1 (Runt-related TF 1) has been reported as upregulated in PTCs after unilateral ureteral obstruction (UUO) and repeated low-dose cisplatin treatment.62,63 Runx1 deletion reduced fibrosis in UUO and folic acid-induced nephropathy.64 Creb5 (cyclic AMP-responsive element-binding protein 5) encodes a transcriptional activator associated with the development and progression of different cancers65,66 and epithelial-to-mesenchymal transition of cancer cells in vitro.67 The zinc-finger protein Klf6 (Krüppel-like factor-6) is upregulated early after ischemic AKI in mice68 and humans,69 following UUO63 and in diabetic nephropathy,70 and has been associated with diverse functions in renal disease: Klf6 is associated with Tgfb1 induction in renal epithelial cells in vitro,68 acts as NF-κB coactivator,71 promoting the inflammatory response to AKI, and reduces expression of genes encoding branched-chain amino acid (BCAA) catabolic enzymes early after injury thus exacerbating kidney injury and fibrosis in aristocholic acid-I-induced AKI.72 In line with this observation, several metabolism-related pathways including “fatty acid, triacylglycerol, and ketone metabolism” and “BCAA catabolism” were downregulated in FR-PTCs, whereas pathways related to inflammation, cell adhesion, cytoskeleton, and cancer were enriched (Supplemental Table 6). Expression of both BCAA72 and fatty acid metabolism73-related genes was lower in all injured PT clusters compared to PTS1/S2/S3, indicating a persistently altered metabolic state in maladaptive PTCs months post-AKI, potentially in part mediated by Klf6 induction (Supplemental Figure 8D). The upregulation of Klf6 and Creb5 in maladaptive (Ki67INTACT-GFP+, Vcam1+) compared to adaptive (Ki67INTACT-GFP+, Vcam1−) PTCs was validated using immunofluorescence and RNAscope (Figure 6, E and F).
We also observed a predicted increase in motif activity and gene expression for several other novel TFs, including Ets2, a proto-oncoprotein reported to be upregulated after UUO and implicated in mediating expression of pro-fibrotic genes in PTCs in vitro74; Elf2, an interaction partner of Runx175; the proto-oncoprotein Zbtb7c; and, the myocyte enhancer factor 2A (Mef2a) (Supplemental Table 7).
To assess if changes in TF activity were associated with corresponding gene expression changes, we used a highly curated TF-target gene database considering only TF-target interactions with the highest confidence information.43,44 Downregulation of Hnf4a in injured PTCs was associated with reduced expression of many, but not all Hnf4a target genes (e.g., Pck1, G6pc, and Hnf1a), whereas upregulation of Nfkb1 and Rela was associated with increased expression of many high confidence Nfkb1 and Rela target genes (Supplemental Figure 9, Supplemental Table 8). Finally, TF footprint analysis confirmed reduced binding of Hnf4a and increased binding of Nfkb1 and Rela in FR-PTCs (Supplemental Figure 10).
AKI Alters the Transcriptional State of AKI_GFP+Proximal Tubule Cells Weeks to Months after the Injury Event
To determine if cells that underwent replication in response to injury show the same transcriptional profile as cells in uninjured kidneys, we performed a cell type–specific comparison of AKI_GFP+ and control cells (Figure 7A). We identified differentially expressed genes across most cell types, but the most pronounced differences were observed in PTCs, pointing to long-term effects of AKI on the transcriptional state of PTCs following function-restoring adaptive renal repair (Figure 7B). Several genes were upregulated in all AKI_GFP+ PT segments compared to control, for example, Sash1, a positive regulator of NF-κB signaling, the cytokine encoding gene Il34, Nrg1 (neuregulin-1), Keg1 (kidney-expressed gene 1), Gclc (glutamate-cysteine ligase catalytic subunit), and Igfbp7 (insulin-like growth factor-binding protein 7), an AKI biomarker76 assigned to “degenerative cell states” in human AKI and CKD12 (Figure 7C, Supplemental Table 9), although some of the observed differences were small. Expression of Slc34a1 (sodium-dependent phosphate transport protein 2A) and Nox4 (NADPH oxidase-4) was reduced in AKI_GFP+ PTS1/S2 compared to controls. At the chromatin level, fewer DARs were observed between AKI_GFP+ and control cells, although some of the identified differentially expressed genes were associated with DARs within or near the gene body (e.g., Keg1, Supplemental Figure 11). Time-point-specific analyses identified more differentially expressed genes and DARs at 4 weeks than at 6 months post-AKI across most cell types, suggesting that the observed changes partially resolve in time after AKI (Supplemental Figure 12, A and B). Between 18% and 51% of differentially expressed genes in PTS1/S2/S3 at 6 months showed concordant changes at 4 weeks post-AKI.
Figure 7.

AKI alters the transcriptional state of adaptive proximal tubule cells long-term. (A) Schematic of the analysis performed: gene expression profile of AKI_GFP+ and control samples was compared per cell type to identify differentially expressed genes (DEG) using a Wilcoxon Rank Sum test. (B) Upset plot showing the number of DEG between AKI_GFP+ and control samples per cell type as identified in Figure 3B. The total number of DEG per cell type is shown by the bar plots on the right of the graph. The bar plots on the top of the graph show gene sets that are shared between clusters as indicated by the connected dots or unique to a cell type. Only sets with a minimum of 10 genes are shown. (C) Violin plots showing the average expression of selected genes in AKI_GFP+ and control samples in the different segments of the proximal tubule. The clusters PTS1_1 and PTS1_2 were pooled for this visualization. (D) Volcano plot showing all DEG (padj.<0.01) between AKI_GFP+ proximal tubule segment 3 (PTS3) and control PTS3. Genes with a log2FC ≥0.25 are shown in red, genes with a log2FC ≤−0.25 are shown in blue. (E) and (F) Top 10 enriched gene ontology (GO) terms of the up- and downregulated genes shown in panel (D). (G) Violin plots showing the chromVAR motif activity of the Stat5a::Stat5b and the NR3C1 motif in AKI_GFP+ and control PTS3 cluster. Horizontal lines indicate the median.
PTS3 exhibited the strongest changes in AKI_GFP+ compared to control samples with 319 up- and 223 downregulated genes (|avg_log2FC|≥0.25, Figure 7D). Gene ontology terms related to development, protein modification, and stress-activated mitogen-activated protein kinase cascade were overrepresented among the upregulated genes, whereas terms related to normal PT function, such as “organic acid transmembrane transport” and “sodium ion transport,” were enriched among the downregulated genes (Figure 7, E and F). Time-point-specific analyses showed that some gene expression changes persist until 6 months while other resolve (Supplemental Figure 12C). The downregulation of the transaminase encoding gene Aadat, for example, was only observed at 4 weeks post-AKI, a finding confirmed by RNAscope (Supplemental Figure 13). Other genes, such as Gclc and Ccl28, were upregulated at both time points. Quantification of Gclc by RNAscope showed a trend toward higher Gclc levels in PTS3 post-AKI compared to controls (Supplemental Figure 14). To determine if similar long-term transcriptional alterations are observed in published data, we compared snRNA-seq kidney data 6 weeks post-IRI9 with controls, which showed a highly significant overlap of the 494 identified differentially expressed genes with the differentially expressed genes identified in Figure 7D (overlap: 133 genes, hypergeometric test: p=3.7×10−115), with 60% of these genes showing concordant expression changes.
Analysis of TF motif activity using chromVAR identified several differentially active TFs in AKI_GFP+ PTS3 nuclei compared to controls. Hnf4a activity was reduced (padj.=1.9×10⁻¹⁷) and the activity of Stat family members, particularly Stat5a::Stat5b, was predicted to be enriched. Stat5a/Stat5b were not differentially expressed, consistent with protein modification as key determinant of DNA-binding by Stat family members.77 Glucocorticoid receptors Nr3c1 and Nr3c2, Ar, transcription regulator protein Bach2, and nuclear receptor ROR-alpha (Rora) showed increased chromVAR motif activity and gene expression in AKI_GFP+ PTS3 nuclei compared to controls (Figure 7G, Supplemental Tables 9, 10), suggesting a potential role of these TFs in long-term alterations of the transcriptional profile in PTS3.
Discussion
Combining genetic labeling of cells that enter the cell cycle in response to AKI with single-nucleus multiomics generated new insight into long-term outcomes of adaptive and maladaptive PT repair. Both renal epithelial and endothelial cell types divide at a low rate in healthy kidneys to balance baseline cell loss.5,78 Several studies have shown renal tubular cells proliferate in response to IRI to replenish the damaged epithelium, particularly in PTS3, the part of the nephron most sensitive to IRI-invoked cell death.5,79,80 Assessing the proliferative response to AKI using Ki67-lineage tracing highlights an organ-wide entry of cells into the cell cycle after IRI, although the highest Ki67INTACT-labeling frequency is in PTS3 and LOH-TL.
The source(s) of proliferating renal tubular epithelial cells after AKI is a subject of ongoing debate.81-83 While lineage tracing studies show that proliferating PTCs derive from differentiated PTCs in the mouse,3,4,25,84 others have proposed a fixed population of tubular progenitors in humans.85,86 Recent mouse AKI studies suggested that only a subset of Pax2+ tubular progenitors proliferate in response to AKI, whereas the majority of PTCs undergo endoreplication and hypertrophy.87,88 We show that most kidney cell types react to IRI by inducing a partially conserved transcriptional program characterized by dedifferentiation and upregulation of immediate-early response genes and transcriptional regulators, followed by cell-cycle entry. While we did not observe an upregulation of Pax2 at 12 hours (Supplemental Table 1), we previously found increased Pax2 expression in injured PTCs 7 days post-IRI.10 However, because Mki67 is expressed at all stages of the cell cycle, we cannot differentiate between Ki67INTACT-GFP+ cells that have successfully completed replication, endocycling Ki67INTACT-GFP+ cells or cells that did not complete a replicative cycle.
While the majority of Ki67INTACT-GFP+ PTCs did not express injury markers at 4 weeks and 6 months post-IRI after adaptive repair, a population of maladaptive FR-PTCs was still present at 6 months, despite a marked decrease in this population between 4 weeks and 6 months. The Krt20INTACT-lineage tracing studies provide strong evidence that cell death contributes to this decrease of FR-PTCs post-AKI, although future studies will benefit from a more detailed assessment of the fate of FR-PTCs. These findings have interesting implications for models in which persistent FR-PTCs provoke ongoing kidney damage in the AKI-to-CKD transition and approaches designed to remove FR-PTCs through senolytics or immunotherapy.89–91
The importance of epigenetic control of the AKI response has been recognized in previous studies.92,93 Furthermore, ameliorating AKI outcomes through the inhibition of histone deacetylases in model systems highlights an approach with therapeutic promise.94,95 Recent studies have pointed to a more dynamic interplay at enhancers relative to promoters in the early repair phase after AKI.96 Our analysis identified a large number of distinct post-AKI changes in chromatin accessibility spanning putative cis-reguatory elements and defining the maladaptive FR-PTC state. In addition, the single-nucleus multiomics approach enabled the identification of novel TFs implicated in the AKI response, including Creb5, Runx1, and Klf6. Each shows elevated expression in FR-PTCs and a predicted increase in binding activity in accessible chromatin regions, pointing to active regulatory roles and meriting future functional studies of their potential regulatory actions.
Previous studies have indicated that severe AKI causes long-term structural and functional changes to the kidney that predispose to CKD.97,98 Here, we show that AKI influences the transcriptional state of PTCs weeks to months after the injury event, even after adaptive repair. Interestingly, similar transcriptional changes were observed when comparing AKI_GFP+ and AKI_GFP− PTCs with controls, respectively (Supplemental Figure 15). This suggests that the observed transcriptional changes might be related to changes in the renal vasculature as have been described after severe IRI97,98 and/or paracrine cues from the local injured environment rather than to historic proliferation only. Further studies are required to illustrate cause and functional consequence of the observed transcriptional alterations in adaptive PTCs.
Several limitations of our study should be noted. Although the Ki67INTACT-labeling efficiency is high, it is not 100%, and low background labeling was observed. Few false negative and false positive cells are therefore expected in AKI_GFP− and AKI_GFP+ samples, respectively, although this is deemed insufficient to alter any key conclusions. Furthermore, confidence in the generalizability of our observations could be enhanced by increasing control and experimental sample numbers in the long-term study.
Supplementary Material
ACKNOWLEDGMENTS
We thank Dr. Seth Ruffins and the Optical Imaging Facility of USC Stem Cell for technical support.
Footnotes
Published online ahead of print. Publication date available at www.jasn.org.
Disclosures
B.D.H. is a consultant Chinook Therapeutics, Janssen Research & Development, LLC, and Pfizer; holds equity in Chinook Therapeutics; and has had grant support from Chinook Therapeutics, Janssen and Pfizer (within last 3 years). B. Humphreys also reports Patents or Royalties: Evotec, AG; Advisory or Leadership Role: American Journal of Physiology Renal Physiology Editorial Board, ASCI President-elect, Board of Scientific Advisors, Chinook Therapeutics SAB, JCI Insight Editorial Board, Kidney International Editorial Board, Regenerative Medicine Crossing Borders SAB, RegMed XB, and Seminars in Nephrology Editorial Board.
A.P.M. receives consulting fees or stock options for his scientific advisory role for eGENESIS, IVIVA Medical, Novartis, and TRESTLE BioTherapeutics. A. McMahon also reports research funding: Amgen; Patents or Royalties: Hedgehog technology licenses through Harvard to Curis, received license/royalty payments from Curis; Advisory or Leadership Role: California Institute of Technology—Jacobs Institute, Max Planck Institute Molecular Genetics Berlin; and Other Interests or Relationships: Committee of University Kidney Research Organization (UKRO). J. van Gestel reports Employer: EMBL. All remaining authors have nothing to disclose.
Funding
L. M.S. Gerhardt was supported by the German Research Foundation with a postdoctoral scholarship (GE 3179/1-1). Work in A.P.M.’s laboratory was supported by a ReBuilding The Kidney Partnership grant from the National Institute of Diabetes and Digestive and Kidney Diseases (U01DK107350) and by a ReBuilding The Kidney Program grant (UC2DK126024).
Author Contributions
L.M.S. Gerhardt, J. van Gestel, B.D. Humphreys, K. Koppitch, and A.P. McMahon conceptualized the study; L.M.S. Gerhardt was responsible for data curation and project administration and wrote the original draft; L.M.S.Gerhardt and H. Wu were responsible for visualization; L.M.S. Gerhardt, J. van Gestel, and K. Koppitch were responsible for formal analysis; H. Wu was responsible for software; L.M.S. Gerhardt, K. Koppitch, J. Guo, and S. Cho were responsible for validation; A. McMahon was responsible for funding acquisition and wrote the original draft; B. Humphreys, A. McMahon, were responsible for resources; B. Humphreys and A. P. McMahon provided supervision; L.M.S. Gerhardt and K. Koppitch were responsible for methodology.
Data Sharing Statement
Original data reported in this paper of type Experimental Data have been deposited to Gene Expression Omnibus (GEO), GSE209610.
Supplemental Material
This article contains the following supplemental material online at http://links.lww.com/JSN/D619.
References
- 1.Mehta RL, Cerdá J, Burdmann EA, et al. International Society of Nephrology’s 0by25 initiative for acute kidney injury (zero preventable deaths by 2025): a human rights case for nephrology. Lancet. 2015;385(9987):2616-2643. doi: 10.1016/s0140-6736(15)60126-x [DOI] [PubMed] [Google Scholar]
- 2.Grams ME, Yang W, Rebholz CM, et al. Risks of adverse events in advanced CKD: the Chronic Renal Insufficiency Cohort (CRIC) study. Am J Kidney Dis. 2017;70(3):337-346. doi: 10.1053/j.ajkd.2017.01.050 [DOI] [PMC free article] [PubMed] [Google Scholar]
- 3.Humphreys BD, Valerius MT, Kobayashi A, et al. Intrinsic epithelial cells repair the kidney after injury. Cell Stem Cell. 2008;2(3):284-291. doi: 10.1016/j.stem.2008.01.014 [DOI] [PubMed] [Google Scholar]
- 4.Humphreys BD, Czerniak S, DiRocco DP, Hasnain W, Cheema R, Bonventre JV. Repair of injured proximal tubule does not involve specialized progenitors. Proc Natl Acad Sci U S A. 2011;108(22):9226-9231. doi: 10.1073/pnas.1100629108 [DOI] [PMC free article] [PubMed] [Google Scholar]
- 5.Rinkevich Y, Montoro DT, Contreras-Trujillo H, et al. In vivo clonal analysis reveals lineage-restricted progenitor characteristics in mammalian kidney development, maintenance and regeneration. Cell Rep. 2014;7(4):1270-1283. doi: 10.1016/j.celrep.2014.04.018 [DOI] [PMC free article] [PubMed] [Google Scholar]
- 6.Ferenbach DA, Bonventre JV. Mechanisms of maladaptive repair after AKI leading to accelerated kidney ageing and CKD. Nat Rev Nephrol. 2015;11(5):264-276. doi: 10.1038/nrneph.2015.3 [DOI] [PMC free article] [PubMed] [Google Scholar]
- 7.Yang L, Besschetnova TY, Brooks CR, Shah JV, Bonventre JV. Epithelial cell cycle arrest in G2/M mediates kidney fibrosis after injury. Nat Med. 2010;16(5):535-543. doi: 10.1038/nm.2144 [DOI] [PMC free article] [PubMed] [Google Scholar]
- 8.Basile DP, Bonventre JV, Mehta R, et al. Progression after AKI: understanding maladaptive repair processes to predict and identify therapeutic treatments. J Am Soc Nephrol. 2016;27(3):687-697. doi: 10.1681/ASN.2015030309 [DOI] [PMC free article] [PubMed] [Google Scholar]
- 9.Kirita Y, Wu H, Uchimura K, Wilson PC, Humphreys BD. Cell profiling of mouse acute kidney injury reveals conserved cellular responses to injury. Proc Natl Acad Sci U S A. 2020;117(27):15874-15883. doi: 10.1073/pnas.2005477117 [DOI] [PMC free article] [PubMed] [Google Scholar]
- 10.Gerhardt LMS, Liu J, Koppitch K, Cippà PE, McMahon AP. Single-nuclear transcriptomics reveals diversity of proximal tubule cell states in a dynamic response to acute kidney injury. Proc Natl Acad Sci U S A. 2021;118(27):e2026684118. doi: 10.1073/pnas.2026684118 [DOI] [PMC free article] [PubMed] [Google Scholar]
- 11.Rudman-Melnick V, Adam M, Potter A, et al. Single-cell profiling of AKI in a murine model reveals novel transcriptional signatures, profibrotic phenotype, and epithelial-to-stromal crosstalk. J Am Soc Nephrol. 2020;31(12):2793-2814. doi: 10.1681/ASN.2020010052 [DOI] [PMC free article] [PubMed] [Google Scholar]
- 12.Lake BB, Menon R, Winfree S, et al. An atlas of healthy and injured cell states and niches in the human kidney. bioRxiv. 2021. doi: 10.1101/2021.07.28.454201 [DOI] [PMC free article] [PubMed] [Google Scholar]
- 13.Legouis D, Rinaldi A, Arnoux G, et al. Single cell profiling in COVID-19 associated acute kidney injury reveals patterns of tubule injury and repair in human. bioRxiv. 2021. doi: 10.1101/2021.10.05.463150 [DOI] [Google Scholar]
- 14.Janosevic D, Myslinski J, McCarthy TW, et al. The orchestrated cellular and molecular responses of the kidney to endotoxin define a precise sepsis timeline. Elife. 2021;10:e62270. doi: 10.7554/elife.62270 [DOI] [PMC free article] [PubMed] [Google Scholar]
- 15.Ide S, Kobayashi Y, Ide K, et al. Ferroptotic stress promotes the accumulation of pro-inflammatory proximal tubular cells in maladaptive renal repair. Elife. 2021;10:e68603. doi: 10.7554/elife.68603 [DOI] [PMC free article] [PubMed] [Google Scholar]
- 16.Balzer MS, Doke T, Yang Y-W, et al. Single-cell analysis highlights differences in druggable pathways underlying adaptive or fibrotic kidney regeneration. Nat Commun. 2022;13(1):4018. doi: 10.1038/s41467-022-31772-9 [DOI] [PMC free article] [PubMed] [Google Scholar]
- 17.Conway BR, O’Sullivan ED, Cairns C, et al. Kidney single-cell atlas reveals myeloid heterogeneity in progression and regression of kidney disease. J Am Soc Nephrol. 2020;31(12):2833-2854. doi: 10.1681/ASN.2020060806 [DOI] [PMC free article] [PubMed] [Google Scholar]
- 18.Muto Y, Dixon EE, Yoshimura Y, et al. Defining cellular complexity in human autosomal dominant polycystic kidney disease by multimodal single cell analysis. bioRxiv. 2021. doi: 10.1101/2021.10.21.465323 [DOI] [PMC free article] [PubMed] [Google Scholar]
- 19.Miao Z, Balzer MS, Ma Z, et al. Single cell regulatory landscape of the mouse kidney highlights cellular differentiation programs and disease targets. Nat Commun. 2021;12(1):2277. doi: 10.1038/s41467-021-22266-1 [DOI] [PMC free article] [PubMed] [Google Scholar]
- 20.Muto Y, Wilson PC, Ledru N, et al. Single cell transcriptional and chromatin accessibility profiling redefine cellular heterogeneity in the adult human kidney. Nat Commun. 2021;12(1):2190. doi: 10.1038/s41467-021-22368-w [DOI] [PMC free article] [PubMed] [Google Scholar]
- 21.Cao J, Cusanovich DA, Ramani V, et al. Joint profiling of chromatin accessibility and gene expression in thousands of single cells. Science. 2018;361(6409):1380-1385. doi: 10.1126/science.aau0730 [DOI] [PMC free article] [PubMed] [Google Scholar]
- 22.Liu J, Kumar S, Dolzhenko E, et al. Molecular characterization of the transition from acute to chronic kidney injury following ischemia/reperfusion. JCI Insight. 2017;2(18):94716. doi: 10.1172/jci.insight.94716 [DOI] [PMC free article] [PubMed] [Google Scholar]
- 23.Basak O, Krieger TG, Muraro MJ, et al. Troy+ brain stem cells cycle through quiescence and regulate their number by sensing niche occupancy. Proc Natl Acad Sci U S A. 2018;115(4):E610-E619. doi: 10.1073/pnas.1715911114 [DOI] [PMC free article] [PubMed] [Google Scholar]
- 24.Mo A, Mukamel EA, Davis FP, et al. Epigenomic signatures of neuronal diversity in the mammalian brain. Neuron. 2015;86(6):1369-1384. doi: 10.1016/j.neuron.2015.05.018 [DOI] [PMC free article] [PubMed] [Google Scholar]
- 25.Kusaba T, Lalli M, Kramann R, Kobayashi A, Humphreys BD. Differentiated kidney epithelial cells repair injured proximal tubule. Proc Natl Acad Sci U S A. 2014;111(4):1527-1532. doi: 10.1073/pnas.1310653110 [DOI] [PMC free article] [PubMed] [Google Scholar]
- 26.Madisen L, Zwingman TA, Sunkin SM, et al. A robust and high-throughput Cre reporting and characterization system for the whole mouse brain. Nat Neurosci. 2010;13(1):133-140. doi: 10.1038/nn.2467 [DOI] [PMC free article] [PubMed] [Google Scholar]
- 27.Kobayashi A, Valerius MT, Mugford JW, et al. Six2 defines and regulates a multipotent self-renewing nephron progenitor population throughout mammalian kidney development. Cell Stem Cell. 2008;3(2):169-181. doi: 10.1016/j.stem.2008.05.020 [DOI] [PMC free article] [PubMed] [Google Scholar]
- 28.Chi X, Hadjantonakis A-K, Wu Z, Hyink D, Costantini F. A transgenic mouse that reveals cell shape and arrangement during ureteric bud branching. Genesis. 2009;47(2):61-66. doi: 10.1002/dvg.20452 [DOI] [PMC free article] [PubMed] [Google Scholar]
- 29.Dobin A, Davis CA, Schlesinger F, et al. STAR: ultrafast universal RNA-seq aligner. Bioinformatics. 2013;29(1):15-21. doi: 10.1093/bioinformatics/bts635 [DOI] [PMC free article] [PubMed] [Google Scholar]
- 30.Hao Y, Hao S, Andersen-Nissen E, et al. Integrated analysis of multimodal single-cell data. Cell. 2021;184(13):3573.e29-3587.e29. doi: 10.1016/j.cell.2021.04.048 [DOI] [PMC free article] [PubMed] [Google Scholar]
- 31.Stuart T, Srivastava A, Madad S, Lareau CA, Satija R. Single-cell chromatin state analysis with Signac. Nat Methods. 2021;18(11):1333-1341. doi: 10.1038/s41592-021-01282-5 [DOI] [PMC free article] [PubMed] [Google Scholar]
- 32.Young MD, Behjati S. SoupX removes ambient RNA contamination from droplet-based single-cell RNA sequencing data. Gigascience. 2020;9(12):giaa151. doi: 10.1093/gigascience/giaa151 [DOI] [PMC free article] [PubMed] [Google Scholar]
- 33.McGinnis CS, Murrow LM, Gartner ZJ. DoubletFinder: doublet detection in single-cell RNA sequencing data using artificial nearest neighbors. Cell Syst. 2019;8(4):329.e4-337.e4. doi: 10.1016/j.cels.2019.03.003 [DOI] [PMC free article] [PubMed] [Google Scholar]
- 34.Korsunsky I, Millard N, Fan J, et al. Fast, sensitive and accurate integration of single-cell data with harmony. Nat Methods. 2019;16(12):1289-1296. doi: 10.1038/s41592-019-0619-0 [DOI] [PMC free article] [PubMed] [Google Scholar]
- 35.Zhang Y, Liu T, Meyer CA, et al. Model-based analysis of ChIP-seq (MACS). Genome Biol. 2008;9(9):R137. doi: 10.1186/gb-2008-9-9-r137 [DOI] [PMC free article] [PubMed] [Google Scholar]
- 36.Conway JR, Lex A, Gehlenborg N. UpSetR: an R package for the visualization of intersecting sets and their properties. Bioinformatics. 2017;33(18):2938-2940. doi: 10.1093/bioinformatics/btx364 [DOI] [PMC free article] [PubMed] [Google Scholar]
- 37.Yu G, Wang L-G, Han Y, He Q-Y. clusterProfiler: an R package for comparing biological themes among gene clusters. OMICS. 2012;16(5):284-287. doi: 10.1089/omi.2011.0118 [DOI] [PMC free article] [PubMed] [Google Scholar]
- 38.Yu G, Wang L-G, He Q-Y. ChIPseeker: an R/bioconductor package for ChIP peak annotation, comparison and visualization. Bioinformatics. 2015;31(14):2382-2383. doi: 10.1093/bioinformatics/btv145 [DOI] [PubMed] [Google Scholar]
- 39.Schep AN, Wu B, Buenrostro JD. Greenleaf WJ: chromVAR: inferring transcription-factor-associated accessibility from single-cell epigenomic data. Nat Methods. 2017;14(10):975-978. doi: 10.1038/nmeth.4401 [DOI] [PMC free article] [PubMed] [Google Scholar]
- 40.Fornes O, Castro-Mondragon JA, Khan A, et al. JASPAR 2020: update of the open-access database of transcription factor binding profiles. Nucleic Acids Res. 2020;48(D1):D87-D92. doi: 10.1093/nar/gkz1001 [DOI] [PMC free article] [PubMed] [Google Scholar]
- 41.Kolde R. Pheatmap: Pretty Heatmaps [Internet]. 2012. https://cran.r-project.org/web/packages/pheatmap. [Google Scholar]
- 42.Tan G, Lenhard B. TFBSTools: an R/bioconductor package for transcription factor binding site analysis. Bioinformatics. 2016;32(10):1555-1556. doi: 10.1093/bioinformatics/btw024 [DOI] [PMC free article] [PubMed] [Google Scholar]
- 43.Garcia-Alonso L, Holland CH, Ibrahim MM, Turei D, Saez-Rodriguez J. Benchmark and integration of resources for the estimation of human transcription factor activities. Genome Res. 2019;29(8):1363-1375. doi: 10.1101/gr.240663.118 [DOI] [PMC free article] [PubMed] [Google Scholar]
- 44.Holland CH, Szalai B, Saez-Rodriguez J. Transfer of regulatory knowledge from human to mouse for functional genomics analysis. Biochim Biophys Acta Gene Regul Mech. 2020;1863(6):194431. doi: 10.1016/j.bbagrm.2019.194431 [DOI] [PubMed] [Google Scholar]
- 45.Bastian M, Heymann S, Jacomy M. Gephi: an open source software for exploring and manipulating networks. Proc Int AAAI Conf Weblogs Social Media. 2009;3(1):361-362. doi: 10.1609/icwsm.v3i1.13937 [DOI] [Google Scholar]
- 46.Langfelder P, Horvath S. WGCNA: an R package for weighted correlation network analysis. BMC Bioinformatics. 2008;9(1):559. doi: 10.1186/1471-2105-9-559 [DOI] [PMC free article] [PubMed] [Google Scholar]
- 47.Schindelin J, Arganda-Carreras I, Frise E, et al. Fiji: an open-source platform for biological-image analysis. Nat Methods. 2012;9(7):676-682. doi: 10.1038/nmeth.2019 [DOI] [PMC free article] [PubMed] [Google Scholar]
- 48.Sun X, Kaufman PD. Ki-67: more than a proliferation marker. Chromosoma. 2018;127(2):175-186. doi: 10.1007/s00412-018-0659-8 [DOI] [PMC free article] [PubMed] [Google Scholar]
- 49.Scholzen T, Gerdes J. The Ki-67 protein: from the known and the unknown. J Cell Physiol. 2000;182(3):311-322. doi: [DOI] [PubMed] [Google Scholar]
- 50.Deal RB, Henikoff S. A simple method for gene expression and chromatin profiling of individual cell types within a tissue. Dev Cell. 2010;18(6):1030-1040. doi: 10.1016/j.devcel.2010.05.013 [DOI] [PMC free article] [PubMed] [Google Scholar]
- 51.Ropolo A, Grasso D, Pardo R, et al. The pancreatitis-induced vacuole membrane protein 1 triggers autophagy in mammalian cells. J Biol Chem. 2007;282(51):37124-37133. doi: 10.1074/jbc.m706956200 [DOI] [PubMed] [Google Scholar]
- 52.Bienaimé F, Muorah M, Yammine L, et al. Stat3 controls tubulointerstitial communication during CKD. J Am Soc Nephrol. 2016;27(12):3690-3705. doi: 10.1681/ASN.2015091014 [DOI] [PMC free article] [PubMed] [Google Scholar]
- 53.Kumar S, Liu J, Pang P, et al. Sox9 activation highlights a cellular pathway of renal repair in the acutely injured mammalian kidney. Cell Rep. 2015;12(8):1325-1338. doi: 10.1016/j.celrep.2015.07.034 [DOI] [PubMed] [Google Scholar]
- 54.Kang HM, Huang S, Reidy K, Han SH, Chinga F, Susztak K. Sox9 positive progenitor cells play a key role in renal tubule epithelial regeneration in mice. Cell Rep. 2016;14(4):861-871. doi: 10.1016/j.celrep.2015.12.071 [DOI] [PMC free article] [PubMed] [Google Scholar]
- 55.Marable SS, Chung E, Park J-S. Hnf4a is required for the development of cdh6-expressing progenitors into proximal tubules in the mouse kidney. J Am Soc Nephrol. 2020;31(11):2543-2558. doi: 10.1681/ASN.2020020184 [DOI] [PMC free article] [PubMed] [Google Scholar]
- 56.Ransick A, Lindström NO, Liu J, et al. , Single-cell profiling reveals sex, lineage, and regional diversity in the mouse kidney. Dev Cell. 2019;51(3):399.e7-413.e7. doi: 10.1016/j.devcel.2019.10.005 [DOI] [PMC free article] [PubMed] [Google Scholar]
- 57.Imaki J, Tsuchiya K, Mishima T, et al. Developmental contribution of c-maf in the kidney: distribution and developmental study of c-maf mRNA in normal mice kidney and histological study of c-maf knockout mice kidney and liver. Biochem Biophys Res Commun. 2004;320(4):1323-1327. doi: 10.1016/j.bbrc.2004.05.222 [DOI] [PubMed] [Google Scholar]
- 58.Gachon F, Olela FF, Schaad O, Descombes P, Schibler U. The circadian PAR-domain basic leucine zipper transcription factors DBP, TEF, and HLF modulate basal and inducible xenobiotic detoxification. Cell Metab. 2006;4(1):25-36. doi: 10.1016/j.cmet.2006.04.015 [DOI] [PubMed] [Google Scholar]
- 59.Nakai S, Sugitani Y, Sato H, et al. Crucial roles of Brn1 in distal tubule formation and function in mouse kidney. Development. 2003;130(19):4751-4759. doi: 10.1242/dev.00666 [DOI] [PubMed] [Google Scholar]
- 60.Kopan R, Ilagan MXG. The canonical Notch signaling pathway: unfolding the activation mechanism. Cell. 2009;137(2):216-233. doi: 10.1016/j.cell.2009.03.045 [DOI] [PMC free article] [PubMed] [Google Scholar]
- 61.Liefke R, Oswald F, Alvarado C, et al. Histone demethylase KDM5A is an integral part of the core Notch-RBP-J repressor complex. Genes Dev. 2010;24(6):590-601. doi: 10.1101/gad.563210 [DOI] [PMC free article] [PubMed] [Google Scholar]
- 62.Ma Z, Hu X, Ding H-F, Zhang M, Huo Y, Dong Z. Single-nucleus transcriptional profiling of chronic kidney disease after cisplatin nephrotoxicity. Am J Pathol. 2022;192(4):613-628. doi: 10.1016/j.ajpath.2021.12.012 [DOI] [PMC free article] [PubMed] [Google Scholar]
- 63.Wu H, Lai C-F, Chang-Panesso M, Humphreys BD. Proximal tubule translational profiling during kidney fibrosis reveals proinflammatory and long noncoding RNA expression patterns with sexual dimorphism. J Am Soc Nephrol. 2020;31(1):23-38. doi: 10.1681/ASN.2019040337 [DOI] [PMC free article] [PubMed] [Google Scholar]
- 64.Zhou T, Luo M, Cai W, et al. Runt-related transcription factor 1 (RUNX1) promotes TGF-β-induced renal tubular epithelial-to-mesenchymal transition (EMT) and renal fibrosis through the PI3K subunit p110δ. EBioMedicine. 2018;31:217-225. doi: 10.1016/j.ebiom.2018.04.023 [DOI] [PMC free article] [PubMed] [Google Scholar]
- 65.Hwang JH, Seo J-H, Beshiri ML, et al. CREB5 promotes resistance to androgen-receptor antagonists and androgen deprivation in prostate cancer. Cell Rep. 2019;29(8):2355.e6-2370.e6. doi: 10.1016/j.celrep.2019.10.068 [DOI] [PMC free article] [PubMed] [Google Scholar]
- 66.Wang S, Qiu J, Liu L, et al. CREB5 promotes invasiveness and metastasis in colorectal cancer by directly activating MET. J Exp Clin Cancer Res. 2020;39(1):168. doi: 10.1186/s13046-020-01673-0 [DOI] [PMC free article] [PubMed] [Google Scholar]
- 67.Hwang JH, Arafeh R, Seo J-H, et al. CREB5 reprograms FOXA1 nuclear interactions to promote resistance to androgen receptor-targeting therapies. Elife. 2022;11:e73223. doi: 10.7554/elife.73223 [DOI] [PMC free article] [PubMed] [Google Scholar]
- 68.Tarabishi R, Zahedi K, Mishra J, et al. Induction of Zf9 in the kidney following early ischemia/reperfusion. Kidney Int. 2005;68(4):1511-1519. doi: 10.1111/j.1523-1755.2005.00563.x [DOI] [PubMed] [Google Scholar]
- 69.Cippà PE, Sun B, Liu J, Chen L, Naesens M, McMahon AP. Transcriptional trajectories of human kidney injury progression. JCI Insight. 2018;3(22):123151. doi: 10.1172/jci.insight.123151 [DOI] [PMC free article] [PubMed] [Google Scholar]
- 70.Holian J, Qi W, Kelly DJ, et al. Role of Krüppel-like factor 6 in transforming growth factor-β1-induced epithelial-mesenchymal transition of proximal tubule cells. Am J Physiol Ren Physiol. 2008;295(5):F1388-F1396. doi: 10.1152/ajprenal.00055.2008 [DOI] [PMC free article] [PubMed] [Google Scholar]
- 71.Zhang Y, Li C, Guan C, et al. MiR-181d-5p targets KLF6 to improve ischemia/reperfusion-induced AKI through effects on renal function, apoptosis, and inflammation. Front Physiol. 2020;11:510. doi: 10.3389/fphys.2020.00510 [DOI] [PMC free article] [PubMed] [Google Scholar]
- 72.Piret SE, Guo Y, Attallah AA, et al. Krüppel-like factor 6-mediated loss of BCAA catabolism contributes to kidney injury in mice and humans. Proc Natl Acad Sci U S A. 2021;118(23):e2024414118. doi: 10.1073/pnas.2024414118 [DOI] [PMC free article] [PubMed] [Google Scholar]
- 73.Kang HM, Ahn SH, Choi P, et al. Defective fatty acid oxidation in renal tubular epithelial cells has a key role in kidney fibrosis development. Nat Med. 2015;21(1):37-46. doi: 10.1038/nm.3762 [DOI] [PMC free article] [PubMed] [Google Scholar]
- 74.Yao F, Wang X, Cui Z-K, et al. ETS2 promotes epithelial-to-mesenchymal transition in renal fibrosis by targeting JUNB transcription. Lab Invest. 2020;100(3):438-453. doi: 10.1038/s41374-019-0331-9 [DOI] [PubMed] [Google Scholar]
- 75.Cho J-Y, Akbarali Y, Zerbini LF, et al. Isoforms of the ets transcription factor NERF/ELF-2 physically interact with AML1 and mediate opposing effects on AML1-mediated transcription of the B cell-specific blk gene. J Biol Chem. 2004;279(19):19512-19522. doi: 10.1074/jbc.m309074200 [DOI] [PubMed] [Google Scholar]
- 76.Kashani K, Al-Khafaji A, Ardiles T, et al. Discovery and validation of cell cycle arrest biomarkers in human acute kidney injury. Crit Care. 2013;17(1):R25. doi: 10.1186/cc12503 [DOI] [PMC free article] [PubMed] [Google Scholar]
- 77.Reich NC, Liu L. Tracking STAT nuclear traffic. Nat Rev Immunol. 2006;6(8):602-612. doi: 10.1038/nri1885 [DOI] [PubMed] [Google Scholar]
- 78.Nadasdy T, Laszik Z, Blick KE, Johnson LD, Silva FG. Proliferative activity of intrinsic cell populations in the normal human kidney. J Am Soc Nephrol. 1994;4(12):2032-2039. doi: 10.1681/ASN.v4122032 [DOI] [PubMed] [Google Scholar]
- 79.Witzgall R, Brown D, Schwarz C, Bonventre JV. Localization of proliferating cell nuclear antigen, vimentin, c-Fos, and clusterin in the postischemic kidney. Evidence for a heterogenous genetic response among nephron segments, and a large pool of mitotically active and dedifferentiated cells. J Clin Invest. 1994;93(5):2175-2188. doi: 10.1172/jci117214 [DOI] [PMC free article] [PubMed] [Google Scholar]
- 80.Bonventre JV. Dedifferentiation and proliferation of surviving epithelial cells in acute renal failure. J Am Soc Nephrol. 2003;14(suppl 1):S55-S61. doi: 10.1097/01.ASN.0000067652.51441.21 [DOI] [PubMed] [Google Scholar]
- 81.Chang-Panesso M, Humphreys BD. Cellular plasticity in kidney injury and repair. Nat Rev Nephrol. 2017;13(1):39-46. doi: 10.1038/nrneph.2016.169 [DOI] [PubMed] [Google Scholar]
- 82.Lombardi D, Becherucci F, Romagnani P. How much can the tubule regenerate and who does it? An open question. Nephrol Dial Transpl. 2016;31(8):1243-1250. doi: 10.1093/ndt/gfv262 [DOI] [PMC free article] [PubMed] [Google Scholar]
- 83.Kramann R, Kusaba T, Humphreys BD. Who regenerates the kidney tubule? Nephrol Dial Transpl. 2015;30(6):903-910. doi: 10.1093/ndt/gfu281 [DOI] [PMC free article] [PubMed] [Google Scholar]
- 84.Chang-Panesso M, Kadyrov FF, Lalli M, et al. FOXM1 drives proximal tubule proliferation during repair from acute ischemic kidney injury. J Clin Invest. 2019;129(12):5501-5517. doi: 10.1172/jci125519 [DOI] [PMC free article] [PubMed] [Google Scholar]
- 85.Bussolati B, Bruno S, Grange C, et al. Isolation of renal progenitor cells from adult human kidney. Am J Pathol. 2005;166(2):545-555. doi: 10.1016/s0002-9440(10)62276-6 [DOI] [PMC free article] [PubMed] [Google Scholar]
- 86.Sagrinati C, Netti GS, Mazzinghi B, et al. Isolation and characterization of multipotent progenitor cells from the Bowman’s capsule of adult human kidneys. J Am Soc Nephrol. 2006;17(9):2443-2456. doi: 10.1681/ASN.2006010089 [DOI] [PubMed] [Google Scholar]
- 87.Lazzeri E, Angelotti ML, Peired A, et al. Endocycle-related tubular cell hypertrophy and progenitor proliferation recover renal function after acute kidney injury. Nat Commun. 2018;9(1):1344. doi: 10.1038/s41467-018-03753-4 [DOI] [PMC free article] [PubMed] [Google Scholar]
- 88.De Chiara L, Conte C, Semeraro R, et al. Tubular cell polyploidy protects from lethal acute kidney injury but promotes consequent chronic kidney disease. Nat Commun. 2022;13(1):5805. doi: 10.1038/s41467-022-33110-5 [DOI] [PMC free article] [PubMed] [Google Scholar]
- 89.Docherty MH, Baird DP, Hughes J, Ferenbach DA. Cellular senescence and senotherapies in the kidney: current evidence and future directions. Front Pharmacol. 2020;11:755. doi: 10.3389/fphar.2020.00755 [DOI] [PMC free article] [PubMed] [Google Scholar]
- 90.Mylonas KJ, O’Sullivan ED, Humphries D, et al. Cellular senescence inhibits renal regeneration after injury in mice, with senolytic treatment promoting repair. Sci Transl Med. 2021;13(594):eabb0203. doi: 10.1126/scitranslmed.abb0203 [DOI] [PubMed] [Google Scholar]
- 91.Amor C, Feucht J, Leibold J, et al. Senolytic CAR T cells reverse senescence-associated pathologies. Nature. 2020;583(7814):127-132. doi: 10.1038/s41586-020-2403-9 [DOI] [PMC free article] [PubMed] [Google Scholar]
- 92.Gerhardt LMS, McMahon AP. Multi-omic approaches to acute kidney injury and repair. Curr Opin Biomed Eng. 2021;20:100344. doi: 10.1016/j.cobme.2021.100344 [DOI] [PMC free article] [PubMed] [Google Scholar]
- 93.Guo C, Dong G, Liang X, Dong Z. Epigenetic regulation in AKI and kidney repair: mechanisms and therapeutic implications. Nat Rev Nephrol. 2019;15(4):220-239. doi: 10.1038/s41581-018-0103-6 [DOI] [PMC free article] [PubMed] [Google Scholar]
- 94.Cianciolo Cosentino C, Skrypnyk NI, Brilli LL, et al. Histone deacetylase inhibitor enhances recovery after AKI. J Am Soc Nephrol. 2013;24(6):943-953. doi: 10.1681/ASN.2012111055 [DOI] [PMC free article] [PubMed] [Google Scholar]
- 95.Hyndman KA. Histone deacetylases in kidney physiology and acute kidney injury. Semin Nephrol. 2020;40(2):138-147. doi: 10.1016/j.semnephrol.2020.01.005 [DOI] [PMC free article] [PubMed] [Google Scholar]
- 96.Wilflingseder J, Willi M, Lee HK, et al. Enhancer and super-enhancer dynamics in repair after ischemic acute kidney injury. Nat Commun. 2020;11(1):3383. doi: 10.1038/s41467-020-17205-5 [DOI] [PMC free article] [PubMed] [Google Scholar]
- 97.Basile DP, Donohoe D, Roethe K, Osborn JL. Renal ischemic injury results in permanent damage to peritubular capillaries and influences long-term function. Am J Physiol Renal Physiol. 2001;281(5):F887-F899. doi: 10.1152/ajprenal.00050.2001 [DOI] [PubMed] [Google Scholar]
- 98.Kramann R, Tanaka M, Humphreys BD. Fluorescence microangiography for quantitative assessment of peritubular capillary changes after AKI in mice. J Am Soc Nephrol. 2014;25(9):1924-1931. doi: 10.1681/ASN.2013101121 [DOI] [PMC free article] [PubMed] [Google Scholar]
Associated Data
This section collects any data citations, data availability statements, or supplementary materials included in this article.
Data Availability Statement
All sequencing data have been deposited in the Gene Expression Omnibus (GEO) database (accession number GSE209610). Gene expression, chromatin accessibility, and transcription factor motif activity can be viewed on this interactive website: https://humphreyslab.com/SingleCell/.
Original data reported in this paper of type Experimental Data have been deposited to Gene Expression Omnibus (GEO), GSE209610.