

Abstract
Genes with similar expression patterns in a set of diverse samples may be considered coexpressed. Human Gene Coexpression Analysis 2.0 (HGCA2.0) is a webtool which studies the global coexpression landscape of human genes. The website is based on the hierarchical clustering of 55,431 Homo sapiens genes based on a large-scale coexpression analysis of 3500 GTEx bulk RNA-Seq samples of healthy individuals, which were selected as the best representative samples of each tissue type. HGCA2.0 presents subclades of coexpressed genes to a gene of interest, and performs various built-in gene term enrichment analyses on the coexpressed genes, including gene ontologies, biological pathways, protein families, and diseases, while also being unique in revealing enriched transcription factors driving coexpression. HGCA2.0 has been successful in identifying not only genes with ubiquitous expression patterns, but also tissue-specific genes. Benchmarking showed that HGCA2.0 belongs to the top performing coexpression webtools, as shown by STRING analysis. HGCA2.0 creates working hypotheses for the discovery of gene partners or common biological processes that can be experimentally validated. It offers a simple and intuitive website design and user interface, as well as an API endpoint.
Keywords: gene coexpression analysis, gene coexpression network, co-expression, RNA-Seq, transcriptomics, bioinformatics, webtool
1. Introduction
Genes that exhibit similar expression profiles in a large number of samples of different biological conditions, are considered coexpressed and tend to participate in similar biological processes or common metabolic pathways. The coexpression of genes, revealed through computational methods, can determine functional gene partners and, consequently, may be used to make assumptions about common pathway participation of a group of coexpressed genes, or to assign roles to genes of unknown function by consulting the known biological roles of the genes they are coexpressed with [1].
Gene coexpression analysis is performed on a specific organism, and uses samples from the same transcriptomic platform, that are processed in the same manner [2]. RNA-Seq [3] transcriptomic technology can massively study all transcripts of a tissue and has become the norm in gene expression estimation. As a consequence, RNA-Seq raw data constitute the main source for gene coexpression analysis. Depending on the type of samples used, coexpression analysis can be classified into two approaches: “condition-independent”, where primary data derive from healthy samples from a variety of tissues of an organism, and “condition-dependent”, where the samples come from a specific tissue or experimental condition [4]. RNA-Seq samples are procured either through in-house experiments or downloaded from public repositories, such as Gene Expression Omnibus (GEO) [5], Sequence Read Archive (SRA) [6], ArrayExpress [7], Expression Atlas [8], European Nucleotide Archive (ENA) [9], The Cancer Genome Atlas (TCGA) [10], and Genotype-Tissue Expression (GTEx) [11]. Public transcriptomic databases offer an ever-increasing amount of primary datasets which, if used for coexpression analysis, can produce findings that transcend the scope of each original experiment [12].
There are multiple RNA-Seq-based coexpression webtools for a vast variety of species [13,14,15,16], with a significant number of tools studying gene coexpression in Homo sapiens [17,18,19], a field of particular interest, as unravelling the coexpression relationships in human genes can lead to a better understanding of specific metabolic pathways that can potentially elucidate the primary molecular mechanisms behind diseases [20] or reveal novel gene functional partners [4,21]. Here, we describe HGCA2.0, a web-based coexpression tool for Homo sapiens, created using 3500 representative bulk RNA-Seq samples from GTEx, and we present several use cases for human genes.
2. Materials and Methods
2.1. Transcriptomic Data Processing
GTEx version 8.0 RNA-Seq gene read count and TPM-normalised [22,23] expression data (phs000424.v8.p2, 5 May 2017 released), as well as their corresponding metadata, were downloaded from GTEx Portal [11], which offers high-quality curated RNA-Seq data from various human tissues, processed with the same protocol, and ArrayExpress. This GTEx version includes RNA-Seq data from 17,382 samples of 54 tissues from 948 post-mortem donors [24]. GTEx TPM expression data for 56,200 genes were only used to discover non-expressed genes. The lowest non-zero TPM expression value replaced zero TPM values, so that all expressions could be log2 transformed. Genes with zero standard deviation across all samples were identified and subsequently removed, this accounted for 322 genes. All 44 Y chromosome pseudoautosomal genes, denoted by a “_PAR_Y” suffix in their Ensembl [25] gene version code, were among them. Furthermore, another 447 genes with deprecated Ensembl gene stable IDs according to Ensembl release 99 Biomart [26], were also removed. Finally, cell-line samples were deleted, leaving 16,704 samples remaining. Afterwards, read count data corresponding to the remaining genes and samples were normalised using the normalizeTissueAware function in YARN [27], a wrapper for the qsmooth normalisation algorithm [28], which normalises all samples with the assumption that the statistical distribution of counts should be similar among samples of the same tissue rather than across all samples.
2.2. Gene Coexpression Tree Construction
Through custom PHP scripts, pairwise correlations between samples or genes were calculated using Pearson’s Correlation Coefficient (PCC or r-value) [29]. The correlation values were transformed to distance values using the d = 1 − r formula [30], and hierarchical clustering of samples or genes was performed on the transformed pairwise distance values through the Phangorn [31] R package implementation of UPGMA [32].
In order to determine the representative GTEx samples, and create the HGCA2.0 gene coexpression tree based on them, we followed a procedure previously described [33]: using the normalised expression data of 55,431 Homo sapiens genes in 16,704 samples, r-values were calculated for each sample pair and a sample distance matrix was created in PHYLIP format [34]. This ensures that all distances have positive values, with a range between 0 and 2, where 0 represents complete correlation, and 2 represents complete anti-correlation. A sample correlation tree in Newick format [35] was produced, using the distance matrix of samples as input. Each leaf of the produced tree corresponded to a unique GTEx sample.
As our goal was to study the global (i.e., condition/tissue-independent) coexpression landscape of Homo sapiens, the most representative samples of the dataset were selected to minimise tissue bias (Figure S1). Tree pruning was performed on the tree of 16,704 sample-leaves using a previously described custom-made iterative PHP algorithm [2], which automatically prunes adjacent leaves in a cladogram, producing a tree of 3500 leaves which corresponded to the most distinct representative samples (Figure S2).
To calculate the r-values between all gene pairs, gene expression values of those 3500 samples were used to create a distance matrix of genes, in a similar manner as the distance matrix of samples. The gene distance matrix was used to construct a coexpression tree of 55,431 genes, which were represented as leaves. Genes lying in the same clade are considered coexpressed.
2.3. External Data Collection and Biological Term Enrichment Calculation
HGNC [36] gene symbols and descriptions, as well as Ensembl gene stable IDs, were downloaded from Ensembl Biomart, gene ontologies from Gene Ontology [37], biological pathways from KEGG [38] and WikiPathways [39], transcription factor target genes from ENCODE [40] through Harmonizome [41] and ReMap2020 [42], gene-disease associations from OMIM [43] and DisGeNet [44], protein domains from Pfam [45], and cytogenetic band coordinates from the NCBI Genome Decoration Page (https://www.ncbi.nlm.nih.gov/genome/tools/gdp) (accessed on 20 January 2023). All data were downloaded and parsed using in-house PHP scripts, either through the BioMart XML-based data retrieval system or directly from their respective websites. We intend to update the biological term data each time a new GTEx version is released and a new gene coexpression tree is calculated. Gene term enrichment analysis p-value calculations are based on the Hypergeometric Distribution [46] and the False Discovery Rate (FDR) [47] corrected.
2.4. Webtool Implementation and Usage
A MySQL relational database was designed to store all required data, i.e., gene expression values and metadata for each sample, as well as human gene biological terms. The web server is hosted on a 16-core, 64 GB memory, Ubuntu 22.04 Linux system. Website development was based on fully validated HTML5 by HTML validator (https://www.gueury.com/) (accessed on 20 January 2023) and CSS, along with Bootstrap (https://getbootstrap.com/) (accessed on 20 January 2023) styling library and JavaScript. All backend scripts were written in PHP and run on an Apache 2.4.52 web server with verified HTTPS protocol.
On the main page of the website, the user initially inputs a human Ensembl gene stable ID or HGNC gene symbol (henceforth, the “driver gene”), and a gene coexpression clade whose size is closest to 25 genes is displayed, along with a scale bar (referring to the distance-transformed PCC) at the top. Genes in the coexpression clade are represented as terminal nodes (“leaves”), which are progressively connected through internal nodes, which, in turn, are represented as branching points (Figure 1). The internal node number, from the driver gene leaf to the root of the clade, is displayed below the tree visualisation. The clade size can be increased or decreased by adding or subtracting internal nodes, with a maximum clade size of up to 25% of the genes studied. Each clade leaf name contains an Ensembl gene stable ID, an HGNC gene symbol, and a gene description. To change driver gene, the user clicks on a different Ensembl gene stable ID. Although the same coexpression clade will be displayed, when choosing a driver gene located in a different subclade, this subclade can be isolated and studied by reducing the clade size. To find more information on any gene of the clade, the user may click on a gene symbol to visit the corresponding gene entry in Genecards [48]. The constructed coexpression clade can be downloaded in Newick format [35] or viewed in iTOL tree viewer [49]. A table located below the gene clade, contains the descriptions of the gene-leaves. The gene list of the clade can also be downloaded or exported to the g:Profiler [50], Genemania [51], Pathway Commons [52], FLAME [53], STRING [54], and EnrichR [55] websites for further analyses.
Figure 1.

The five branching points (depicted as numbered dots), from the driver gene leaf (GNG4) until the root of the clade, constitute the internal nodes of this coexpression clade.
To perform a gene term enrichment analysis using the genes of the current clade, an enrichment category needs to be selected from a drop-down menu, which appears right below the coexpression clade. The analysis is performed on the fly and the enrichment results are displayed on the enrichment summary table. Only terms with an FDR-adjusted p-value ≤ 0.05 are presented, and ranked in p-value ascending order. Furthermore, for each term, its over-representation rate (observed/expected) and hit percentage (appearance in the coexpression clade/appearances in all available genes) are displayed. The change in clade size affects the results of the enrichment analysis. A smaller clade might not be able to deem terms as statistically significant, and only on a tree of increased size may those terms be revealed. On the other hand, a larger clade might contain smaller subclades of genes with different biological functions which might be revealed by decreasing the tree size. As such, it is at the user’s discretion to determine the optimal tree size, through the observation of the fluctuations of the FDR-adjusted p-values of the enriched biological terms or other metrics. Below the enrichment table, a full list of the genes of the clade, along with all the terms of that category that describe them, is displayed, linking to the corresponding website entries.
2.5. API Access
HGCA2.0 provides access to all coexpression and enrichment results through a public JSON-based Application Programming Interface (API) endpoint, keyed on an Ensembl gene stable ID, a tree node number and, optionally, an enrichment analysis category 2-character keyword. For example, using https://www.michalopoulos.net/hgca2.0/api/ENSG00000114391/5/bp (accessed on 20 January 2023) returns the coexpression clade of the driver gene ENSG00000114391 with 5 internal nodes in Newick format, the driver gene details, the coexpression clade gene list, and the enriched “Gene Ontology: Biological Process” terms ranked by p-value. If a wrong (or no) keyword is typed, then no enrichment analysis will be performed. Instructions to developers can be found in the API section of the “Help” page of the HGCA2.0 website.
2.6. STRING Analysis
STRING is a webtool performing protein-protein interaction (PPI) network construction by incorporating known and predicted interactions between proteins, as well as interactions based on text-mining, co-expression, and homology, which are scored relative to their evidence strength. Additionally, STRING offers multiple network metrics and built-in enrichment analysis categories. To perform benchmarking of HGCA2.0, and 4 other popular webtools also studying condition-independent gene coexpression analysis in Homo sapiens, i.e., COXPRESdb [56], GeneFriends [18], ARCHS4 [57], and SEEK [58], various metrics of STRING v11.5 were used as independent comparison measures: The gene of interest was used as the driver gene in HGCA2.0, to produce a default coexpression clade (a coexpression clade with ~25 leaves) and its corresponding list of coexpressed genes. The same driver gene was used as the input for the rest of the coexpression webtools as follows: In COXPRESdb, hsa-u.4 was used as the coexpression collection for analysis, in GeneFriends, both GTEx and SRA were selected as data source with samples of all tissues, in SEEK, multi-tissue profiling dataset was selected and ARCHS4 was used as is, since there were no configurations available. The gene lists of the top-ranked coexpressed genes (including the driver gene), as well as that of HGCA2.0, underwent STRING multiple protein analysis, ensuring that each list contained the same number of genes mapped by STRING. STRING protein-protein interaction network generation was performed by removing any “co-expression” interactions and setting a high confidence cut-off (0.700). The metrics used for the evaluation of the tools include, “Number of Edges”, “Expected Number of Edges”, “Average Node Degree”, “Avg. Local Clustering Coefficient” [59], “PPI enrichment p-value”, and Gene Ontology: Biological Process and KEGG Pathways biological term enrichment analyses available in STRING.
3. Results
3.1. Use Cases
3.1.1. Ribosomal Proteins
The human 80S ribosome is a complex of 80 proteins and 4 RNA molecules [60]. RPL11, coding Ribosomal Protein L11, was used as the input to HGCA2.0. The webtool produced a clade that was expanded up to 14 internal nodes and contained 87 genes. Of those genes, 75 were ribosomal proteins (Figure 2). Enrichment analyses in all Gene Ontology aspects, as well as in KEGG and WikiPathways, highlighted ribosome-related terms, achieving very low p-values (Table 1). In addition, Pfam showed several ribosome-specific families of proteins, and DisGeNet linked genes of the clade to Diamond-Blackfan anaemia, a known ribosomopathy [61], and to several of the disease’s clinical features, such as short stature, cleft palate, and thumb deformities [62]. Finally, ENCODE revealed a large number of enriched transcription factors targeting almost all of the 87 coexpressed genes.
Figure 2.
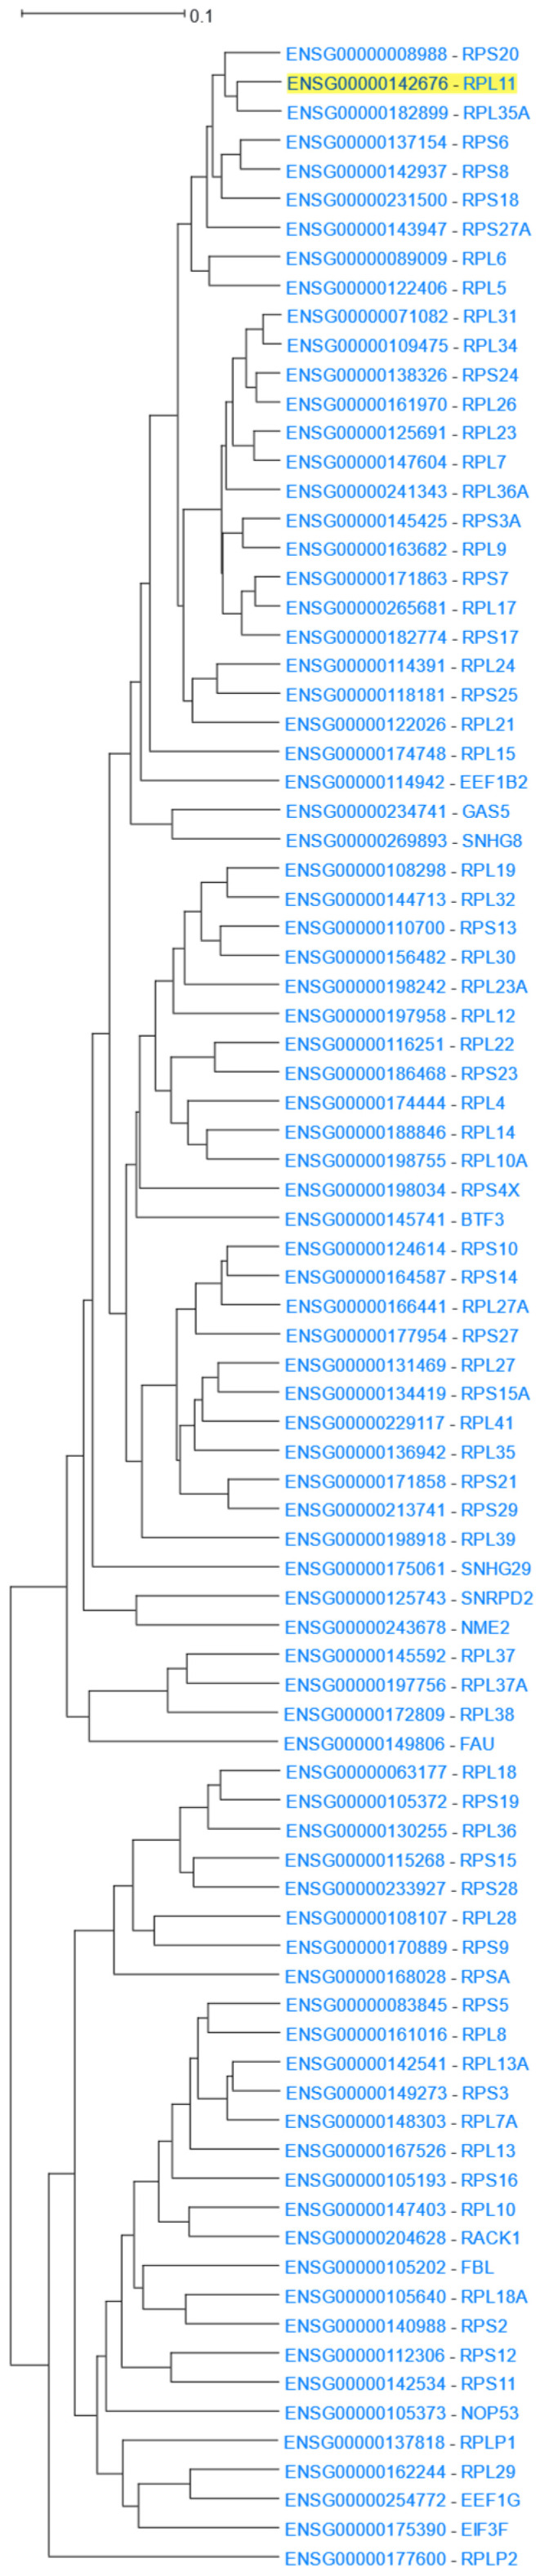
RPL11 14 internal node HGCA2.0 coexpression clade.
Table 1.
Selected top gene term enrichments of the coexpressed genes to RPL11 in HGCA2.0.
| Category | p-Value | Term ID | Description |
|---|---|---|---|
| GO: Biological Process | 7.9 × 10−174 | GO:0006614 | SRP-dependent cotranslational protein targeting to membrane |
| GO: Molecular Function | 1.7 × 10−149 | GO:0003735 | Structural constituent of ribosome |
| GO: Cellular Component | 2.0 × 10−175 | GO:0022626 | Cytosolic ribosome |
| 4.8 × 10−148 | GO:0044391 | Ribosomal subunit | |
| KEGG | 4.4 × 10−133 | hsa03010 | Ribosome—Homo sapiens (human) |
| WikiPathways | 1.7 × 10−154 | WP477_r108309 | Cytoplasmic Ribosomal Proteins |
| DisGeNet | 4.2 × 10−47 | C1260899 | Anemia, Diamond-Blackfan |
| Pfam | 3.9 × 10⁻⁵ | Ribosomal_L7Ae | Ribosomal protein L7Ae/L30e/S12e/Gadd45 family |
3.1.2. Metallothioneins
Metallothioneins have a high percentage of cysteine residues and bind to various heavy metals. They are regulated at the transcriptional level by both heavy metals and glucocorticoids [63]. MT1M (Metallothionein 1M) was used as the driver gene in HGCA2.0. The clade produced was reduced to 7 internal nodes and contained 10 genes (Figure 3), 9 of which belonged to metallothioneins, and 4 of them being insufficiently annotated pseudogenes. A GO Biological Process enrichment analysis identified terms related to stress response to metal ions, such as copper, cadmium, and zinc, and detoxification of inorganic compounds, such as copper ions (Table 2). A GO Molecular Function analysis also proposed binding to metals, such as zinc ions, as enriched terms. A KEGG biological pathway analysis highlighted the term “mineral absorption” in humans, and WikiPathways displayed the terms “zinc homeostasis” and “copper homeostasis”. A Pfam analysis assigned the proteins of the coexpressed genes to the Metallothionein family. Finally, a transcription factor analysis via ReMap revealed two transcription factors of the zinc finger family (zinc finger proteins 879 and 26) as targeting the genes of the clade.
Figure 3.

HGCA2.0 MT1M 5 internal node coexpression clade.
Table 2.
Selected top gene term enrichments of the coexpressed genes to MT1M in HGCA2.0.
| Category | p-Value | Term ID | Description |
|---|---|---|---|
| GO: Biological Process | 2.6 × 10⁻¹⁴ | GO:1990169 | Stress response to copper ion |
| 2.6 × 10⁻¹⁴ | GO:0010273 | Detoxification of copper ion | |
| 2.9 × 10⁻¹⁴ | GO:0097501 | Stress response to metal ion | |
| 2.9 × 10⁻¹⁴ | GO:0061687 | Detoxification of inorganic compound | |
| GO: Molecular Function | 8.8 × 10⁻⁶ | GO:0008270 | Zinc ion binding |
| 1.8 × 10⁻⁵ | GO:0046914 | Transition metal ion binding | |
| KEGG | 1.8 × 10⁻¹¹ | hsa04978 | Mineral absorption—Homo sapiens (human) |
| WikiPathways | 7.9 × 10⁻¹³ | WP3529_r106738 | Zinc homeostasis |
| 3.9 × 10⁻¹² | WP3286_r106367 | Copper homeostasis | |
| Pfam | 3.0 × 10⁻¹⁶ | Metallothio | Metallothionein |
| ReMap | 7.6 × 10⁻⁵ | ZNF879 | Zinc finger protein 879 |
| 1.7 × 10⁻² | ZNF26 | Zinc finger protein 26 |
3.1.3. MHC Class I and Class II Protein Clusters
Major Histocompatibility Complex class II (MHC-II) proteins are known to function at the early stages of immune response, by presenting processed peptides to CD4+ T-lymphocytes [64]. HLA-DM is a MHC-II protein heterodimer consisting of an α and a β chain which are encoded by the HLA-DMA and HLA-DMB genes, respectively [65]. HLA-DM regulates the loading of peptides into MHC-II molecules of the antigen-presenting cells [66,67]. HLA-DMA (Major Histocompatibility Complex, Class II, DM Alpha) was used as a driver gene in a HGCA2.0 analysis. A clade that was reduced to 7 internal nodes was produced. The clade contained 14 gene-leaves, 13 of which were HLA or HLA-related genes (Figure 4). The most correlated gene to HLA-DMA was that of its binding partner, HLA-DMB (Major Histocompatibility Complex, Class II, DM Beta). A GO enrichment analysis revealed terms of antigen presentation via MHC class II in Biological Process aspect, binding to MHC class II proteins in Molecular Function aspect, and MHC class II complex in Cellular Component aspect (Table 3). A KEGG biological pathway analysis showed the presentation and processing of antigens in humans as the top function, and a Pfam analysis showed as over-represented, families of α and β chains of MHC class II and a protein family corresponding to the C1-set domain of immunoglobulin. A ReMap enrichment analysis showed over 40 enriched transcription factors, with the top two being SMAD5 and ZBED1. In the coexpression clade, the only gene which was not described by any biological term was a “To be Experimentally Confirmed” (TEC) non-coding gene, AC133065.3, whose most correlated gene was CIITA. Given that the genomic coordinates of AC133065.3 fall within CIITA genomic boundaries, both have the same transcription orientation (Figure S3) and display similar expression patterns, AC133065.3 might constitute a CIITA alternative monoexonic transcript, sharing common transcriptional regulatory mechanisms.
Figure 4.

HGCA2.0 HLA-DMA coexpression clade. The 7 internal node clade is included in the green box, while the expanded 14 internal node clade is included in the red box.
Table 3.
Selected top gene term enrichments of the coexpressed genes to HLA-DMA in HGCA2.0.
| Category | p-Value | Term ID | Description |
|---|---|---|---|
| GO: Biological Process | 1.9 × 10⁻¹⁹ | GO:0019886 | Antigen processing and presentation of exogenous peptide antigen via MHC class II |
| 1.9 × 10⁻¹⁹ | GO:0002495 | Antigen processing and presentation of peptide antigen via MHC class II | |
| 1.9 × 10⁻¹⁹ | GO:0002504 | Antigen processing and presentation of peptide or polysaccharide antigen via MHC class II | |
| GO: Molecular Function | 1.8 × 10⁻¹⁵ | GO:0023026 | MHC class II protein complex binding |
| 1.2 × 10⁻¹⁴ | GO:0032395 | MHC class II receptor activity | |
| GO: Cellular Component | 1.9 × 10⁻³⁴ | GO:0042613 | MHC class II protein complex |
| KEGG | 2.1 × 10⁻²⁴ | hsa04612 | Antigen processing and presentation—Homo sapiens (human) |
| Pfam | 1.6 × 10⁻²⁵ | C1-set | Immunoglobulin C1-set domain |
| 4.4 × 10⁻¹⁶ | MHC_II_alpha | Class II histocompatibility antigen, alpha domain | |
| 1.0 × 10⁻¹⁵ | MHC_II_beta | Class II histocompatibility antigen, beta domain | |
| ReMap | 2.8 × 10⁻⁴ | SMAD5 | SMAD family member 5 |
| 2.8 × 10⁻⁴ | ZBED1 | Zinc finger BED-type containing 1 |
The coexpression clade was further expanded up to 14 internal nodes, revealing a total of 41 genes (Figure 4), among which additional MHC Class II family genes (HLA-DQB2, HLA-DQA2, HLA-DRB9 and HLA-DRB6) were identified. Moreover, essential genes related to innate and adaptive immune response (e.g., TNF, NFKBIE, IRF4, IL2RA, STX4) were also identified. In particular, TNF (Tumour Necrosis Factor) encodes for a pleiotropic cytokine, which binds to its membrane receptors, TNF receptor type I (TNFR1) and TNF receptor type II (TNFR2), and participates in cellular responses [68,69]. NFΚBIE encodes for an essential negative feedback regulator of the NF-κB transcription factor which regulates immune responses, B cell proliferation and survival, cancer phenotype establishment, etc., [70,71,72]. In addition, the IRF4 transcription factor, a member of the IRF family, has a regulatory role in the immune response, proliferation, and differentiation of immune system cells [73,74]. An enrichment analysis on the expanded coexpression clade, revealed that terms related to defence and immune response were more prominent compared to the analysis for the initial 7 internal node clade: “adaptive immune response” had an adjusted p-value of 6.2 × 10⁻¹⁷ in the 14 internal node clade compared to 1.4 × 10⁻¹¹ in the 7 internal node one.
NLR family CARD domain containing 5 (NLRC5) is constitutively expressed in a multitude of human tissues, but predominantly in hematopoietic cells. NLRC5 contains a nuclear localisation signal (NLS) enabling its translocation into the nucleus upon induction of cells by certain stimuli. NLRC5 lacks a DNA-binding domain and interacts with a plethora of transcription factors and multi-protein complexes to exert its well-described regulatory role in stimulus-induced activation of Major Histocompatibility Complex class I (MHC-I) genes [75,76]. An NLRC5-centered HGCA2.0 analysis generated a clade that was reduced to 6 internal nodes, which contained 14 genes in total (Figure 5). The closest neighbouring leaves were composed of MHC-I members (HLA-A/B/C/E/F), in line with their aforementioned NLRC5-induced transactivation. Importantly, B2M, PSMB9, and TAP1 [75,76] were composites of the second mostly correlated subclade. A GO enrichment analysis underscored the antigen processing and presentation via MHC-I molecules as one of the most significantly over-represented terms (Table 4). Furthermore, NLRC5 has been proposed as a main component of NLRP3 inflammasome reconstitution, in response to immunogenic stimuli or Damage Associated Molecular Patterns (DAMPs). Inflammasome’s activity, among other things, mediates Caspase 1 (CASP1) maturation [77]. Both CASP1 and its inhibitor, CARD16, were identified as significantly coexpressed, supported by GO Biological Process, KEGG pathways, and WikiPathways analyses, which highlighted immune-related inflammatory responses and cytokine-mediated signalling pathways as enriched. The inflammasome complex along with the MHC-I complex were also identified as the most enriched GO Cellular Component terms associated with NLRC5 and its coexpressed genes.
Figure 5.

HGCA2.0 NLRC5 6 internal node coexpression clade.
Table 4.
Selected top gene term enrichments of the coexpressed genes to NLRC5 in HGCA2.0.
| Category | FDR | Term ID | Description |
|---|---|---|---|
| GO: Biological Process | 3.1 × 10⁻¹⁷ | GO:0042590 | Antigen processing and presentation of exogenous peptide antigen via MHC class I |
| 1.0 × 10⁻¹² | GO:0019221 | Cytokine-mediated signaling pathway | |
| GO: Molecular Function | 3.3 × 10⁻⁴ | GO:0042288 | MHC class I protein binding |
| GO: Cellular Component | 4.7 × 10⁻¹⁷ | GO:0042612 | MHC class I protein complex |
| KEGG Pathways | 2.2 × 10⁻¹¹ | hsa04612 | Antigen processing and presentation—Homo sapiens (human) |
| Pfam | 2.8 × 10⁻¹³ | MHC_I_C | MHC_I C-terminus |
| 1.4 × 10⁻⁴ | CARD | Caspase recruitment domain |
3.1.4. STAT1 Transcription Factor
STAT1 (Signal Transducer and Activator of Transcription 1) is a transcription factor and a member of the STAT family of proteins. STAT1 is activated by type I interferons, mediates the expression of various genes that play a role in cell survival in response to various stimuli and pathogens, and can form dimers with other members of the same family [78]. STAT1 was used as the driver gene to HGCA2.0 and the produced clade was expanded to 5 internal nodes with 34 gene-leaves, many of which were related to interferons (Figure 6). A GO Biological Process enrichment analysis highlighted defence response to virus terms as the top enriched ones (Table 5). KEGG and DisGeNet over-representation analyses showed an association with various viral diseases. A WikiPathways enrichment analysis showed the involvement of STAT1 and other clade genes, such as genes belonging to the OAS family (OAS1, OAS2, OAS3, OASL), in the response to human coronaviruses. Finally, both ENCODE and ReMap transcription factor analyses showed STAT2 as the top transcription factor, targeting more than 2/3 of the genes of the clade.
Figure 6.

HGCA2.0 STAT1 5 internal node coexpression clade.
Table 5.
Selected top gene term enrichments of the coexpressed genes to STAT1 in HGCA2.0.
| Category | p-Value | Term ID | Description |
|---|---|---|---|
| GO: Biological Process | 2.2 × 10⁻³³ | GO:0051607 | Defense response to virus |
| KEGG | 7.7 × 10⁻¹¹ | hsa05160 | Hepatitis C—Homo sapiens (human) |
| 8.4 × 10⁻¹¹ | hsa05164 | Influenza A—Homo sapiens (human) | |
| WikiPathways | 2.1 × 10⁻¹¹ | WP4880_r109979 | Host-pathogen interaction of human corona viruses—Interferon induction |
| 3.4 × 10⁻⁸ | WP4868_r109974 | Type I Interferon Induction and Signaling During SARS-CoV-2 Infection | |
| Pfam | 6.0 × 10⁻¹¹ | OAS1_C | 2’-5’-oligoadenylate synthetase 1, domain 2, C-terminus |
| DisGeNet | 4.7 × 10⁻²⁸ | C0021400 | Influenza |
| 6.3 × 10⁻¹³ | C0042769 | Virus Diseases | |
| 1.8 × 10⁻¹⁰ | C0019196 | Hepatitis C | |
| ENCODE | 2.6 × 10−40 | STAT2 | Signal transducer and activator of transcription 2 |
| ReMap | 5.9 × 10⁻¹⁶ | STAT2 | Signal transducer and activator of transcription 2 |
3.1.5. TMPRSS2 in Relation to COVID-19 Infection
TMPRSS2 (Transmembrane Serine Protease 2) encodes for a transmembrane protein belonging to the type 2 serine protease family with a role in epithelial homeostasis. Several viruses use TMPRSS2 for cell invasion [79]. The SARS-CoV-2 virus has been found to infect the human body via the ACE2 receptor in combination with TMPRSS2 [80]. TMPRSS2 was used as the driver gene in a HGCA2.0 analysis and the produced clade was expanded up to 6 internal nodes and contained 37 genes (Figure 7). A GO Biological Process analysis revealed terms related to epithelial cells and intercellular binding, which is in agreement with SARS-CoV-2 attachment to epithelial cells (Table 6). GO Cellular Component and KEGG biological pathways analyses also showed terms related to intercellular binding. Among the top three transcription factors discovered by ENCODE, two were factors related to the zinc finger family and the third one was ESR1 (Estrogen Receptor 1). Additionally, a ReMap analysis found, among several other transcription factors, that ESR1 targets 36 out of all 37 genes of the coexpression clade. The presence of ESR1 as a factor targeting TMPRSS2 and genes which are coexpressed with it, may explain the distinct fatality patterns between males and females [81,82].
Figure 7.

HGCA2.0 TMPRSS2 6 internal node coexpression clade.
Table 6.
Selected top gene term enrichments of the coexpressed genes to TMPRSS2 in HGCA2.0.
| Category | p-Value | Term ID | Description |
|---|---|---|---|
| GO: Biological Process | 1.7 × 10⁻⁴ | GO:0007043 | Cell-cell junction assembly |
| 3.2 × 10⁻⁴ | GO:0030855 | Epithelial cell differentiation | |
| 3.2 × 10⁻⁴ | GO:0045216 | Cell-cell junction organization | |
| 9.6 × 10⁻⁴ | GO:0060429 | Epithelium development | |
| GO: Cellular Component | 1.4 × 10⁻³ | GO:0043296 | Apical junction complex |
| 1.4 × 10⁻³ | GO:0005911 | Cell-cell junction | |
| KEGG | 1.5 × 10⁻³ | hsa04514 | Cell adhesion molecules (CAMs)—Homo sapiens (human) |
| 1.5 × 10⁻³ | hsa04530 | Tight junction—Homo sapiens (human) | |
| Encode | 8.9 × 10⁻⁵ | ZNF217 | Zinc finger protein 217 |
| 4.2 × 10⁻⁴ | ESR1 | Estrogen receptor 1 | |
| 4.3 × 10⁻³ | ZBTB7A | Zinc finger and BTB domain containing 7A |
3.1.6. Late Cornified Envelope Genes
Late cornified envelope (LCE) clusters of genes are stratum corneum proteins responsible for keratinisation. They are located in a ~380 Kbps region of 1q21.3 cytoband (Figure S4), which is part of a wider genomic region stretching ~1.9 Mbps, known as the epidermal differentiation complex [83]. LCE 1 and 2 group genes are primarily expressed in the skin [84]. C1orf68 (Chromosome 1 Open Reading Frame 68), also known as Skin-Specific Protein 32 (XP32), is located in the genomic region between the LCE 1 and 2 clusters. C1orf68 was used as the driver gene in a HGCA2.0 analysis, and the resulting clade was reduced to 5 internal nodes containing 12 genes, all of which, except for C1orf68, were LCE genes (Figure 8). A GO Biological Process enrichment analysis showed “keratinization” and “epidermis development” as top terms (Table 7), and WikiPathways revealed the “Vitamin D Receptor Pathway” term as over-represented. Pfam classified 10 of the coexpressed genes into the LCE protein family, and chromosome band analysis indicated all genes as located in 1q21.3, suggesting that this genomic co-localisation may be responsible for coexpression. A multiple protein sequence alignment of the coexpressed genes (Figure S5), using MUSCLE [85], showed a high degree of similarity between LCE1 and LCE2 genes, with the genes of each family being clustered in distinct subclades (Figure 9). The topology of the phylogenetic tree indicates that C1orf68 and LCE6A are ancient paralogues of the LCE 1 and 2 gene groups. SignalP 6.0 [86] predicted that none of the proteins contained any signal peptide. As none of the proteins of the coexpressed genes had any solved structure, a model could not be constructed in SWISS-MODEL [87] to predict the C1orf68 structure through homology modelling. The AlphaFold [88] prediction for C1orf68 (UniProt ID: Q5T750) was a Beta structure which matches with the 2-solenoid architecture (CATH ID: 2.150) of CATH [89]. On the other hand, AlphaFold predicted serpentine protein structures for the LCE proteins (e.g., UniProt ID: Q5T7P2 for LCE1A). The discovery of several tandem repeats (Figure S6) in the C1orf68 protein sequence by HHrepID [90] may justify the 2-solenoid architecture prediction.
Figure 8.

HGCA2.0 C1orf68 5 internal node coexpression clade.
Table 7.
Selected top gene term enrichments of the coexpressed genes to C1orf68 in HGCA2.0.
| Category | p-Value | Term ID | Description |
|---|---|---|---|
| GO: Biological Process | 2.8 × 10⁻¹⁹ | GO:0031424 | Keratinization |
| 1.6 × 10⁻¹⁸ | GO:0008544 | Epidermis development | |
| WikiPathways | 6.9 × 10⁻⁵ | WP2877_r105854 | Vitamin D Receptor Pathway |
| Pfam | 2.1 × 10⁻³¹ | LCE | Late cornified envelope |
| Chromosome Band | 7.4 × 10⁻²⁹ | 1q21.3 |
Figure 9.

Phylogenetic tree resulting from MUSCLE multiple sequence alignment of the protein sequences of the genes of the HGCA2.0 C1orf68 (XP32) coexpression clade, as viewed by Dendroscope [91].
3.1.7. Heat Shock Protein 90
Heat shock proteins (HSP) were named after their elevated expression during heat shock response [92]. The HSP90 (90kDa) chaperone machinery plays an important role in the regulation of proteostasis during physiological and stress conditions in eukaryotic cells, and it is involved in many cellular processes, beyond protein folding and assembly, such as signal transduction, cell cycle control, DNA repair, development, immune response, and neurodegenerative diseases [93]. HSP90 has three structural domains: the N-terminal domain (NTD), in which the ATP binding site is located, the middle domain (MD), and the C-terminal domain (CTD) which is responsible for the dimerisation [94].
There are two HSP90 genes which encode HSP90A and HSP90B. HSP90A is induced by heat shock. It appears across cytosol in all eukaryotes and is duplicated in vertebrates into HSP90AA1 and HSP90AB1 [95]. HSP90B1 is constitutively expressed in the cytosol [96]. It is present in the endoplasmic reticulum in all eukaryotes, with the exception of some fungal species, and is associated with molecular chaperones which transmit information within the compartment and help transport “passenger proteins” across membranes.
Using HSP90AA1 as the driver gene, HGCA2.0 produced a coexpression clade which was expanded up to 14 internal nodes and contained 31 gene-leaves, 16 of which were HSP or HSP-related genes (Figure 10). HSPH1 (Heat shock protein family H) and CHORDC1 (cysteine- and histidine-rich domain-containing protein) appear as the most highly coexpressed genes with HPS90AA1. Indeed, HSP90AA1 is highly coexpressed with HSPH1 during head and neck squamous cell carcinoma (HNSCC), which means that these factors could be either prognostic biomarkers or potential clinical targets [97]. Furthermore, HSP90 complexes interact with CHORDC1 as an ADP-dependent HSP90-interacting protein [98]. The HSP90AA1 paralog, HSP90AB1, is also found on a neighbouring subclade. A GO Biological Process enrichment analysis displayed “protein folding”, “regulation of cellular response to heat”, and “chaperone-mediated protein folding”, as top processes, the GO Molecular Function showed “unfolded protein binding”, “chaperone binding”, and “heat shock protein binding”, and GO Cellular Component analysis revealed “chaperone complex” as the top term (Table 8). An ENCODE analysis exhibited HSF1 (heat shock transcription factor 1) and PPARGC1A (PPARG coactivator 1 alpha) as the top transcription factors related to HSP90AA1. This association between HSF1 and HSP90AA1 is confirmed by studies that suggest that HSF1, the master transcriptional regulator of heat shock response, allows the inducible expression of HSP90AA1 upon binding to heat shock elements (HSEs), which are located upstream of HSP90A [96]. A DisGeNET analysis showed Tauopathies as one of the top related diseases associated with HSP90AA1. This finding is in accordance with previous studies, which proposed that changes in the expression levels of HSP90s and their co-regulators could drive tau deposition and neurotoxicity, leading to Alzheimer’s disease (AD) and other neurodegenerative diseases (tauopathies) [99]. Finally, a Pfam analysis displayed “CS domain”, “HSP90”, and “HSP70” as over-represented families which are related to HSP90AA1.
Figure 10.

HGCA2.0 HSP90AA1 14 internal node coexpression clade.
Table 8.
Selected top gene term enrichments of the coexpressed genes to HSP90AA1 in HGCA2.0.
| Category | p-Value | Term ID | Description |
|---|---|---|---|
| GO: Biological Process | 2.9 × 10⁻¹⁷ | GO:0006457 | Protein folding |
| 7.7 × 10⁻¹³ | GO:1900034 | Regulation of cellular response to heat | |
| 1.1 × 10⁻⁹ | GO:0061077 | Chaperone-mediated protein folding | |
| GO: Molecular Function | 7.8 × 10⁻¹² | GO:0051082 | Unfolded protein binding |
| 1.5 × 10⁻¹⁰ | GO:0051087 | Chaperone binding | |
| 3.4 × 10⁻¹⁰ | GO:0031072 | Heat shock protein binding | |
| GO: Cellular Component | 3.1 × 10⁻¹² | GO:0101031 | Chaperone complex |
| ENCODE | 1.1 × 10⁻²¹ | HSF1 | Heat shock transcription factor 1 |
| 2.6 × 10⁻²⁰ | PPARGC1A | PPARG coactivator 1 alpha (PPARGC1A) | |
| DisGeNET | 6.4 × 10⁻⁴ | C0949664 | Tauopathies |
| Pfam | 3.4 × 10⁻⁹ | CS | CS domain |
| 2.0 × 10⁻⁵ | HSP90 | Hsp90 protein | |
| 1.1 × 10⁻⁴ | HSP70 | Hsp70 protein |
Using HSP90B1 as the driver gene, HGCA2.0 produced a clade that was reduced to 5 internal nodes having 10 gene-leaves, 3 of which were HSP or HSP-related genes (Figure 11). A GO Biological Process enrichment analysis displayed “response to endoplasmic reticulum stress”, “response to topologically incorrect protein”, and “protein folding in endoplasmic reticulum”, as the top processes, the GO Molecular Function showed “protein disulfide isomerase activity”, “intramolecular oxidoreductase activity (transposing S-S bonds)”, “chaperone binding”, and “unfolded protein binding”, and a GO Cellular Component analysis revealed “endoplasmic reticulum lumen” and “endoplasmic reticulum chaperone complex” as the top terms (Table 9). An ENCODE analysis exhibited SP2 (Sp2 transcription factor), as the top functional element related to HSP90B1, whereas DisGeNET showed Spinocerebellar Ataxia 17 as one of the top related diseases associated with it.
Figure 11.

HGCA2.0 HSP90B1 5 internal node coexpression clade.
Table 9.
Selected top gene term enrichments of the coexpressed genes to HSP90B1 in HGCA2.0.
| Category | p-Value | Term ID | Description |
|---|---|---|---|
| GO: Biological Process | 2.8 × 10⁻¹⁴ | GO:0034976 | Response to endoplasmic reticulum stress |
| 1.3 × 10⁻¹⁰ | GO:0035966 | Response to topologically incorrect protein | |
| 6.7 × 10⁻¹⁰ | GO:0034975 | Protein folding in endoplasmic reticulum | |
| GO: Molecular Function | 2.4 × 10⁻⁶ | GO:0003756 | Protein disulfide isomerase activity |
| 2.4 × 10⁻⁶ | GO:0016864 | Intramolecular oxidoreductase activity, transposing S-S bonds | |
| 3.2 × 10⁻⁶ | GO:0051087 | Chaperone binding | |
| 4.6 × 10⁻⁶ | GO:0051082 | Unfolded protein binding | |
| GO: Cellular Component | 5.8 × 10⁻¹⁴ | GO:0005788 | Endoplasmic reticulum lumen |
| 2.9 × 10⁻¹⁰ | GO:0034663 | Endoplasmic reticulum chaperone complex | |
| ENCODE | 3.1 × 10⁻⁶ | SP2 | Sp2 transcription factor |
| DisGeNET | 1.4 × 10⁻⁷ | C1846707 | Spinocerebellar Ataxia 17 |
“Chaperone binding” and “unfolded protein binding” are shared enriched terms in both coexpression clades, as heat shock proteins interact with unfolded proteins preventing or reversing their aggregation, assisting their refolding to native structure [100]. “Regulation of cellular response to heat” appears only in the first clade because HSP90AA1 and HSP90AB1 are stress-induced while HSP90B1 is constitutively expressed [96]. That difference in expression patterns also explains why HSP90B1 is located in a different clade than that of HSP90AA1 and HSP90AB1.
3.1.8. Neurovascular Genes
NRP1 (Neuropilin 1) is a receptor for vascular endothelial growth factor (VEGF) and a member of the semaphorin family of proteins. It has been shown to regulate angiogenesis and vascular permeability [101]. A NRP1 analysis in HGCA2.0 produced a coexpression clade that was expanded to 5 internal nodes with a total of 34 genes (Figure 12). A GO Biological Process enrichment analysis (Table 10) highlighted terms related to cardiovascular system development, a result supported by a DisGeNet analysis, which contained blood-vessel-related diseases and anomalies. In addition, a large number of enriched terms were related to NRP1′s role as a receptor for VEGF, such as “vascular endothelial growth factor-activated receptor activity” in the GO Molecular Function, and “Robo4 and VEGF Signaling Pathways Crosstalk” and “VEGFA-VEGFR2 Signaling Pathway” in WikiPathways.
Figure 12.

HGCA2.0 NRP1 5 internal node coexpression clade.
Table 10.
Selected top gene term enrichments of the coexpressed genes to NRP1 in HGCA2.0.
| Category | p-Value | Term ID | Description |
|---|---|---|---|
| GO: Biological Process | 4.6 × 10⁻¹⁹ | GO:0001944 | Vasculature development |
| 4.6 × 10⁻¹⁹ | GO:0072358 | Cardiovascular system development | |
| 5.5 × 10⁻¹⁹ | GO:0048514 | Blood vessel morphogenesis | |
| GO: Molecular Function | 3.1 × 10⁻⁴ | GO:0004714 | Transmembrane receptor protein tyrosine kinase activity |
| 3.1 × 10⁻⁴ | GO:0001605 | Adrenomedullin receptor activity | |
| GO: Cellular Component | 3.4 × 10⁻⁴ | GO:1903143 | Adrenomedullin receptor complex |
| KEGG Pathways | 3.8 × 10⁻² | hsa04514 | Cell adhesion molecules (CAMs)—Homo sapiens (human) |
| 3.8 × 10⁻² | hsa05418 | Fluid shear stress and atherosclerosis—Homo sapiens (human) | |
| 3.8 × 10⁻² | hsa04270 | Vascular smooth muscle contraction—Homo sapiens (human) | |
| WikiPathways | 6.5 × 10⁻⁴ | WP3943_r106492 | Robo4 and VEGF Signaling Pathways Crosstalk |
| 6.5 × 10⁻⁴ | WP3888_r108912 | VEGFA-VEGFR2 Signaling Pathway | |
| DisGeNET | 2.7 × 10⁻⁸ | C1519670 | Tumour Angiogenesis |
| 1.2 × 10⁻⁷ | C1658953 | Tumour vasculature | |
| Pfam | 3.9 × 10⁻⁵ | RAMP | Receptor activity modifying family |
| 3.9 × 10⁻⁵ | CD34_antigen | CD34/Podocalyxin family | |
| 3.9 × 10⁻⁵ | Sox17_18_mid | Sox 17/18 central domain |
3.1.9. Olfactory Receptors
Olfactory receptors are a family of ~1000 genes responsible for the sense of smell, with about 60% constituting pseudogenes [102,103], and are all expressed in the olfactory sensory neurons [104]. Each odourant ligand can be recognised by multiple olfactory receptors with different affinity, and specific odourants can be bound to certain olfactory receptor families. The monogenic and monoallelic expression of olfactory receptors in a single olfactory neuron cell is due to the stochastic activation of a single allele of a single gene from an array of olfactory receptor genes [104]. OR1D2 (Olfactory Receptor Family 1 Subfamily D Member 2) was used as the input to HGCA2.0 and the resulting clade was expanded to 98 internal nodes containing 398 genes (Figure S7), 220 of which were olfactory receptors. Among the olfactory receptor leaves, smaller subclades of other gene families, such as Interferon Alpha family or Pregnancy Specific Beta-1-Glycoprotein family, were encountered. A particular characteristic of that clade was that its internal nodes were very close to its root, i.e., the cophenetic distances [105] of all its coexpressed gene pairs were similar. Cophenetic distances refer to the pairwise distances between genes, as these are depicted on a gene coexpression tree [32]. Essentially, the coexpression tree represents a distance matrix, where pairwise distances between its genes correspond to their Cophenetic distances. The comparison of the original Pearson correlation-based distance matrix with the Cophenetic distance matrix derived from the UPGMA-constructed coexpression tree can be used to measure the quality of the hierarchical clustering. When the pairwise distances between all 839 olfactory receptor genes and pseudogenes studied in HGCA2.0 were examined, the average distance prior to clustering was ~0.93. Their respective cophenetic distances derived from the UPGMA tree were also examined, with the average distance being ~0.96. Those distances corresponded to ~0.07 and ~0.04 Pearson correlation coefficients, respectively, meaning that, in any case, there was almost no correlation between any olfactory gene pair. When a STRING analysis was performed, using all 839 olfactory receptor genes that HGCA2.0 studied, STRING recognised only 376 non-pseudogenes. Out of 70,500 olfactory receptor gene pairs, 2973 had Pearson correlation-based coexpression interaction scores ranging from 0.048 to 0.520, with only two of them exceeding the default 0.400 cut-off.
A HGCA2.0 enrichment analysis of GO Biological Process highlighted terms related to stimulus detection as over-represented (Table 11). “Detection of a chemical stimulus involved in sensory perception of smell” which describes 180 of the 398 genes of the clade, was a top term. For this specific term, there are 387 genes described by it in the gene background library, 180 of which (46.5%) are located in this coexpression clade. Likewise, the GO Molecular Function highlighted the terms “olfactory receptor activity” and “G protein-coupled receptor activity”, and a GO Cellular Component analysis showed the coexpressed genes as part of membranes. The aforementioned terms are in accordance with the fact that olfactory receptors are members of the large family of G-protein-binding receptors and are therefore naturally associated with the cell membrane. A KEGG pathways analysis similarly highlighted the term “olfactory transduction”, and a Pfam analysis classified the same 180 genes into the olfactory receptor family. In addition, a WikiPathways analysis showed top terms for G-protein coupled receptors and interferon-mediated signalling pathways, the latter being enriched due to the appearance of 4 IFNA-family genes in the coexpression clade.
Table 11.
Selected top gene term enrichments of the coexpressed genes to OR1D2 in HGCA2.0.
| Category | p-Value | Term ID | Description |
|---|---|---|---|
| GO: Biological Process | 7.2 × 10−269 | GO:0050911 | Detection of chemical stimulus involved in sensory perception of smell |
| GO: Molecular Function | 1.5 × 10−285 | GO:0004984 | Olfactory receptor activity |
| 9.1 × 10−236 | GO:0004930 | G protein-coupled receptor activity | |
| GO: Cellular Component | 9.3 × 10−65 | GO:0016021 | Integral component of membrane |
| KEGG | 5.9 × 10−225 | hsa04740 | Olfactory transduction—Homo sapiens (human) |
| WikiPathways | 1.2 × 10⁻¹⁸ | WP455_r106426 | GPCRs, Class A Rhodopsin-like |
| 3.8 × 10⁻⁸ | WP4558_r107928 | Overview of interferons-mediated signaling pathway | |
| Pfam | 1.2 × 10−278 | 7tm_4 | Olfactory receptor |
In order to determine how the 839 olfactory receptor genes were distributed across the coexpression tree, a sliding window approach was implemented. The OR1D2 coexpression clade of 398 genes, was discovered to be the largest one, containing 180 olfactory receptor genes and 40 olfactory receptor pseudogenes. Another distinct olfactory receptor clade of 135 genes, contained 41 olfactory receptor genes and 41 olfactory receptor pseudogenes. This clade can be displayed by using OR51A7 as the driver gene and expanding the resulting coexpression clade to 77 internal nodes. The remaining 537 olfactory receptor genes studied in HGCA2.0 were scattered throughout the coexpression tree.
3.1.10. Glucocorticoid Receptor Signalling
NR3C1 (Nuclear Receptor Subfamily 3 Group C Member 1, also known as Glucocorticoid Receptor) is a nuclear receptor of the superfamily of ligand-dependent transcription factors, mediating the physiologic pleiotropic actions of glucocorticoids [106]. NR3C1 is ubiquitously expressed across almost all cell types, during all developmental stages. In the absence of glucocorticoids, the inactive NR3C1 is primarily located in the cytoplasm as a component of a multiprotein complex, including chaperones (of HSP70 and HSP90 family of proteins and PTGES3) and immunophilins (FKBP5 and FKBP4) [107]. Upon ligand binding, NR3C1 is conformationally changed, dissociates from the other proteins of the complex, homodimerises, and translocates into the nucleus, where NR3C1 homodimers bind to glucocorticoid receptor elements (GREs), regulating the expression of target genes [108], resulting in the regulation of up to 10–20% of the human genome [109]. NR3C1 was used as the driver gene in a HGCA2.0 analysis and the resulting clade was reduced to 3 internal nodes (Figure 13). The most correlated genes with NR3C1 were RB1 (RB transcriptional Corepressor 1) and KBTBD2 (Kelch Repeat and BTB Domain Containing 2). RB1 encodes for a negative regulator of the cell cycle (G1/S transition) and is known as the first reported oncosuppressor gene [110]. It has been proposed that NR3C1-mediated cell cycle arrest is induced when the activated NR3C1 inhibits the expression of G1-acting cyclin/CDK complexes, leading to Rb hypophosphorylation [111]. Therefore, RB1 seems to be involved in the NR3C1-mediated cell cycle arrest, and thus, was shown as a closely correlated gene. The function of KBTBD2 appears to be largely unexplored. KBTBD2 induces PIK3R1 ubiquitination, thus, its proteasome-mediated degradation. In the absence of KBTBD2, the concentration of PIK3R1 increases dramatically [112]. It has been proposed that free PIK3R1 negatively regulates PI3K signalling by competition with the Class IA PI3K complex (which is a heterodimer of PIK3R1 and PIK3CA, PIK3CB or PIK3CD) for binding to phosphotyrosine docking sites [113]. NR3C1 contains two such PI3K recruitment motifs that contribute to the NR3C1-PI3K interaction. The physical interaction between NR3C1 and the PIK3R1 subunit of PI3K is essential for the rapid non-genomic effects of glucocorticoids [114]. In another line of evidence, EZR phosphorylation by SRC induces the association of EZR with KBTBD2 [115]. As SRC is a component of both the plasma membrane and cytoplasmic NR3C1 complexes, mediating non-genomic NR3C1 signalling [108], and EZR is a cross-linker of plasma membrane proteins with actin cytoskeleton [116], EZR-KBTBD2 interaction might contribute to the regulation of non-genomic NR3C1 signalling [117]. Thus, KBTBD2 may be mechanistically associated with NR3C1 signalling (especially non-genomic signalling).
Figure 13.

HGCA2.0 NR3C1 3 internal node coexpression clade.
An HGCA2.0 enrichment analysis showed “intracellular steroid hormone receptor signaling” among the most significantly over-represented GO Biological Process terms (Table 12). The most highly enriched GO Molecular Function terms were: “transcription coactivator activity”, “sequence-specific DNA binding”, “transcription coregulator activity”, “modification-dependent protein binding”, and “nuclear hormone receptor binding”, all of which are congruent with the NR3C1 signalling pathway [118]. Among the most highly enriched GO cellular compartments were the nucleus and nucleoplasm. Glucocorticoid-activated NR3C1 shows heterogeneous organisation in the nucleus, being distributed between the nucleoplasm and membraneless compartments, the so-called nuclear foci; however, the functional significance of this localisation remains elusive [119]. Using the Chromosome Band analysis, both NR3C1 and TAF7 were shown as being located in the same cytogenetic region (5q31.3). NR3C1 and TAF7 are indeed positioned in relatively close physical proximity (~2Mbps) within 5q31.3; however, it is unlikely that this co-localisation is responsible for their coexpression relationship, as a dozen other genes, that do not appear in the coexpression clade of NR3C1, are located between them.
Table 12.
Selected top gene term enrichments of the coexpressed genes to NR3C1 in HGCA2.0.
| Category | p-Value | Term ID | Description |
|---|---|---|---|
| GO: Biological Process | 9.7 × 10⁻⁴ | GO:0030522 | Intracellular steroid hormone receptor signaling pathway |
| GO: Molecular Function | 1.2 × 10⁻² | GO:0003713 | Transcription coactivator activity |
| 1.3 × 10⁻² | GO:0140030 | Modification-dependent protein binding | |
| 1.3 × 10⁻² | GO:0035257 | Nuclear hormone receptor binding | |
| GO: Cellular Component | 1.6 × 10⁻² | GO:0005654 | Nucleoplasm |
| Chromosome Band | 4.5 × 10⁻⁴ | 5q31.3 |
3.1.11. ALS and LGMD Related Genes
Amyotrophic Lateral Sclerosis (ALS) and Limb-Girdle Muscular Dystrophies (LGMD) are neuromuscular conditions with the common characteristic that any one of a number of single gene mutations may cause them.
ALS is characterised by the loss of both upper and lower motor neurons, and is the most common form of motor neuron disorder [120]. Its onset may occur at any age, but peaks considerably among 54–67 years old, initially involving muscle atrophy, which progresses to swallowing difficulties, paralysis, and ultimately to death by neuromuscular respiratory failure. Patients typically survive for 2–5 years after the first symptoms occur, with 5–10% surviving more than 10 years [121]. Variants in some 30 genes are recognised as monogenic causes of ALS [122,123,124] and the disease has high estimated rates of inheritance [125], but for the large majority of patients, a genetic cause has not yet been identified [126]. Some of the known causal genes have functional relationships to one another and can be grouped accordingly by function, but no common functional pathway has been identified and the functions in which they are involved represent a diverse set of cellular processes [127].
LGMD are characterised by progressive atrophy and weakness of the hip and shoulder (limb-girdle) muscles, which may progress to other muscles of the body [128]. Age at onset, severity, and progression of symptoms may vary greatly from case to case [129]. The condition represents a set of genetic disorders with more than 30 different sub-types, most of which are associated with genetic defects in one or several specific known genes [130]. Most of these genes have known functional relationships to several of the others, and three broad categories of cellular function have been recently proposed [131].
To explore gene coexpression functional groupings, each of the causal genes of ALS (Table S1) and LGMD (Table S2) collected through the bibliography and Orphanet [132], were submitted to HGCA2.0, and coexpression clades for each one of them were produced. Clades were then explored manually, with the addition or subtraction of internal nodes, to identify significant functional enrichments.
Several ALS causal genes were found to inhabit gene clades which produce low p-value enrichments of terms related to the known functions of the gene (Table S3). These genes include the neuronal nicotinic acetylcholine receptor subunit CHRNA3 (Cholinergic Receptor Nicotinic Alpha 3 Subunit), whose clade was enriched for related functional terms such as response to nicotine, neuromuscular synaptic transmission, and acetyl choline binding; the kinesin axonal transporter of neurofilament proteins KIF5A (Kinesin Family Member 5A), whose clade was enriched for synapse, neuron projection, and nervous system; UNC13A (Unc-13 Homolog A) involved in vesicle maturation during exocytosis occupied a clade enriched for SNARE binding, synaptic vesicle cycle, and neurotransmitter secretion; and the NEFH (Neurofilament Heavy Chain) clade was enriched for the synapse and spontaneous neurotransmitter secretion, as well as Ras GTPase binding. MOBP (myelin-associated oligodendrocyte basic protein), thought to be involved in stabilisation of the myelin sheath, occupied a clade enriched for astrocyte projection, spinal cord injury, and optic disc oedema. Interestingly, OPTN (Optineurin), the protein product of which links MYO6 (myosin VI) to the Golgi complex [133], was observed to be coexpressed with a large cluster of genes highly enriched for muscle contraction and actin-myosin filament sliding. None of the ALS causal genes were observed to closely inhabit the same clade.
Similarly to ALS, a number of LGMD causal genes were found to inhabit clades enriched for terms related to the known functions of the gene (Table S4). However, unlike ALS, several clades were identified to include more than one of the disease query genes. SGCG, POMGNT1, DES, ANO5, MYOT, SGCD, BVES, and SGCA co-occupied a clade enriched for terms such as myofibril, contractile fibre, and muscle structure development. Distinct from this clade, but with enrichment of overlapping and closely related functions, such as myofibril assembly and sarcomere, was a clade co-occupied by TCAP, TTN, and CAV3. Three collagen genes, COL6A1, COL6A2, and COL6A3, were unsurprisingly coexpressed within a clade of extracellular matrix genes. LIMS2, a gene encoding for the focal adhesion protein PINCH-2, was coexpressed with a separate clade of genes involved in muscle contraction. DAG1 (Dystroglycan 1) was coexpressed among other genes that contribute to the dystrophin-associated glycoprotein complex, enriched in that specific term and also the more general term “peripheral nervous system development”. LMNA, encoding for part of the nuclear envelope, inhabited a clade that was enriched for cell adhesion and regulation of cellular component movement, as well as integrin binding and focal adhesion.
3.1.12. Growth Hormones
The Growth Hormone (GH) family is a cluster of similar genes that encode for proteins related to growth control, whose main member is growth hormone, also known as somatotropin, which is produced in the anterior pituitary gland and has an important role in controlling growth and cell division [134,135]. Specifically, in mammals, growth hormone 1 is encoded by GH1 [134]. The GH gene family also consists of GH2 which encodes for placental growth hormone [134], the chorionic somatomammotropin genes (CSH1 and CSH2), and chorionic somatomammotropin-like 1 (CSHL1), which are expressed in the placenta. Another member of the growth hormone family is prolactin (PRL), which is associated with gland differentiation and lactation in mammals [136,137]. CSHL1 was used as the input in HGCA2.0 and the resulting coexpression clade included all members of the GH family among the 24 genes listed (Figure 14). A GO Biological Process analysis ranked the response to growth hormone as the top term (Table 13). Enriched terms of growth hormone receptor signalling pathway and regulation of growth also emerged. Moreover, GO Molecular Function and KEGG pathway analyses showed hormone activity and neuroactive ligand-receptor interaction in humans as top functions, respectively, consistent with the presence of a variety of growth hormones and their receptors in the coexpression clade. In addition, DisGeNET and WikiPathways analyses highlighted pituitary diseases and Prader-Willi and Angelman syndromes, in which growth hormone production is known to be affected and therefore lead to developmental delay [138,139]. Finally, a Chromosome Band analysis showed an enrichment of genes in the chromosomal region 17q23.3, evidenced by the fact that five genes of the GH family (GH1, GH2, CSH1, CSH2, CSHL1) co-localize at the growth hormone locus [134,140].
Figure 14.

HGCA2.0 CSHL1 12 internal node coexpression clade.
Table 13.
Selected top gene term enrichments of the coexpressed genes to CSHL1 in HGCA2.0.
| Category | p-Value | Term ID | Description |
|---|---|---|---|
| GO: Biological Process | 1.5 × 10⁻¹² | GO:0060416 | Response to growth hormone |
| 7.5 × 10⁻¹² | GO:0060396 | Growth hormone receptor signaling pathway | |
| 7.3 × 10⁻⁹ | GO:0040008 | Regulation of growth | |
| GO: Molecular Function | 6.6 × 10⁻¹⁹ | GO:0005179 | Hormone activity |
| 7.8 × 10⁻¹³ | GO:0005131 | Growth hormone receptor binding | |
| KEGG Pathway | 2.3 × 10⁻¹⁶ | hsa04080 | Neuroactive ligand-receptor interaction—Homo sapiens (human) |
| 3.1 × 10⁻⁹ | hsa04935 | Growth hormone synthesis, secretion and action—Homo sapiens (human) | |
| DisGeNET | 2.1 × 10⁻¹⁵ | C0013338 | Pituitary dwarfism |
| 2.7 × 10⁻¹⁵ | C0032002 | Pituitary Diseases | |
| WikiPathways | 3.9 × 10⁻⁵ | WP3998_r106536 | Prader-Willi and Angelman Syndrome |
| Chromosome Band | 3.4 × 10⁻¹⁰ | 17q23.3 |
3.1.13. Antisense Genes
An antisense gene of a coding or non-coding (sense) gene is transcribed from the opposite strand to the strand the sense transcript is transcribed from. Antisense genes are primarily involved in gene expression regulation, although they might fulfil various roles [141]. HGCA2.0 studies 3627 genes which are labelled as “antisense” in their gene description, 1376 of which include the “-AS” suffix in their HGNC gene symbol. GATA3, NR2F1, and MEF2C, which are genes with known antisense transcripts, were used as drivers in HGCA2.0. In all three cases, the most coexpressed gene to each driver gene was its corresponding antisense transcript, being situated in the adjacent branch (Figure 15), which in turn discloses a possible functional association. Indeed, GATA3-AS1-driven tumour growth and metastasis in liver cancer are mediated by GATA3 [142], and NR2F1-AS1 was shown to have adverse effects in pancreatic cancer by activating the NR2F1/AKT/MTOR axis [143]. In the human genome, the primary transcripts of NR2F1 and MEF2C constitute divergent overlapping pairs with their antisense transcripts, while the primary transcript of GATA3 and its antisense form a divergent non-overlapping gene pair, with an intergenic distance of less than 1.5 Kbps between their 5′ ends (Figure S8).
Figure 15.

HGCA2.0 coexpression clades of sense genes and their respective antisenses; (a) HGCA2.0 GATA3 2 internal node coexpression clade; (b) HGCA2.0 NR2F1 3 internal node coexpression clade; (c) HGCA2.0 MEF2C 2 internal node coexpression clade.
3.2. Coexpression Tool Benchmarking
13 genes of the use cases described earlier (C1orf68, CSHL1, HLA-DMA, HSP90AA1, HSP90B1, MT1M, NLRC5, NR3C1, NRP1, OR1D2, RPL11, STAT1, and TMPRSS2) were used for benchmarking of HGCA2.0 and four other popular webtools (Table S5). The tools’ performances were evaluated based on their produced PPI network metrics, as well as the relevance of their enriched biological terms and their corresponding adjusted p-values. For C1orf68, HGCA2.0, COXPRESdb, and GTEx-based GeneFriends performed best, while SRA-based GeneFriends did not result in a connected STRING network and ARCHS4 produced no coexpression results. For CSHL1, HGCA2.0 exhibited the best performance regarding network metrics. Most webtools produced enriched terms related to growth hormone activity. For HLA-DMA and NLRC5, all webtools except for SRA-based GTEx had dense networks, with HGCA2.0 performing best, showing enriched biological terms related to defence response and antigen processing. For the HPS90AA1 and HSP90B1 heat shock protein genes, all webtools, except for SEEK, performed comparably well, showing “Protein Folding” and “Response to endoplasmic reticulum stress” as enriched terms, respectively. For MT1M, SRA-based GeneFriends and ARCHS4 produced networks with 1 edge each, while the other webtools found no connections. COXPRESdb produced the lowest enrichment p-values, while HGCA2.0 produced the second highest ones. For NR3C1, SRA-based GeneFriends and ARCHS4 performed best regarding network metrics, while HGCA2.0 showed the sparsest network. In addition, HGCA2.0 discovered no enriched terms, while the enriched biological terms discovered by the other webtools were very generic. In the case of NRP1, HGCA2.0 and SEEK performed best, both in network metrics as well as enrichment p-values. For RPL11, all webtools exhibited dense networks with high levels of statistical confidence, although SEEK and SRA-based GeneFriends performed slightly worse. For OR1D2, all networks were sparse, with only HGCA2.0, ARCHS4 and, to some extent, COXPRESdb producing statistically significant enriched terms related to olfactory receptor biological functions, with HGCA2.0 having by far the lowest p-values. GTEx-based GeneFriends had the densest network, but its coexpressed genes were enriched for “sexual reproduction”, a term unrelated to olfactory receptors. It should be mentioned that the analysis of ARCHS4 used only 76 genes mapped by STRING, as the webtool outputs a list of a maximum of 100 coexpressed genes. For STAT1, HGCA2.0 and COXPRESdb performed best. HGCA2.0 also had the lowest GO Biological Process enrichment term p-values. For TMPRSS2, COXPRESdb performed best in both network metrics and enrichment p-values, while HGCA2.0 had the fourth best performance.
4. Discussion
4.1. Comparison with Previous HGCA Version
HGCA2.0 has been developed as an upgrade to the original Human Gene Correlation Analysis (HGCA1.0) tool [12], created over 10 years ago. The initial HGCA version included expression data derived from 1959 healthy high-quality Affymetrix Human Genome U133 Plus 2.0 Array Chip samples, which were manually selected as tissue representatives of 4452 high-quality healthy samples in a way to minimise tissue bias. Microarray samples were then normalised using MAS5.0 with default Affymetrix CDF. Since default CDF does not guarantee a one-to-one gene-probe set correspondence, users were required to select one of the available probe sets for their gene of interest and, as the original HGCA was microarray-based, the searchable gene list was also limited, compared to the current knowledge and understanding of the human genome. HGCA1.0 could produce both lists of the most coexpressed genes to the gene of interest or neighbour-joining-based [144] coexpression clades and offered various enrichment analysis categories.
The updated HGCA version is based on 3500 GTEx bulk RNA-Seq samples, which were automatically selected as representatives of the original 16,704 non-cell line ones. GTEx guarantees high-quality samples and healthy tissue conditions, as well as optimal RNA-Seq execution and data preprocessing [11]. In addition, RNA-Seq is a method that is more accurate and sensitive in measuring gene expression in tissue, compared to microarrays. Furthermore, as it is not dependent on probe hybridisation, expressions are not limited to a set of genes. Finally, a UPGMA hierarchical clustering method was used as an alternative to neighbour joining, as its cophenetic distances better corresponded to the original pairwise distances.
In large-scale coexpression analyses which depend on the processing of raw data from different studies, batch correction may be necessary, unless advanced normalisation algorithms, such as SCAN [145], are employed, as in the case with ACT [2,33]. Although HGCA1.0 was based on data from more than 300 studies, which were normalised by MAS5.0, a basic single-channel array normalisation method, no batch correction was applied. As GTEx is a single study, there was no need for batch correction in HGCA2.0. In addition, read counts were normalised using the qsmooth algorithm, which performs best for datasets of various tissues, as is the case of GTEx [27]. HGCA2.0 further contains new and updated biological term libraries for improved enrichment analyses. In HGCA1.0, transcription factor analysis was based on predicted transcription factor binding sites from MATCH [146] hits of Position Weight Matrices from TransFac [147]. On the other hand, experimentally validated gene-transcription factor interactions from ENCODE and ReMap are a unique feature of HGCA2.0, thus, being novel in highlighting the transcription factors which may act as master co-regulators which drive gene coexpression.
4.2. Comparison of Coexpression Webtools
To compare the performance of the 5 coexpression webtools, their outputs for 13 driver genes were used for the construction of STRING PPI networks, which served as an independent measure. Since ribosomal proteins are ubiquitously and concurrently expressed for ribosome assembly, coexpression webtools expectedly discovered most ribosomal proteins as coexpressed, resulting in high STRING PPI network metrics and comparable biological term enrichment p-values (Table S5). Small differences in such low p-values between tools should not be considered significant, as they might depend on even a single coexpressed gene difference. STAT1 is a transcription factor related to defence response genes and all webtools produced enrichments of relevant biological terms, but with highly varying significance levels, with HGCA2.0 having the lowest p-value, followed by COXPRESdb, while the two GeneFriends versions were lower than the rest. NRP1 coexpressed gene lists produced various enrichments depending on the coexpression webtool used, with only HGCA2.0 highlighting the gene’s role in vasculature development. STRING analyses of NR3C1, TMPRSS2, MT1M, and OR1D2 did not produce dense PPI networks. As a result, webtools that discovered even one more edge than the rest of the tools, exhibited better network metrics. Thus, in those four genes, enrichment analyses were mostly used to determine the best performance. In the cases of C1orf68, CSHL1, and NLRC5, HGCA2.0 performed best. For HSP90AA1 and HSP90B1, COXPRESdb outperformed all other tools, while for HLA-DOA, HGCA2.0 performed equally well with COXPRESdb. The performance of coexpression webtools shows variation on a case-to-case basis, possibly attributable to their different ways of calculating coexpression between genes and their different transcriptomic datasets. Overall, COXPRESdb and HGCA2.0 performed best, followed by GTEx-based GeneFriends, SEEK and ARCHS4 and, finally, SRA-based GeneFriends. In addition, GTEx-based GeneFriends outperformed its SRA-based version in almost all examples, hinting that the choice of GTEx data by HGCA2.0 is favourable for studying condition-independent gene coexpression. Interestingly, HGCA2.0 and GTEx-based GeneFriends version showed significant differences in performance for specific genes, even though both were based on data from the same source. This may be due to the fact that GeneFriends used all available GTEx samples, without the prior representative sample selection that HGCA2.0 applied, possibly leading to the introduction of tissue biases: The complete GTEx dataset displays great variability in the number of samples per tissue, distorting the depiction of the global coexpression landscape. Furthermore, this effect could be accentuated depending on the selected normalisation process of raw data: GeneFriends GTEx samples were not normalised using a tissue-aware normalisation method, as opposed to the qsmooth algorithm that was used by HGCA2.0. These issues could explain the high performance of GeneFriends in ubiquitously expressed genes (e.g., RPL11), and its low performance in stimulus-related (e.g., STAT1) or cell type-specific (e.g., NRP1) genes.
Apart from each tool’s performance, there are also differences in the presentation of coexpression. All webtools except for HGCA2.0 produce a list of the most coexpressed genes as their main output. While gene lists offer a simple depiction of gene coexpression, they do not constitute a systems biology approach, as they do not show the interconnections between coexpressed genes. SEEK additionally shows a heatmap depicting the expression levels of 100 selected genes from the ordered coexpression gene list in 50 selected datasets, which is a limited approach, as it is restricted to a specific number of genes and samples each time. Coexpressed genes can be visualised as Gene Coexpression Networks (GCNs) in COXPRESdb and GeneFriends, or as UMAP [148] plots in COXPRESdb and ARCHS4. GeneFriends GCN is interactive as the user can alter the number of coexpressed genes and the r-value cut-off, while COXPRESdb GCN has a fixed cut-off that does not allow the user to estimate the strength of correlations between the coexpressed genes themselves. The coexpression clade visualisation of HGCA2.0 is easily understood by molecular biologists, who are accustomed to the same depiction in phylogenetic trees. Furthermore, the size of coexpression clades in HGCA2.0 can be altered. Finally, all other webtools, except for SEEK and HGCA2.0, depend on external tools to perform enrichment analysis. External enrichment analysis tools do not replace HGCA2.0’s own enrichment analysis since many of them do not include non-coding RNAs, as in the case of STRING’s enrichment statistics.
4.3. Limitations
HGCA2.0 is based on the latest GTEx Release (V8), which uses the GENCODE v26 annotation of the GRCh38 human reference genome assembly. As GENCODE v26 was released on 14 March 2017, genes that were added in later versions of GENCODE were not included in GTEx V8. Likewise, GTEx V8 contains genes of GENCODE v26 which have been rendered obsolete in later versions of GENCODE. As GTEx RNA-Seq FASTQ files are not publicly available, it would be preferable if these data were reprocessed in new GTEx releases using the latest GENCODE version. That would enable HGCA2.0 to work to its full potential. This limitation was encountered in an attempt to study hominin encephalisation using HGCA2.0, where ARHGAP11B was selected as the ideal driver gene, as it derived from partial duplication of ARHGAP11A after humans and chimpanzees split [149], promotes basal progenitor amplification and neocortex expansion [150], and its deletion may cause microcephaly [151]. However, as ARHGAP11B was first introduced in GENCODE v28, it was not included in GTEx V8, thus HGCA2.0 was not able to study its coexpression.
Due to the inherent attributes of the coexpression tree depiction used by HGCA2.0, it is not easy for the user to determine the optimal coexpression clade size for a gene of interest. Selection of the best size may be determined through achieving the lowest possible adjusted p-values of enriched terms, by the presence of known gene partners or the topology of the tree itself. Another feature related to tree depiction, is the fact that multiple gene queries are not allowed in HGCA2.0. Furthermore, gene coexpression trees are not able to efficiently portray anti-correlated genes. As gene correlations are converted to non-negative distance values prior to hierarchical clustering, coexpressed genes grouped close to each other usually represent gene partners, but long distances between genes in the coexpression tree do not necessarily relate to negative correlations.
The rationale for selecting olfactory receptor genes as a use case, was that due to their monogenic and monoallelic expression, they would be expected to be fully anti-correlated among themselves (i.e., having Pearson correlation coefficients close to −1). Nevertheless, in HGCA2.0, their pairwise correlations appear close to 0 (i.e., not correlated). The unique olfactory receptor gene coexpression pattern would only be revealed using single-cell RNA-Seq (scRNA-Seq) data, instead of bulk RNA-Seq ones which produce averages of gene expressions due to the nature of tissue sampling, i.e., using parts of the olfactory epithelium which contain multiple olfactory cells. This could explain why olfactory receptor genes were grouped by UPGMA hierarchical clustering on distinct subclades of HGCA2.0. Interestingly, even though STRING v11.5 aims to connect functionally related genes, it failed to correlate olfactory receptor genes, while HGCA2.0 achieved their grouping, even though their correlation values would not sufficiently lead to that conclusion.
Enrichment analysis depends on the annotation quality of each source database. Large parts of the human genome are not properly annotated, if at all, and there are many variations in gene annotations between different databases [152]. Additionally, databases which are based on text evidence may contain misannotated data which may impact the quality of subsequent enrichment analyses. For instance, due to erratic text-mining, DisGeNet falsely linked metallothioneins with metatarsalgia [153] and melatonin deficiency [154], since it misidentified MT1 (type 1 family of the metallothionein superfamily), as MT-I (first metatarsal bone) and MT1 (Melatonin Receptor 1A).
4.4. Interpretation of HGCA2.0 Predictions
The prediction potential of HGCA2.0 can be assessed by comparing its output to the existing literature. The use cases demonstrated that HGCA2.0 does indeed have the ability to reproduce known biology. Thus, the gene coexpression clades identified by HGCA 2.0 have the potential to reveal novel mechanistic relationships for human genes, which may give useful insights into cellular processes that involve multiple genes with diverse functional roles. HGCA2.0 analysis is exploratory with no pre-defined significance thresholds, the intention being to show the potential for HGCA2.0 to identify novel gene groupings that may be worthy of future investigation due to their sharing of molecular functions and potential relevance to the understanding of cellular pathology. So, gene coexpression functional relationships were explored in two neuromuscular conditions: ALS and LGMD. Co-occupancy of gene coexpression clades was observed for many of the genes that harbour causal mutations for LGMD, but no ALS causal genes were observed to occupy the same clades as one another. This may reflect the fewer functional groupings that have been proposed for LGMD causal genes [131] compared to ALS causal genes, for which common functional grouping remains a largely unmet challenge [127]. Complete molecular mechanistic explanations of these pathologies, tracing the emergence of a single definable disease (albeit with subtypes and clinical variation) from diverse genetic mutations, remain lacking for both ALS and LGMD.
Constitutively expressed genes would be expected to be correlated amongst themselves in healthy samples, regardless of their differences in biological functions. However, in HGCA2.0, HSP90B1 which is continuously expressed in cytosol, is coexpressed with its functional partners. This would imply that there is regulation of the expression even of constitutively expressed genes, suggesting a revisiting of the term “constitutive” gene.
HGCA2.0 was also tested for its ability to study the coexpression between sense and their antisense genes. Indeed, in three use cases, sense and antisense were next to each other in their respective coexpression clades, with all pairs belonging to the divergent pair class either overlapping or non-overlapping. Divergent genes of the same bidirectional promoter share common proximal regulatory elements which constitute the driving force of their coexpression. The discovery of coexpression between coding and non-coding genes cannot be achieved using microarray-based coexpression webtools or PPI network tools, such as STRING [54] or Genemania [51], as none of them study non-coding RNAs.
5. Conclusions
HGCA2.0 is an RNA-Seq-based webtool that performs gene coexpression analysis in Homo sapiens. HGCA2.0 has been thoroughly tested for ubiquitously expressed genes, as well as tissue- or condition-specific genes. All use cases were validated by cross-checking the coexpression partners and enrichment results via an extensive bibliographical search. In use cases serving to benchmark HGCA2.0 and other coexpression webtools, using STRING PPI metrics as an independent assessor, HGCA2.0 generally showed the top performance among its competitors. We believe that this new HGCA version will be an important addition to the community of molecular biologists, enabling them to create verifiable hypotheses for gene partnership, especially considering the unique features of HGCA2.0: its user-friendly interface; its biologically relevant output, avoiding information overload; the gene coexpression tree depiction; and the enrichment analysis for verified gene-targeting transcription factors.
Acknowledgments
The authors would like to express their gratitude to the reviewers for their very helpful comments and suggestions. The authors would also like to thank Evgenia Ntini and Periklis Makrythanasis for their insightful suggestions.
Supplementary Materials
The following supporting information can be downloaded at: https://www.mdpi.com/article/10.3390/cells12030388/s1, Figure S1: GTEx sample number per tissue before and after automatic pruning (“All Samples” and “Selected Samples”, respectively); Figure S2: Hierarchical clustering of GTEx samples using UPGMA after qsmooth normalisation. Long lines represent the 3500 samples which were retained after automatic pruning and short lines the 13,204 samples that were pruned. Samples are colour-coded by tissue, using the same colours as the ones on the GTEx website. Tissue names are only shown once, closest to where most of their samples are grouped; Figure S3: Genomic coordinates of CIITA and AC133065.3 (appearing as its Ensembl transcript stable ID—ENST00000625054). Figure was adapted from Ensembl genome browser; Figure S4: Genomic location containing LCE genes and C1orf68. Figure was adapted from Ensembl genome browser; Figure S5: Multiple sequence alignment of the protein sequences of LCE genes appearing in the HGCA2.0 coexpression clade and C1orf68 by MUSCLE; Figure S6: Discovery of tandem repeats in C1orf68 protein sequence using HHrepID; Figure S7: HGCA2.0 OR1D2 98 internal node coexpression clade; Figure S8: Genomic coordinates of sense genes and their respective antisenses in a 6Kbps window: (a) Genomic region of GATA3 and GATA3-AS1, which constitute a divergent non-overlapping pair; (b) Genomic region of NR2F1 and NR2F1-AS1, which comprise a divergent overlapping pair; (c) Genomic region of MEF2C and MEF2C-AS1, which form a divergent overlapping pair. Figures were adapted from Ensembl genome browser; Table S1: ALS causal gene lists that were used as individual inputs in HGCA2.0; Table S2: LGMD causal gene lists that were used as individual inputs in HGCA2.0; Table S3: ALS causal genes which produced significant p-value enrichments in their HGCA2.0 coexpression clades and their accompanying enrichments; Table S4: LGMD causal genes which produced significant p-value enrichments in their HGCA2.0 coexpression clades and their accompanying enrichments; Table S5: STRING metrics for 13 genes in HGCA2.0, COXPRESdb, the SRA and GTEx versions of GeneFriends, SEEK and ARCHS4 coexpression webtools.
Author Contributions
Conceptualization, I.M.; methodology, V.L.Z., A.M., K.K., C.V. and I.M.; software, V.L.Z., A.M., K.K. and I.M.; validation, V.L.Z., C.C., E.A.M., S.D., M.A.K., M.P., W.J.D. and I.M.; investigation, V.L.Z., C.C., E.A.M., S.D., M.A.K., M.P., W.J.D. and I.M.; data curation, V.L.Z., K.K., C.V. and I.M.; writing—original draft preparation, V.L.Z., C.C., E.A.M., S.D., M.A.K., M.P., W.J.D., M.A. and I.M.; writing—review and editing, V.L.Z. and I.M.; visualization, V.L.Z., A.M. and I.M.; supervision, M.A., G.P.C., V.A.I. and I.M.; project administration, V.A.I. and I.M.; funding acquisition, I.M. All authors have read and agreed to the published version of the manuscript.
Institutional Review Board Statement
Not applicable.
Informed Consent Statement
Not applicable.
Data Availability Statement
HGCA2.0 is available as a web service through https://www.michalopoulos.net/hgca2.0/ (accessed on 20 January 2023); Gene counts were downloaded from https://storage.googleapis.com/gtex_analysis_v8/rna_seq_data/GTEx_Analysis_2017-06-05_v8_RNASeQCv1.1.9_gene_reads.gct.gz (accessed on 20 January 2023); TPMs were downloaded from https://storage.googleapis.com/gtex_analysis_v8/rna_seq_data/GTEx_Analysis_2017-06-05_v8_RNASeQCv1.1.9_gene_tpm.gct.gz (accessed on 20 January 2023); Sample metadata were downloaded from https://storage.googleapis.com/gtex_analysis_v8/annotations/GTEx_Analysis_v8_Annotations_SampleAttributesDS.txt (accessed on 20 January 2023) and https://www.ebi.ac.uk/arrayexpress/files/E-MTAB-5214/E-MTAB-5214.sdrf.txt (accessed on 20 January 2023); ReMap2020 data were downloaded from http://remap.univ-amu.fr/storage/remap2020/hg38/MACS2/remap2020_crm_macs2_hg38_v1_0.bed.gz (accessed on 20 January 2023); ENCODE data were downloaded from https://maayanlab.cloud/static/hdfs/harmonizome/data/encodetfppi/gene_attribute_edges.txt.gz (accessed on 20 January 2023); Cytoband coordinates were downloaded from https://ftp.ncbi.nlm.nih.gov/pub/gdp/ideogram_9606_GCF_000001305.15_400_V1 (accessed on 20 January 2023) https://ftp.ncbi.nlm.nih.gov/pub/gdp/ideogram_9606_GCF_000001305.15_550_V1 (accessed on 20 January 2023) and https://ftp.ncbi.nlm.nih.gov/pub/gdp/ideogram_9606_GCF_000001305.15_850_V1 (accessed on 20 January 2023); Gene Ontology data were downloaded from http://purl.obolibrary.org/obo/go.obo (accessed on 20 January 2023); WikiPathways were downloaded from https://wikipathways-data.wmcloud.org/20200410/gmt/wikipathways-20200410-gmt-Homo_sapiens.gmt (accessed on 20 January 2023); OMIM data were downloaded after registration from https://www.omim.org/downloads (accessed on 20 January 2023); DisGeNet data were downloaded from https://www.disgenet.org/static/disgenet_ap1/files/downloads/all_gene_disease_associations.tsv.gz (accessed on 20 January 2023); Pfam data were downloaded from https://ftp.ebi.ac.uk/pub/databases/Pfam/releases/Pfam33.1/Pfam-A.clans.tsv.gz (accessed on 20 January 2023); Genomic data were downloaded from http://jan2020.archive.ensembl.org/biomart/martview/ (accessed on 20 January 2023); KEGG Pathways were downloaded from https://www.genome.jp/dbget-bin/get_linkdb?-t+pathway+gn:T01001 (accessed on 20 January 2023).
Conflicts of Interest
The authors declare no conflict of interest.
Funding Statement
This work was supported by the project “ELIXIR-GR: Managing and Analysing Life Sciences Data” (MIS: 5002780) which is implemented under the Action “Reinforcement of the Research and Innovation Infrastructure”, funded by the Operational Programme “Competitiveness, Entrepreneurship and Innovation” (NSRF 2014-2020) and co-financed by Greece and the European Union (European Regional Development Fund). A.M was supported by the CY-Biobank project, under the European Union’s Horizon 2020 research and innovation program, GA (Grant Agreement) No 857122.
Footnotes
Disclaimer/Publisher’s Note: The statements, opinions and data contained in all publications are solely those of the individual author(s) and contributor(s) and not of MDPI and/or the editor(s). MDPI and/or the editor(s) disclaim responsibility for any injury to people or property resulting from any ideas, methods, instructions or products referred to in the content.
References
- 1.Zogopoulos V.L., Saxami G., Malatras A., Papadopoulos K., Tsotra I., Iconomidou V.A., Michalopoulos I. Approaches in Gene Coexpression Analysis in Eukaryotes. Biology. 2022;11:1019. doi: 10.3390/biology11071019. [DOI] [PMC free article] [PubMed] [Google Scholar]
- 2.Zogopoulos V.L., Malatras A., Michalopoulos I. Gene coexpression analysis in Arabidopsis thaliana based on public microarray data. STAR Protoc. 2022;3:101208. doi: 10.1016/j.xpro.2022.101208. [DOI] [PMC free article] [PubMed] [Google Scholar]
- 3.Mortazavi A., Williams B.A., McCue K., Schaeffer L., Wold B. Mapping and quantifying mammalian transcriptomes by RNA-Seq. Nat. Methods. 2008;5:621–628. doi: 10.1038/nmeth.1226. [DOI] [PubMed] [Google Scholar]
- 4.Usadel B., Obayashi T., Mutwil M., Giorgi F.M., Bassel G.W., Tanimoto M., Chow A., Steinhauser D., Persson S., Provart N.J. Co-expression tools for plant biology: Opportunities for hypothesis generation and caveats. Plant Cell Environ. 2009;32:1633–1651. doi: 10.1111/j.1365-3040.2009.02040.x. [DOI] [PubMed] [Google Scholar]
- 5.Barrett T., Wilhite S.E., Ledoux P., Evangelista C., Kim I.F., Tomashevsky M., Marshall K.A., Phillippy K.H., Sherman P.M., Holko M., et al. NCBI GEO: Archive for functional genomics data sets—Update. Nucleic Acids Res. 2013;41:D991–D995. doi: 10.1093/nar/gks1193. [DOI] [PMC free article] [PubMed] [Google Scholar]
- 6.Kodama Y., Shumway M., Leinonen R., International Nucleotide Sequence Database C. The Sequence Read Archive: Explosive growth of sequencing data. Nucleic Acids Res. 2012;40:D54–D56. doi: 10.1093/nar/gkr854. [DOI] [PMC free article] [PubMed] [Google Scholar]
- 7.Kolesnikov N., Hastings E., Keays M., Melnichuk O., Tang Y.A., Williams E., Dylag M., Kurbatova N., Brandizi M., Burdett T., et al. ArrayExpress update--simplifying data submissions. Nucleic Acids Res. 2015;43:D1113–D1116. doi: 10.1093/nar/gku1057. [DOI] [PMC free article] [PubMed] [Google Scholar]
- 8.Papatheodorou I., Moreno P., Manning J., Fuentes A.M., George N., Fexova S., Fonseca N.A., Fullgrabe A., Green M., Huang N., et al. Expression Atlas update: From tissues to single cells. Nucleic Acids Res. 2020;48:D77–D83. doi: 10.1093/nar/gkz947. [DOI] [PMC free article] [PubMed] [Google Scholar]
- 9.Amid C., Alako B.T.F., Balavenkataraman Kadhirvelu V., Burdett T., Burgin J., Fan J., Harrison P.W., Holt S., Hussein A., Ivanov E., et al. The European Nucleotide Archive in 2019. Nucleic Acids Res. 2020;48:D70–D76. doi: 10.1093/nar/gkz1063. [DOI] [PMC free article] [PubMed] [Google Scholar]
- 10.Hutter C., Zenklusen J.C. The Cancer Genome Atlas: Creating Lasting Value beyond Its Data. Cell. 2018;173:283–285. doi: 10.1016/j.cell.2018.03.042. [DOI] [PubMed] [Google Scholar]
- 11.GTEx Consortium The Genotype-Tissue Expression (GTEx) project. Nat. Genet. 2013;45:580–585. doi: 10.1038/ng.2653. [DOI] [PMC free article] [PubMed] [Google Scholar]
- 12.Michalopoulos I., Pavlopoulos G.A., Malatras A., Karelas A., Kostadima M.A., Schneider R., Kossida S. Human gene correlation analysis (HGCA): A tool for the identification of transcriptionally co-expressed genes. BMC Res. Notes. 2012;5:265. doi: 10.1186/1756-0500-5-265. [DOI] [PMC free article] [PubMed] [Google Scholar]
- 13.Aoki Y., Okamura Y., Ohta H., Kinoshita K., Obayashi T. ALCOdb: Gene Coexpression Database for Microalgae. Plant Cell Physiol. 2016;57:e3. doi: 10.1093/pcp/pcv190. [DOI] [PMC free article] [PubMed] [Google Scholar]
- 14.Zimmermann P., Hirsch-Hoffmann M., Hennig L., Gruissem W. GENEVESTIGATOR. Arabidopsis microarray database and analysis toolbox. Plant Physiol. 2004;136:2621–2632. doi: 10.1104/pp.104.046367. [DOI] [PMC free article] [PubMed] [Google Scholar]
- 15.Tseng K.C., Li G.Z., Hung Y.C., Chow C.N., Wu N.Y., Chien Y.Y., Zheng H.Q., Lee T.Y., Kuo P.L., Chang S.B., et al. EXPath 2.0: An Updated Database for Integrating High-Throughput Gene Expression Data with Biological Pathways. Plant Cell Physiol. 2020;61:1818–1827. doi: 10.1093/pcp/pcaa115. [DOI] [PubMed] [Google Scholar]
- 16.Obayashi T., Hibara H., Kagaya Y., Aoki Y., Kinoshita K. ATTED-II v11: A Plant Gene Coexpression Database Using a Sample Balancing Technique by Subagging of Principal Components. Plant Cell Physiol. 2022;63:869–881. doi: 10.1093/pcp/pcac041. [DOI] [PubMed] [Google Scholar]
- 17.Obayashi T., Kagaya Y., Aoki Y., Tadaka S., Kinoshita K. COXPRESdb v7: A gene coexpression database for 11 animal species supported by 23 coexpression platforms for technical evaluation and evolutionary inference. Nucleic Acids Res. 2019;47:D55–D62. doi: 10.1093/nar/gky1155. [DOI] [PMC free article] [PubMed] [Google Scholar]
- 18.Raina P., Lopes I., Chatsirisupachai K., Farooq Z., de Magalhães J.P. GeneFriends 2021: Updated co-expression databases and tools for human and mouse genes and transcripts. bioRxiv. 2021:2021:2021.2001.2010.426125. doi: 10.1101/2021.01.10.426125. [DOI] [Google Scholar]
- 19.Miller H.E., Bishop A.J.R. Correlation AnalyzeR: Functional predictions from gene co-expression correlations. BMC Bioinform. 2021;22:206. doi: 10.1186/s12859-021-04130-7. [DOI] [PMC free article] [PubMed] [Google Scholar]
- 20.Fionda V. Networks in Biology. In: Ranganathan S., Gribskov M., Nakai K., Schönbach C., editors. Encyclopedia of Bioinformatics and Computational Biology. Academic Press; Oxford, UK: 2019. pp. 915–921. [Google Scholar]
- 21.Serin E.A.R., Nijveen H., Hilhorst H.W.M., Ligterink W. Learning from Co-expression Networks: Possibilities and Challenges. Front. Plant Sci. 2016;7:444. doi: 10.3389/fpls.2016.00444. [DOI] [PMC free article] [PubMed] [Google Scholar]
- 22.Li B., Dewey C.N. RSEM: Accurate transcript quantification from RNA-Seq data with or without a reference genome. BMC Bioinform. 2011;12:323. doi: 10.1186/1471-2105-12-323. [DOI] [PMC free article] [PubMed] [Google Scholar]
- 23.Wagner G.P., Kin K., Lynch V.J. Measurement of mRNA abundance using RNA-seq data: RPKM measure is inconsistent among samples. Theory Biosci. 2012;131:281–285. doi: 10.1007/s12064-012-0162-3. [DOI] [PubMed] [Google Scholar]
- 24.Aguet F., Barbeira A.N., Bonazzola R., Brown A., Castel S.E., Jo B., Kasela S., Kim-Hellmuth S., Liang Y., Oliva M., et al. The GTEx Consortium atlas of genetic regulatory effects across human tissues. bioRxiv. 2019:2019:787903. doi: 10.1101/787903. [DOI] [Google Scholar]
- 25.Cunningham F., Allen J.E., Allen J., Alvarez-Jarreta J., Amode M.R., Armean I.M., Austine-Orimoloye O., Azov A.G., Barnes I., Bennett R., et al. Ensembl 2022. Nucleic Acids Res. 2022;50:D988–D995. doi: 10.1093/nar/gkab1049. [DOI] [PMC free article] [PubMed] [Google Scholar]
- 26.Kinsella R.J., Kahari A., Haider S., Zamora J., Proctor G., Spudich G., Almeida-King J., Staines D., Derwent P., Kerhornou A., et al. Ensembl BioMarts: A hub for data retrieval across taxonomic space. Database (Oxford) 2011;2011:bar030. doi: 10.1093/database/bar030. [DOI] [PMC free article] [PubMed] [Google Scholar]
- 27.Paulson J.N., Chen C.Y., Lopes-Ramos C.M., Kuijjer M.L., Platig J., Sonawane A.R., Fagny M., Glass K., Quackenbush J. Tissue-aware RNA-Seq processing and normalization for heterogeneous and sparse data. BMC Bioinform. 2017;18:437. doi: 10.1186/s12859-017-1847-x. [DOI] [PMC free article] [PubMed] [Google Scholar]
- 28.Hicks S.C., Okrah K., Paulson J.N., Quackenbush J., Irizarry R.A., Bravo H.C. Smooth quantile normalization. Biostatistics. 2018;19:185–198. doi: 10.1093/biostatistics/kxx028. [DOI] [PMC free article] [PubMed] [Google Scholar]
- 29.Pearson K. VII. Note on regression and inheritance in the case of two parents. Proc. R. Soc. Lond. 1895;58:240–242. doi: 10.1098/rspl.1895.0041. [DOI] [Google Scholar]
- 30.D’Haeseleer P. How does gene expression clustering work? Nat. Biotechnol. 2005;23:1499. doi: 10.1038/nbt1205-1499. [DOI] [PubMed] [Google Scholar]
- 31.Schliep K., Potts A.J., Morrison D.A., Grimm G.W. Intertwining phylogenetic trees and networks. Methods Ecol. Evol. 2017;8:1212–1220. doi: 10.1111/2041-210X.12760. [DOI] [Google Scholar]
- 32.Sokal R.R., Michener C.D. A statistical method for evaluating systematic relationships. Univ. Kansas Sci. Bull. 1958;38:1409–1438. [Google Scholar]
- 33.Zogopoulos V.L., Saxami G., Malatras A., Angelopoulou A., Jen C.H., Duddy W.J., Daras G., Hatzopoulos P., Westhead D.R., Michalopoulos I. Arabidopsis Coexpression Tool: A tool for gene coexpression analysis in Arabidopsis thaliana. iScience. 2021;24:102848. doi: 10.1016/j.isci.2021.102848. [DOI] [PMC free article] [PubMed] [Google Scholar]
- 34.Felsenstein J. Distance Matrix Programs. [(accessed on 20 January 2023)]. Available online: http://evolution.genetics.washington.edu/phylip/doc/distance.html.
- 35.Archie J., Day H.E.W., Felsenstein J., Maddison W., Meacham C., Rohlf F.J., Swofford D. The Newick Tree Format. [(accessed on 20 January 2023)]. Available online: http://evolution.genetics.washington.edu/phylip/newicktree.html.
- 36.Tweedie S., Braschi B., Gray K., Jones T.E.M., Seal R.L., Yates B., Bruford E.A. Genenames.org: The HGNC and VGNC resources in 2021. Nucleic Acids Res. 2021;49:D939–D946. doi: 10.1093/nar/gkaa980. [DOI] [PMC free article] [PubMed] [Google Scholar]
- 37.Gene Ontology Consortium The Gene Ontology resource: Enriching a GOld mine. Nucleic Acids Res. 2021;49:D325–D334. doi: 10.1093/nar/gkaa1113. [DOI] [PMC free article] [PubMed] [Google Scholar]
- 38.Kanehisa M., Goto S. KEGG: Kyoto encyclopedia of genes and genomes. Nucleic Acids Res. 2000;28:27–30. doi: 10.1093/nar/28.1.27. [DOI] [PMC free article] [PubMed] [Google Scholar]
- 39.Martens M., Ammar A., Riutta A., Waagmeester A., Slenter D.N., Hanspers K., Ryan A.M., Digles D., Lopes E.N., Ehrhart F., et al. WikiPathways: Connecting communities. Nucleic Acids Res. 2021;49:D613–D621. doi: 10.1093/nar/gkaa1024. [DOI] [PMC free article] [PubMed] [Google Scholar]
- 40.Encode Project Consortium A user’s guide to the encyclopedia of DNA elements (ENCODE) PLoS Biol. 2011;9:e1001046. doi: 10.1371/journal.pbio.1001046. [DOI] [PMC free article] [PubMed] [Google Scholar]
- 41.Rouillard A.D., Gundersen G.W., Fernandez N.F., Wang Z., Monteiro C.D., McDermott M.G., Ma’ayan A. The harmonizome: A collection of processed datasets gathered to serve and mine knowledge about genes and proteins. Database (Oxford) 2016;2016:baw100. doi: 10.1093/database/baw100. [DOI] [PMC free article] [PubMed] [Google Scholar]
- 42.Cheneby J., Menetrier Z., Mestdagh M., Rosnet T., Douida A., Rhalloussi W., Bergon A., Lopez F., Ballester B. ReMap 2020: A database of regulatory regions from an integrative analysis of Human and Arabidopsis DNA-binding sequencing experiments. Nucleic Acids Res. 2020;48:D180–D188. doi: 10.1093/nar/gkz945. [DOI] [PMC free article] [PubMed] [Google Scholar]
- 43.McKusick V.A. Mendelian Inheritance in Man and its online version, OMIM. Am. J. Hum. Genet. 2007;80:588–604. doi: 10.1086/514346. [DOI] [PMC free article] [PubMed] [Google Scholar]
- 44.Pinero J., Ramirez-Anguita J.M., Sauch-Pitarch J., Ronzano F., Centeno E., Sanz F., Furlong L.I. The DisGeNET knowledge platform for disease genomics: 2019 update. Nucleic Acids Res. 2020;48:D845–D855. doi: 10.1093/nar/gkz1021. [DOI] [PMC free article] [PubMed] [Google Scholar]
- 45.Mistry J., Chuguransky S., Williams L., Qureshi M., Salazar G.A., Sonnhammer E.L.L., Tosatto S.C.E., Paladin L., Raj S., Richardson L.J., et al. Pfam: The protein families database in 2021. Nucleic Acids Res. 2021;49:D412–D419. doi: 10.1093/nar/gkaa913. [DOI] [PMC free article] [PubMed] [Google Scholar]
- 46.Forbes C., Evans M., Hastings N., Peacock B. Statistical Distributions. 4th ed. John Wiley & Sons, Inc.; Hoboken, NJ, USA: 2011. [Google Scholar]
- 47.Benjamini Y., Hochberg Y. Controlling the false discovery rate: A practical and powerful approach to multiple testing. J. R. Stat. Soc. Ser. B. 1995;57:289–300. doi: 10.1111/j.2517-6161.1995.tb02031.x. [DOI] [Google Scholar]
- 48.Stelzer G., Rosen N., Plaschkes I., Zimmerman S., Twik M., Fishilevich S., Stein T.I., Nudel R., Lieder I., Mazor Y., et al. The GeneCards Suite: From Gene Data Mining to Disease Genome Sequence Analyses. Curr. Protoc. Bioinform. 2016;54:1–30. doi: 10.1002/cpbi.5. [DOI] [PubMed] [Google Scholar]
- 49.Letunic I., Bork P. Interactive Tree Of Life (iTOL) v4: Recent updates and new developments. Nucleic Acids Res. 2019;47:W256–W259. doi: 10.1093/nar/gkz239. [DOI] [PMC free article] [PubMed] [Google Scholar]
- 50.Raudvere U., Kolberg L., Kuzmin I., Arak T., Adler P., Peterson H., Vilo J. g:Profiler: A web server for functional enrichment analysis and conversions of gene lists (2019 update) Nucleic Acids Res. 2019;47:W191–W198. doi: 10.1093/nar/gkz369. [DOI] [PMC free article] [PubMed] [Google Scholar]
- 51.Franz M., Rodriguez H., Lopes C., Zuberi K., Montojo J., Bader G.D., Morris Q. GeneMANIA update 2018. Nucleic Acids Res. 2018;46:W60–W64. doi: 10.1093/nar/gky311. [DOI] [PMC free article] [PubMed] [Google Scholar]
- 52.Rodchenkov I., Babur O., Luna A., Aksoy B.A., Wong J.V., Fong D., Franz M., Siper M.C., Cheung M., Wrana M., et al. Pathway Commons 2019 Update: Integration, analysis and exploration of pathway data. Nucleic Acids Res. 2020;48:D489–D497. doi: 10.1093/nar/gkz946. [DOI] [PMC free article] [PubMed] [Google Scholar]
- 53.Thanati F., Karatzas E., Baltoumas F.A., Stravopodis D.J., Eliopoulos A.G., Pavlopoulos G.A. FLAME: A Web Tool for Functional and Literature Enrichment Analysis of Multiple Gene Lists. Biology. 2021;10:665. doi: 10.3390/biology10070665. [DOI] [PMC free article] [PubMed] [Google Scholar]
- 54.Szklarczyk D., Gable A.L., Nastou K.C., Lyon D., Kirsch R., Pyysalo S., Doncheva N.T., Legeay M., Fang T., Bork P., et al. The STRING database in 2021: Customizable protein-protein networks, and functional characterization of user-uploaded gene/measurement sets. Nucleic Acids Res. 2021;49:D605–D612. doi: 10.1093/nar/gkaa1074. [DOI] [PMC free article] [PubMed] [Google Scholar]
- 55.Kuleshov M.V., Jones M.R., Rouillard A.D., Fernandez N.F., Duan Q., Wang Z., Koplev S., Jenkins S.L., Jagodnik K.M., Lachmann A., et al. Enrichr: A comprehensive gene set enrichment analysis web server 2016 update. Nucleic Acids Res. 2016;44:W90–W97. doi: 10.1093/nar/gkw377. [DOI] [PMC free article] [PubMed] [Google Scholar]
- 56.Obayashi T., Kodate S., Hibara H., Kagaya Y., Kinoshita K. COXPRESdb v8: An animal gene coexpression database navigating from a global view to detailed investigations. Nucleic Acids Res. 2022;51:D80–D87. doi: 10.1093/nar/gkac983. [DOI] [PMC free article] [PubMed] [Google Scholar]
- 57.Lachmann A., Torre D., Keenan A.B., Jagodnik K.M., Lee H.J., Wang L., Silverstein M.C., Ma’ayan A. Massive mining of publicly available RNA-seq data from human and mouse. Nat. Commun. 2018;9:1366. doi: 10.1038/s41467-018-03751-6. [DOI] [PMC free article] [PubMed] [Google Scholar]
- 58.Zhu Q., Wong A.K., Krishnan A., Aure M.R., Tadych A., Zhang R., Corney D.C., Greene C.S., Bongo L.A., Kristensen V.N., et al. Targeted exploration and analysis of large cross-platform human transcriptomic compendia. Nat. Methods. 2015;12:211–214. doi: 10.1038/nmeth.3249. [DOI] [PMC free article] [PubMed] [Google Scholar]
- 59.Watts D.J., Strogatz S.H. Collective dynamics of ‘small-world’ networks. Nature. 1998;393:440–442. doi: 10.1038/30918. [DOI] [PubMed] [Google Scholar]
- 60.Khatter H., Myasnikov A.G., Natchiar S.K., Klaholz B.P. Structure of the human 80S ribosome. Nature. 2015;520:640–645. doi: 10.1038/nature14427. [DOI] [PubMed] [Google Scholar]
- 61.Narla A., Ebert B.L. Ribosomopathies: Human disorders of ribosome dysfunction. Blood. 2010;115:3196–3205. doi: 10.1182/blood-2009-10-178129. [DOI] [PMC free article] [PubMed] [Google Scholar]
- 62.Gazda H.T., Sheen M.R., Vlachos A., Choesmel V., O’Donohue M.F., Schneider H., Darras N., Hasman C., Sieff C.A., Newburger P.E., et al. Ribosomal protein L5 and L11 mutations are associated with cleft palate and abnormal thumbs in Diamond-Blackfan anemia patients. Am. J. Hum. Genet. 2008;83:769–780. doi: 10.1016/j.ajhg.2008.11.004. [DOI] [PMC free article] [PubMed] [Google Scholar]
- 63.Murphy B.J., Kimura T., Sato B.G., Shi Y., Andrews G.K. Metallothionein induction by hypoxia involves cooperative interactions between metal-responsive transcription factor-1 and hypoxia-inducible transcription factor-1alpha. Mol. Cancer Res. 2008;6:483–490. doi: 10.1158/1541-7786.MCR-07-0341. [DOI] [PubMed] [Google Scholar]
- 64.Holling T.M., Schooten E., van Den Elsen P.J. Function and regulation of MHC class II molecules in T-lymphocytes: Of mice and men. Hum. Immunol. 2004;65:282–290. doi: 10.1016/j.humimm.2004.01.005. [DOI] [PubMed] [Google Scholar]
- 65.Roche P.A. HLA-DM: An in vivo facilitator of MHC class II peptide loading. Immunity. 1995;3:259–262. doi: 10.1016/1074-7613(95)90111-6. [DOI] [PubMed] [Google Scholar]
- 66.Kropshofer H., Hammerling G.J., Vogt A.B. The impact of the non-classical MHC proteins HLA-DM and HLA-DO on loading of MHC class II molecules. Immunol. Rev. 1999;172:267–278. doi: 10.1111/j.1600-065X.1999.tb01371.x. [DOI] [PubMed] [Google Scholar]
- 67.Mellins E.D., Stern L.J. HLA-DM and HLA-DO, key regulators of MHC-II processing and presentation. Curr. Opin. Immunol. 2014;26:115–122. doi: 10.1016/j.coi.2013.11.005. [DOI] [PMC free article] [PubMed] [Google Scholar]
- 68.Ye L.L., Wei X.S., Zhang M., Niu Y.R., Zhou Q. The Significance of Tumor Necrosis Factor Receptor Type II in CD8(+) Regulatory T Cells and CD8(+) Effector T Cells. Front. Immunol. 2018;9:583. doi: 10.3389/fimmu.2018.00583. [DOI] [PMC free article] [PubMed] [Google Scholar]
- 69.Faustman D.L., Davis M. TNF Receptor 2 and Disease: Autoimmunity and Regenerative Medicine. Front. Immunol. 2013;4:478. doi: 10.3389/fimmu.2013.00478. [DOI] [PMC free article] [PubMed] [Google Scholar]
- 70.Zhang T., Ma C., Zhang Z., Zhang H., Hu H. NF-kappaB signaling in inflammation and cancer. MedComm (2020) 2021;2:618–653. doi: 10.1002/mco2.104. [DOI] [PMC free article] [PubMed] [Google Scholar]
- 71.Kearns J.D., Basak S., Werner S.L., Huang C.S., Hoffmann A. IkappaBepsilon provides negative feedback to control NF-kappaB oscillations, signaling dynamics, and inflammatory gene expression. J. Cell Biol. 2006;173:659–664. doi: 10.1083/jcb.200510155. [DOI] [PMC free article] [PubMed] [Google Scholar]
- 72.Alves B.N., Tsui R., Almaden J., Shokhirev M.N., Davis-Turak J., Fujimoto J., Birnbaum H., Ponomarenko J., Hoffmann A. IkappaBepsilon is a key regulator of B cell expansion by providing negative feedback on cRel and RelA in a stimulus-specific manner. J. Immunol. 2014;192:3121–3132. doi: 10.4049/jimmunol.1302351. [DOI] [PMC free article] [PubMed] [Google Scholar]
- 73.Nam S., Lim J.S. Essential role of interferon regulatory factor 4 (IRF4) in immune cell development. Arch. Pharm. Res. 2016;39:1548–1555. doi: 10.1007/s12272-016-0854-1. [DOI] [PubMed] [Google Scholar]
- 74.Li X., Zhai S., Zhang J., Zhang D., Wang S., Wang L., Yu J. Interferon Regulatory Factor 4 Correlated With Immune Cells Infiltration Could Predict Prognosis for Patients With Lung Adenocarcinoma. Front Oncol. 2021;11:698465. doi: 10.3389/fonc.2021.698465. [DOI] [PMC free article] [PubMed] [Google Scholar]
- 75.Meissner T.B., Li A., Biswas A., Lee K.H., Liu Y.J., Bayir E., Iliopoulos D., van den Elsen P.J., Kobayashi K.S. NLR family member NLRC5 is a transcriptional regulator of MHC class I genes. Proc. Natl. Acad. Sci. USA. 2010;107:13794–13799. doi: 10.1073/pnas.1008684107. [DOI] [PMC free article] [PubMed] [Google Scholar]
- 76.Kobayashi K.S., van den Elsen P.J. NLRC5: A key regulator of MHC class I-dependent immune responses. Nat. Rev. Immunol. 2012;12:813–820. doi: 10.1038/nri3339. [DOI] [PubMed] [Google Scholar]
- 77.Davis B.K., Roberts R.A., Huang M.T., Willingham S.B., Conti B.J., Brickey W.J., Barker B.R., Kwan M., Taxman D.J., Accavitti-Loper M.A., et al. Cutting edge: NLRC5-dependent activation of the inflammasome. J. Immunol. 2011;186:1333–1337. doi: 10.4049/jimmunol.1003111. [DOI] [PMC free article] [PubMed] [Google Scholar]
- 78.Najjar I., Fagard R. STAT1 and pathogens, not a friendly relationship. Biochimie. 2010;92:425–444. doi: 10.1016/j.biochi.2010.02.009. [DOI] [PMC free article] [PubMed] [Google Scholar]
- 79.Fraser B.J., Beldar S., Seitova A., Hutchinson A., Mannar D., Li Y., Kwon D., Tan R., Wilson R.P., Leopold K., et al. Structure and activity of human TMPRSS2 protease implicated in SARS-CoV-2 activation. Nat. Chem. Biol. 2022;18:963–971. doi: 10.1038/s41589-022-01059-7. [DOI] [PubMed] [Google Scholar]
- 80.Gkogkou E., Barnasas G., Vougas K., Trougakos I.P. Expression profiling meta-analysis of ACE2 and TMPRSS2, the putative anti-inflammatory receptor and priming protease of SARS-CoV-2 in human cells, and identification of putative modulators. Redox Biol. 2020;36:101615. doi: 10.1016/j.redox.2020.101615. [DOI] [PMC free article] [PubMed] [Google Scholar]
- 81.Jin J.M., Bai P., He W., Wu F., Liu X.F., Han D.M., Liu S., Yang J.K. Gender Differences in Patients With COVID-19: Focus on Severity and Mortality. Front. Public Health. 2020;8:152. doi: 10.3389/fpubh.2020.00152. [DOI] [PMC free article] [PubMed] [Google Scholar]
- 82.Li F., Boon A.C.M., Michelson A.P., Foraker R.E., Zhan M., Payne P.R.O. Estrogen hormone is an essential sex factor inhibiting inflammation and immune response in COVID-19. Sci. Rep. 2022;12:9462. doi: 10.1038/s41598-022-13585-4. [DOI] [PMC free article] [PubMed] [Google Scholar]
- 83.Henry J., Toulza E., Hsu C.Y., Pellerin L., Balica S., Mazereeuw-Hautier J., Paul C., Serre G., Jonca N., Simon M. Update on the epidermal differentiation complex. Front. Biosci. (Landmark Ed.) 2012;17:1517–1532. doi: 10.2741/4001. [DOI] [PubMed] [Google Scholar]
- 84.Deng Z., Matsuda K., Tanikawa C., Lin J., Furukawa Y., Hamamoto R., Nakamura Y. Late Cornified Envelope Group I, a novel target of p53, regulates PRMT5 activity. Neoplasia. 2014;16:656–664. doi: 10.1016/j.neo.2014.07.008. [DOI] [PMC free article] [PubMed] [Google Scholar]
- 85.Edgar R.C. MUSCLE: Multiple sequence alignment with high accuracy and high throughput. Nucleic Acids Res. 2004;32:1792–1797. doi: 10.1093/nar/gkh340. [DOI] [PMC free article] [PubMed] [Google Scholar]
- 86.Teufel F., Almagro Armenteros J.J., Johansen A.R., Gislason M.H., Pihl S.I., Tsirigos K.D., Winther O., Brunak S., von Heijne G., Nielsen H. SignalP 6.0 predicts all five types of signal peptides using protein language models. Nat. Biotechnol. 2022;40:1023–1025. doi: 10.1038/s41587-021-01156-3. [DOI] [PMC free article] [PubMed] [Google Scholar]
- 87.Waterhouse A., Bertoni M., Bienert S., Studer G., Tauriello G., Gumienny R., Heer F.T., de Beer T.A.P., Rempfer C., Bordoli L., et al. SWISS-MODEL: Homology modelling of protein structures and complexes. Nucleic Acids Res. 2018;46:W296–W303. doi: 10.1093/nar/gky427. [DOI] [PMC free article] [PubMed] [Google Scholar]
- 88.Varadi M., Anyango S., Deshpande M., Nair S., Natassia C., Yordanova G., Yuan D., Stroe O., Wood G., Laydon A., et al. AlphaFold Protein Structure Database: Massively expanding the structural coverage of protein-sequence space with high-accuracy models. Nucleic Acids Res. 2022;50:D439–D444. doi: 10.1093/nar/gkab1061. [DOI] [PMC free article] [PubMed] [Google Scholar]
- 89.Sillitoe I., Bordin N., Dawson N., Waman V.P., Ashford P., Scholes H.M., Pang C.S.M., Woodridge L., Rauer C., Sen N., et al. CATH: Increased structural coverage of functional space. Nucleic Acids Res. 2021;49:D266–D273. doi: 10.1093/nar/gkaa1079. [DOI] [PMC free article] [PubMed] [Google Scholar]
- 90.Zimmermann L., Stephens A., Nam S.Z., Rau D., Kubler J., Lozajic M., Gabler F., Soding J., Lupas A.N., Alva V. A Completely Reimplemented MPI Bioinformatics Toolkit with a New HHpred Server at its Core. J. Mol. Biol. 2018;430:2237–2243. doi: 10.1016/j.jmb.2017.12.007. [DOI] [PubMed] [Google Scholar]
- 91.Huson D.H., Scornavacca C. Dendroscope 3: An interactive tool for rooted phylogenetic trees and networks. Syst. Biol. 2012;61:1061–1067. doi: 10.1093/sysbio/sys062. [DOI] [PubMed] [Google Scholar]
- 92.Ritossa F. Discovery of the heat shock response. Cell Stress Chaperones. 1996;1:97–98. doi: 10.1379/1466-1268(1996)001<0097:DOTHSR>2.3.CO;2. [DOI] [PMC free article] [PubMed] [Google Scholar]
- 93.Schopf F.H., Biebl M.M., Buchner J. The HSP90 chaperone machinery. Nat. Rev. Mol. Cell Biol. 2017;18:345–360. doi: 10.1038/nrm.2017.20. [DOI] [PubMed] [Google Scholar]
- 94.Wandinger S.K., Richter K., Buchner J. The Hsp90 chaperone machinery. J. Biol. Chem. 2008;283:18473–18477. doi: 10.1074/jbc.R800007200. [DOI] [PubMed] [Google Scholar]
- 95.Chen B., Zhong D., Monteiro A. Comparative genomics and evolution of the HSP90 family of genes across all kingdoms of organisms. BMC Genom. 2006;7:156. doi: 10.1186/1471-2164-7-156. [DOI] [PMC free article] [PubMed] [Google Scholar]
- 96.Zuehlke A.D., Beebe K., Neckers L., Prince T. Regulation and function of the human HSP90AA1 gene. Gene. 2015;570:8–16. doi: 10.1016/j.gene.2015.06.018. [DOI] [PMC free article] [PubMed] [Google Scholar]
- 97.Fan G., Tu Y., Wu N., Xiao H. The expression profiles and prognostic values of HSPs family members in Head and neck cancer. Cancer Cell Int. 2020;20:220. doi: 10.1186/s12935-020-01296-7. [DOI] [PMC free article] [PubMed] [Google Scholar]
- 98.Gano J.J., Simon J.A. A proteomic investigation of ligand-dependent HSP90 complexes reveals CHORDC1 as a novel ADP-dependent HSP90-interacting protein. Mol. Cell. Proteom. MCP. 2010;9:255–270. doi: 10.1074/mcp.M900261-MCP200. [DOI] [PMC free article] [PubMed] [Google Scholar]
- 99.Shelton L.B., Koren J., 3rd, Blair L.J. Imbalances in the Hsp90 Chaperone Machinery: Implications for Tauopathies. Front. Neurosci. 2017;11:724. doi: 10.3389/fnins.2017.00724. [DOI] [PMC free article] [PubMed] [Google Scholar]
- 100.Pelham H.R.B. Speculations on the functions of the major heat shock and glucose-regulated proteins. Cell. 1986;46:959–961. doi: 10.1016/0092-8674(86)90693-8. [DOI] [PubMed] [Google Scholar]
- 101.Domingues A., Fantin A. Neuropilin 1 Regulation of Vascular Permeability Signaling. Biomolecules. 2021;11:666. doi: 10.3390/biom11050666. [DOI] [PMC free article] [PubMed] [Google Scholar]
- 102.Trimmer C., Keller A., Murphy N.R., Snyder L.L., Willer J.R., Nagai M.H., Katsanis N., Vosshall L.B., Matsunami H., Mainland J.D. Genetic variation across the human olfactory receptor repertoire alters odor perception. Proc. Natl. Acad. Sci. USA. 2019;116:9475–9480. doi: 10.1073/pnas.1804106115. [DOI] [PMC free article] [PubMed] [Google Scholar]
- 103.Gilad Y., Lancet D. Population differences in the human functional olfactory repertoire. Mol. Biol. Evol. 2003;20:307–314. doi: 10.1093/molbev/msg013. [DOI] [PubMed] [Google Scholar]
- 104.Chess A., Simon I., Cedar H., Axel R. Allelic inactivation regulates olfactory receptor gene expression. Cell. 1994;78:823–834. doi: 10.1016/S0092-8674(94)90562-2. [DOI] [PubMed] [Google Scholar]
- 105.Sokal R., Rohlf F. The comparison of dendrograms by objective methods. Taxon. 1962;11:33–40. doi: 10.2307/1217208. [DOI] [Google Scholar]
- 106.Nicolaides N.C., Charmandari E., Chrousos G.P., Kino T. Recent advances in the molecular mechanisms determining tissue sensitivity to glucocorticoids: Novel mutations, circadian rhythm and ligand-induced repression of the human glucocorticoid receptor. BMC Endocr. Disord. 2014;14:71. doi: 10.1186/1472-6823-14-71. [DOI] [PMC free article] [PubMed] [Google Scholar]
- 107.Grad I., Picard D. The glucocorticoid responses are shaped by molecular chaperones. Mol. Cell Endocrinol. 2007;275:2–12. doi: 10.1016/j.mce.2007.05.018. [DOI] [PubMed] [Google Scholar]
- 108.Oakley R.H., Cidlowski J.A. The biology of the glucocorticoid receptor: New signaling mechanisms in health and disease. J. Allergy Clin. Immunol. 2013;132:1033–1044. doi: 10.1016/j.jaci.2013.09.007. [DOI] [PMC free article] [PubMed] [Google Scholar]
- 109.Cole T.J., Blendy J.A., Monaghan A.P., Krieglstein K., Schmid W., Aguzzi A., Fantuzzi G., Hummler E., Unsicker K., Schutz G. Targeted disruption of the glucocorticoid receptor gene blocks adrenergic chromaffin cell development and severely retards lung maturation. Genes Dev. 1995;9:1608–1621. doi: 10.1101/gad.9.13.1608. [DOI] [PubMed] [Google Scholar]
- 110.Harbour J.W., Luo R.X., Santi A.D., Postigo A.A., Dean D.C. Cdk Phosphorylation Triggers Sequential Intramolecular Interactions that Progressively Block Rb Functions as Cells Move through G1. Cell. 1999;98:859–869. doi: 10.1016/S0092-8674(00)81519-6. [DOI] [PubMed] [Google Scholar]
- 111.Rogatsky I., Trowbridge J.M., Garabedian M.J. Glucocorticoid receptor-mediated cell cycle arrest is achieved through distinct cell-specific transcriptional regulatory mechanisms. Mol. Cell Biol. 1997;17:3181–3193. doi: 10.1128/MCB.17.6.3181. [DOI] [PMC free article] [PubMed] [Google Scholar]
- 112.Zhang Z., Turer E., Li X., Zhan X., Choi M., Tang M., Press A., Smith S.R., Divoux A., Moresco E.M., et al. Insulin resistance and diabetes caused by genetic or diet-induced KBTBD2 deficiency in mice. Proc. Natl. Acad. Sci. USA. 2016;113:E6418–E6426. doi: 10.1073/pnas.1614467113. [DOI] [PMC free article] [PubMed] [Google Scholar]
- 113.Geering B., Cutillas P.R., Nock G., Gharbi S.I., Vanhaesebroeck B. Class IA phosphoinositide 3-kinases are obligate p85-p110 heterodimers. Proc. Natl. Acad. Sci. USA. 2007;104:7809–7814. doi: 10.1073/pnas.0700373104. [DOI] [PMC free article] [PubMed] [Google Scholar]
- 114.Arancibia S., Benitez D., Nunez L.E., Jewell C.M., Langjahr P., Candia E., Zapata-Torres G., Cidlowski J.A., Gonzalez M.J., Hermoso M.A. Phosphatidylinositol 3-kinase interacts with the glucocorticoid receptor upon TLR2 activation. J. Cell Mol. Med. 2011;15:339–349. doi: 10.1111/j.1582-4934.2009.00958.x. [DOI] [PMC free article] [PubMed] [Google Scholar]
- 115.Heiska L., Carpen O. Src phosphorylates ezrin at tyrosine 477 and induces a phosphospecific association between ezrin and a kelch-repeat protein family member. J. Biol. Chem. 2005;280:10244–10252. doi: 10.1074/jbc.M411353200. [DOI] [PubMed] [Google Scholar]
- 116.Gautreau A., Poullet P., Louvard D., Arpin M. Ezrin, a plasma membrane-microfilament linker, signals cell survival through the phosphatidylinositol 3-kinase/Akt pathway. Proc. Natl. Acad. Sci. USA. 1999;96:7300–7305. doi: 10.1073/pnas.96.13.7300. [DOI] [PMC free article] [PubMed] [Google Scholar]
- 117.van Dam S., Vosa U., van der Graaf A., Franke L., de Magalhaes J.P. Gene co-expression analysis for functional classification and gene-disease predictions. Brief. Bioinform. 2018;19:575–592. doi: 10.1093/bib/bbw139. [DOI] [PMC free article] [PubMed] [Google Scholar]
- 118.Kino T., De Martino M.U., Charmandari E., Mirani M., Chrousos G.P. Tissue glucocorticoid resistance/hypersensitivity syndromes. J. Steroid Biochem. Mol. Biol. 2003;85:457–467. doi: 10.1016/S0960-0760(03)00218-8. [DOI] [PubMed] [Google Scholar]
- 119.Stortz M., Pecci A., Presman D.M., Levi V. Unraveling the molecular interactions involved in phase separation of glucocorticoid receptor. BMC Biol. 2020;18:59. doi: 10.1186/s12915-020-00788-2. [DOI] [PMC free article] [PubMed] [Google Scholar]
- 120.Rowland L.P., Shneider N.A. Amyotrophic lateral sclerosis. N. Engl. J. Med. 2001;344:1688–1700. doi: 10.1056/NEJM200105313442207. [DOI] [PubMed] [Google Scholar]
- 121.Chio A., Logroscino G., Traynor B.J., Collins J., Simeone J.C., Goldstein L.A., White L.A. Global epidemiology of amyotrophic lateral sclerosis: A systematic review of the published literature. Neuroepidemiology. 2013;41:118–130. doi: 10.1159/000351153. [DOI] [PMC free article] [PubMed] [Google Scholar]
- 122.Connolly O., Le Gall L., McCluskey G., Donaghy C.G., Duddy W.J., Duguez S. A Systematic Review of Genotype-Phenotype Correlation across Cohorts Having Causal Mutations of Different Genes in ALS. J. Pers. Med. 2020;10:58. doi: 10.3390/jpm10030058. [DOI] [PMC free article] [PubMed] [Google Scholar]
- 123.Nicolas A., Kenna K.P., Renton A.E., Ticozzi N., Faghri F., Chia R., Dominov J.A., Kenna B.J., Nalls M.A., Keagle P., et al. Genome-wide Analyses Identify KIF5A as a Novel ALS Gene. Neuron. 2018;97:1268–1283. doi: 10.1016/j.neuron.2018.02.027. [DOI] [PMC free article] [PubMed] [Google Scholar]
- 124.Volk A.E., Weishaupt J.H., Andersen P.M., Ludolph A.C., Kubisch C. Current knowledge and recent insights into the genetic basis of amyotrophic lateral sclerosis. Med. Genet. 2018;30:252–258. doi: 10.1007/s11825-018-0185-3. [DOI] [PMC free article] [PubMed] [Google Scholar]
- 125.Van Damme P. How much of the missing heritability of ALS is hidden in known ALS genes? J. Neurol. Neurosurg. Psychiatry. 2018;89:794. doi: 10.1136/jnnp-2018-318354. [DOI] [PMC free article] [PubMed] [Google Scholar]
- 126.Vijayakumar U.G., Milla V., Cynthia Stafford M.Y., Bjourson A.J., Duddy W., Duguez S.M. A Systematic Review of Suggested Molecular Strata, Biomarkers and Their Tissue Sources in ALS. Front. Neurol. 2019;10:400. doi: 10.3389/fneur.2019.00400. [DOI] [PMC free article] [PubMed] [Google Scholar]
- 127.Le Gall L., Anakor E., Connolly O., Vijayakumar U.G., Duddy W.J., Duguez S. Molecular and Cellular Mechanisms Affected in ALS. J. Pers. Med. 2020;10:101. doi: 10.3390/jpm10030101. [DOI] [PMC free article] [PubMed] [Google Scholar]
- 128.Vissing J. Limb girdle muscular dystrophies: Classification, clinical spectrum and emerging therapies. Curr. Opin. Neurol. 2016;29:635–641. doi: 10.1097/WCO.0000000000000375. [DOI] [PubMed] [Google Scholar]
- 129.Liewluck T., Milone M. Untangling the complexity of limb-girdle muscular dystrophies. Muscle Nerve. 2018;58:167–177. doi: 10.1002/mus.26077. [DOI] [PubMed] [Google Scholar]
- 130.Straub V., Murphy A., Udd B., group L.W.S. 229th ENMC international workshop: Limb girdle muscular dystrophies—Nomenclature and reformed classification Naarden, the Netherlands, 17–19 March 2017. Neuromuscul. Disord. 2018;28:702–710. doi: 10.1016/j.nmd.2018.05.007. [DOI] [PubMed] [Google Scholar]
- 131.Barton E.R., Pacak C.A., Stoppel W.L., Kang P.B. The ties that bind: Functional clusters in limb-girdle muscular dystrophy. Skelet Muscle. 2020;10:22. doi: 10.1186/s13395-020-00240-7. [DOI] [PMC free article] [PubMed] [Google Scholar]
- 132.Nguengang Wakap S., Lambert D.M., Olry A., Rodwell C., Gueydan C., Lanneau V., Murphy D., Le Cam Y., Rath A. Estimating cumulative point prevalence of rare diseases: Analysis of the Orphanet database. Eur. J. Hum. Genet. 2020;28:165–173. doi: 10.1038/s41431-019-0508-0. [DOI] [PMC free article] [PubMed] [Google Scholar]
- 133.Fifita J.A., Williams K.L., Sundaramoorthy V., McCann E.P., Nicholson G.A., Atkin J.D., Blair I.P. A novel amyotrophic lateral sclerosis mutation in OPTN induces ER stress and Golgi fragmentation in vitro. Amyotroph Lateral Scler. Front. Degener. 2017;18:126–133. doi: 10.1080/21678421.2016.1218517. [DOI] [PubMed] [Google Scholar]
- 134.Barsh G.S., Seeburg P.H., Gelinas R.E. The human growth hormone gene family: Structure and evolution of the chromosomal locus. Nucleic Acids Res. 1983;11:3939–3958. doi: 10.1093/nar/11.12.3939. [DOI] [PMC free article] [PubMed] [Google Scholar]
- 135.Dehkhoda F., Lee C.M.M., Medina J., Brooks A.J. The Growth Hormone Receptor: Mechanism of Receptor Activation, Cell Signaling, and Physiological Aspects. Front. Endocrinol. (Lausanne) 2018;9:35. doi: 10.3389/fendo.2018.00035. [DOI] [PMC free article] [PubMed] [Google Scholar]
- 136.Strous G.J., Almeida A.D.S., Putters J., Schantl J., Sedek M., Slotman J.A., Nespital T., Hassink G.C., Mol J.A. Growth Hormone Receptor Regulation in Cancer and Chronic Diseases. Front. Endocrinol. (Lausanne) 2020;11:597573. doi: 10.3389/fendo.2020.597573. [DOI] [PMC free article] [PubMed] [Google Scholar]
- 137.Bole-Feysot C., Goffin V., Edery M., Binart N., Kelly P.A. Prolactin (PRL) and its receptor: Actions, signal transduction pathways and phenotypes observed in PRL receptor knockout mice. Endocr. Rev. 1998;19:225–268. doi: 10.1210/edrv.19.3.0334. [DOI] [PubMed] [Google Scholar]
- 138.Angulo M.A., Butler M.G., Cataletto M.E. Prader-Willi syndrome: A review of clinical, genetic, and endocrine findings. J. Endocrinol. Invest. 2015;38:1249–1263. doi: 10.1007/s40618-015-0312-9. [DOI] [PMC free article] [PubMed] [Google Scholar]
- 139.Ehrhart F., Janssen K.J.M., Coort S.L., Evelo C.T., Curfs L.M.G. Prader-Willi syndrome and Angelman syndrome: Visualisation of the molecular pathways for two chromosomal disorders. World J. Biol. Psychiatry. 2019;20:670–682. doi: 10.1080/15622975.2018.1439594. [DOI] [PubMed] [Google Scholar]
- 140.Chen E.Y., Liao Y.C., Smith D.H., Barrera-Saldana H.A., Gelinas R.E., Seeburg P.H. The human growth hormone locus: Nucleotide sequence, biology, and evolution. Genomics. 1989;4:479–497. doi: 10.1016/0888-7543(89)90271-1. [DOI] [PubMed] [Google Scholar]
- 141.Pelechano V., Steinmetz L.M. Gene regulation by antisense transcription. Nat. Rev. Genet. 2013;14:880–893. doi: 10.1038/nrg3594. [DOI] [PubMed] [Google Scholar]
- 142.Lan T., Li H., Zhang D., Xu L., Liu H., Hao X., Yan X., Liao H., Chen X., Xie K., et al. KIAA1429 contributes to liver cancer progression through N6-methyladenosine-dependent post-transcriptional modification of GATA3. Mol. Cancer. 2019;18:186. doi: 10.1186/s12943-019-1106-z. [DOI] [PMC free article] [PubMed] [Google Scholar]
- 143.Liu Y., Chen S., Cai K., Zheng D., Zhu C., Li L., Wang F., He Z., Yu C., Sun C. Hypoxia-induced long noncoding RNA NR2F1-AS1 maintains pancreatic cancer proliferation, migration, and invasion by activating the NR2F1/AKT/mTOR axis. Cell Death Dis. 2022;13:232. doi: 10.1038/s41419-022-04669-0. [DOI] [PMC free article] [PubMed] [Google Scholar]
- 144.Saitou N., Nei M. The neighbor-joining method: A new method for reconstructing phylogenetic trees. Mol. Biol. Evol. 1987;4:406–425. doi: 10.1093/oxfordjournals.molbev.a040454. [DOI] [PubMed] [Google Scholar]
- 145.Piccolo S.R., Sun Y., Campbell J.D., Lenburg M.E., Bild A.H., Johnson W.E. A single-sample microarray normalization method to facilitate personalized-medicine workflows. Genomics. 2012;100:337–344. doi: 10.1016/j.ygeno.2012.08.003. [DOI] [PMC free article] [PubMed] [Google Scholar]
- 146.Kel A.E., Gossling E., Reuter I., Cheremushkin E., Kel-Margoulis O.V., Wingender E. MATCH: A tool for searching transcription factor binding sites in DNA sequences. Nucleic Acids Res. 2003;31:3576–3579. doi: 10.1093/nar/gkg585. [DOI] [PMC free article] [PubMed] [Google Scholar]
- 147.Matys V., Fricke E., Geffers R., Gossling E., Haubrock M., Hehl R., Hornischer K., Karas D., Kel A.E., Kel-Margoulis O.V., et al. TRANSFAC: Transcriptional regulation, from patterns to profiles. Nucleic Acids Res. 2003;31:374–378. doi: 10.1093/nar/gkg108. [DOI] [PMC free article] [PubMed] [Google Scholar]
- 148.McInnes L., Healy J., Melville J. Umap: Uniform manifold approximation and projection for dimension reduction. arXiv. 1802:2018:1802.03426. doi: 10.48550/arXiv.1802.03426. [DOI] [Google Scholar]
- 149.Riley B., Williamson M., Collier D., Wilkie H., Makoff A. A 3-Mb map of a large Segmental duplication overlapping the alpha7-nicotinic acetylcholine receptor gene (CHRNA7) at human 15q13-q14. Genomics. 2002;79:197–209. doi: 10.1006/geno.2002.6694. [DOI] [PubMed] [Google Scholar]
- 150.Florio M., Albert M., Taverna E., Namba T., Brandl H., Lewitus E., Haffner C., Sykes A., Wong F.K., Peters J., et al. Human-specific gene ARHGAP11B promotes basal progenitor amplification and neocortex expansion. Science. 2015;347:1465–1470. doi: 10.1126/science.aaa1975. [DOI] [PubMed] [Google Scholar]
- 151.Heide M., Huttner W.B. Human-Specific Genes, Cortical Progenitor Cells, and Microcephaly. Cells. 2021;10:1209. doi: 10.3390/cells10051209. [DOI] [PMC free article] [PubMed] [Google Scholar]
- 152.Gable A.L., Szklarczyk D., Lyon D., Matias Rodrigues J.F., von Mering C. Systematic assessment of pathway databases, based on a diverse collection of user-submitted experiments. Brief. Bioinform. 2022;23:bbac355. doi: 10.1093/bib/bbac355. [DOI] [PMC free article] [PubMed] [Google Scholar]
- 153.Gutteck N., Savov P., Panian M., Wohlrab D., Zeh A., Delank K.S. Preliminary results of a plantar plate for Lapidus arthrodesis. Foot Ankle Surg. 2018;24:383–388. doi: 10.1016/j.fas.2017.04.009. [DOI] [PubMed] [Google Scholar]
- 154.Goyal R., Gupta T., Bal A., Sahni D., Singh G. Role of Melatonin in Breast Carcinoma: Correlation of Expression Patterns of Melatonin-1 Receptor With Estrogen, Progesterone, and HER2 Receptors. Appl. Immunohistochem. Mol. Morphol. 2020;28:518–523. doi: 10.1097/PAI.0000000000000788. [DOI] [PubMed] [Google Scholar]
Associated Data
This section collects any data citations, data availability statements, or supplementary materials included in this article.
Supplementary Materials
Data Availability Statement
HGCA2.0 is available as a web service through https://www.michalopoulos.net/hgca2.0/ (accessed on 20 January 2023); Gene counts were downloaded from https://storage.googleapis.com/gtex_analysis_v8/rna_seq_data/GTEx_Analysis_2017-06-05_v8_RNASeQCv1.1.9_gene_reads.gct.gz (accessed on 20 January 2023); TPMs were downloaded from https://storage.googleapis.com/gtex_analysis_v8/rna_seq_data/GTEx_Analysis_2017-06-05_v8_RNASeQCv1.1.9_gene_tpm.gct.gz (accessed on 20 January 2023); Sample metadata were downloaded from https://storage.googleapis.com/gtex_analysis_v8/annotations/GTEx_Analysis_v8_Annotations_SampleAttributesDS.txt (accessed on 20 January 2023) and https://www.ebi.ac.uk/arrayexpress/files/E-MTAB-5214/E-MTAB-5214.sdrf.txt (accessed on 20 January 2023); ReMap2020 data were downloaded from http://remap.univ-amu.fr/storage/remap2020/hg38/MACS2/remap2020_crm_macs2_hg38_v1_0.bed.gz (accessed on 20 January 2023); ENCODE data were downloaded from https://maayanlab.cloud/static/hdfs/harmonizome/data/encodetfppi/gene_attribute_edges.txt.gz (accessed on 20 January 2023); Cytoband coordinates were downloaded from https://ftp.ncbi.nlm.nih.gov/pub/gdp/ideogram_9606_GCF_000001305.15_400_V1 (accessed on 20 January 2023) https://ftp.ncbi.nlm.nih.gov/pub/gdp/ideogram_9606_GCF_000001305.15_550_V1 (accessed on 20 January 2023) and https://ftp.ncbi.nlm.nih.gov/pub/gdp/ideogram_9606_GCF_000001305.15_850_V1 (accessed on 20 January 2023); Gene Ontology data were downloaded from http://purl.obolibrary.org/obo/go.obo (accessed on 20 January 2023); WikiPathways were downloaded from https://wikipathways-data.wmcloud.org/20200410/gmt/wikipathways-20200410-gmt-Homo_sapiens.gmt (accessed on 20 January 2023); OMIM data were downloaded after registration from https://www.omim.org/downloads (accessed on 20 January 2023); DisGeNet data were downloaded from https://www.disgenet.org/static/disgenet_ap1/files/downloads/all_gene_disease_associations.tsv.gz (accessed on 20 January 2023); Pfam data were downloaded from https://ftp.ebi.ac.uk/pub/databases/Pfam/releases/Pfam33.1/Pfam-A.clans.tsv.gz (accessed on 20 January 2023); Genomic data were downloaded from http://jan2020.archive.ensembl.org/biomart/martview/ (accessed on 20 January 2023); KEGG Pathways were downloaded from https://www.genome.jp/dbget-bin/get_linkdb?-t+pathway+gn:T01001 (accessed on 20 January 2023).