

Abstract
Objective:
To determine if baseline biomarkers are associated with longitudinal changes in the worsening of disc space narrowing (DSN), vertebral osteophytes (OST), and low back pain (LBP).
Design:
Paired baseline (2003–2004) and follow-up (2006–2010) lumbar spine radiographs from the Johnston County Osteoarthritis Project were graded for severity of DSN and OST. LBP severity was self-reported. Concentrations of analytes (cytokines, proteoglycans, and neuropeptides) were quantified by immunoassay. Pressure-pain threshold (PPT), a marker of sensitivity to pressure pain, was measured with a standard dolorimeter. Binary logistic regression models were used to estimate odd ratios (OR) and 95% confidence intervals (CI) of biomarker levels with DSN, OST, or LBP. Interactions were tested between biomarker levels and the number of affected lumbar spine levels or LBP.
Results:
We included participants (n=723) with biospecimens, PPT, and paired lumbar spine radiographic data. Baseline Lumican, a proteoglycan reflective of extracellular matrix changes, was associated with longitudinal changes in DSN worsening (OR=3.19 [95% CI 1.22, 8.01]). Baseline brain-derived neuropathic factor, a neuropeptide, (OR=1.80 [95% CI 1.03, 3.16]) was associated with longitudinal changes in OST worsening, which may reflect osteoclast genesis. Baseline hyaluronic acid (OR=1.31 [95% CI 1.01, 1.71]), indicative of systemic inflammation, and PPT (OR=1.56 [95% CI 1.02, 2.31]) were associated with longitudinal increases in LBP severity.
Conclusion:
These findings suggest that baseline biomarkers are associated with longitudinal changes occurring in structures of the lumbar spine (DSN vs OST). Markers of inflammation and perceived pressure pain sensitivity were associated with longitudinal worsening of LBP.
Keywords: biomarkers, low back pain, intervertebral disc degeneration, cohort study, spine degeneration
Introduction
Disc space narrowing (DSN) from degeneration of the intervertebral disc and vertebral osteophyte (OST) formation are two potential sources of nociceptive pain in the lower back1–6. There are several possible reasons why degeneration occurs over time within these structures, such as clinical characteristics1, 4, injury, normal aging4 or genetics7. The most common biological reason for intervertebral disc degeneration is a loss of proteoglycans, such as Lumican, found in the extracellular matrix of the nucleus and annulus8–10. In addition, inflammation may accelerate intervertebral disc degeneration and OST formation11, 12. Identifying whether baseline biomarkers are associated with a longitudinal change in the worsening of DSN and OST degeneration in community-based studies may lead to potential therapeutic targets to decrease or prevent spine degeneration that is often associated with low back pain (LBP).
Biomarkers may improve our understanding of the etiological changes that occur during a degenerative process13. Our group and others have identified positive associations between biochemical biomarkers and lumbar spine disc DSN and OST14–18. For example, urinary type II collagen (CTX-II) and serum hyaluronic acid (HA) reflect differences in the etiological process of spine degeneration14, 15. Our group has also identified several associations between DSN and individual biomarkers related to inflammation, osteoprotegerin (OPG)19, interleukin-6 (IL-6)20, and pain neuropeptide-Y (NPY)16. In addition, we identified clusters of biomarkers, to be associated with DSN16, 21. The combination of biomarkers associated with structure was Lumican22 and Keratin-1923, 24, associated with inflammation was OPG and Regulated upon Activation, Normal T Cell Expressed and Presumably Secreted (RANTES), and NPY was associated with pain. In addition, quantitative sensory measures, such as pressure-pain threshold (PPT), a biomarker of pressure pain sensitivity, have been found to be important predictors of LBP25 and associated with lumbar spine post-surgical outcomes26. These findings suggest that biochemical biomarkers and PPT measures may help define the etiological process of spine degeneration and LBP. However, to our knowledge, no community-based study has examined baseline biomarkers or PPT and longitudinal changes in the worsening of lumbar spine DSN, OST, and LBP.
Understanding the longitudinal relationships between biomarkers and worsening of DSN and OST could provide valuable insight into the etiology of lumbar spine degeneration. Therefore, our objective was to: (1) determine if baseline biomarkers, quantified in human serum and urine, or PPT are associated with a longitudinal change in the worsening of lumbar spine vertebral OST or DSN, and LBP, and (2) determine if the number of involved levels of worsening lumbar spine DSN or OST influences the relationship between biomarkers, lumbar spine degeneration, and LBP. We hypothesized that baseline biochemical biomarkers originating from lumbar spine structures and/or inflammatory processes would be associated with the longitudinal change in the worsening of DSN and OST, and baseline biomarkers related to inflammation or PPT would be associated with the longitudinal change in the worsening of LBP.
Method
Participants
Details of the sampling strategy and recruitment methods used for the Johnston County Osteoarthritis Project (JoCoOA) are described elsewhere5, 27 Briefly, this ongoing longitudinal study of osteoarthritis (OA) includes African American (nearly one-third of the cohort) and White participants living in a largely rural county in North Carolina. Civilian, non-institutionalized residents aged ≥45 years from six townships in Johnston County were enrolled between 1991 and 1998 (n=3187, Original Cohort), and additional residents were enrolled between 2003 and 2004 (n=1015, Enrichment Cohort). Since the Enrichment Cohort aimed to supplement the sample for African Americans and younger participants, participants enrolled during 2003–2004 tended to be younger (Enrichment Cohort, mean age 59.3 years vs. Original Cohort, mean age 65.8 years) and were more likely to be African American (Enrichment Cohort, 40% vs. Original Cohort, 28%) than the Original Cohort participants were at first follow-up (1999–2003); the two groups did not differ according to sex28. Participants in the JoCoOA completed follow-up clinical and interview data collection approximately every 5 years, with 1,695 participants seen during the 2006–2010 clinic visit (time point T2). All participants in the JoCoOA provided informed consent for participation, and the JoCoOA has been continuously approved by the institutional review boards of the University of North Carolina and the Centers for Disease Control and Prevention in Atlanta, Georgia and all procedures followed were in accordance with all ethical standards on human experimentation (institutional and national) and with the Helsinki Declaration of 1975, as revised in 2000.
Demographic and Clinical Characteristics
Demographic data, including age, sex, and race (African American/White), were collected by clinical interview and examination. Clinical characteristics included self-reports of comorbidities (diabetes, high blood pressure, cardiovascular disease, liver disease, depression and/or cancer) as well as body mass index (BMI) at the time of clinic visit (calculated from height measured without shoes and weight measured with a balance beam scale). Non-steroidal anti-inflammatory drug (NSAID) use was ascertained at baseline by participant self-report.
Biomarkers
Details regarding the collection of biospecimens have been described elsewhere in detail14. In short, all participants had blood and urine samples collected in clinic on the same day radiographs were taken. All samples were collected after completing morning activity (> 1 hour after arising) when serum markers were in equilibrium29. Serum concentrations of N-cadherin, Lumican, C-X Motif Chemokine Ligand 6 (CXCL6), OPG, RANTES, interleukin-17 (IL-17), interleukin-6 (IL-6), HA, brain-derived neurotrophic factor (BDNF), and neuropeptide-y (NPY) measured in baseline samples were the analytes of interest for this study. Urinary C-terminal crosslinked telopeptide of type-II collagen (CTX-II) was quantified from human urine, and adjusted for creatinine levels. Our selection of biochemical biomarkers is based on our previous assessments of these biomarkers and PPT in cross-sectional studies14–16, 30. We grouped biomarkers of interest in this study into three categories based on their relationship with lumbar spine structural changes, inflammation, or pain. The category of biomarkers with a relationship to structural changes included N-cadherin, Lumican, HA, and CTX-II. The second biomarker category, those with a relationship to inflammation, included IL-6, OPG, IL-17A, RANTES, and CXCL6. The third biomarker category, those with a relationship to pain, included NPY and BDNF. Our prior cross-sectional work found CTX-II (along with HA) to be associated with DSN and OST14, 15. Additional details of the distributions (mean, standard deviation, median, and range), manufacturer, intra and inter-assay variability, lower limit of detection, and dilution amounts are provided in Supplementary Table 1. Intra- and inter-assay coefficients of variation were calculated for all duplicate-analyzed biochemical biomarkers, with values below 15% representing good reliability. All the biomarkers had measurable concentrations except for IL-17A for which only 10% of the samples were greater than the lower limit of detection; as such, we excluded IL-17A from analyses.
Pressure-Pain Threshold
Pressure-pain threshold was measured by a single trained research assistant using a standard mechanical pressure-based dolorimeter to assess the threshold for pressure-pain (in kilograms) at the upper trapezius bilaterally for each participant. All PPT clinical measurements began with a practice trial demonstration of the device with the participant. These measurements were collected in a systematic fashion. Starting with the left side, pressure was applied at a rate of 1 kg per second until pain was reported by the participant or a maximum pressure of 4 kg was reached. If the participant did not report pain at 4 kg, the value was recorded as, >4.0 kg. Trials were continued until two consecutive readings were within ±0.4 kg for a maximum of four trials. This procedure was then repeated on the right side. Recorded PPT score was the mean of the left and right trapezius PPT values. A lower PPT score suggests greater pressure pain sensitivity.
Radiographic Spine Films
Lumbar spine radiographs were included in the JoCoOA study at the T2 2006–2010 clinic visit.. By protocol, women of reproductive age (<50 years) were excluded from having lumbar spine radiographs. Lumbar spine radiographs were performed with the participant lying on their left side, a common position for clinical radiographs that can standardize the technical quality and reproducibility of positioning, with the central beam centered at the lumbar spine. The Burnett Atlas31 was used to grade lumbar spine radiographic features of DSN and OST. DSN and OST were graded in a semi-quantitative fashion (0=none, 1=mild, 2=moderate, and 3=severe) by an experienced single bone and joint radiologist (JR) with an intra-rater reliability with a kappa of 0.89 for DSN and 0.90 for OST15.
Knee Osteoarthritis
The protocol for conducting knee joint OA radiographs has been described in detail elsewhere32, 33. All knee radiographs were read for Kellgren-Lawrence grade (KLG)34 by the same radiologist. Inter-rater and intra-rater reliability have been reported previously with a kappa of 0.89 for the knee32. Knee OA for these analyses was defined as a KLG of 2–4 in at least one knee.
Low Back Pain
LBP was ascertained at the clinical interview by asking participants to answer “yes” or “no” to the question, “On most days do you have pain, aching, or stiffness in your lower back?” Those participants who reported “yes” were also asked to quantify the severity of their symptoms as “mild,” “moderate,” or “severe.”
Statistical Analysis
Descriptive statistics were generated for the total sample. Worsening was defined as ≥1-unit increase in severity from baseline to follow-up for OST and DSN. As in our previous cross-sectional work14, severity scores were summed across the five lumbar spine levels to create separate total DSN and OST scores. As such, DSN could have a maximum total score of 15, and OST could have a maximum total score of 30 for each participant. Due to sparse data in the upper scores, we collapsed score categories to ‘no DSN worsening’ or ‘any DSN worsening’. Since OST had a wide range of scores and these features are highly prevalent, we defined OST score change from the paired baseline to follow-up of 0 or 1 as “no worsening” and those with a score change between 2–30 as “worsening”. LBP was considered worsening if there was a ≥ 1-unit increase in severity from baseline to follow-up. Those with baseline severe LBP were excluded as they were unable to have a 1-unit increase in symptoms (n=54; Figure 1). Additionally, participants who had improved pain between baseline and follow-up were also excluded from regression analyses involving pain worsening (n=65), since the relationship between biomarkers and pain worsening and pain improvement may differ in direction of the association. Some biomarkers had skewed distributions; as such, the natural logarithm transformation was applied to each biomarker value before conducting analysis.
Figure 1.
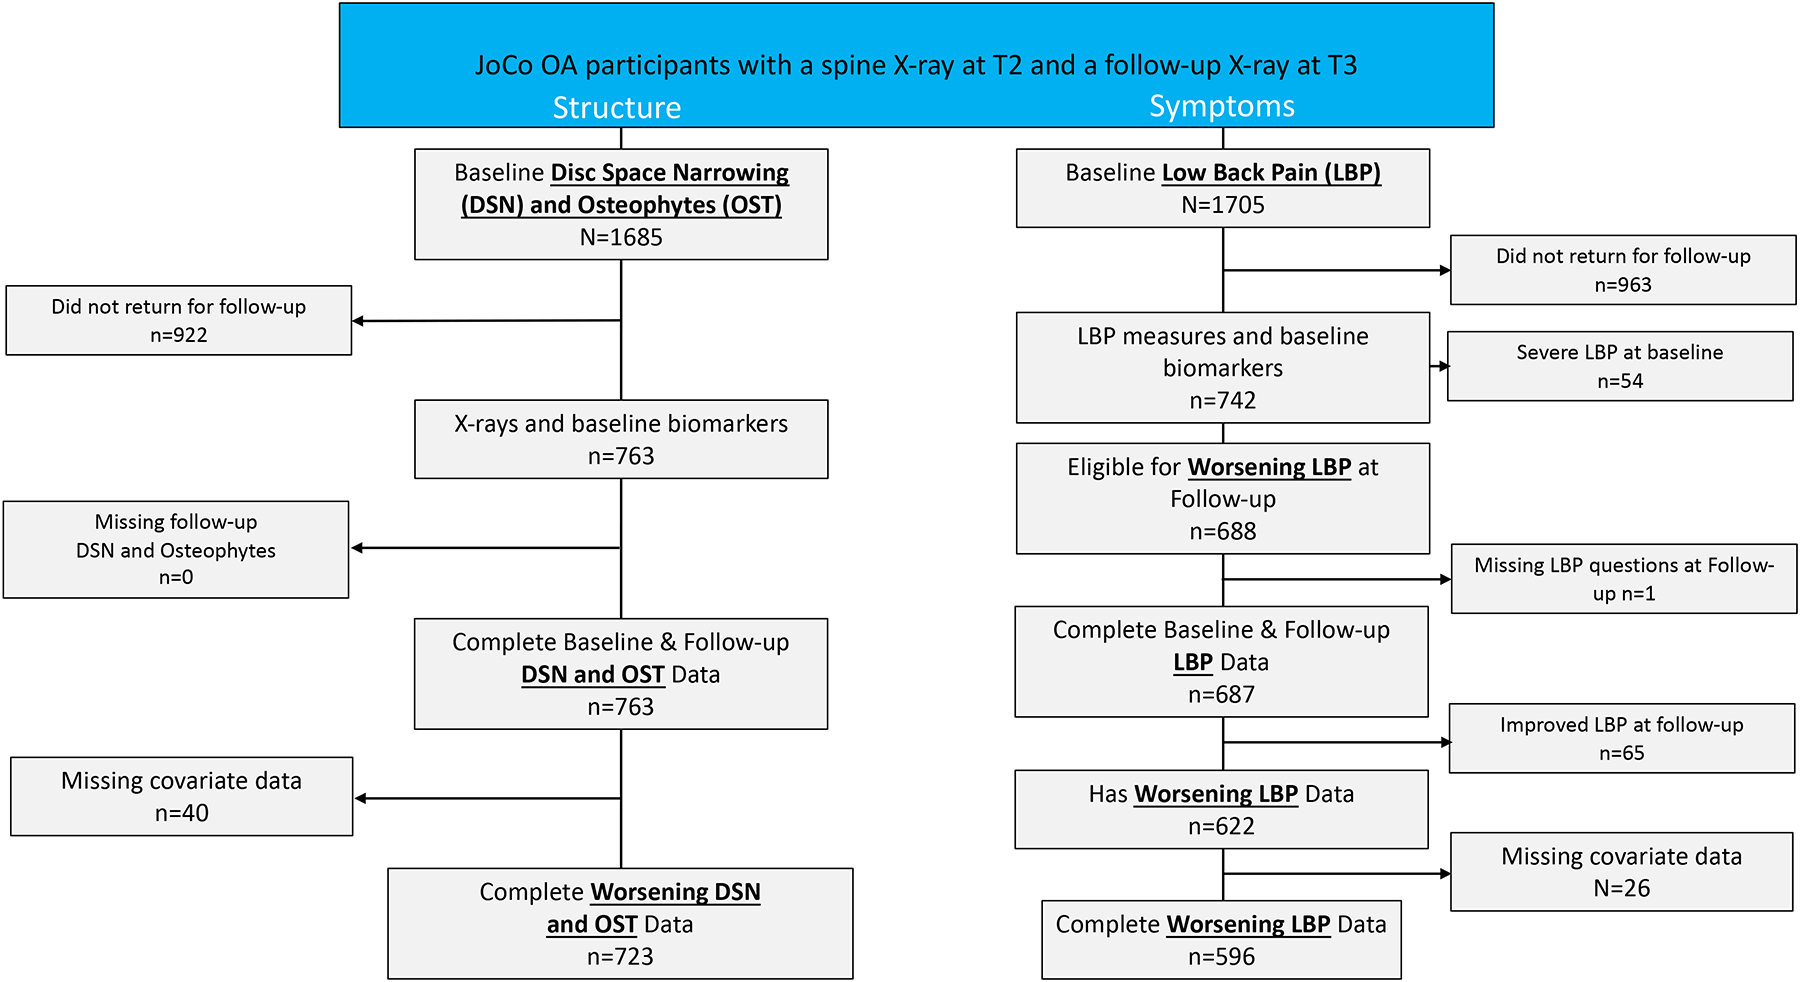
Flow of study participants from time point 2 (T2) to time point 3 (T3).
JoCoOA= Johnston County Osteoarthritis Project; DSN= disc space narrowing; LBP= lower back pain.
*Covariates: age, race, sex, BMI, knee OA, having 2+ comorbidities (CVD, hypertension, diabetes, liver disease, cancer, depression), NSAIDs.
T-tests were used to determine differences in biomarker levels across categories of radiographic features and LBP. Multiple logistic regression models were used to determine baseline biomarker associations with the longitudinal change in the worsening of DSN, OST, or LBP. We examined three different models for our worsening of lumbar spine structure or pain outcomes. In the first model, we included demographic variables (age, race, and sex). In the second model, we included the previously mentioned demographic variables in addition to clinical characteristics (diabetes, high blood pressure, smoking status, and BMI), knee OA and NSAIDs. In our third model, we included all the covariates mentioned in Models 1 and 2 plus an adjustment for OST or DSN score change and OST or DSN baseline values, as appropriate. We included the other radiographic feature (DSN or OST) as a covariate in the model to help determine the independence between the biomarkers and the radiographic feature as the outcome. We explored pairwise interaction terms between biomarker levels and the number of lumbar spine levels of DSN or OST, but we did not identify any important interactions. All analyses were conducted in SAS 9.4 (SAS Institute Inc., Cary, NC), and alpha was set at two-sided 0.05.
Results
The selection of participants in JoCoOA for both structure and symptom outcomes for these analyses is provided in Figure 1. For our structure outcomes, we selected participants from the cohort if they had lumbar spine radiographs at both baseline and follow-up. Data were missing if the participant had been lost to follow-up or failed to return for the clinic follow-up visit (n=922) or missing covariate data (n=40). As such, approximately 45% (n=763) of the cohort had complete lumbar spine radiographic readings for DSN and OST. For our LBP outcome, approximately 56% (n=963) were lost to follow-up or failed to return for clinic follow-up visit. Participants with self-reported severe LBP were excluded (n=54) as they were not eligible for worsening LBP. After accounting for prevalent severe LBP (i.e., not at risk for worsening), improvement in LBP symptoms from baseline to follow-up, and missing covariate data, 596 participants were eligible for LBP worsening analysis. The average length of time for the participant’s follow-up was 5.5 years (standard deviation=0.7; range 2.9–7.3 years). The most common reason for participant loss-to-follow-up was participant death which was unrelated to cohort participation. In addition, those lost to follow-up were more likely to be older, have a BMI less than 30, self-reported diabetes, high blood pressure, and knee OA4.
The baseline demographic, clinical characteristics and NSAIDs as well as knee OA for DSN, OST, and LBP are described in Table 1. Just over two-thirds (69.6%) were women, and 33.2% were African American. The average age was 66.1 years and average BMI was 31.4 kg/m2. Over a third of participants had knee OA (39.4%) and greater than two comorbidities (36.7%). A large proportion reported taking NSAIDs (64.2%). When compared to those with no DSN, participants with DSN at ≥1 level were older (no DSN, 63.8 years; DSN ≥1, 66.9 years), less likely to be African American (no DSN, 42.1%; DSN ≥1, 30.0%), and more likely to have had knee OA (no DSN, 29.5%; DSN ≥1, 43.0%). When compared to participants with no OST, participants with OST at ≥2 levels were less likely to be women (OST <2, 82.5%; OST ≥2, 65.0%), and less likely to be African American (OST <2, 42.9%; OST ≥2, 29.8%). When compared to participants without LBP, a higher proportion of those with LBP had a lower threshold (<4kg) for pressure pain (without LBP, 20.1%; with LBP, 39.5%). When compared to participants without LBP, participants with any LBP were more likely to be women (without LBP, 64.8%; with LBP, 75.9%), have a higher BMI (without LBP, 30.6 kg/m2; with LBP, 32.4 kg/m2), and have more comorbidities (without LBP, 28.3%; with LBP, 57.1%). Biomarker levels of CTX-II were higher among those with DSN at ≥1 level compared with no DSN (no DSN, 351.5 pg/ml; DSN at ≥1, 428.0 pg/ml). Biomarker levels of OPG were higher among those with DSN at ≥1 level compared with no DSN (no DSN, 91.2 pg/ml; DSN at ≥1, 99.6 pg/ml) and those with LBP compared with no LBP (no LBP, 94.0 pg/ml; with LBP, 105.9 pg/ml). Biomarker levels of CXCL6 were lower among those with OST at ≥2 levels compared with OST <2 levels (OST <2, 295.7 pg/ml; OST at ≥2, 292.9 pg/ml) and higher among those with LBP compared to no LBP (no LBP, 259.8 pg/ml; with LBP, 300.1 pg/ml). Biomarker levels of IL-6 were higher among those with LBP compared with no LBP (no LBP, 1.8 pg/ml; with LBP, 3.1 pg/ml). Biomarker levels of HA were higher those with DSN at ≥1 level compared with no DSN (no DSN, 63.9; DSN at ≥1, 74.6). Levels of BDNF were lower among participants with DSN at ≥1 level when compared to participants without DSN (no DSN, 32662 pg/ml; DSN at ≥1, 30326 pg/ml).
Table 1.
Characteristics and biomarker concentrations of n=723 participants at baseline.
| Overall | DSN score=0 n=190 | DSN score >=1 n=533 | Osteophyte score <2, n=189 | Osteophyte score >=2, n=534 | Low Back Pain Absent n=463* | Low Back Pain Present, n=133 | |
|---|---|---|---|---|---|---|---|
| Age (mean, SD) | 66.1 (7.45) | 63.8 (7.36) | 66.9 (7.31) | 65.7 (7.67) | 66.2 (7.37) | 66.2 (7.54) | 65.9 (7.63) |
| Women n, (%) | 503 (69.6%) | 128 (67.4%) | 375 (70.4%) | 347 (65.0%) | 156 (82.5%) | 300 (64.8%) | 101 (75.9%) |
| African American n, (%) | 240 (33.2%) | 80 (42.1%) | 160 (30.0%) | 159 (29.8%) | 81 (42.9%) | 151 (32.6%) | 82 (32.6%) |
| Body Mass Index, kg/m2 (mean, SD) | 31.4 (6.06) | 31.2 (6.30) | 31.5 (5.98) | 30.7 (6.27) | 31.6 (5.98) | 30.6 (5.74) | 32.4 (6.04) |
| >=2 Comorbidities, n, (%) | 265 (36.7%) | 77 (40.5%) | 188 (35.3%) | 63 (33.3%) | 202 (37.8%) | 131 (28.3%) | 76 (57.1%) |
| Radiographic Knee Osteoarthritis n, (%) | 285 (39.4%) | 56 (29.5%) | 229 (43.0%) | 64 (33.9%) | 221 (41.4%) | 175 (37.8%) | 59 (44.1%) |
| NSAID use n (%) | 464 (64.2%) | 121 (63.7%) | 343 (64.4%) | 114 (60.3%) | 350 (65.5%) | 290 (62.6%) | 90 (67.7%) |
| Pressure Pain Threshold (<4 kg), n (%) | 188 (27.0%) | 53 (29.4%) | 135 (26.2%) | 56 (30.9%) | 113 (25.6%) | 90 (20.1%) | 49 (39.5%) |
| Biomarkers, mean (SD) [median, (IQR)] | |||||||
| N-Cadherin, ng/ml | 112.5 (24.1) [109.7 (46.4–322.8)] | 111.6 (22.38) | 112.8 (24.68) | 111.7 (27.9) | 112.8 (22.60) | 112.1 (23.3) | 113.1 (21.1) |
| Lumican, ng/ml | 133.4 (25.3) [130.9 (64.0–469.9)] | 133.6 (20.0) | 133.3 (27.0) | 135.6 (24.0) | 132.6 (25.8) | 132.6 (26.9) | 134.4 (20.1) |
| CTX-II, ng/mM Cr | 407.9 (566.5) [276.6 (37.2–10235.9)] | 351.5 (494.7) | 428.0 (589.2) | 382.6 (541.9) | 416.7 (575.1) | 408.1 (618.4) | 402.6 (495.59 |
| OPG, pg/ml | 97.4 (42.6) [90.0 (8.6–416.8)] | 91.2 (44.0) | 99.6 (41.9) | 95.9 (46.7) | 98.0 (41.1) | 94.0 (41.7) | 105.9 (43.9) |
| CXCL6, pg/ml | 293.6 (686.7) [201.8 (50.5–17930.0)] | 291.7 (200.7) | 294.3 (789.2) | 295.7 (192.9) | 292.9 (791.3) | 259.8 (166.2) | 300.1 (194.3) |
| RANTES, pg/ml | 180156.6 (94723.9) [159053.4 (29421.8–497828.6)] | 188559 (99710) | 177216 (92835) | 186620 (97204) | 177861 (93815) | 175399 (90610) | 186471 (101841) |
| IL-6, pg/ml | 2.1 (4.5) [1.2 (0.3–81.8)] | 2.8 (8.0) | 1.8 (2.2) | 2.5 (5.5) | 1.9 (4.2) | 1.8 (2.7) | 3.1(9.1) |
| HA, pg/ml | 71.9 (86.3) [53.4 (8.2–1743.6)] | 63.9 (58.2) | 74.6 (94.1) | 64.1 (49.6) | 74.6 (96.0) | 71.2 (98.7) | 76.8 (63.5) |
| BDNF, pg/ml | 30931.7 (9131.6) [29506.0 (7464.7–72130.0)] | 32662 (10378) | 30326 (8582) | 31691 (9349) | 30662 (9047) | 30914 (9263) | 31019 (9553) |
| NPY, pg/ml | 22.9 (8.8) [21.0 (3.1–92.2)] | 22.9 (8.6) | 23.0 (8.9) | 23.4 (9.7) | 22.8 (8.5) | 23.0 (9.0) | 23.4 (8.6) |
BDNF=brain derived neurotrophic factor; CTX-II=collagen telopeptide-II; CXCL6= C-X-C Motif Chemokine Ligand 6; DSN=disc space narrowing; HA= hyaluronan; IL-6=interleukin-6; IQR=interquartile range; NPY=neuropeptide-Y; NSAID=non-steroidal anti-inflammatory; OPG=osteoprotegerin; RANTES=Regulated upon Activation, Normal T Cell Expressed and Presumably Secreted; SD=standard deviation.
Missing 46 values for pain at baseline. Significant (P<0.05) differences between categories represented in bold.
The models with baseline biomarkers and longitudinal changes in the worsening of DSN are presented in Figure 2. Approximately half of the participants did not have a change in DSN worsening over the follow-up time (52.6%). Adjusting for age, sex, and race, the baseline level of log transformed Lumican was associated with a longitudinal change in any DSN worsening compared to participants without any DSN worsening (OR=3.11 [95% CI 1.21, 8.01]). After additional adjustment for BMI, comorbidities, knee OA and self-reported NSAIDs, this relationship remained (OR=3.01 [95% CI 1.17, 7.78]) as well as after further adjustment for OST score change and baseline DSN values (OR=3.19 [95% CI 1.22, 8.34]). Adjusting for age, sex, and race, the baseline level of log transformed HA was associated with a longitudinal change in DSN worsening compared to participants without any DSN (OR=1.27 [95% CI 1.00, 1.60]). However, after additional adjustment for BMI, comorbidities, knee OA, and self-reported NSAIDs, this relationship was attenuated. No other baseline biomarkers were associated with a longitudinal change in the worsening of DSN.
Figure 2. Baseline Biomarker Associations with Longitudinal Changes in Worsening of Disc Space Narrowing.
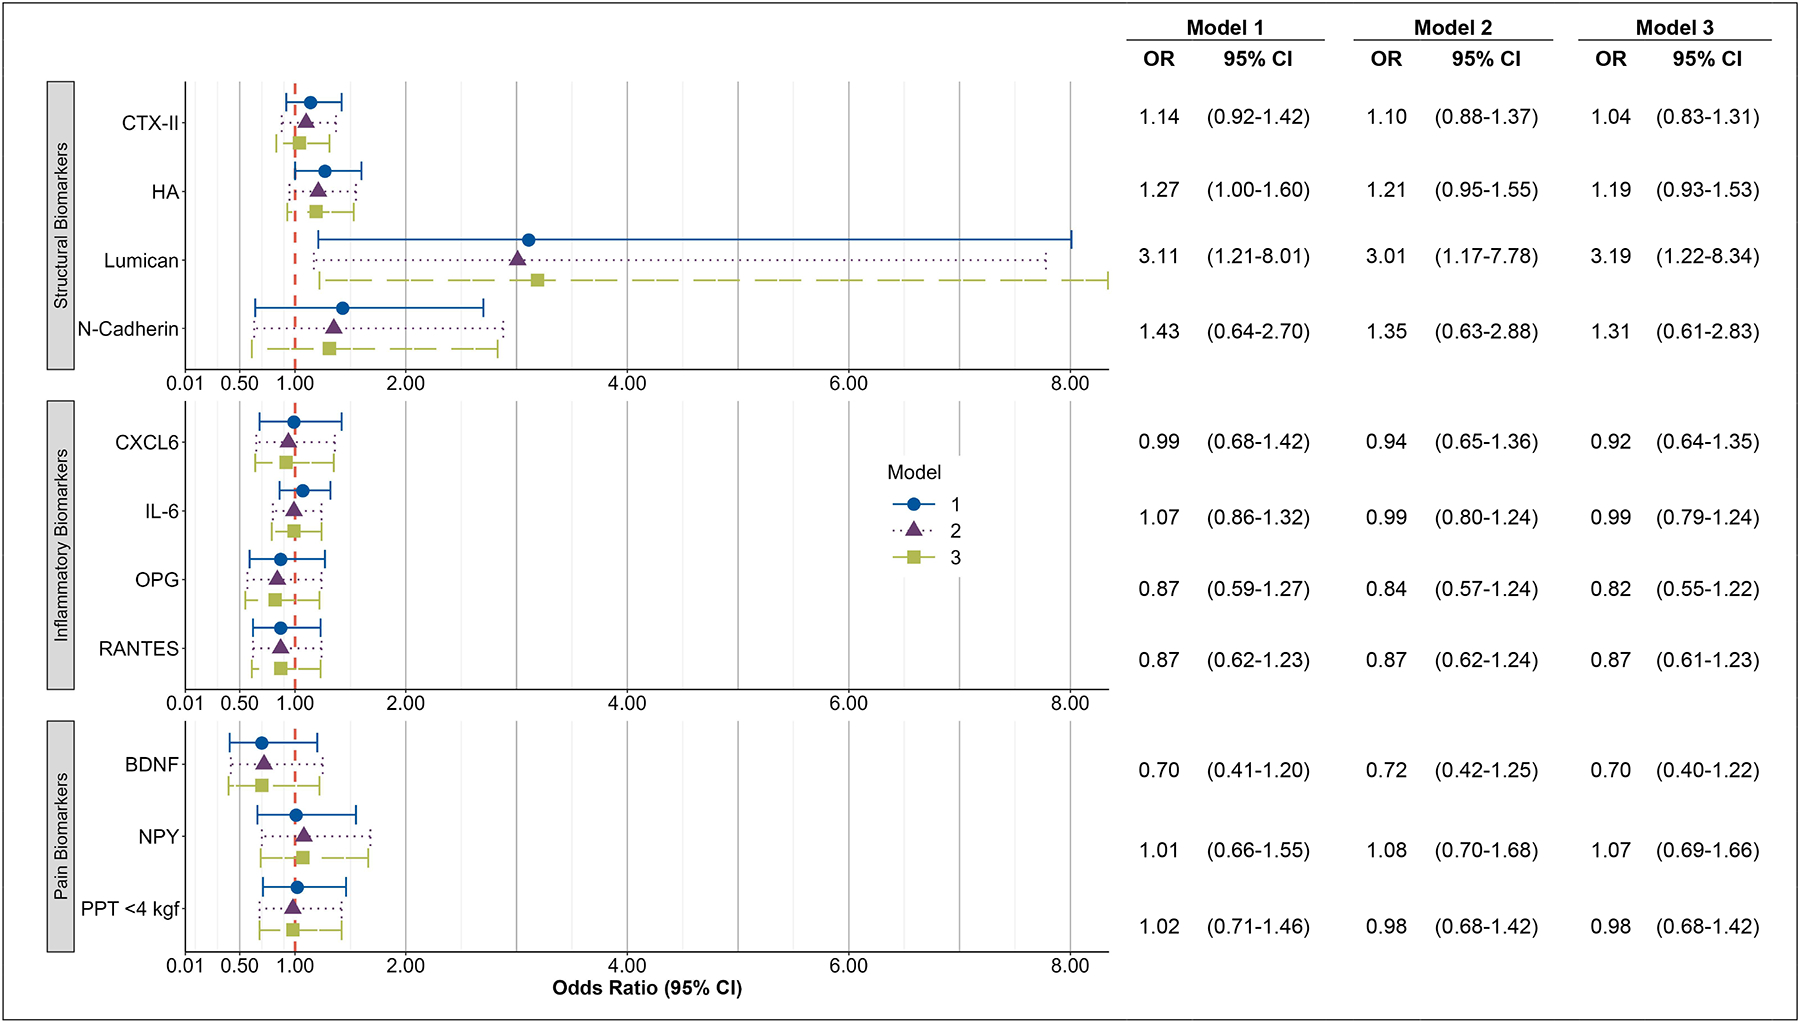
Associations between logarithmically-transformed biomarkers and change in disc space narrowing (DSN) score from T2 to T3.
Outcome is worsening change in disc space narrowing (n=334) vs no change (n=372).
Adjusted for the following measures at baseline (T2):
Model 1: DSN Score, age, race, sex
Model 2: DSN Score, age, race, sex, body mass index (BMI), knee osteoarthritis (OA), having 2+ comorbidities, non-steroidal anti-inflammatory drugs (NSAIDs)
Model 3: OST Score Change in the same model; baseline values of DSN Score, OST Score, age, race, sex, BMI, knee OA, having 2+ comorbidities, NSAIDs.
OR = Odds Ratio, CI = Confidence Interval, BDNF=brain derived neurotrophic factor; CTX-II=collagen telopeptide-II; CXCL6= C-X-C Motif Chemokine Ligand 6; DSN=disc space narrowing; HA= hyaluronan; IL-6=interleukin-6; NPY=neuropeptide-Y; OPG=osteoprotegerin; RANTES=Regulated upon Activation, Normal T Cell Expressed and Presumably Secreted.
The models with baseline biomarkers and the longitudinal change in the worsening of OST are presented in Figure 3. Adjusting for age, sex, race, BMI, comorbidities, knee OA, and self-reported NSAIDs, the baseline level of log transformed BDNF was associated with the longitudinal change in OST worsening versus those without OST worsening (OR=1.78 [95% CI 1.01, 3.11]). This relationship remained after further adjustment for DSN score change and OST baseline values (OR=1.80 [95% CI 1.03, 3.16]). No other baseline biomarkers were associated with a longitudinal change in OST worsening.
Figure 3. Baseline Biomarker Associations with Longitudinal Changes in Worsening of Osteophytes.
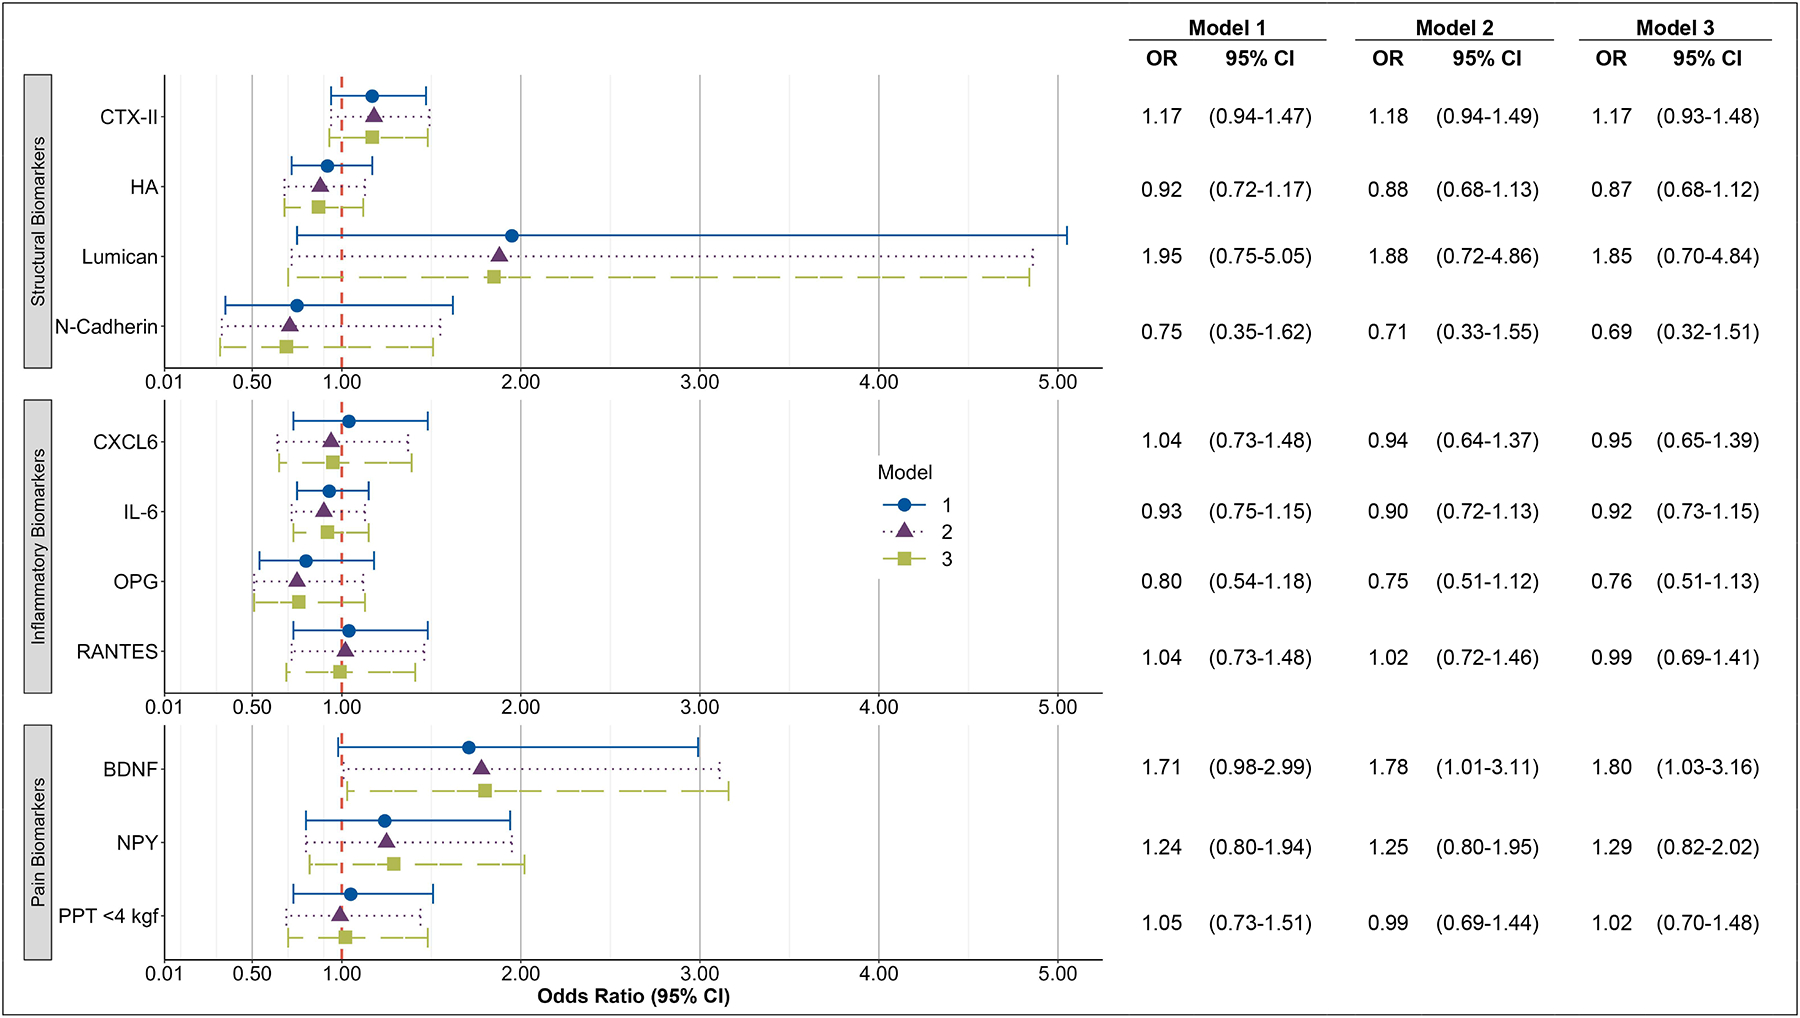
Associations between logarithmically-transformed biomarkers and change in osteophyte (OST) score from T2 to T3.
Outcome is change in osteophyte score ≥2 (n=424) vs change <2 (n=282).
Adjusted for the following measures at baseline (T2):
Model 1: OST Score, age, race, sex
Model 2: OST Score, age, race, sex, body mass index (BMI), knee osteoarthritis (OA), having 2+ comorbidities, non-steroidal anti-inflammatory drugs (NSAIDs)
Model 3: OST and DSN Score Change in the same model; baseline values of DSN Score, age, race, sex, BMI, knee OA, having 2+ comorbidities, NSAIDs.
OR = Odds Ratio, CI = Confidence Interval, BDNF=brain derived neurotrophic factor; CTX-II=collagen telopeptide-II; CXCL6= C-X-C Motif Chemokine Ligand 6; DSN=disc space narrowing; HA= hyaluronan; IL-6=interleukin-6; NPY=neuropeptide-Y; OPG=osteoprotegerin; RANTES=Regulated upon Activation, Normal T Cell Expressed and Presumably Secreted.
The models with baseline biomarkers and the longitudinal change in worsening of any severity in LBP are presented in Figure 4. Approximately two-thirds of the participants did not have an increase in LBP severity at follow-up (64.7%). Adjusting for age, sex, and race, the baseline level of log transformed HA was associated with the longitudinal increase in LBP severity versus those without worsening of LBP (OR=1.31 [95% CI 1.01, 1.71]). Adjusting for age, sex, and race, the baseline level of log-transformed CXCL-6 was associated with the longitudinal increase in LBP severity (OR=1.62 [95% CI 1.04, 2.52]). Adjusting for age, sex, and race, a baseline lower PPT (<4 kg) was associated with the longitudinal increase in LBP severity (OR=1.54 [95% CI 1.02, 2.31]). After adjustment for BMI, comorbidities, knee OA, and self-reported NSAIDs these relationships were attenuated. No other baseline biomarkers were associated with a longitudinal increase in the worsening of LBP.
Figure 4. Baseline Biomarker Associations with Longitudinal Changes in Worsening of Low Back Pain.
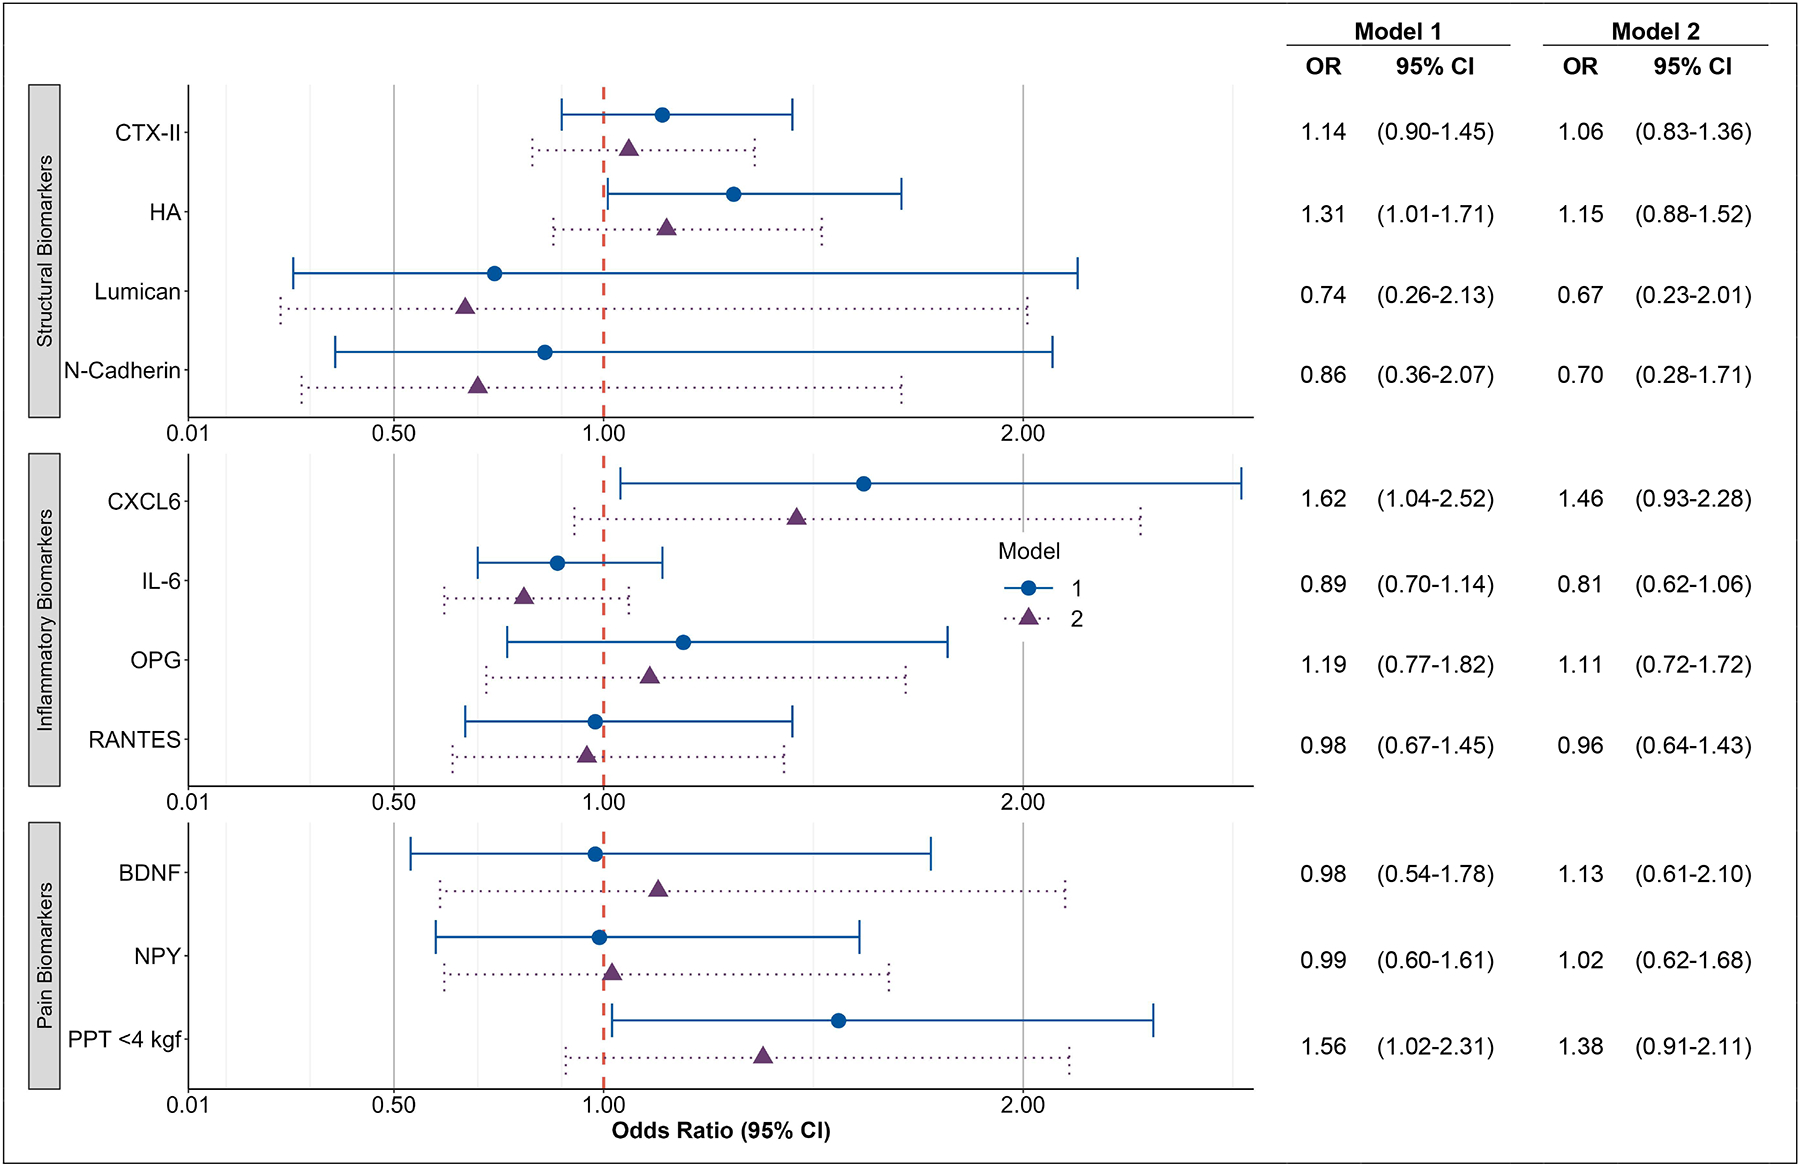
Associations between logarithmically-transformed biomarkers and change in low back pain severity from T2 to T3.
Outcome is increase in pain severity (n=206) vs no change (n=377). Excludes n=46 with maximum pain severity at baseline and n=62 with pain improvement.
Adjusted for the following measures at baseline (T2):
Model 1: Pain severity, age, race, sex
Model 2: Pain severity, age, race, sex, body mass index, knee osteoarthritis, having 2+ comorbidities, non-steroidal anti-inflammatory drugs.
OR = Odds Ratio, CI = Confidence Interval, BDNF=brain derived neurotrophic factor; CTX-II=collagen telopeptide-II; CXCL6= C-X-C Motif Chemokine Ligand 6; DSN=disc space narrowing; HA= hyaluronan; IL-6=interleukin-6; NPY=neuropeptide-Y; OPG=osteoprotegerin; RANTES=Regulated upon Activation, Normal T Cell Expressed and Presumably Secreted
Discussion
To our knowledge, this is the first community-based study to determine if baseline biomarkers measured in serum or urine, or pressure-pain sensitivity are associated with longitudinal changes in lumbar spine structure or LBP. Our results identified multiple baseline biomarkers of interest that are associated with the longitudinal worsening of radiographic findings (Lumican, HA, and BDNF: DSN or OST) and an increase in LBP severity (CXCL6, HA, and PPT). Baseline Lumican, a constituent of vertebral discs, was associated with the longitudinal worsening of DSN. Baseline BDNF, a neuropeptide that can reflect pain or structural changes, was associated with a longitudinal worsening of OST. These findings suggest that baseline biochemical biomarkers may reflect changes in the structural composition of lumbar spine and could improve our understanding of degeneration over time. Examining baseline values of biochemical biomarkers may be of particular interest in an older adult population, such as ours since the prevalence of degenerative changes and imaging has been weakly linked to LBP35. Therefore, examining different characterizations of biochemical biomarkers that may reflect the structure, inflammation, and pain would be highly useful for measuring changes over time.
Our findings indicate that higher baseline levels of Lumican are related to DSN worsening with 3 times higher odds of DSN for a 1-unit change in log-transformed Lumican over an average of 5 years. Confidence intervals for this relationship were wide, however, indicating a wide range of potential effect sizes compatible with our data above the null effect. Several studies, using basic science animal models or excised lumbar spine intervertebral discs, have identified Lumican as a potentially important proteoglycan for maintaining the normal functional property in the extracellular matrix of the intervertebral disc8, 36. Changes in the abundance or structure of Lumican that occur within the degenerating intervertebral disc may impair disc function8, 37 These findings suggest that Lumican has strong face validity as a biochemical biomarker related to intervertebral disc degeneration as opposed to OST with which we did not find any relationship. Although future work is needed to obtain more precise estimates (i.e., more narrow confidence intervals) of the longitudinal relationship between Lumican and worsening DSN, these findings suggest clinical utility for Lumican for lumbar spine degeneration specific to DSN vs OST.
To our knowledge, this is the first study to examine baseline levels of HA and the longitudinal change in the worsening of DSN. Like Lumican, HA is found in the extracellular matrix but plays a key role in regulating inflammation38, 39. We identified baseline HA associated with a longitudinal change in the worsening of DSN in some, but not all, of our adjusted models. These findings support our cross-sectional work showing that HA is associated with DSN14. In our models that adjusted for demographic characteristics, we identified baseline HA as related to DSN; however, when we adjusted self-reported NSAID use, BMI, and comorbidities, this relationship was attenuated. This suggests that these factors, which may be related to systemic inflammation, may confound the relationship between HA and DSN, and those self-reporting NSAID use may diminish this inflammatory response.
We identified baseline levels of BDNF to be associated with the longitudinal change in OST worsening. BDNF is a neuropeptide that has been associated with both LBP and spine degeneration40, 41. In addition, BDNF has been recognized in the role of regulating osteoclast genesis in certain conditions42. This may be relevant to the OA process because of subchondral bone remodeling with activation of osteoclasts that may be associated with chronic joint pain43,44 Although prior studies have not specifically examined this relationship, this may be the case with OST formation in the spine as our prior longitudinal study identified baseline OST related to the longitudinal worsening of LBP4. Although osteophytes are common among the population, the presence of OST among those with LBP may be an indicator of continued or worse mechanical LBP; these results suggest that BDNF may be implicated in OST worsening41.
We examined whether our baseline biomarkers were associated with the longitudinal change in the worsening self-report LBP over time. We identified that higher baseline HA levels and lower PPT were associated with the increased LBP severity in some, but not all, adjusted models. We are not aware of previous studies that have examined the relationship between these two markers and longitudinal changes in the severity of LBP over time. In those models with adjustment for demographic characteristics, both HA and PPT were associated with the longitudinal change in LBP worsening. However, when we adjusted for additional demographic characteristics (BMI, knee OA, comorbidities) and self-reported NSAID use, these relationships were attenuated. This may be explained by residual confounding due to a strong relationship between knee OA and HA45. In addition, several studies have found knee OA to be a risk factor or be associated with LBP, which may explain this confounding effect46, 47
Our study has several strengths including a well-defined community-based sample, protocol-driven data collection, and a longitudinal design, but is not without limitations. The JoCoOA protocol excluded women of childbearing age from having lumbar spine radiographs to prevent unnecessary radiation exposure; therefore, the results may not be generalizable to this subgroup. Our original intent was to examine the incidence and worsening of DSN, OST, and facet joint OA. However, the high baseline prevalence and the low number of incident cases of these features did not allow us to examine incidence within this cohort. In addition, the high baseline prevalence of facet joint OA within this cohort also limited our ability to examine worsening in this lumbar spine structure. Our biomarkers may reflect a systemic biological process not specific to a structure in the lumbar spine or LBP. Although we controlled for common comorbidities that may be involved with biological processes that could affect biomarkers, we could not control for every possible factor (such as time of day for specimen, medication use, liver function, and kidney function, diet/activity, or ethnicity) that could affect levels of biomarkers. We measured the presence and severity of LBP, but not how LBP interfered with daily activity. Our question for LBP also included pain, aching, and stiffness, which may overestimate the true incidence of LBP since stiffness may be present without pain. In addition, our LBP question was measured on a scale of none, mild, moderate, or severe rather than a more sensitive continuous scale. Low back pain is a multidimensional condition that can be influenced by psychosocial factors. Our primary purpose in this study was to examine the potential biological mechanisms. Future studies should include psychosocial factors and physical function measures as potential moderators of the relationship with biochemical biomarkers (or as confounders where these covariates may impact the biomarker of interest). These might be the reasons, along with the length of time between baseline and follow-up, for not observing a longitudinal relationship with LBP from some measures such as PPT, which has been consistently associated with pain outcomes in other studies. We did not include lower back-specific functional measures or account for previous LBP episodes or widespread pain that are known to be associated with progressive LBP4. The loss to follow-up we experienced over this time frame may influence the direction and strength of our estimates relative to the true population values. In addition, there was a high prevalence of DSN and OST among participants which is to be expected based upon the average age of the cohort. As such, future studies should consider cohorts with younger participants to enhance generalizability. Our study selected biochemical biomarkers based upon our prior studies that have had an osteoarthritis focus as well as previous bench research of the content of the intervertebral disc. There are still several potential biomarkers and mechanisms for both spine degeneration or low back pain worsening. Future studies may consider additional proteoglycans to target the content of the intervertebral disc and increase the specificity of lumbar spine structure when compared to osteophytes or facet joint osteoarthritis. Conversely, a more agnostic approach to selecting biomarkers may serve well when examining pain outcomes as the mechanisms are less well understood.
In conclusion, to our knowledge, our longitudinal study is unique in providing the first estimates of biomarkers and spine degeneration or LBP worsening in the community. Our findings suggest potential clinical utility for baseline biomarkers and the longitudinal change in worsening degeneration of lumbar spine structure that may differ in the specific anatomical composition between DSN and OST.
Supplementary Material
Role of the funding source:
This work was supported by the National Institute of Arthritis and Musculoskeletal and Skin Diseases (NIAMS) R01AR071440 (Goode, Cleveland, George, Schwartz, Kraus, Jordan, Golightly, Taylor), R01AR075399 (Goode, George, Kraus,) and K24AR079594 (Goode). Dr Kraus and Ms Huebner are supported by the National Institute on Aging (NIA) P30-AG-028716. The Johnston County Osteoarthritis Project is supported in part by cooperative agreements S043, S1734, and S3486 from the Centers for Disease Control and Prevention (CDC)/Association of Schools of Public Health; the NIAMS Multipurpose Arthritis and Musculoskeletal Disease Center grant 5-P60-AR30701; the NIAMS Multidisciplinary Clinical Research Center grant 5 P60 AR49465-03; and NIAMS Core Centers for Clinical Research grant 1P30AR072580-01A1. The findings and conclusions in this report are those of the authors and do not necessarily represent the official position of the CDC, NIA, or NIAMS.
Footnotes
Publisher's Disclaimer: This is a PDF file of an unedited manuscript that has been accepted for publication. As a service to our customers we are providing this early version of the manuscript. The manuscript will undergo copyediting, typesetting, and review of the resulting proof before it is published in its final form. Please note that during the production process errors may be discovered which could affect the content, and all legal disclaimers that apply to the journal pertain.
Conflict of interest: All authors disclose they have no financial or personal relationships with other people or organizations that could potentially and inappropriately bias their work and conclusions.
References
- 1.Muraki S, Akune T, Oka H, Ishimoto Y, Nagata K, Yoshida M, et al. Incidence and risk factors for radiographic lumbar spondylosis and lower back pain in Japanese men and women: the ROAD study. Osteoarthritis Cartilage 2012; 20: 712–718. [DOI] [PubMed] [Google Scholar]
- 2.Muraki S, Oka H, Akune T, Mabuchi A, En-Yo Y, Yoshida M, et al. Prevalence of radiographic lumbar spondylosis and its association with low back pain in elderly subjects of population-based cohorts: the ROAD study. Ann Rheum Dis 2009; 68: 1401–1406. [DOI] [PubMed] [Google Scholar]
- 3.Goode AP, Cleveland RJ, George SZ, Kraus VB, Schwartz TA, Gracely RH, et al. Different phenotypes of osteoarthritis in the lumbar spine reflected by demographic and clinical characteristics: The Johnston County Osteoarthritis Project. Arthritis Care Res (Hoboken) 2020; 72: 974–981. [DOI] [PMC free article] [PubMed] [Google Scholar]
- 4.Goode AP, Cleveland RJ, George SZ, Schwartz TA, Kraus VB, Renner JB, et al. Predictors of lumbar spine degeneration and low back pain in the community: The Johnston County Osteoarthritis Project. Arthritis Care Res (Hoboken) published online ahead of print, 2021. doi: 10.1002/acr.24643. [DOI] [PMC free article] [PubMed] [Google Scholar]
- 5.Goode AP, Marshall SW, Renner JB, Carey TS, Kraus VB, Irwin DE, et al. Lumbar spine radiographic features and demographic, clinical, and radiographic knee, hip, and hand osteoarthritis. Arthritis Care Res (Hoboken) 2012; 64: 1536–1544. [DOI] [PMC free article] [PubMed] [Google Scholar]
- 6.Raastad J, Reiman M, Coeytaux R, Ledbetter L, Goode AP. The association between lumbar spine radiographic features and low back pain: a systematic review and meta-analysis. Semin Arthritis Rheum 2015; 44: 571–585. [DOI] [PubMed] [Google Scholar]
- 7.Kalichman L, Hunter DJ. The genetics of intervertebral disc degeneration. Familial predisposition and heritability estimation. Joint Bone Spine 2008; 75: 383–387. [DOI] [PubMed] [Google Scholar]
- 8.Sztrolovics R, Alini M, Mort JS, Roughley PJ. Age-related changes in fibromodulin and lumican in human intervertebral discs. Spine (Phila Pa 1976) 1999; 24: 1765–1771. [DOI] [PubMed] [Google Scholar]
- 9.Singh K, Masuda K, Thonar EJ, An HS, Cs-Szabo G. Age-related changes in the extracellular matrix of nucleus pulposus and anulus fibrosus of human intervertebral disc. Spine (Phila Pa 1976) 2009; 34: 10–16. [DOI] [PMC free article] [PubMed] [Google Scholar]
- 10.Yee A, Lam MP, Tam V, Chan WC, Chu IK, Cheah KS, et al. Fibrotic-like changes in degenerate human intervertebral discs revealed by quantitative proteomic analysis. Osteoarthritis Cartilage 2016; 24: 503–513. [DOI] [PubMed] [Google Scholar]
- 11.Lyu FJ, Cui H, Pan H, Mc Cheung K, Cao X, Iatridis JC, et al. Painful intervertebral disc degeneration and inflammation: from laboratory evidence to clinical interventions. Bone Res 2021; 9: 7. [DOI] [PMC free article] [PubMed] [Google Scholar]
- 12.Schett G Joint remodelling in inflammatory disease. Ann Rheum Dis 2007; 66 Suppl 3: iii42–44. [DOI] [PMC free article] [PubMed] [Google Scholar]
- 13.van Spil WE, Szilagyi IA. Osteoarthritis year in review 2019: biomarkers (biochemical markers). Osteoarthritis Cartilage 2020; 28: 296–315. [DOI] [PubMed] [Google Scholar]
- 14.Goode AP, Marshall SW, Kraus VB, Renner JB, Sturmer T, Carey TS, et al. Association between serum and urine biomarkers and lumbar spine individual radiographic features: the Johnston County Osteoarthritis Project. Osteoarthritis Cartilage 2012; 20: 1286–1293. [DOI] [PMC free article] [PubMed] [Google Scholar]
- 15.Goode AP, Nelson AE, Kraus VB, Renner JB, Jordan JM. Biomarkers reflect differences in osteoarthritis phenotypes of the lumbar spine: the Johnston County Osteoarthritis Project. Osteoarthritis Cartilage 2017; 25: 1672–1679. [DOI] [PMC free article] [PubMed] [Google Scholar]
- 16.Goode AP, Schwartz TA, Kraus VB, Huebner JL, George SZ, Cleveland RJ, et al. Inflammatory, structural, and pain biochemical biomarkers may reflect radiographic disc space narrowing: The Johnston County Osteoarthritis Project. J Orthop Res 2020; 38: 1027–1037. [DOI] [PMC free article] [PubMed] [Google Scholar]
- 17.Garnero P, Sornay-Rendu E, Arlot M, Christiansen C, Delmas PD. Association between spine disc degeneration and type II collagen degradation in postmenopausal women: the OFELY study. Arthritis Rheum 2004; 50: 3137–3144. [DOI] [PubMed] [Google Scholar]
- 18.Meulenbelt I, Kloppenburg M, Kroon HM, Houwing-Duistermaat JJ, Garnero P, Hellio Le Graverand MP, et al. Urinary CTX-II levels are associated with radiographic subtypes of osteoarthritis in hip, knee, hand, and facet joints in subject with familial osteoarthritis at multiple sites: the GARP study. Ann Rheum Dis 2006; 65: 360–365. [DOI] [PMC free article] [PubMed] [Google Scholar]
- 19.Xue JB, Zhan XL, Wang WJ, Yan YG, Liu C. OPG rs2073617 polymorphism is associated with upregulated OPG protein expression and an increased risk of intervertebral disc degeneration. Exp Ther Med 2016; 12: 702–710. [DOI] [PMC free article] [PubMed] [Google Scholar]
- 20.Saberi Hosnijeh F, Bierma-Zeinstra SM, Bay-Jensen AC. Osteoarthritis year in review 2018: biomarkers (biochemical markers). Osteoarthritis Cartilage 2019; 27: 412–423. [DOI] [PubMed] [Google Scholar]
- 21.Goode AP, Hu D, George SZ, Schwartz TA, Kraus VB, Huebner JL, et al. Biomarker clusters differentiate phenotypes of lumbar spine degeneration and low back pain: The Johnston County Osteoarthritis Project. Osteoarthritis and Cartilage Open 2022; 4: 100270. [DOI] [PMC free article] [PubMed] [Google Scholar]
- 22.Brown S, Melrose J, Caterson B, Roughley P, Eisenstein SM, Roberts S. A comparative evaluation of the small leucine-rich proteoglycans of pathological human intervertebral discs. Eur Spine J 2012; 21 Suppl 2: S154–159. [DOI] [PMC free article] [PubMed] [Google Scholar]
- 23.Hwang PY, Jing L, Chen J, Lim FL, Tang R, Choi H, et al. N-cadherin is key to expression of the nucleus pulposus cell phenotype under selective substrate culture conditions. Sci Rep 2016; 6: 28038. [DOI] [PMC free article] [PubMed] [Google Scholar]
- 24.Hwang PY, Jing L, Michael KW, Richardson WJ, Chen J, Setton LA. N-Cadherin-mediated signaling regulates cell phenotype for nucleus pulposus cells of the intervertebral disc. Cell Mol Bioeng 2015; 8: 51–62. [DOI] [PMC free article] [PubMed] [Google Scholar]
- 25.O’Neill S, Kjaer P, Graven-Nielsen T, Manniche C, Arendt-Nielsen L. Low pressure pain thresholds are associated with, but does not predispose for, low back pain. Eur Spine J 2011; 20: 2120–2125. [DOI] [PMC free article] [PubMed] [Google Scholar]
- 26.Coronado RA, George SZ, Devin CJ, Wegener ST, Archer KR. Pain Sensitivity and Pain Catastrophizing Are Associated With Persistent Pain and Disability After Lumbar Spine Surgery. Arch Phys Med Rehabil 2015; 96: 1763–1770. [DOI] [PMC free article] [PubMed] [Google Scholar]
- 27.Jordan JM, Helmick CG, Renner JB, Luta G, Dragomir AD, Woodard J, et al. Prevalence of knee symptoms and radiographic and symptomatic knee osteoarthritis in African Americans and Caucasians: the Johnston County Osteoarthritis Project. J Rheumatol 2007; 34:172–180. [PubMed] [Google Scholar]
- 28.Allen KD, Chen JC, Callahan LF, Golightly YM, Helmick CG, Renner JB, et al. Associations of occupational tasks with knee and hip osteoarthritis: the Johnston County Osteoarthritis Project. J Rheumatol 2010; 37: 842–850. [DOI] [PMC free article] [PubMed] [Google Scholar]
- 29.Gordon CD, Stabler TV, Kraus VB. Variation in osteoarthritis biomarkers from activity not food consumption. Clin Chim Acta 2008; 398: 21–26. [DOI] [PMC free article] [PubMed] [Google Scholar]
- 30.Goode AP, Shi XA, Gracely RH, Renner JB, Jordan JM. Associations between pressure-pain threshold, symptoms, and radiographic knee and hip osteoarthritis. Arthritis Care Res (Hoboken) 2014; 66: 1513–1519. [DOI] [PMC free article] [PubMed] [Google Scholar]
- 31.Burnett SJ, Hart DJ, Cooper C, Spector TD. A Radiographic Atlas of Osteoarthritis. London, Springer-Verlag; 1994. [Google Scholar]
- 32.Jordan JM, Linder GF, Renner JB, Fryer JG. The impact of arthritis in rural populations. Arthritis Care Res 1995; 8: 242–250. [DOI] [PubMed] [Google Scholar]
- 33.Kraus VB, Jordan JM, Doherty M, Wilson AG, Moskowitz R, Hochberg M, et al. The Genetics of Generalized Osteoarthritis (GOGO) study: study design and evaluation of osteoarthritis phenotypes. Osteoarthritis Cartilage 2007; 15: 120–127. [DOI] [PubMed] [Google Scholar]
- 34.Kellgren JH. The epidemiology of rheumatic diseases. Ann Rheum Dis 1964; 23: 109–122. [DOI] [PMC free article] [PubMed] [Google Scholar]
- 35.Sowa GA, Perera S, Bechara B, Agarwal V, Boardman J, Huang W, et al. Associations between serum biomarkers and pain and pain-related function in older adults with low back pain: a pilot study. J Am Geriatr Soc 2014; 62: 2047–2055. [DOI] [PubMed] [Google Scholar]
- 36.Roughley PJ. Biology of intervertebral disc aging and degeneration: involvement of the extracellular matrix. Spine (Phila Pa 1976) 2004; 29: 2691–2699. [DOI] [PubMed] [Google Scholar]
- 37.Lin D, Alberton P, Delgado Caceres M, Prein C, Clausen-Schaumann H, Dong J, et al. Loss of tenomodulin expression is a risk factor for age-related intervertebral disc degeneration. Aging Cell 2020; 19: e13091. [DOI] [PMC free article] [PubMed] [Google Scholar]
- 38.Petrey AC, de la Motte CA. Hyaluronan, a crucial regulator of inflammation. Front Immunol 2014; 5: 101. [DOI] [PMC free article] [PubMed] [Google Scholar]
- 39.Toole BP. Hyaluronan: from extracellular glue to pericellular cue. Nat Rev Cancer 2004; 4: 528–539. [DOI] [PubMed] [Google Scholar]
- 40.Diz JBM, de Souza Moreira B, Felicio DC, Teixeira LF, de Jesus-Moraleida FR, de Queiroz BZ, et al. Brain-derived neurotrophic factor plasma levels are increased in older women after an acute episode of low back pain. Arch Gerontol Geriatr 2017; 71: 75–82. [DOI] [PubMed] [Google Scholar]
- 41.Boyd LM, Richardson WJ, Chen J, Kraus VB, Tewari A, Setton LA. Osmolarity regulates gene expression in intervertebral disc cells determined by gene array and real-time quantitative RT-PCR. Ann Biomed Eng 2005; 33: 1071–1077. [DOI] [PubMed] [Google Scholar]
- 42.Ai LS, Sun CY, Wang YD, Zhang L, Chu ZB, Qin Y, et al. Gene silencing of the BDNF/TrkB axis in multiple myeloma blocks bone destruction and tumor burden in vitro and in vivo. Int J Cancer 2013; 133: 1074–1084. [DOI] [PubMed] [Google Scholar]
- 43.Gowler PRW, Li L, Woodhams SG, Bennett AJ, Suzuki R, Walsh DA, et al. Peripheral brain-derived neurotrophic factor contributes to chronic osteoarthritis joint pain. Pain 2020; 161: 61–73. [DOI] [PubMed] [Google Scholar]
- 44.Strassle BW, Mark L, Leventhal L, Piesla MJ, Jian Li X, Kennedy JD, et al. Inhibition of osteoclasts prevents cartilage loss and pain in a rat model of degenerative joint disease. Osteoarthritis Cartilage 2010; 18: 1319–1328. [DOI] [PubMed] [Google Scholar]
- 45.Elliott AL, Kraus VB, Luta G, Stabler T, Renner JB, Woodard J, et al. Serum hyaluronan levels and radiographic knee and hip osteoarthritis in African Americans and Caucasians in the Johnston County Osteoarthritis Project. Arthritis Rheum 2005; 52: 105–111. [DOI] [PubMed] [Google Scholar]
- 46.Ito H, Tominari S, Tabara Y, Nakayama T, Furu M, Kawata T, et al. Low back pain precedes the development of new knee pain in the elderly population; a novel predictive score from a longitudinal cohort study. Arthritis Res Ther 2019; 21: 98. [DOI] [PMC free article] [PubMed] [Google Scholar]
- 47.Suri P, Morgenroth DC, Kwoh CK, Bean JF, Kalichman L, Hunter DJ. Low back pain and other musculoskeletal pain comorbidities in individuals with symptomatic osteoarthritis of the knee: data from the osteoarthritis initiative. Arthritis Care Res (Hoboken) 2010; 62: 1715–1723. [DOI] [PMC free article] [PubMed] [Google Scholar]
Associated Data
This section collects any data citations, data availability statements, or supplementary materials included in this article.