

Abstract
Glioblastomas are highly heterogeneous brain tumors. Despite the availability of standard treatment for glioblastoma multiforme (GBM), i.e., Stupp protocol, which involves surgical resection followed by radiotherapy and chemotherapy, glioblastoma remains refractory to treatment and recurrence is inevitable. Moreover, the biology of recurrent glioblastoma remains unclear. Increasing evidence has shown that intratumoral heterogeneity and the tumor microenvironment contribute to therapeutic resistance. However, the interaction between intracellular heterogeneity and drug resistance in recurrent GBMs remains controversial. The aim of this study was to map the transcriptome landscape of cancer cells and the tumor heterogeneity and tumor microenvironment in recurrent and drug‐resistant GBMs at a single‐cell resolution and further explore the mechanism of drug resistance of GBMs. We analyzed six tumor tissue samples from three patients with primary GBM and three patients with recurrent GBM in which recurrence and drug resistance developed after treatment with the standard Stupp protocol using single‐cell RNA sequencing. Using unbiased clustering, nine major cell clusters were identified. Upregulation of the expression of stemness‐related and cell‐cycle‐related genes was observed in recurrent GBM cells. Compared with the initial GBM tissues, recurrent GBM tissues showed a decreased proportion of microglia, consistent with previous reports. Finally, vascular endothelial growth factor A expression and the blood–brain barrier permeability were high, and the O 6‐methylguanine DNA methyltransferase‐related signaling pathway was activated in recurrent GBM. Our results delineate the single‐cell map of recurrent glioblastoma, tumor heterogeneity, tumor microenvironment, and drug‐resistance mechanisms, providing new insights into treatment strategies for recurrent glioblastomas.
Keywords: cancer microenvironment, drug resistance, recurrent glioblastoma, scRNA‐seq, tumor heterogeneity
We observed upregulation of the expression of stemness‐related and cell‐cycle‐related genes in recurrent GBM cells. Further, we observed that recurrent GBM tissues showed a decreased proportion of microglia, consistent with previous reports, and that vascular endothelial growth factor A expression and the blood–brain barrier permeability were high, and the O 6‐methylguanine DNA methyltransferase‐related signaling pathway was activated in recurrent GBM. Our results provide new insights into treatment strategies for recurrent glioblastomas.

Abbreviations
- BBB
blood–brain barrier
- CGEin
caudal ganglionic eminence interneurons
- CNVs
copy number variations
- DAB
3,3′‐diaminobenzidine
- DEG
differentially expressed gene
- GAMs
glioma‐associated macrophages/microglia
- GBM
glioblastoma multiforme
- IF
immunofluorescence.
- IHC
immunohistochemistry
- KEGG
Kyoto Encyclopedia of Genes and Genomes
- MGMT
O 6‐methylguanine DNA methyltransferase
- mIPCs
mature intermediate progenitor cells
- OPCs
oligodendrocyte progenitor cells
- OS
overall survival
- TME
tumor microenvironment
- TMZ
temozolomide
- UMAP
uniform manifold approximation and projection
- VEGFA
vascular endothelial growth factor A
1. INTRODUCTION
Glioblastoma multiforme is the most aggressive and deadly primary tumor characterized by extensive intertumor and intratumor heterogeneity. 1 GBM recurrence is inevitable despite the standard treatment, with a median survival rate of ~15 months. 2 Tumor recurrence is associated with tumor heterogeneity and TME, which play pivotal roles in treatment resistance. 3 However, current knowledge of tumor heterogeneity, TME, and molecular traits of recurrent glioblastoma is limited. Therefore, there is an urgent need to elucidate the molecular mechanisms underlying the effect of tumor heterogeneity, TME, and drug resistance in GBM development and progression, as well as to identify efficient targets for therapeutic treatment.
In addition to cancer cells, astrocytes, GAMs, oligodendrocytes, and vascular cells are prominent microenvironmental components in GBM. 4 , 5 The abundance of GAMs is positively correlated with GBM invasiveness, immunosuppression, and a patient's poor outcome. 6 , 7 Microglia can engulf extracellular apoptotic tumor cells and release insulin‐like growth factor‐binding protein 1 to promote angiogenesis. 8 However, the molecular mechanisms by which microglia regulate recurrent GBM angiogenesis are poorly understood. Recent data illustrate that VEGFA is highly expressed in recurrent GBM and promotes proliferation, invasion, and angiogenesis in GBM via VEGFA‐mediated ERK signaling, 9 , 10 disrupting the BBB. 11 Temozolomide resistance is one of the biggest challenges in GBM therapy and the underlying mechanisms have not been fully elucidated. O 6‐Methylguanine DNA methyltransferase‐related signaling pathways repair cytotoxic DNA lesions generated by TMZ, which is used for GBM treatment, and are the principal mechanism for resistance to TMZ in patients with GBM. 12 , 13 Nevertheless, the detailed mechanisms of resistance to chemotherapy in recurrent GBM remain controversial and need further study.
Conventional transcriptomics techniques lack sufficient resolution in the identification of specific cell types. Investigation using these techniques involves analyzing a mixture of all cells and averaging the underlying differences in cell‐type‐specific transcriptomes, and thus is unable to determine the complexity of intratumoral heterogeneity in GBM. Single‐cell RNA sequencing can overcome these limitations, enabling us to analyze gene expression at a single‐cell resolution and further reveal the correlations among heterogeneity, TME, drug resistance, and signaling pathways. 14
The major objective of this study was to determine the specific cellular and transcriptional features distinguishing tumor heterogeneity and TME of recurrent GBM from those of primary GBM cells at a single‐cell resolution using scRNA‐seq. We thus present a comprehensive analysis of the transcriptomic profile of 30,126 qualified single cells from three patients with recurrent GBM and three with primary GBM. Single‐cell analysis revealed the complex tumor heterogeneity and subpopulations of proliferating stem‐like cells and expanded our view of TME influence in the disease process. The malignant cells and major cells in the TME were characterized. Additionally, we analyzed the expression of VEGFA, markers of BBB permeability, and MGMT‐related signaling pathways. The current study provides deep insights into the cellular and molecular characteristics of recurrent GBM and its TME properties, which may aid in the development of therapeutic methods in the future.
2. MATERIALS AND METHODS
2.1. Recurrent GBM samples
Recurrent GBM samples were obtained from patients undergoing craniotomy at Sun Yat‐sen University Cancer Center (Guangzhou, China) from September 2020 to February 2021. All patients with recurrent GBM experienced disease progression after the standard (Stupp regimen) therapy, including maximal surgical resection, TMZ, and fractionated radiotherapy and concurrent TMZ following the adjuvant TMZ 5/28 regimen. Recurrence was confirmed by diagnosis via pathological review after the second resection.
2.2. Sample preparation and cell isolation for scRNA‐seq
Tissues from recurrent GBM were preserved using GEXSCOPE Tissue Preservation Solution (Singleron Biotechnologies, Nanjing, China) and shipped to the Singleron laboratory in a sealed specimen bag surrounded by ice packs to maintain a temperature of ~4°C. The specimens were washed three times with HBSS (Thermo Fisher Scientific, Waltham, Massachusetts; Gibco, Cat. No.14025‐076) and shredded into 1–2 mm pieces. The tissue debris was digested with 2 mL GEXSCOPE Tissue Dissociation Solution (Singleron Biotechnologies) at 37°C for 15 min in a 15‐mL centrifuge tube (Falcon; Cat. No.352095) with sustained agitation. Cells were filtered through 40‐μm sterile strainers (Falcon; Cat. No.352340) and centrifuged (Eppendorf, 5810R) at 300 g for 5 min. The supernatant was removed, and the pellets were resuspended in 1 mL PBS (Hyclone; Cat. No. SA30256.01). To remove the red blood cells, which were frequently a significant portion of the cells produced, 2 mL of RBC lysis buffer (Roche; Cat. No. 11 814 389 001) was added to the cell suspension according to the manufacturer's protocol. The cells were centrifuged at 500 g for 5 min at 15–25°C in a microfuge and resuspended in PBS (Hyclone; Cat. No.SA30256.01). Samples from the cell mixture were stained with trypan blue (Bio‐Rad; Cat. No. #1450013), and cell counting was performed using an inverted microscope (Nikon, ECLIPSE Ts2) to ensure a concentration of ~1 × 10⁵ cells/mL. Subsequent sample processing was performed once the cell viability exceeded 80%.
2.3. scRNA‐seq protocol
Single‐cell suspensions at a concentration of 1 × 10⁵ cells/mL were prepared in PBS. Single‐cell suspensions were then loaded onto microfluidic devices, and scRNA‐seq libraries were constructed according to the Singleron GEXSCOPE protocol using a GEXSCOPE Single‐Cell RNA Library Kit (Singleron Biotechnologies), which included materials for cell lysis, mRNA trapping, labeling of cells (barcode) and mRNA (UMI), reverse transcription of mRNA into cDNA, amplification, and finally fragment cDNA processing. The individual libraries were diluted to 4 nM and pooled for sequencing. Pools were sequenced on an Illumina HiSeq X sequencer (Illumina) with 150‐bp paired‐end reads.
2.4. Primary analysis of raw read data
Raw reads from the scRNA‐seq were processed to generate gene expression matrices using an internal pipeline. Briefly, raw reads were first processed with fastQC v0.11.4 (https://www.bioinformatics.babraham.ac.uk/projects/fastqc/) and fastp 15 to remove low‐quality reads and with cutadapt 16 to trim poly A tail and adapter sequences. Cell barcodes and UMI were extracted. Next, we used STAR v2.5.3a to map the reads to the reference genome GRCh38 (ensemble version 92 annotation). UMI counts and gene counts of each cell were acquired with featureCounts 17 v1.6.2 software and were used to generate expression matrix files for subsequent analysis.
2.5. Quality control, dimension reduction, and clustering
Before analyses, cells were filtered by removing those with gene counts below 200 and with >10% mitochondrial content. After filtering, Seurat v4.0.4 19 functions were used for dimension reduction and clustering. The “NormalizeData” and “ScaleData” functions were used to normalize and scale the expression of all genes. We selected the top 2000 variable genes with the “FindVariableFeautres” function for principal components analysis (PCA) analysis. Using the top 30 principal components, we separated the cells into multiple clusters using FindClusters. Batch effect between the samples was removed by Harnomy. 20 Finally, the UMAP algorithm was applied to visualize the cells in a two‐dimensional space.
2.6. Differentially expressed gene analysis
To identify DEGs, we used the Seurat “FindAllMarkers” function based on the Wilcoxon Rank Sum test with default parameters and selected the genes expressed in more than 25% of the cells in a cluster with an average log (fold change) value greater than 0.25. For the cell type annotation of each cluster, we combined the expression of canonical markers found in the DEGs based on an extensive literature search and displayed the expression of markers in each cell type with heatmaps/dot plots/violin plots generated with the Seurat “DoHeatmap”/”DotPlot”/”Vlnplot” functions, respectively. Doublet cells were identified as those expressing markers for different cell types and removed manually.
2.7. Pathway enrichment analysis
To investigate the potential functions of DEGs, KEGG analysis was used with the clusterProfiler R package. 22 Pathways with a p_adj value of less than 0.05 were considered as significantly enriched.
2.8. Trajectory analysis
The cell differentiation trajectory was reconstructed using the Monocle 3 R software toolkit. DEGs were used to sort cells in order of spatiotemporal differentiation. We used DDRTree, a component of Monocle 3, to perform FindVairableFeatures and dimension reduction. Finally, the trajectory was visualized using the “plot_cell_trajectory” function.
2.9. Cell–cell interaction analysis
Cell–cell interaction analysis was performed using CellPhoneDB 23 based on receptor–ligand interactions between two cell types/subtypes. The cluster labels of all cells were randomly permuted 1000 times to calculate the null distribution of the average expression levels of ligands and receptors in the interacting clusters. The threshold for individual ligand or receptor expression was defined with a cutoff value based on the average log gene expression distribution for all genes across all cell types. Significant cell–cell interactions were defined as those having a p‐value <0.05 and average log expression >0.1, which were visualized with the “cellphonedb plot” “heatmap_plot” functions. The datasets presented in this study can be found in online repositories.
2.10. TCGA survival analysis
We used the survival R package for TCGA survival analysis. Specifically, genes of interest and cancer subtype were chosen as the inputs to generate survival curves for OS and statistical test results. We used “median” as the group cutoff metric to assign the lower and higher half of the patients to the “low” and “high” groups, respectively. Statistical significance was set at a p‐value < 0.05.
2.11. Immunocytochemistry
The IHC staining was performed according to the standard protocol procedure. Six surgical pathology specimens from three patients with primary GBM and three patients with recurrent GBM were formalin fixed. The tissue samples were paraffin‐embedded and sectioned at 4‐μm thickness. Heat‐mediated antigen retrieval prior to staining, using a 1 mM EDTA buffer, pH 8.0, for 10 min was followed by cooling at room temperature for 20 min. Following antigen retrieval, sample were incubated with rabbit anti‐human anti‐VEGF antibody (Abcam) (1:100) overnight at 4°C in a humidified chamber. Slides were rinsed three times with PBS, then slides were incubated with secondary antibodies at 37°C for 1 h, followed by DAB tetrahydrochloride staining.
2.12. Immunofluorescence staining
Antigen retrieval was performed in Tris–EDTA buffer (pH 9) for 10 min followed by cooling at room temperature. Slides were stained with anti‐TMEM119 antibody (Cell Signaling Technology). Anti‐mouse/rabbit horseradish peroxidase (Cell Signaling Technology) was used as the secondary antibody, with incubation times for the primary antibody of 1 h. Subsequently, anti‐rabbit/mouse was applied as a secondary label with an incubation time of 10 min. All slides were counterstained with DAPI for 5 min. The entire slide image was scanned and three representative regions of interest were chosen by the pathologist.
2.13. Statistical analyses
Statistical analyses were performed using GraphPad Prism (GraphPad 7.0 software). For all statistical tests, significance was defined by p < 0.05. Data are presented as means ± SEM.
3. RESULTS
3.1. Establishment of recurrent GBM cell atlas
We performed scRNA‐seq analysis on tumor samples from three recurrent and three patients with primary IDH wild‐type GBM (TISCH database) to explore their cellular composition (Figure 1A). Following multiple quality control and filtering steps (Figure S1), we obtained single‐cell transcriptomes from 30,126 cells, including 10,144 cells from primary GBM lesions and 19,982 cells from recurrent GBM lesions. Unbiased clustering of the cells identified 22 clusters in parallel based on UMAP analyses according to their gene profiles and canonical markers (Figure 1B). We corrected for batch effect in the primary and recurrent GBM data (Figure 1C,D). In total, 11 major cell types were detected using characteristic canonical cell markers and were classified as tumor cell types, endothelial cell types, and immune cell types (Figure 1E). Normal and cancerous cells residing in GBM tissues could be distinguished by genomic CNVs. To probe the clonal structure of recurrent GBM cells, we applied the inferCNV algorithm to analyze the CNVs of single cells from each cell in the reference cells (endothelial cells) and observation cells (immune cells and tumor cells). 24 , 25 The inferred CNV profiles of the three patients showed both interpatient and intrapatient heterogeneity (Figure 1F).
FIGURE 1.
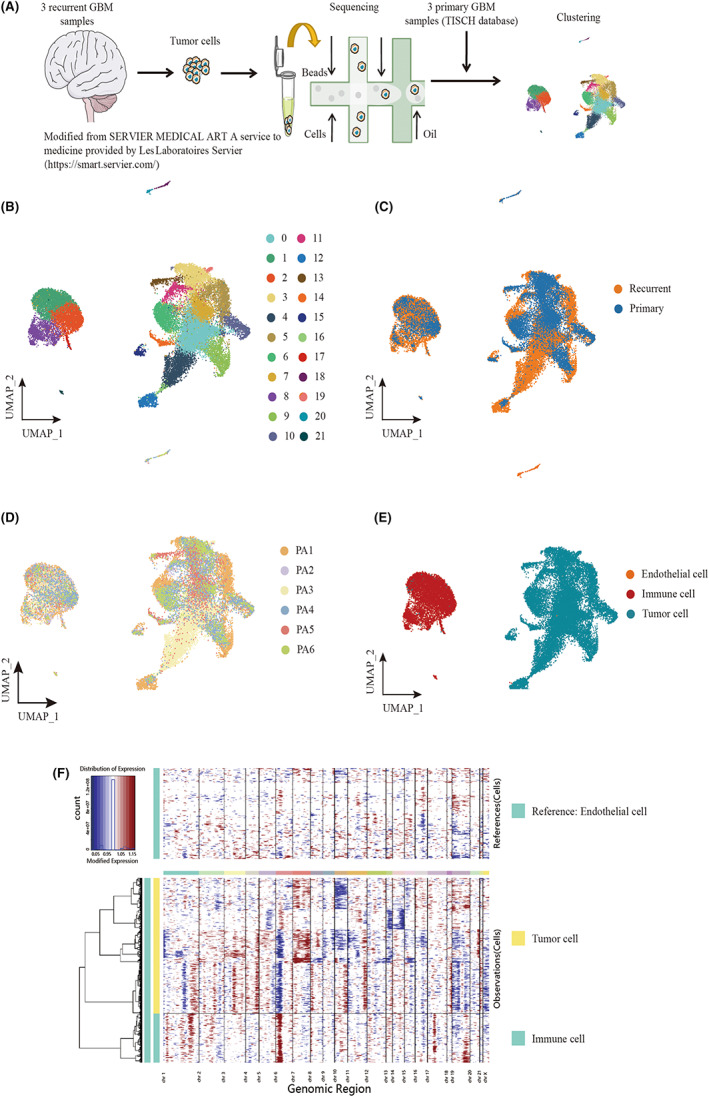
Landscape of cell composition in primary and recurrent glioblastoma. (A) Workflow of sample collection, sequencing, and analysis for single‐cell RNA‐seq data. Three samples of recurrent glioblastoma sequenced by Singleron platform. (B) Uniform Manifold Approximation and Projection (UMAP) plot showing the major clusters of all cells in a glioma. Each dot of the UMAP plot represents a single cell. Cells are color coded by their associated cell clusters. (C) UMAP plot showing the illness state of individual tumor cells in glioblastoma patients. Primary glioblastoma patients were collected from CGGA, and recurrent glioblastoma patients were collected from an independent cohort from the Sun Yat‐sen University Cancer Center. (D) UMAP plot showing the major lineages in glioblastoma (GBM). Each dot of the UMAP plot represents a single cell. Cells are color coded by their associated cell lineages. (E) UMAP plots showing the origins of individual tumor cells in GBM patients. (F) The CNV pattern of each cell in immune cells and tumor cells. Red means amplification and blue indicates deletion. The intensity of the red and blue color components correlates with the gain and loss values.
3.2. Tumoral heterogeneity and cell subtype identification
We corrected for batch effect in the primary and recurrent GBM data (Figure 2A,B). Thereafter, we selected tumor cells for further analysis. Through UMAP analysis of tumor cells, we identified a total of 16 subclusters (Figure 2C). Similar to observations from previous studies, these clusters varied greatly among samples, probably due to differences in tumor phenotypes or locations within the tumor where biopsies were taken. Among these clusters, cluster numbers 4, 13, and 14 were dominant in primary GBM cells and clusters 0 and 12 were dominant in recurrent GBM cells (Figure 2E). The normalized Shannon diversity index was used to indicate the evenness of the major clusters in each patient (Figure 2D).
FIGURE 2.
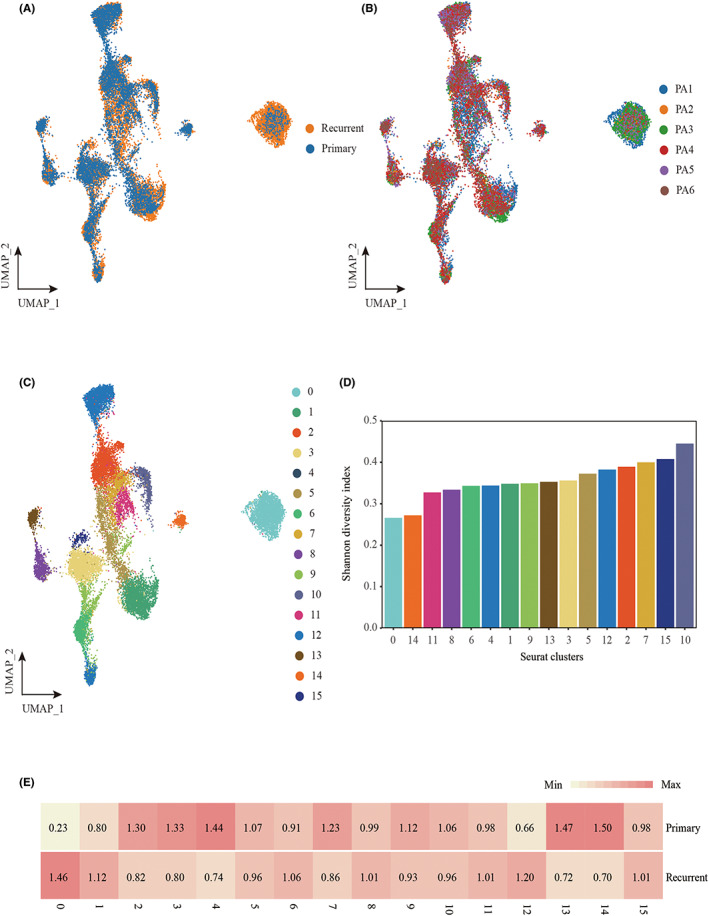
Cellular landscape of the tumor cell in primary and recurrent glioblastoma patients. (A) UMAP plot showing the illness state of individual tumor cells in glioblastoma patients. (B) UMAP plot showing the illness state of individual tumor cells in glioblastoma patients. Primary patients were collected from CGGA, and relapse patients were collected from an independent cohort from the Sun Yat‐sen University Cancer Center. (C) UMAP plot showing the major clusters of tumor cells in glioblastoma patients. Each dot of the UMAP plot represents a single cell. Cells are color coded by their associated cell clusters. (D) Normalized Shannon diversity index (NSDI) of major clusters that indicates the evenness of major clusters in each patient. (E) Heatmap showing the illness state preferences of major clusters estimated by the Ro/e score that denotes the ratio of observed to expected cell number.
To further identify the subgroups of each tumor cell type, we clustered and annotated them individually using canonical cell markers (Figure 3B). We identified nine tumor cell subtypes, classified as astrocytes, CGEin, dividing OPCs, immature astrocytes, mIPCs, newborn neurons, microglia, oligodendrocytes, OPCs, and radial glia (Figure 3A). Almost all cell populations were present in each individual lesion. The proportions of cell types were significantly different both between and within patient samples, and the ratio of cell type composition was also different (Figure 3C,D). In primary GBM, the proportions of CGEin, immature astrocytes, and microglia were high; however, in recurrent GBM, the proportion of oligodendrocytes was high (Figure 3E). The proportion of cellular clusters varied significantly among the lesions, suggesting intertumoral heterogeneity as well as consistency among the lesions. To explore the interplay among cell types within the TME of recurrent GBM, we performed a cell–cell interaction analysis using CellPhoneDB and found a prominent interaction among dividing OPCs, OPCs, immature astrocytes, and oligodendrocytes (Figure 3F).
FIGURE 3.
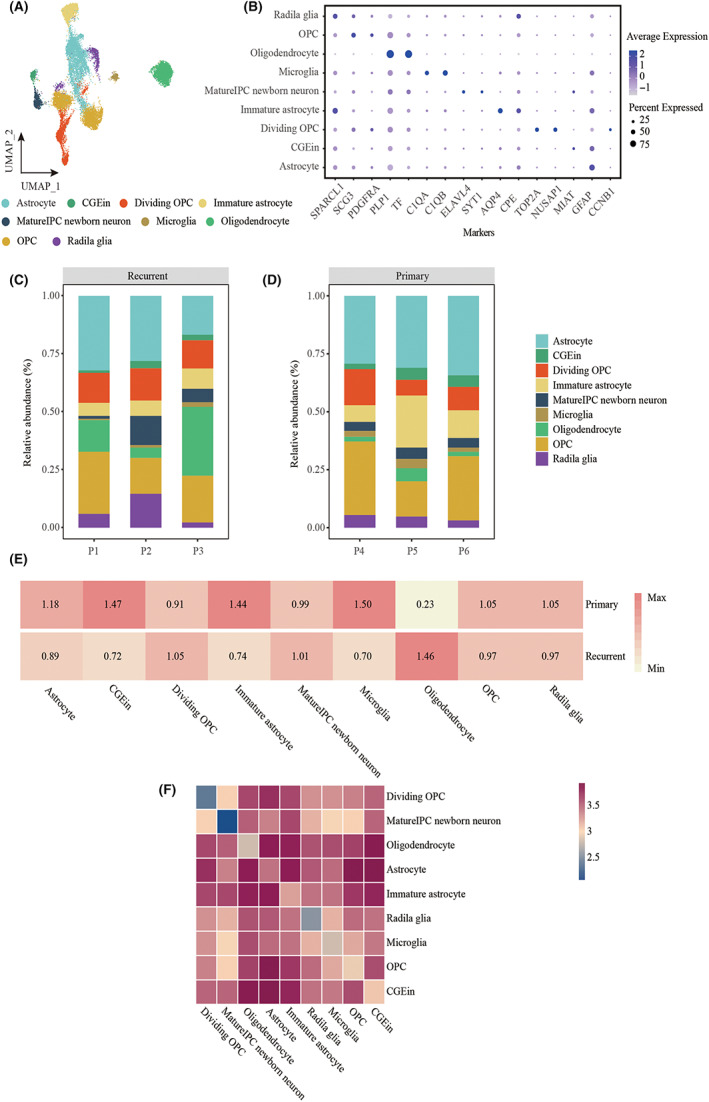
The frequency and evenness of each cell type in samples. (A) UMAP plot showing the major lineages of immune cells in a glioblastoma. Each dot of the UMAP plot represents a single cell. Cells are color coded by their associated cell lineages. (B) Dot plot showing the 16 signature gene expressions across the nine cellular clusters. The size of dots represents the proportion of cells expressing the particular marker, and the spectrum of color indicates the mean expression levels of the markers (log1p transformed). (C) Bar plot showing the fraction of major lineages of tumor cells in recurrent glioblastoma. (D) Bar plot showing the fraction of major lineages of tumor cells in primary glioblastoma. (E) Heatmap showing the illness state preferences of major tumor cell lineages estimated by the Ro/e score that denotes the ratio of observed to expected cell number. (F) Heatmap showing logarithmic interaction scores between all cell subsets.
3.3. Developmental trajectory and identification of proliferation‐related tumor clusters in recurrent GBM
We performed a trajectory analysis of recurrent GBM based on the Monocle 3 algorithm to infer developmental pathways. Dividing OPCs were determined to be the starting point of the biological process (Figure 4A). KEGG pathway analysis revealed that cluster 12 was enriched in stem cell signaling pathways (Figure 4B). Cell proliferation‐related genes, including TOP2A, MKI67, UBE2C, CENPF, and PBK, were enriched in cluster 12, implying a phenotypic change toward malignancy (Figure 4C). Cell‐cycle scoring results revealed a greater number of cells in the G1 and S phases than in other phases in relapsed GBM (Figure 4D). We also observed a longer OS in the CGGA glioblastoma patient cohort with a high radial glia signature than in those with a low radial glia signature, with an increasing number of relapses (Figure 4E–G).
FIGURE 4.
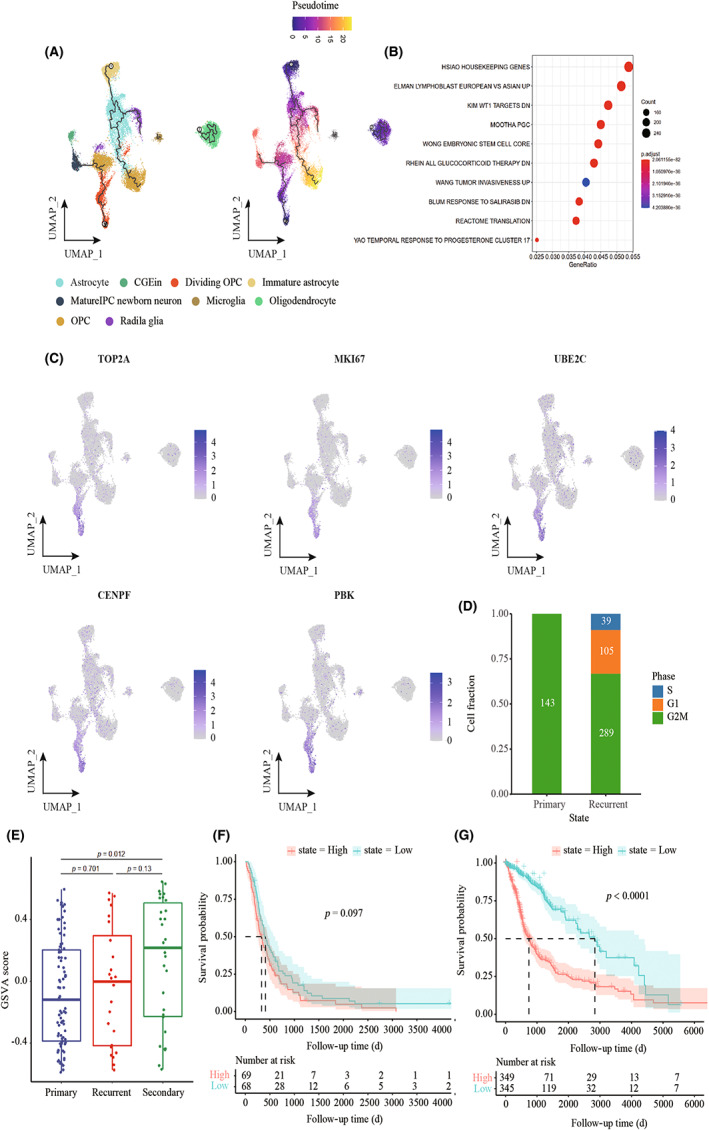
Developmental trajectory and identification of proliferation‐related tumor clusters in recurrent GBM. (A) The left UMAP plot shows the developmental trajectories (black lines). The right UMAP plot shows a pseudo‐time score from dark blue to yellow, indicating developmental states, respectively. Tumor cell subpopulations inferred by monocle3. (B) Gene set enrichment analysis in cluster 12, ordered by generation, enrichment of stem‐like cells, and tumor invasiveness in recurrent GBM. (C) UMAP plot showing the expression of proliferation gene markers in tumor subpopulations. (D) Bar plot showing the cell‐cycle distribution in different illness states. (E) Box plot showing GSVA of cluster 12 using a CGGA cohort. (F) Kaplan–Meier curves show probability of OS among patients with high radial glia signature (top 50%) versus low radial glia signature (bottom 50%) in patients from the CGGA cohort. (G) Kaplan–Meier curves show probability of OS among patients with high radial glia signature (top 50%) versus low radial glia signature (bottom 50%) in patients from TCGA‐GBM LGG cohort.
3.4. Mechanisms of treatment resistance in recurrent GBM
The DEGs in primary and recurrent GBM were analyzed using a two‐sided Wilcoxon test (Figure 5A). In our study, VEGFA was highly expressed in recurrent GBM, mainly in the radial glia (Figure 5B,C). The high metabolic demands of high‐grade glioma create hypoxic areas that trigger increased VEGF expression and angiogenesis, leading to the formation of abnormal vessels and a dysfunctional BBB. 26 In our study, we detected BBB‐related signaling pathway genes that were overexpressed in recurrent GBM (Figure 5D). More importantly, we found that MGMT‐related signaling pathway genes were enriched in recurrent GBM (Figure 5E). The radial glia signature and MGMT gene expression were significantly increased and were associated with a poor prognosis in recurrent GBM compared with primary GBM (Figure 5F,G). We further confirmed the reduction in microglia and that VEGF protein expression increased in the recurrent GBM using immunohistochemistry and immunofluorescence staining (Figure 6).
FIGURE 5.
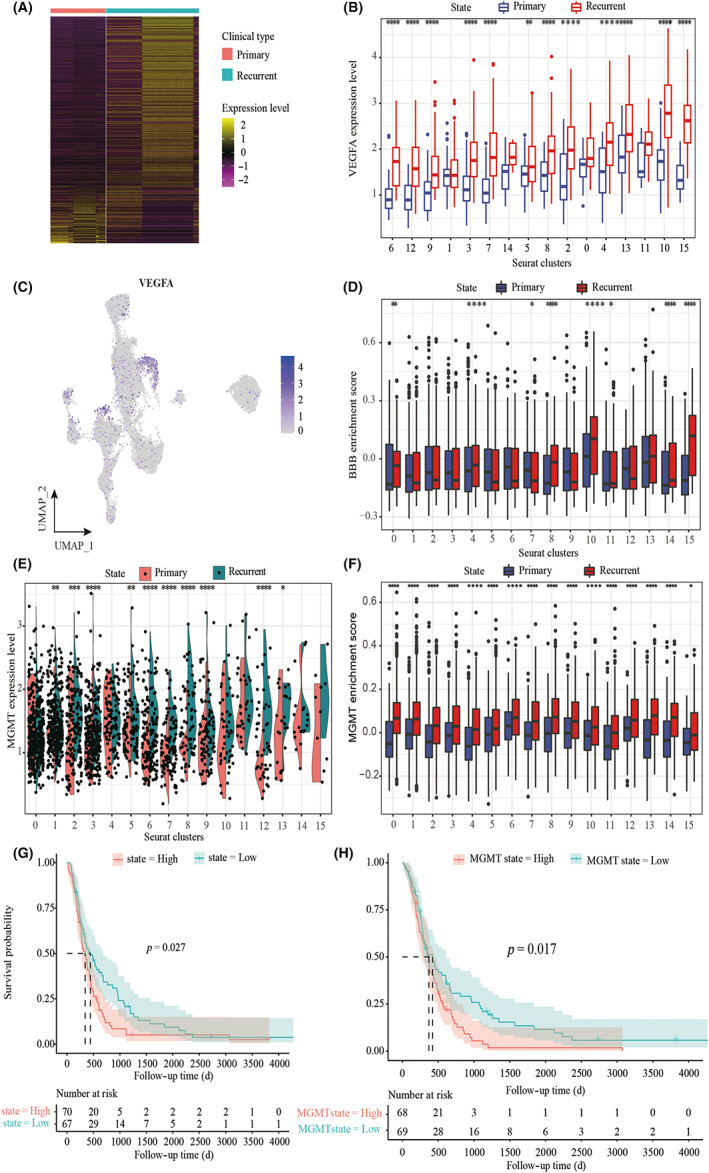
Identification of treatment resistance‐related tumor clusters in glioblastoma. (A) Heat map of differentially expressed genes (based on two‐sided Wilcoxon test) in primary and recurrent GBM. (B) Box plot showing the expression of VEGFA in tumor subpopulations. Each comparison is made using a two‐sided Wilcoxon test. (C) UMAP plot showing the expression of VEGFA in tumor subpopulations. (D) Gene set variation analysis (GSVA) of BBB signature using single‐cell data. Each comparison is made using a two‐sided Wilcoxon test. (E) Violin plots showing the expression of MGMT in tumor subpopulations. Each comparison is made using a two‐sided Wilcoxon test. (F) GSVA of MGMT signature using single‐cell data. Each comparison is made using a two‐sided Wilcoxon test. (G) Kaplan–Meier curves showing the probability of OS among patients with high radial glia signature (top 50%) versus low radial glia signature (bottom 50%) in patients from the CGGA cohort. (H) Kaplan–Meier curves showing the probability of OS among patients with high MGMT signature (top 50%) versus low MGMT signature (bottom 50%) in patients from the CGGA cohort.
FIGURE 6.
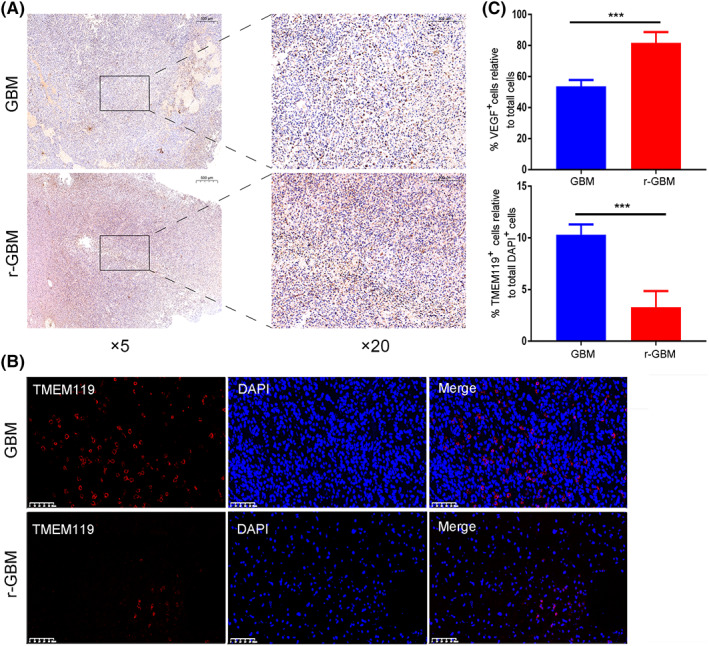
The changes of microglial cell number and VEGF protein expression in primary and recurrent GBM. (A) Immunohistochemistry images of VEGF protein expression in GBM and r‐GBM. (B) Immunofluorescence images of TMEM119 + cells and DAPI + in GBM and r‐GBM. (C) Quantitation of VEGF + cell relative to total DAPI + cells and of TMEM119 + cell relative to total DAPI + cells in GBM and r‐GBM (n = 6). Two‐tailed Student's t‐test: ***p < 0.001.
4. DISCUSSION
GBM is the most common and aggressive type of primary glial tumor, contributing to ~200,000 deaths related to central nervous system tumors worldwide each year. 26 , 27 Despite multimodal treatment using surgical resection when possible, followed by radiotherapy and adjuvant chemotherapy with TMZ and the addition of tumor‐treating fields to standard therapy, the complexity of the disease results in treatment failure, disease progression, and fatality. 28 , 29 Patients with GBM had a median OS of 20.9 months and a less than 5% 5‐year survival rate. 30 , 31
The treatment of GBM is extremely challenging due to its increased biological complexity related to the poorly understood “multiforme,” or the heterogeneous nature. 31 , 32 Immunohistochemical staining and flow cytometry have been useful in categorizing cell types based on specific cell surface markers; however, these methods masked intracellular heterogeneity. 33 Traditional bulk tumor sequencing averages gene expression and fails to identify the respective contributions of cell subsets, thus providing limited insights into the cellular diversity and molecular complexity of tumor cells. Nevertheless, single‐cell analysis methods and sequencing of individual cells have become powerful tools for investigating tumor composition, revealing cellular heterogeneity and the microenvironment. 34 For the first time, recurrent GBM cells were analyzed at the single‐cell level in this study.
This study presents a valuable comprehensive landscape of cancer cells in recurrent GBM using scRNA‐seq. We identified three separate cell types, namely, tumor cells, endothelial cells, and immune cells, from which 22 clusters were obtained. Genetic heterogeneity in cell lines, using CNVs inferred from scRNA‐seq, was used to identify malignant cells in single‐cell analysis. The CNVs for immune cells and tumor cells were specific to individual patients compared with endothelial cells. Furthermore, we observed extensive intratumoral heterogeneity at the transcriptional level; the CNV phenotypes were different between reference cells and observation cells, and cell subtype ratios were different in patients with recurrent GBM. Moreover, we identified cluster 12 mainly including dividing OPCs, which were characterized by high expression of genes encoding proliferation‐related proteins that were negatively associated with the prognosis of patients with glioma, as previously reported. 37 , 38 , 39 , 40
The GBM TME consists of a heterogeneous cellular milieu that can influence cancer cell behavior. Genomic alterations can reshape the TME to drive tumor malignancy. 41 However, the influence of microenvironment‐mediated cell–cell interactions in recurrent glioblastoma remains unclear. According to our results, although most clusters were composed of cells originating from different samples, OPCs were observably enriched in patients with recurrent GBM and microglia were observably enriched in patients with primary GBM. We also found that a high proportion of radial glia in patients with glioblastoma in the CGGA cohort was associated with reduced survival. Moreover, the microglial population prominently decreased in recurrent glioblastoma, consistent with previous studies showing that microglia‐derived GAMs were predominant in newly diagnosed glioblastoma but were outnumbered by monocyte‐derived GAMs following recurrence. 42 , 43
We then studied the differential gene expression and signaling pathways between patients with primary and recurrent glioblastoma. Our findings demonstrate that recurrent GBM cells have a distinct gene expression program from that of primary GBM cells with intratumor heterogeneity. Using scRNA‐seq, we detected VEGFA overexpression in almost all clusters except clusters 0, 1, and 14 in recurrent glioblastoma. Reshaping the TME, in turn, increases VEGFA expression to stimulate angiogenesis and support glioblastoma growth. A negative correlation exists between serum VEGFA levels and bevacizumab treatment performance. 42 Analysis revealed that stem‐like cells and tumor invasiveness were enriched in recurrent GBM, which contributed to TMZ resistance, angiogenesis, and tumor progression. 43 This study also presents potential treatment targets to inhibit cancer proliferation, restore the cancer immunity cycle, and overcome the immunosuppressive microenvironment. Even though the BBB is considered “leaky” in the core of GBM, in large parts outside the core area and, even more so, in lower grade diffuse gliomas, the BBB more closely resembles the intact BBB and prevents the efficient passage of cancer therapeutics, including small molecules and antibodies. 24 However, we found that the BBB was “leaky” in recurrent GBM in our study. MGMT is currently the only known biomarker for TMZ response in patients with glioblastoma. Previous research has shown that a subset of recurrent gliomas carries MGMT genomic rearrangements that lead to MGMT overexpression, independent of changes in promoter methylation. 44 We also showed that MGMT‐related signaling pathway genes were enriched in recurrent GBM with poor prognosis.
Our study had some limitations. First, the small number of recurrent and drug‐resistant patients with GBM may result in a lack of sufficient power to identify tumor heterogeneity and microenvironment differences between primary and recurrent cases, and thus studies with more cases are needed. Second, dissecting the molecular features and drug‐resistance mechanisms of recurrent GBM should incorporate paired samples and their corresponding primary and recurrent GBM samples from the same patients; however, our study included only recurrent GBM neoplastic samples. Considering that only 20%–30% of recurrent GBM cases are accessible for surgical treatment, 45 obtaining matched tumor samples is very difficult. Despite this limitation, our study can serve as a valuable resource and a proof‐of‐concept study for future research to identify biomarkers and targets for treatment and to enable personalized therapeutic decisions for patients with recurrent GBM.
Overall, research on the changes in the TME in recurrent GBM is limited. Heterogeneity is associated with endogenous drug resistance in tumors, and most reported resistance mechanisms have been identified by analysis of bulk tumor specimens and/or subcloned resistant cell lines. Our study identified cellular and biological features that are specific to the TME and thus offers insights that may help identify new therapeutic targets.
FUNDING INFORMATION
This study was supported by the Natural Science Foundation of Jiangxi Province (Grant 20202BABL216049), Natural Science Foundation of Jiangxi Province (Grant 20202BABL206059), and Natural Science Foundation of Guangdong (Grant 2019A1515010702).
CONFLICT OF INTEREST STATEMENT
The authors declare no conflict of interest.
ETHICS STATEMENT
This study was approved by the Ethics Committee of Sun Yat‐sen University Cancer Center (Guangzhou, China). Written informed consent was obtained from all patients. Registry and the Registration No. of the study/trial: N/A. Animal Studies: N/A.
Supporting information
Appendix S1
ACKNOWLEDGMENTS
We thank all the individuals who participated in this study.
Wu H, Guo C, Wang C, et al. Single‐cell RNA sequencing reveals tumor heterogeneity, microenvironment, and drug‐resistance mechanisms of recurrent glioblastoma. Cancer Sci. 2023;114:2609‐2621. doi: 10.1111/cas.15773
Haibin Wu, Chengcheng Guo, and Chaoye Wang contributed equally to this work and shared first authorship.
Contributor Information
Feng Wang, Email: wangfeng951@126.com.
Qunying Yang, Email: yangqy@sysucc.org.cn.
DATA AVAILABILITY STATEMENT
The scRNA‐seq datasets have been deposited in the Genome Sequence Archive in BIG Data Center, Beijing Institute of Genomics (BIG), Chinese Academy of Sciences, under accession number HRA003075 (https://ngdc.cncb.ac.cn/gsa‐human/). Codes used in this study are freely available on GitHub at https://github.com/1985wuhaibin/Haibingroup. We used the public dataset from the TISCH database to compare primary and recurrent GBM. Further inquiries can be directed to the corresponding authors upon request.
REFERENCES
- 1. LeBlanc VG, Trinh DL, Aslanpour S, et al. Single‐cell landscapes of primary glioblastomas and matched explants and cell lines show variable retention of inter‐ and intratumor heterogeneity. Cancer Cell. 2022;40:379‐392. [DOI] [PubMed] [Google Scholar]
- 2. Louis DN, Perry A, Reifenberger G, et al. The 2016 World Health Organization classification of tumors of the central nervous system: a summary. Acta Neuropathol. 2016;131:803‐820. [DOI] [PubMed] [Google Scholar]
- 3. Zhang X, Ding K, Wang J, Li X, Zhao P. Chemoresistance caused by the microenvironment of glioblastoma and the corresponding solutions. Biomed Pharmacother. 2018;109:39‐46. [DOI] [PubMed] [Google Scholar]
- 4. Goenka A, Tiek D, Song X, Huang T, Cheng SY. The many facets of therapy resistance and tumor recurrence in glioblastoma. Cells. 2021;10:484. [DOI] [PMC free article] [PubMed] [Google Scholar]
- 5. Ma J, Chen CC, Li MJ. Macrophages/microglia in the glioblastoma tumor microenvironment. Int J Mol Sci. 2021;22:5775. [DOI] [PMC free article] [PubMed] [Google Scholar]
- 6. D'Alessio A, Proietti G, Sica G, Scicchitano BM. Pathological and molecular features of glioblastoma and its peritumoral tissue. Cancers. 2019;11:469. [DOI] [PMC free article] [PubMed] [Google Scholar]
- 7. Shi Y, Ping YF, Zhou W, et al. Tumour‐associated macrophages secrete pleiotrophin to promote PTPRZ1 signalling in glioblastoma stem cells for tumour growth %. Nat Commun. 2017;8:15080. [DOI] [PMC free article] [PubMed] [Google Scholar]
- 8. Nijaguna MB, Patil V, Urbach S, et al. Glioblastoma‐derived macrophage colony‐stimulating factor (MCSF) induces microglial release of insulin‐like growth factor‐binding protein 1 (IGFBP1) to promote angiogenesis. J Biol Chem. 2015;290:23401‐23415. [DOI] [PMC free article] [PubMed] [Google Scholar]
- 9. Mu N, Gu J, Liu N, et al. PRL‐3 is a potential glioblastoma prognostic marker and promotes glioblastoma progression by enhancing MMP7 through the ERK and JNK pathways. Theranostics. 2018;8:1527‐1539. [DOI] [PMC free article] [PubMed] [Google Scholar]
- 10. Wang Z, Jin C, Li X, Ding K. Sulfated polysaccharide JCS1S2 inhibits angiogenesis via targeting VEGFR2/VEGF and blocking VEGFR2/Erk/VEGF signaling. Carbohydr Polym. 2019;207:502‐509. [DOI] [PubMed] [Google Scholar]
- 11. Huang Y, Hoffman C, Rajappa P, et al. Oligodendrocyte progenitor cells promote neovascularization in glioma by disrupting the blood–brain barrier. Cancer Res. 2014;74:1011‐1021. [DOI] [PubMed] [Google Scholar]
- 12. Lang F, Liu Y, Chou F‐J, Yang C. Genotoxic therapy and resistance mechanism in gliomas. Pharmacol Ther. 2021;228:107922. [DOI] [PMC free article] [PubMed] [Google Scholar]
- 13. Suwala AK, Stichel D, Schrimpf D, et al. Primary mismatch repair deficient IDH‐mutant astrocytoma (PMMRDIA) is a distinct type with a poor prognosis. Acta Neuropathol. 2021;141:85‐100. [DOI] [PMC free article] [PubMed] [Google Scholar]
- 14. Johnson KC, Anderson KJ, Courtois ET, et al. Single‐cell multimodal glioma analyses identify epigenetic regulators of cellular plasticity and environmental stress response. Nat Genet. 2021;53:1456‐1468. [DOI] [PMC free article] [PubMed] [Google Scholar]
- 15. Chen S, Zhou Y, Chen Y, Jia G. fastp: an ultra‐fast all‐in‐one FASTQ preprocessor. Bioinformatics. 2018;34:i884‐i890. [DOI] [PMC free article] [PubMed] [Google Scholar]
- 16. Martin MJEJ, Martin M. Cut adapt removes adapter sequences from high‐throughput sequencing reads. EMBnet. 2011;17(10–12):17. [Google Scholar]
- 17. Liao Y, Smyth GK, Shi W. featureCounts: an efficient general purpose program for assigning sequence reads to genomic features. Bioinformatics. 2014;30:923‐930. [DOI] [PubMed] [Google Scholar]
- 18. Rahul S, Jeffrey A, Gennert D, et al. Spatial reconstruction of single‐cell gene expression data . 2015. [DOI] [PMC free article] [PubMed]
- 19. Korsunsky I, Millard N, Fan J, Slowikowski K, Raychaudhuri S. Fast, sensitive and accurate integration of single‐cell data with Harmony. Nat Methods. 2019;16:1‐8. [DOI] [PMC free article] [PubMed] [Google Scholar]
- 20. Yu G, Wang LG, Han Y, He QY. clusterProfiler: an R package for comparing biological themes among gene clusters. OMICS. 2012;16:284‐287. [DOI] [PMC free article] [PubMed] [Google Scholar]
- 21. Efremova M, Vento‐Tormo M, Teichmann SA, Vento‐Tormo R. CellPhoneDB v2.0: Inferring cell‐cell communication from combined expression of multi‐subunit receptor‐ligand complexes . 2019. [DOI] [PubMed]
- 22. Patel AP, Tirosh I, Trombetta JJ, et al. Single‐cell RNA‐seq highlights intratumoral heterogeneity in primary glioblastoma. Science. 2014;344:1396‐1401. [DOI] [PMC free article] [PubMed] [Google Scholar]
- 23. Puram SV, Tirosh I, Parikh AS, et al. Single‐cell transcriptomic analysis of primary and metastatic tumor ecosystems in head and neck cancer. Cell. 2017;171:1611‐1624. [DOI] [PMC free article] [PubMed] [Google Scholar]
- 24. van Tellingen O, Yetkin‐Arik B, de Gooijer MC, Wesseling P, Wurdinger T, de Vries HE. Overcoming the blood‐brain tumor barrier for effective glioblastoma treatment. Drug Resist Updat. 2015;19:1‐12. [DOI] [PubMed] [Google Scholar]
- 25. GBD 2016 Brain and Other CNS Cancer Collaborators . Global, regional, and national burden of brain and other CNS cancer, 1990‐2016: a systematic analysis for the Global Burden of Disease Study 2016. Lancet Neurol. 2019;18:376‐393. [DOI] [PMC free article] [PubMed] [Google Scholar]
- 26. Alexander BM, Ba S, Berger MS, et al. Adaptive global innovative learning environment for glioblastoma: GBM AGILE. Clin Cancer Res. 2018;24:737‐743. [DOI] [PubMed] [Google Scholar]
- 27. McGranahan T, Therkelsen KE, Ahmad S, Nagpal S. Current state of immunotherapy for treatment of glioblastoma. Curr Treat Options Oncol. 2019;20:24. [DOI] [PMC free article] [PubMed] [Google Scholar]
- 28. Rominiyi O, Vanderlinden A, Clenton SJ, Bridgewater C, Al‐Tamimi Y, Collis SJ. Tumour treating fields therapy for glioblastoma: current advances and future directions. Br J Cancer. 2021;124:697‐709. [DOI] [PMC free article] [PubMed] [Google Scholar]
- 29. Stupp R, Taillibert S, Kanner A, et al. Effect of tumor‐treating fields plus maintenance temozolomide vs maintenance temozolomide alone on survival in patients with glioblastoma: a randomized clinical trial. JAMA. 2017;318:2306‐2316. [DOI] [PMC free article] [PubMed] [Google Scholar]
- 30. Davis ME. Epidemiology and overview of gliomas. Semin Oncol Nurs. 2018;34:420‐429. [DOI] [PubMed] [Google Scholar]
- 31. Parsons DW, Jones S, Zhang X, et al. An integrated genomic analysis of human glioblastoma multiforme. Science. 2008;321:1807‐1812. [DOI] [PMC free article] [PubMed] [Google Scholar]
- 32. Furnari FB, Fenton T, Bachoo RM, et al. Malignant astrocytic glioma: genetics, biology, and paths to treatment. Genes Dev. 2007;21:2683‐2710. [DOI] [PubMed] [Google Scholar]
- 33. Olalekan S, Xie B, Back R, Eckart H, Basu A. Characterizing the tumor microenvironment of metastatic ovarian cancer by single‐cell transcriptomics. Cell Rep. 2021;35:109165. [DOI] [PubMed] [Google Scholar]
- 34. Carlson JC, Cantu Gutierrez M, Lozzi B, et al. Identification of diverse tumor endothelial cell populations in malignant glioma. Neuro Oncol. 2021;23:932‐944. [DOI] [PMC free article] [PubMed] [Google Scholar]
- 35. Yu S. Overexpression of SKA complex is associated with poor prognosis in gliomas. Front Neurol. 2021;12:755681. [DOI] [PMC free article] [PubMed] [Google Scholar]
- 36. Arya KR, Bharath Chand RP, Abhinand CS, Nair AS, Oommen OV, Sudhakaran PR. Identification of hub genes and key pathways associated with anti‐ resistant glioblastoma using gene expression data analysis. Biomolecules. 2021;11:11. [DOI] [PMC free article] [PubMed] [Google Scholar]
- 37. Chen X, Zhang M, Gan H, et al. A novel enhancer regulates MGMT expression and promotes temozolomide resistance in glioblastoma. Nat Commun. 2018;9:2949. [DOI] [PMC free article] [PubMed] [Google Scholar]
- 38. Zhang M, Zhang Q, Bai J, Zhao Z, Zhang J. Transcriptome analysis revealed CENPF associated with glioma prognosis. Math Biosci Eng. 2021;18:2077‐2096. [DOI] [PubMed] [Google Scholar]
- 39. Ni X, Wu W, Sun X, et al. Interrogating glioma‐M2 macrophage interactions identifies Gal‐9/Tim‐3 as a viable target against ‐null glioblastoma. Sci Adv. 2022;8:eabl5165. [DOI] [PMC free article] [PubMed] [Google Scholar]
- 40. Pombo Antunes AR, Scheyltjens I, Lodi F, et al. Single‐cell profiling of myeloid cells in glioblastoma across species and disease stage reveals macrophage competition and specialization. Nat Neurosci. 2021;24:595‐610. [DOI] [PubMed] [Google Scholar]
- 41. Fu W, Wang W, Li H, et al. Single‐cell atlas reveals complexity of the immunosuppressive microenvironment of initial and recurrent glioblastoma. Front Immunol. 2020;11:835. [DOI] [PMC free article] [PubMed] [Google Scholar]
- 42. García‐Romero N, Palacín‐Aliana I, Madurga R, et al. Bevacizumab dose adjustment to improve clinical outcomes of glioblastoma. BMC Med. 2020;18:142. [DOI] [PMC free article] [PubMed] [Google Scholar]
- 43. Garnier D, Meehan B, Kislinger T, et al. Divergent evolution of temozolomide resistance in glioblastoma stem cells is reflected in extracellular vesicles and coupled with radiosensitization. Neuro Oncol. 2018;20:236‐248. [DOI] [PMC free article] [PubMed] [Google Scholar]
- 44. Oldrini B, Vaquero‐Siguero N, Mu Q, et al. MGMT genomic rearrangements contribute to chemotherapy resistance in gliomas. Nat Commun. 2020;11:3883. [DOI] [PMC free article] [PubMed] [Google Scholar]
- 45. Weller M, Cloughesy T, Perry JR, Wick W. Standards of care for treatment of recurrent glioblastoma‐‐are we there yet? Neuro Oncol. 2013;15:4‐27. [DOI] [PMC free article] [PubMed] [Google Scholar]
Associated Data
This section collects any data citations, data availability statements, or supplementary materials included in this article.
Supplementary Materials
Appendix S1
Data Availability Statement
The scRNA‐seq datasets have been deposited in the Genome Sequence Archive in BIG Data Center, Beijing Institute of Genomics (BIG), Chinese Academy of Sciences, under accession number HRA003075 (https://ngdc.cncb.ac.cn/gsa‐human/). Codes used in this study are freely available on GitHub at https://github.com/1985wuhaibin/Haibingroup. We used the public dataset from the TISCH database to compare primary and recurrent GBM. Further inquiries can be directed to the corresponding authors upon request.