

SUMMARY
Background
Measuring the incidence of HIV and hepatitis C virus (HCV) infection among people who inject drugs (PWID) is key to track progress towards elimination. We aimed to summarise global data on HIV and primary HCV incidence among PWID and associations with age and sex or gender.
Methods
In this systematic review and meta-analysis, we updated an existing database of HIV and HCV incidence studies among PWID by searching MEDLINE, Embase, and PsycINFO, capturing studies published between Jan 1, 2000, and Dec 12, 2022, with no language or study design restrictions. We contacted authors of identified studies for unpublished or updated data. We included studies that estimated incidence by longitudinally re-testing people at risk of infection or by using assays for recent infection. We pooled incidence and relative risk (RR; young [generally defined as ≤25 years] vs older PWID; women vs men) estimates using random-effects meta-analysis and assessed risk of bias with a modified Newcastle–Ottawa scale. This study is registered with PROSPERO, CRD42020220884.
Findings
Our updated search identified 9493 publications, of which 211 were eligible for full-text review. An additional 377 full-text records from our existing database and five records identified through cross-referencing were assessed. Including 28 unpublished records, 125 records met the inclusion criteria. We identified 64 estimates of HIV incidence (30 from high-income countries [HICs] and 34 from low-income or middle-income countries [LMICs]) and 66 estimates of HCV incidence (52 from HICs and 14 from LMICs). 41 (64%) of 64 HIV and 42 (64%) of 66 HCV estimates were from single cities rather than being multi-city or nationwide. Estimates were measured over 1987–2021 for HIV and 1992–2021 for HCV. Pooled HIV incidence was 1·7 per 100 person-years (95% CI 1·3–2·3; I2=98·4%) and pooled HCV incidence was 12·1 per 100 person-years (10·0–14·6; I2=97·2%). Young PWID had a greater risk of HIV (RR 1·5, 95% CI 1·2–1·8; I2=66·9%) and HCV (1·5, 1·3–1·8; I2=70·6%) acquisition than older PWID. Women had a greater risk of HIV (RR 1·4, 95% CI 1·1–1·6; I2=55·3%) and HCV (1·2, 1·1–1·3; I2=43·3%) acquisition than men. For both HIV and HCV, the median risk-of-bias score was 6 (IQR 6–7), indicating moderate risk.
Interpretation
Although sparse, available HIV and HCV incidence estimates offer insights into global levels of HIV and HCV transmission among PWID. Intensified efforts are needed to keep track of the HIV and HCV epidemics among PWID and to expand access to age-appropriate and gender-appropriate prevention services that serve young PWID and women who inject drugs.
INTRODUCTION
Globally, around 18% of people who inject drugs (PWID) are living with HIV and more than 50% have been infected with hepatitis C virus (HCV).1 Given that effective interventions are available, UNAIDS and WHO have recommended policies and targets for ending the HIV/AIDS epidemic and eliminating HCV as a public health threat by 2030.2, 3
Monitoring HIV and HCV incidence is key to understanding the scale of these epidemics, tracking progress towards achieving the 2030 UNAIDS and WHO targets, and evaluating the effect of interventions.4, 5 Over the past two decades, the incidence rates of HIV and HCV have declined among PWID in some high-income countries (HICs)6, 7, 8, 9, 10, 11, 12 due to the scale up of harm reduction interventions and, more recently, treatment. Meanwhile, persistently high levels or outbreaks of HIV and HCV among PWID have been reported in other HICs and low-income or middle-income countries (LMICs).13, 14, 15, 16, 17, 18 A better understanding of these shifting epidemiological patterns and the availability of data globally are needed to orient surveillance and programming efforts. However, no global study has summarised HIV and HCV incidence among PWID, except for a modelling study that estimated HCV incidence to be 8·6 per 100 person-years (95% credible interval 5·4–14·4) in 2015.19
Equally important to informing prevention strategies is a better understanding of age and sex or gender differences in the risks of HIV and HCV acquisition among PWID. However, no study has synthesised data on the relationship between age and incident HIV or HCV infection, despite several studies20, 21, 22, 23 finding higher risk behaviours among younger versus older PWID. These higher risks are attributed to lower engagement in harm-reduction programmes,22, 24, 25 a reliance on others to inject,26, 27 and greater exposure to structural determinants of harm (eg, homelessness or incarceration).20, 28
Studies have also highlighted differences in injection and sexual practices that potentially place women who inject drugs at higher HIV or HCV risk than men who inject drugs.29, 30 Women face greater stigma and criminalisation linked to sex work and gender-role stereotypes (eg, primary caregiver), which can reduce their ability to adopt safer practices.31 Three systematic reviews32, 33, 34 have explored the relationship between gender and prevalent HIV or HCV infection among PWID, and found either similar prevalence32, 33 or slightly higher prevalence in women than in men.34 Only one review has evaluated the association of sex with incident HCV infection, finding a 1·36-times greater average risk in women than in men.35 No similar study has been done for HIV incidence.
We aimed to summarise global HIV and HCV incidence among PWID, to characterise geographical and temporal differences in pooled HIV and HCV incidence, and to estimate the associations between age and sex or gender and the risks of HIV and HCV acquisition.
METHODS
Search strategy and selection criteria
This systematic review and meta-analysis is reported in accordance with PRISMA guidelines.36 We updated an existing database produced for two previous systematic reviews,37, 38 which included studies published in any language reporting HIV incidence, HCV incidence, or both, among PWID published between Jan 1, 2000, and Sept 14, 2020. Using the same search strategy, AA and DS did a systematic literature search of MEDLINE, Embase, and PsycINFO for studies, including conference abstracts, published between Sept 14, 2020, and Dec 12, 2022. They searched these databases without language restrictions using terms related to HIV infection, HCV infection, injecting drug use, and study designs that could be used to evaluate HIV or HCV incidence (appendix pp 7–8). They also searched the reference lists of review articles published during the same period.
Eligible studies reported summary estimates of HIV or HCV incidence among people with a history of ever injecting drugs, measured either through repeat testing of people at risk or using assays of recent infection (eg, markers of antibody avidity or detection of HCV RNA positivity among anti-HCV antibody-negative participants).39, 40, 41 Only primary HCV infection was considered. We excluded studies that estimated HIV or HCV incidence among PWID who were incarcerated.
In our two previous systematic reviews,37, 38 we contacted authors of published studies that reported HIV or HCV incidence estimates among PWID but did not report on the association with incarceration or housing (focus of those studies), and studies in which HIV or HCV incidence among PWID was measured, but not yet published (166 authors). We re-contacted authors who responded to previous requests (29 authors) to ask for up-to-date HIV or HCV incidence estimates and, if not published, the associations between HIV or HCV acquisition risks with age and sex or gender. We also contacted two additional authors because we needed further information42 or because the study was unpublished at the time of writing (Wisse E, Medécins du Monde France, McNaughton A, University of Bristol, personal communication—now published43). We use the term “unpublished” for estimates that were calculated for this study. However, most unpublished estimates were based on data from published studies, for which we cite the most recently published article.
We created an Endnote library to catalogue search results. The titles and abstracts of each record were first screened by one author (AA or DS), with 10% being checked by another (AA, DS, AT, JS, or ZW). If inconsistences arose between two authors, all their records were double-screened, with disagreements resolved by discussion. Full-text review of records deemed potentially eligible was completed in duplicate (AA, DS, HF, ZW, and JGW). We used Google Translate to read non-English language papers.
Contrary to the protocol, we included incidence data from the intervention arm of trials when data were unavailable for the control arm or when both arms received some form of intervention (appendix pp 18–19); this decision was implemented at the data extraction stage. No other protocol deviations occurred. The study protocol can be found online.
Data analysis
Eligible records were extracted into Microsoft Excel (version 16.7) by AA and double-checked by CA, HF, AGL, ALM, DS, AT, and ZW. We extracted HIV and HCV incidence rates; the associations between HIV and HCV acquisition risks and age and sex or gender; and incidence data disaggregated by age and sex or gender, where available. For some studies, particularly long-term studies and those for which several publications were available, several estimates of HIV and HCV incidence measured over different time periods were available. In these cases, we extracted the most recent HIV or HCV incidence estimate and, if available, the least recent without temporal overlap to explore temporal trends. Few studies had multiple non-overlapping incidence estimates, and, therefore, we extracted, at most, two estimates per study. Less recent HIV and HCV incidence estimates that overlapped temporally with estimates that were extracted were marked as duplicates.
For each record, we extracted the number of incident cases, the total person-years at-risk, incidence, and 95% CIs. Where available, we also extracted the incidence rate ratio (IRR), hazard ratio, or risk ratio (collectively referred to as the relative risk [RR]) comparing HIV and HCV acquisition risks among young and older PWID and among women and men who inject drugs. We only extracted unadjusted RR estimates, as our aim was to synthesise the total effects of age and sex or gender on HIV and HCV acquisition risks. Extraction of adjusted RRs was deemed unnecessary, as the individual-level factors included in adjusted estimates are likely to reflect mediators of these associations rather than confounders. Because studies used different age groupings, we defined young as the most frequently reported threshold (≤25 years) and allowed for variations in this definition across studies. We included sex or gender, as reported, when comparing women and men; other gender identities were not extracted as they were rarely reported. We also extracted several study (eg, design, sampling strategy, and recruitment sources) and participant characteristics (eg, mean or median age and whether ≥80% had injected within the past year [denoted as having injected recently]); all characteristics are listed in the appendix (p 9). For studies that reported both mean and median, we prioritised using the median as it is a better measure for summarising non-normally distributed data.
Records with duplicate data were excluded from the analysis. We assessed the risk of bias for each record using a modified Newcastle–Ottawa Scale,44 which allocates up to 9 points on criteria related to the selection of participants and assessment of the outcome (appendix p 10). We penalised all interventional studies in the risk-of-bias assessment on the sample representativeness criterion (ie, we did not allocate these studies a point for this criterion). Risk of bias was assessed by AA and reviewed by HF, AGL, ALM, DS, AT, and ZW. We classified risk of bias as high if a study scored 3 or less, moderate if they scored between 4 and 6, and low if they scored 7 or more.
We used random-effects meta-analysis (inverse-variance method) to estimate pooled HIV and HCV incidence rates (primary outcome) on the basis of the number of incident cases and duration at risk. Between-study variance was estimated by use of the DerSimonian–Laird method and 95% CIs were estimated by use of the formula by Rothman and Greenland.45 For HIV or HCV incidence measured by use of assays for recent infection, total duration at risk was imputed from the number of incident cases and incidence rate. A fixed value (0·5) was applied to all cells of studies with no infection cases. Rates were log-transformed in analyses and back-transformed for reporting. We explored heterogeneity in HIV or HCV incidence through a-priori-defined subgroup analyses, including of study characteristics (eg, sampling strategy and recruitment venues) and participant characteristics (eg, whether ≥80% injected recently and mean or median age). Variables used in the subgroup analyses were defined in the protocol (appendix pp 5–6) and are outlined in the appendix (p 11). Heterogeneity was quantified by use of the I2 statistic and differences between groups tested by use of the Q test.46 We similarly synthesised the IRR of HCV to HIV incidence when both were available through the same study and explored heterogeneity in the pooled estimate by WHO region.
To investigate geographical and temporal differences in pooled HIV and HCV incidence, we did univariable and multivariable random-effects meta-regression (linear mixed-effects) analyses using the inverse-variance method and log-transformed incidence rates. Models assume that the random-error and random-effect terms are normally distributed and that the relationship between the continuous moderators and the outcome is linear.47 Model assumptions were inspected by use of normal Q-Q plots, the Kolmogorov–Smirnov test, and residuals-versus-fitted plots. Geographical differences were explored by use of the World Bank income classification because data were sparse for some WHO regions. Temporal differences were explored by use of the midpoint of each study period as the time variable. Because only the most recent estimate per study was used in this analysis, we estimated temporal differences by comparing data between studies. We adjusted our meta-regression models for recruitment sources, study duration, and whether at least 80% of participants had injected recently. The multivariable model was fitted by use of a theory-led approach and the number of variables was minimised to avoid overfitting and multi-collinearity. Variables were selected a priori on the basis of their potential to confound the relationship between geographical or temporal differences and HIV and HCV incidence. Results are presented as unadjusted or adjusted IRRs with 95% CIs.
We used random-effects meta-analysis to pool RRs and their corresponding 95% CIs comparing HIV or HCV acquisition risk among young versus older PWID and among women versus men who inject drugs. Similar meta-analytical methods were used to quantify between-study variance and to conduct subgroup analyses by several study characteristics, including WHO region, World Bank income classification, and publication status (appendix p 11). Where available, we also synthesised age-disaggregated and sex-disaggregated or gender-disaggregated absolute HIV and HCV incidence rates.
We did two sensitivity analyses to assess the robustness of the pooled HIV and HCV incidence estimates, excluding (1) studies that used assays for recent infection, for which we imputed the duration of follow-up, potentially leading to differences in the estimated 95% CIs relative to those reported in the original study and (2) intervention studies. Because there is some evidence that Poisson-normal models via generalised linear mixed-effects models could perform better than the conventional inverse-variance method in meta-analyses involving sparse data,48 we did an additional sensitivity analysis to explore the robustness of our results to the use of different methods.
We also did several sensitivity analyses for our meta-regression models. First, because use of the study period midpoint as the time variable can bias measures of temporal change in incidence when estimates are based on long follow-up periods, we excluded those estimates with follow-up exceeding 10 years. Second, we included nonrecent incidence estimates derived from the same study, when available, and accounted for their nested structure using a multi-level meta-regression model.49 This analysis estimated temporal differences in pooled HIV and HCV incidence rates by comparing data between and within studies. Finally, three additional sensitivity analyses were done to assess the robustness of results to the assumptions of the meta-regression models. These comprised log-transforming continuous moderators for which we observed potential departures from the linearity assumption; excluding estimates that appeared to be outliers and demonstrated potential departures from the normality assumptions; and using Poisson-normal models rather than the conventional inverse-variance method to synthesise estimates for the same reason as before (ie, potentially better suitability for sparse data).48
Publication bias in measures of RR was explored by use of funnel plots and Egger’s test. The effects of publication bias on measures of incidence rates and approaches to explore them are not well established, so we did not do such analyses. We did all analyses in R (version 4.0.5) using the “meta” and “metafor” packages.50 This systematic review and meta-analysis is registered on PROSPERO, CRD42020220884.
Role of the funding source
The funders of the study had no role in study design, data collection, data analysis, data interpretation, or writing of the report.
RESULTS
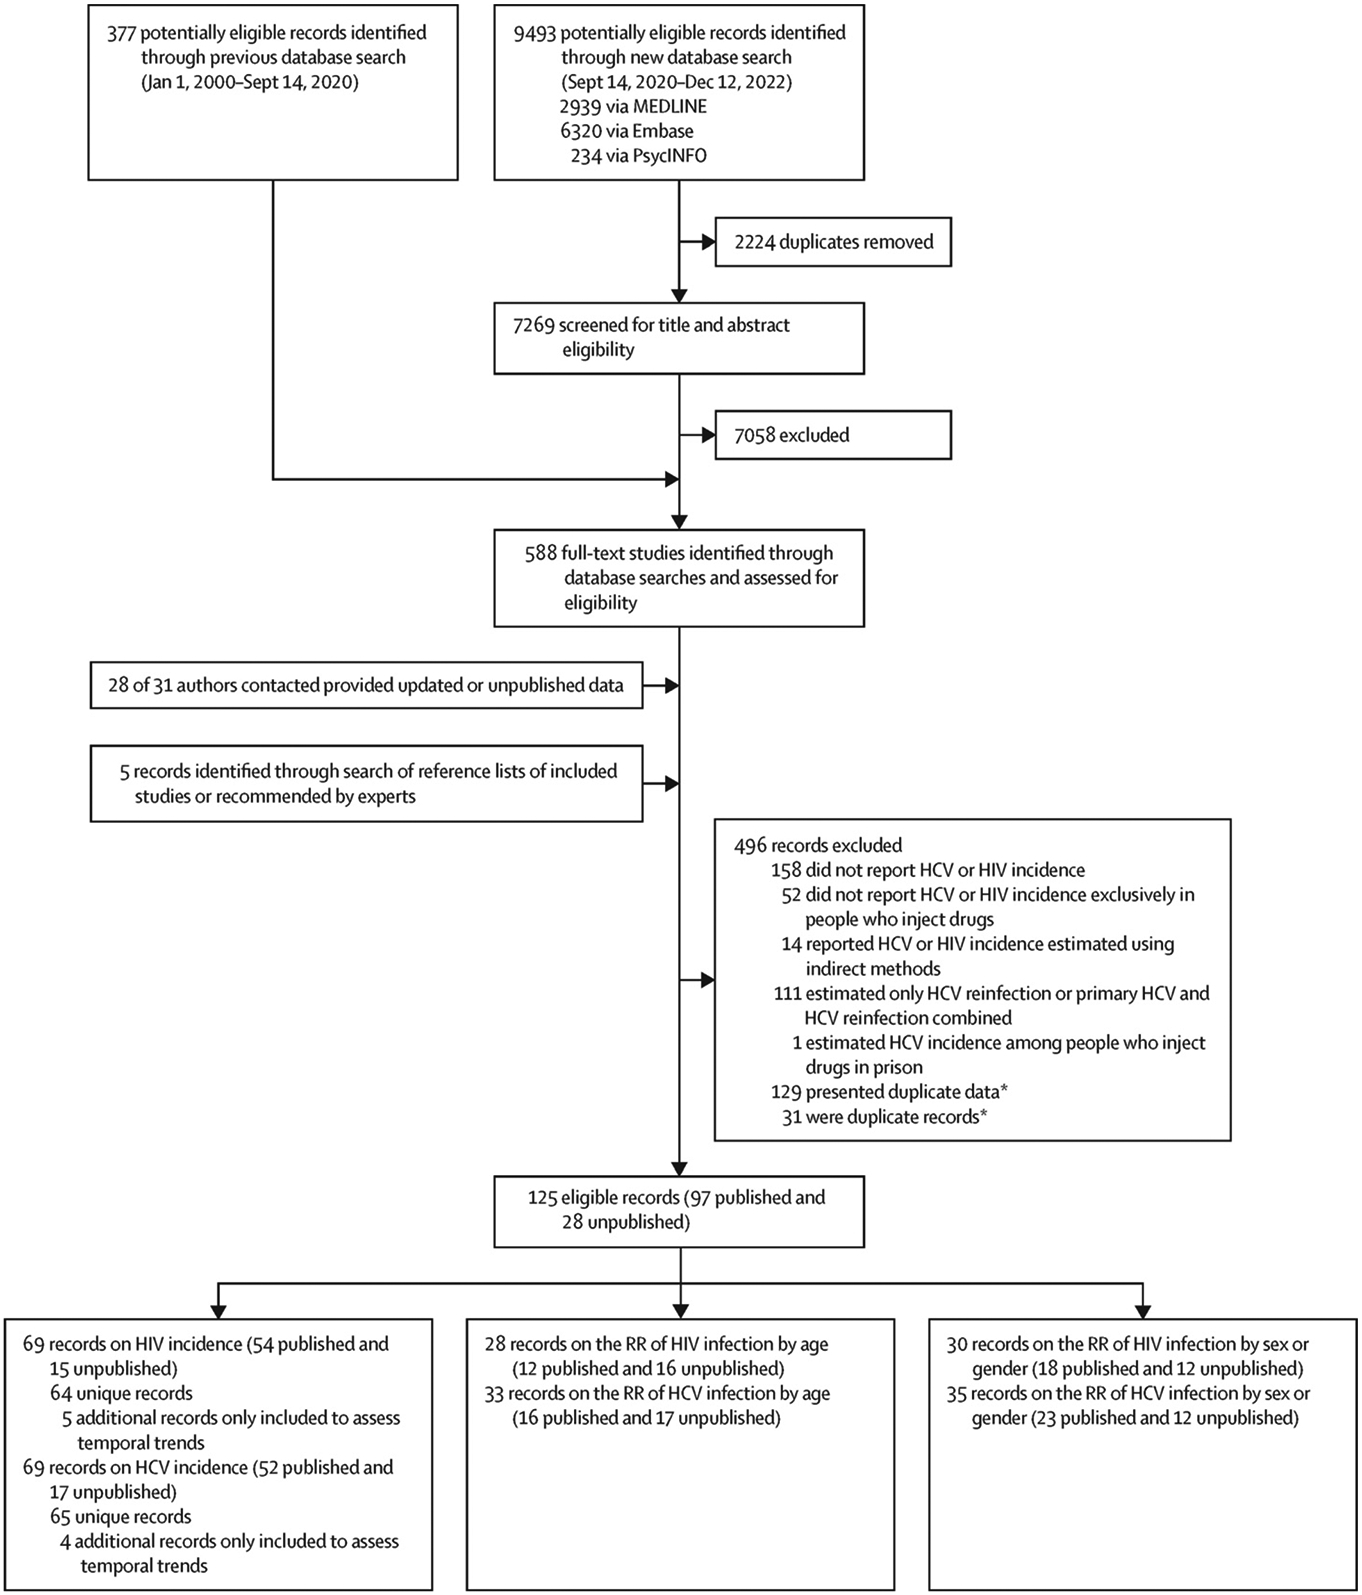
Our new database searches identified 9493 potentially eligible records, of which 2224 were duplicates (figure 1). Initial screening of titles and abstracts resulted in 211 new records eligible for full-text review. We retrieved 377 additional records from our existing database of incidence studies,37, 38 resulting in 588 records for full-text review. After contacting 31 authors for additional data and retrieving five additional records through searches of reference lists of included studies or recommendations by experts, we identified 125 eligible records (including four not written in English):18, 51, 52, 53 97 published records and 28 unpublished records. We excluded 129 records for having duplicate data (appendix pp 20–23).
Figure 1.
Study selection
HCV=hepatitis C virus. RR=relative risk. *Duplicate data refer to different publications that present data from the same study; duplicate records refer to the same publication.
We identified 64 unique records for HIV incidence (Dumcev K, Ukrainian Institute on Public Health Policy, personal communication; Sypsa V, National and Kapodistrian University of Athens, personal communication; Wisse E, Medécins du Monde, and McNaughton A, University of Bristol, personal communication)7, 11, 17, 18, 52, 53, 54, 55, 56, 57, 58, 59, 60, 61, 62, 63, 64, 65, 66, 67, 68, 69, 70, 71, 72, 73, 74, 75, 76, 77, 78, 79, 80, 81, 82, 83, 84, 85, 86, 87, 88, 89, 90, 91, 92, 93, 94, 95, 96, 97, 98, 99, 100, 101, 102, 103, 104, 105, 106, 107, 108 and 65 unique records for HCV incidence (Dumcev K, Ukrainian Institute on Public Health Policy, personal communication)6, 11, 13, 40, 42, 51, 52, 55, 56, 57, 60, 49, 70, 75, 77, 88, 90, 96, 97, 98, 100 , 106, 107, 109, 110, 111, 112, 113, 114, 115, 116, 117, 118, 119, 120, 121, 122, 123, 124, 125, 126, 127, 128, 129, 130, 131, 132, 133, 134, 135, 136, 137, 138, 139, 140, 141, 142, 143, 144, 145, 146, 147, 148, 149 among PWID, producing 64 HIV and 66 HCV estimates (one record presented HCV estimates from two countries).125 Extracted data are shown in the appendix (pp 24–29). 58 (91%) of 64 HIV estimates originated from the European, American, Western Pacific, and South-East Asia WHO regions, with all except one estimate being from high-income or middle-income countries (table). 60 (91%) of 66 HCV estimates originated from the European, American, and Western Pacific WHO regions, with 52 (79%) estimates being from HICs (table). Estimates were available from 27 (14%) of 195 countries150 for HIV and from 24 (12%) countries for HCV, with 31 (16%) countries having data for either HIV or HCV and 20 (10%) countries having estimates for both HIV and HCV (appendix p 12). 41 (64%) of 64 HIV and 42 (64%) of 66 HCV estimates came from single cities within a country, rather than being multi-city or nationwide. Estimates were measured over 1987–2021 for HIV and 1992–2021 for HCV. Less than half of HIV and HCV estimates were initiated in 2010 or later (table) and only eight HIV and five HCV estimates were initiated since 2015. Most estimates came from prospective studies with convenience-based recruitment. For both HIV and HCV, the median risk-of-bias score was 6 (IQR 6–7), indicating moderate risk, with most records being penalised on sample representativeness and adequacy of follow-up criteria (appendix pp 30–33).
Table.
Subgroup analyses
| Number of estimates | Pooled incidence (95% CI) | I2 (%) | p value* | |
|---|---|---|---|---|
| HIV | ||||
| Overall | 64 | 1·7 (1·3–2·3) | 98·4 | .. |
| WHO region | .. | .. | .. | <0·0001 |
| European | 19 | 2·4 (1·3–4·5) | 98·8 | .. |
| Western Pacific | 10 | 1·1 (0·4–2·8) | 97·2 | .. |
| The Americas | 19 | 0·9 (0·6–1·2) | 89·3 | .. |
| Eastern Mediterranean | 4 | 4·1 (1·2–14·0) | 90·6 | .. |
| South-East Asia | 10 | 3·6 (2·1–6·3) | 98·1 | .. |
| African | 1 | 2·6 (1·8–3·7) | NA | .. |
| Mixed regions | 1 | 0·5 (0·3–1·1) | NA | .. |
| World Bank income classification | .. | .. | .. | <0·0001 |
| High-income | 30 | 0·9 (0·6–1·3) | 93·9 | .. |
| Low-income and middle-income† | 34 | 3·2 (2·2–4·6) | 98·5 | .. |
| Study start year | .. | .. | .. | 0·44 |
| 2010 or later | 29 | 2·0 (1·3–3·0) | 98·6 | .. |
| Before 2010 | 35 | 1·6 (1·0–2·4) | 97·7 | .. |
| Study design | .. | .. | .. | 0·24 |
| Prospective cohort | 42 | 1·4 (0·9–2·2) | 98·0 | .. |
| Retrospective cohort | 6 | 2·0 (1·2–3·3) | 98·2 | .. |
| Randomised trial | 7 | 2·3 (0·5–10·7) | 98·9 | .. |
| Linked repeated cross-sectional study | 4 | 0·9 (0·2–3·8) | 98·5 | .. |
| Cross-sectional study | 5 | 4·1 (1·7–10·0) | 97·6 | .. |
| Sampling strategy | .. | .. | .. | 0·015 |
| Convenience | 36 | 1·4 (1·0–2·0) | 97·8 | .. |
| Peer referral | 12 | 4·5 (2·3–8·8) | 98·7 | .. |
| Mixed | 10 | 1·7 (0·8–3·4) | 95·5 | .. |
| Targeted | 5 | 1·1 (0·7–1·7) | 67·1 | .. |
| Time–location | 1 | 1·5 (0·7–3·4) | NA | .. |
| Recruitment sources | .. | .. | .. | 0·015 |
| Community | 25 | 1·2 (0·8–1·8) | 97·6 | .. |
| Medical | 13 | 1·6 (0·9–2·8) | 96·4 | .. |
| Network | 12 | 4·5 (2·3–8·8) | 98·7 | .. |
| Mixed | 14 | 1·7 (0·9–3·2) | 97·2 | .. |
| Method of incidence estimation | .. | .. | .. | 0·046 |
| Repeated follow-up and re-testing | 59 | 1·6 (1·1–2·2) | 98·4 | .. |
| Assay for recent infection | 5 | 4·1 (1·7–10·0) | 97·6 | .. |
| Study duration years | .. | .. | .. | <0·0001 |
| ≤2·0 | 25 | 2·9 (1·9–4·4) | 96·6 | .. |
| >2·0 and ≤3·0 | 13 | 3·5 (1·9–6·5) | 98·7 | .. |
| >3·0 and ≤5·3 | 10 | 1·3 (0·7–2·6) | 90·2 | .. |
| >5·3 | 16 | 0·6 (0·4–0·9) | 94·9 | .. |
| Mean duration of follow-up per person, years | .. | .. | .. | <0·0001 |
| ≤1·0 | 17 | 4·6 (2·4–9·0) | 98·8 | .. |
| >1·0 and ≤1·4 | 13 | 1·7 (1·1–2·6) | 88·5 | .. |
| >1·4 and ≤2·5 | 14 | 1·0 (0·4–2·4) | 98·3 | .. |
| >2·5 | 14 | 0·7 (0·4–1·2) | 98·0 | .. |
| Not available | 1 | 3·4 (2·2–5·0) | NA | .. |
| NA‡ | 5 | 4·1 (1·7–10·0) | 97·6 | .. |
| Risk of bias score | .. | .. | .. | 0·92 |
| Low | 28 | 1·7 (1·0–2·7) | 98·3 | .. |
| Moderate or high | 36 | 1·7 (1·1–2·6) | 98·5 | .. |
| ≥80% of participants injected within the past year | .. | .. | .. | 0·071 |
| Yes | 46 | 1·6 (1·1–2·5) | 98·5 | .. |
| No | 8 | 0·9 (0·4–2·3) | 96·5 | .. |
| Not available | 10 | 2·8 (1·7–4·4) | 97·5 | .. |
| Median or mean age years | .. | .. | .. | 0·036 |
| ≤28·0 | 13 | 2·0 (0·8–5·0) | 98·9 | .. |
| >28·0 and ≤31·7 | 9 | 4·5 (2·1–9·8) | 99·0 | .. |
| >31·7 and ≤35·1 | 11 | 1·5 (0·6–3·7) | 99·0 | .. |
| >35·1 | 11 | 1·5 (0·7–3·1) | 87·0 | .. |
| Not available | 20 | 1·1 (0·7–1·7) | 96·1 | .. |
| Median or mean duration of injection years | .. | .. | .. | 0·22 |
| ≤5·0 | 5 | 3·6 (1·4–9·4) | 98·4 | .. |
| >5·0 and ≤6·9 | 3 | 0·7 (0·2–2·1) | 43·0 | .. |
| >6·9 and ≤9·2 | 4 | 1·2 (0·2–8·1) | 99·1 | .. |
| >9·2 | 4 | 3·4 (0·6–20·5) | 99·5 | .. |
| Not available | 48 | 1·6 (1·2–2·2) | 97·3 | .. |
| HIV antibody prevalence | .. | .. | .. | <0·0001 |
| ≤5·3% | 11 | 0·7 (0·2–2·0) | 94·9 | .. |
| >5·3% and ≤11·4% | 11 | 1·1 (0·6–1·9) | 92·0 | .. |
| >11·4% and ≤25·8% | 10 | 1·6 (0·9–2·9) | 97·3 | .. |
| >25·8% | 11 | 7·9 (4·4–14·0) | 97·9 | .. |
| Not available | 21 | 1·6 (1·0–2·5) | 98·1 | .. |
| HCV | ||||
| Overall | 66 | 12·1 (10·0–14·6) | 97·2 | .. |
| WHO region | .. | .. | .. | 0·82 |
| European | 26 | 12·8 (9·5–17·2) | 97·6 | .. |
| Western Pacific | 13 | 12·2 (7·6–19·5) | 94·6 | .. |
| The Americas | 21 | 12·1 (8·4–17·5) | 97·7 | .. |
| Eastern Mediterranean | 2 | 16·1 (3·3–78·4) | 96·9 | .. |
| South-East Asia | 4 | 6·4 (2·1–19·3) | 96·9 | .. |
| World Bank income classification | .. | .. | .. | 0·44 |
| High-income | 52 | 12·1 (9·7–15·0) | 97·4 | .. |
| Low-income and middle-income† | 14 | 12·6 (8·7–18·1) | 95·0 | .. |
| Study start year | .. | .. | .. | 0·87 |
| 2010 or later | 18 | 12·6 (9·8–16·2) | 93·9 | .. |
| Before 2010 | 48 | 12·2 (9·5–15·7) | 97·7 | .. |
| Study design | .. | .. | .. | 0·056 |
| Prospective cohort | 49 | 13·1 (10·4–16·7) | 97·3 | .. |
| Retrospective cohort | 5 | 5·6 (2·9–10·7) | 95·8 | .. |
| Randomised trial | 5 | 11·3 (6·9–18·5) | 82·7 | .. |
| Linked repeated cross-sectional study | 3 | 19·3 (9·2–40·4) | 94·2 | .. |
| Cross-sectional study | 4 | 8·8 (5·7–13·7) | 84·8 | .. |
| Sampling strategy | .. | .. | .. | <0·0001 |
| Convenience | 40 | 9·8 (7·4–13·0) | 97·8 | .. |
| Peer referral | 8 | 14·9 (10·5–21·1) | 90·7 | .. |
| Mixed | 12 | 16·9 (11·1–25·6) | 95·1 | .. |
| Targeted | 4 | 16·9 (10·6–26·9) | 86·7 | .. |
| Time–location | 1 | 35·5 (28·3–44·6) | NA | .. |
| Probability | 1 | 11·6 (9·8–13·8) | NA | .. |
| Recruitment sources | .. | .. | .. | 0·012 |
| Community | 22 | 16·6 (13·0–21·3) | 95·2 | .. |
| Medical | 15 | 7·6 (5·0–11·4) | 96·5 | .. |
| Network | 8 | 14·9 (10·5–21·1) | 90·7 | .. |
| Mixed | 21 | 11·6 (7·5–17·9) | 97·7 | .. |
| Method of incidence estimation | .. | .. | .. | 0·17 |
| Repeated follow-up and re-testing | 62 | 12·4 (10·1–15·1) | 97·3 | .. |
| Assay for recent infection | 4 | 8·8 (5·7–13·7) | 84·8 | .. |
| Study duration years | .. | .. | .. | 0·15 |
| <3 | 16 | 16·8 (12·1–23·2) | 92·7 | .. |
| ≥3 and <4 | 14 | 13·2 (8·6–20·4) | 94·9 | .. |
| ≥4 and <7 | 17 | 11·4 (8·6–15·2) | 92·1 | .. |
| ≥7 | 19 | 9·7 (6·5–14·2) | 98·8 | .. |
| Mean duration of follow-up per person years | .. | .. | .. | <0·0001 |
| ≤1·0 | 14 | 23·7 (18·1–31·1) | 90·4 | .. |
| >1·0 and ≤1·3 | 17 | 20·3 (15·8–26·0) | 92·5 | .. |
| >1·3 and ≤2·1 | 14 | 9·0 (6·5–12·7) | 96·9 | .. |
| >2·1 | 15 | 5·2 (3·0–9·3) | 98·0 | .. |
| Not available | 2 | 8·1 (6·2–10·6) | 23·7 | .. |
| NA‡ | 4 | 8·8 (5·7–13·7) | 84·8 | .. |
| Risk of bias score | .. | .. | .. | 0·21 |
| Low | 25 | 10·2 (6·9–14·9) | 97·7 | .. |
| Moderate or high | 41 | 13·5 (10·8–16·8) | 96·8 | .. |
| ≥80% of participants injected within the past year | .. | .. | .. | 0·0060 |
| Yes | 47 | 14·4 (11·4–18·1) | 97·1 | .. |
| No | 5 | 9·6 (7·2–12·7) | 55·3 | .. |
| Not available | 14 | 7·7 (5·5–10·9) | 95·8 | .. |
| Median or mean age years | .. | .. | .. | 0·0003 |
| ≤25·0 | 13 | 22·6 (16·6–30·6) | 95·5 | .. |
| >25·0 and ≤29·2 | 10 | 14·7 (10·1–21·3) | 95·2 | .. |
| >29·2 and ≤34·8 | 11 | 14·0 (11·4–17·2) | 85·7 | .. |
| >34·8 | 13 | 7·8 (5·2–11·8) | 95·6 | .. |
| Not available | 19 | 8·3 (4·9–14·1) | 97·3 | .. |
| Median or mean duration of injection years | .. | .. | .. | <0·0001 |
| ≤2·7 | 5 | 38·2 (24·4–59·6) | 86·4 | .. |
| >2·7 and ≤5·9 | 5 | 20·3 (17·0–24·1) | 66·8 | .. |
| >5·9 and ≤7·9 | 5 | 7·0 (3·8–12·9) | 90·5 | .. |
| >7·9 | 5 | 16·8 (11·8–23·9) | 93·8 | .. |
| Not available | 46 | 10·6 (8·3–13·7) | 97·3 | .. |
| HCV antibody prevalence | .. | .. | .. | 0·67 |
| ≤46·6% | 12 | 14·0 (8·3–23·5) | 97·0 | .. |
| >46·6% and ≤59·3% | 12 | 12·8 (9·5–17·4) | 93·5 | .. |
| >59·3% and ≤68·3% | 11 | 13·8 (8·7–21·8) | 96·7 | .. |
| >68·3% | 12 | 12·3 (6·2–24·2) | 98·7 | .. |
| Not available | 19 | 9·8 (7·0–13·6) | 95·6 | .. |
Additional subgroup analyses are presented in the appendix (pp 34–35). Continuous variables have been categorised into quartiles. HCV=hepatitis C virus. NA=not applicable.
Based on the Q test for differences between groups.
For both HIV and HCV, only one estimate was based in low-income countries.
Cross-sectional study.
3246 incident cases of HIV were reported during 180 857·2 person-years of follow-up. HIV incidence ranged from 0·1 per 100 person-years in several settings, including Amsterdam (the Netherlands), Vancouver (BC, Canada), and New York (NY, USA), to 31·8 per 100 person-years in a multi-city study in Ukraine (figure 2). Pooled HIV incidence was 1·7 per 100 person-years (95% CI 1·3–2·3), with substantial heterogeneity (I2=98·4%). This pooled estimate varied by several study and participant characteristics (table). HIV incidence was highest in the Eastern Mediterranean and South-East Asia regions, and lowest in the Western Pacific and American regions (table). HICs had a significantly lower HIV incidence than LMICs. HIV incidence was highest where sampling occurred through peer referral and recruitment through participants’ networks compared with other sampling strategies and recruitment sources (table). HIV incidence generally decreased as study duration and mean duration of follow-up per person increased. When stratified by participant characteristics, the incidence of HIV was higher in studies in which the mean or median age of participants and the proportion on opioid agonist treatment were lower and in studies in which HIV prevalence was higher (table; appendix pp 34–35).
Figure 2.
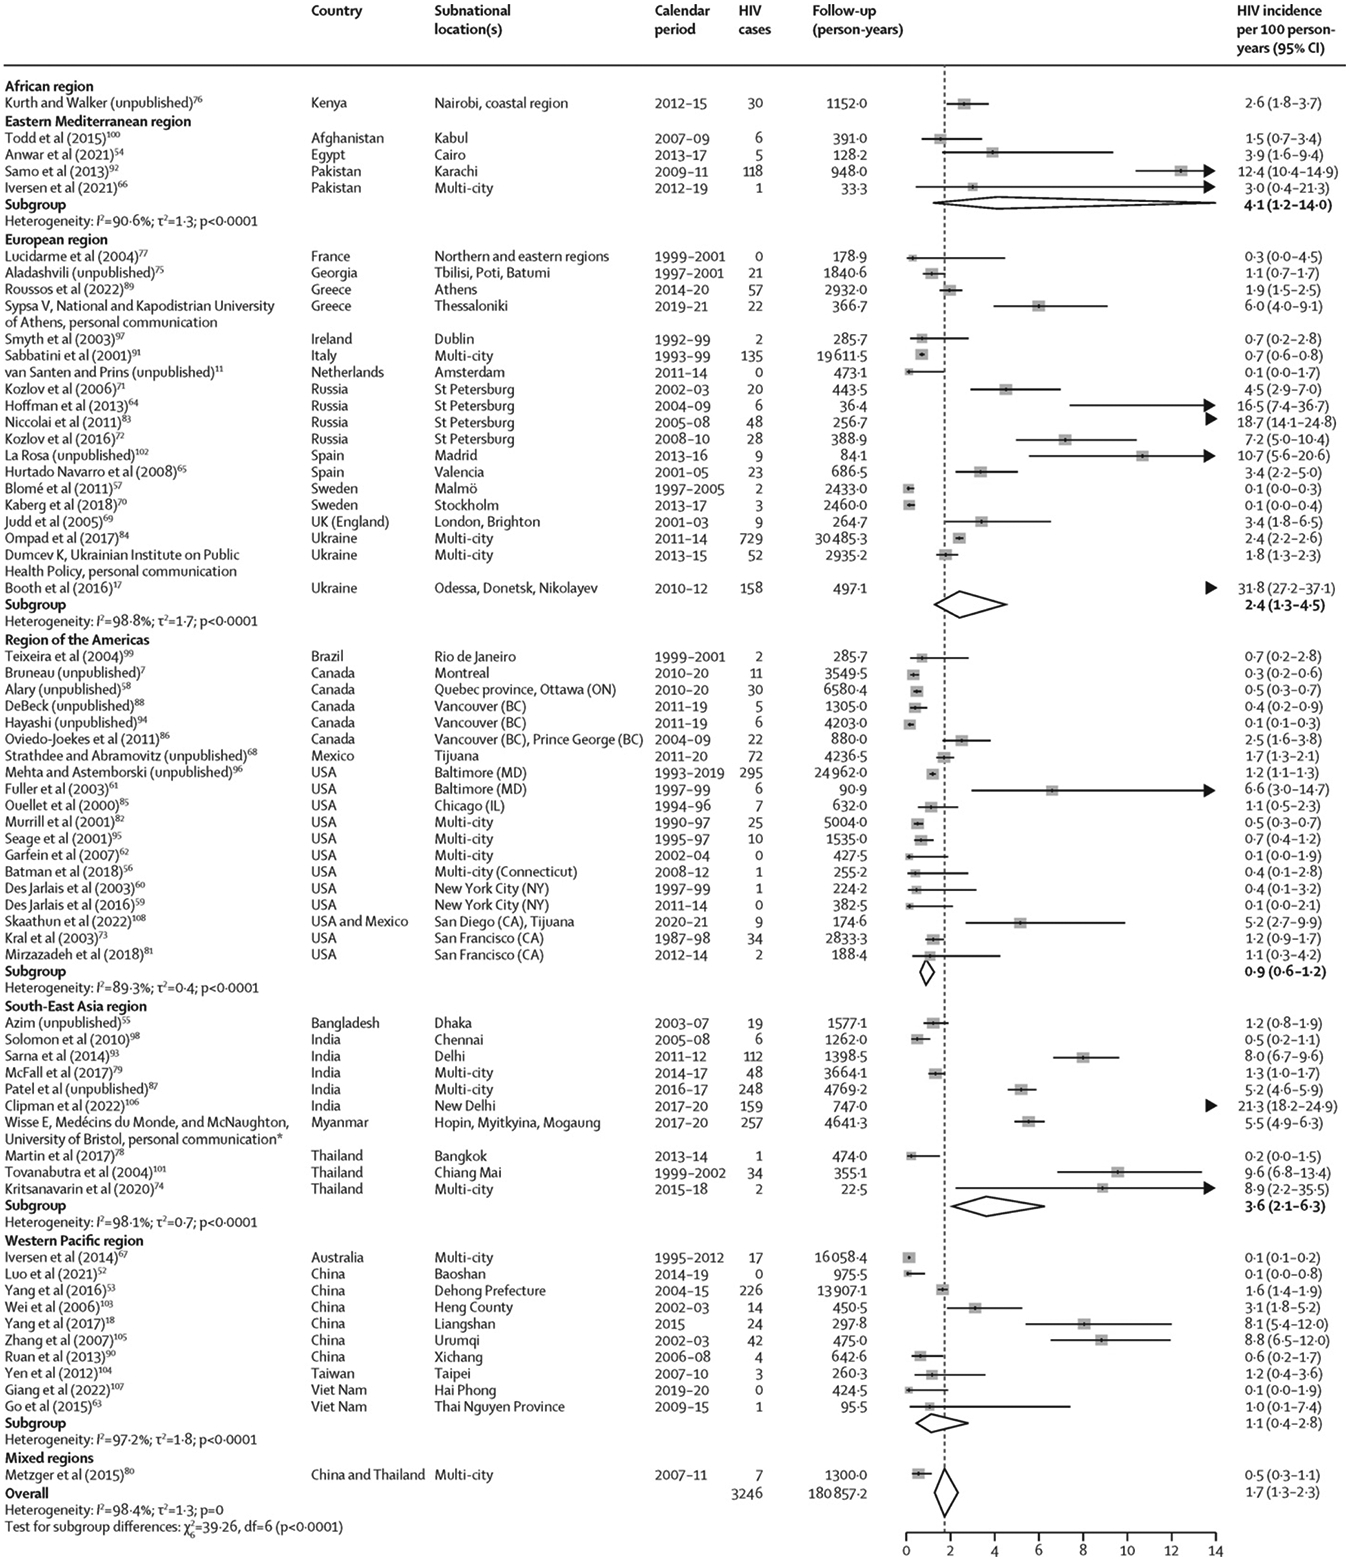
Incidence of HIV among people who inject drugs, stratified by WHO region
For five records (Kral et al, 2003;73 Patel et al, unpublished;87 Niccolai et al, 2011;83 Teixeira et al, 2004;99 and Yang et al, 201718), the follow-up duration was imputed from the number of HIV cases and the incidence rate, potentially leading to differences in the estimated 95% CIs relative to those reported in the original study (appendix pp 24–26). Box sizes are proportional to the weight of the study in relation to the pooled incidence. Arrow heads represent estimates that fall completely outside of the axis range. *This study has now been published.43
4233 incident cases of HCV were reported during 44 841·2 person-years of follow-up (figure 3). HCV incidence ranged from 0·2 per 100 person-years in a multi-city study in the Netherlands to 72·5 per 100 person-years in a study in Madrid (Spain; figure 3). Pooled HCV incidence was 12·1 per 100 person-years (95% CI 10·0–14·6), with substantial heterogeneity (I2=97·2%). Pooled HCV incidence also varied by several characteristics (table; appendix pp 34–35). When stratified by study design, sampling strategy, and recruitment sources, HCV incidence was lowest in retrospective cohorts, studies in which sampling was convenience based, and studies in which recruitment occurred through medical sources, and, conversely, HCV incidence was highest in linked repeated cross-sectional studies, if sampling was based on time–location, and if recruitment occurred in the community. The incidence of HCV decreased as study duration and mean follow-up duration per person increased. When stratified by participant characteristics, HCV incidence was significantly higher in studies in which at least 80% of participants had injected recently and in studies in which participants were younger or had a shorter duration of injection (table). HCV incidence did not vary by WHO region or World Bank income classification (table).
Figure 3.
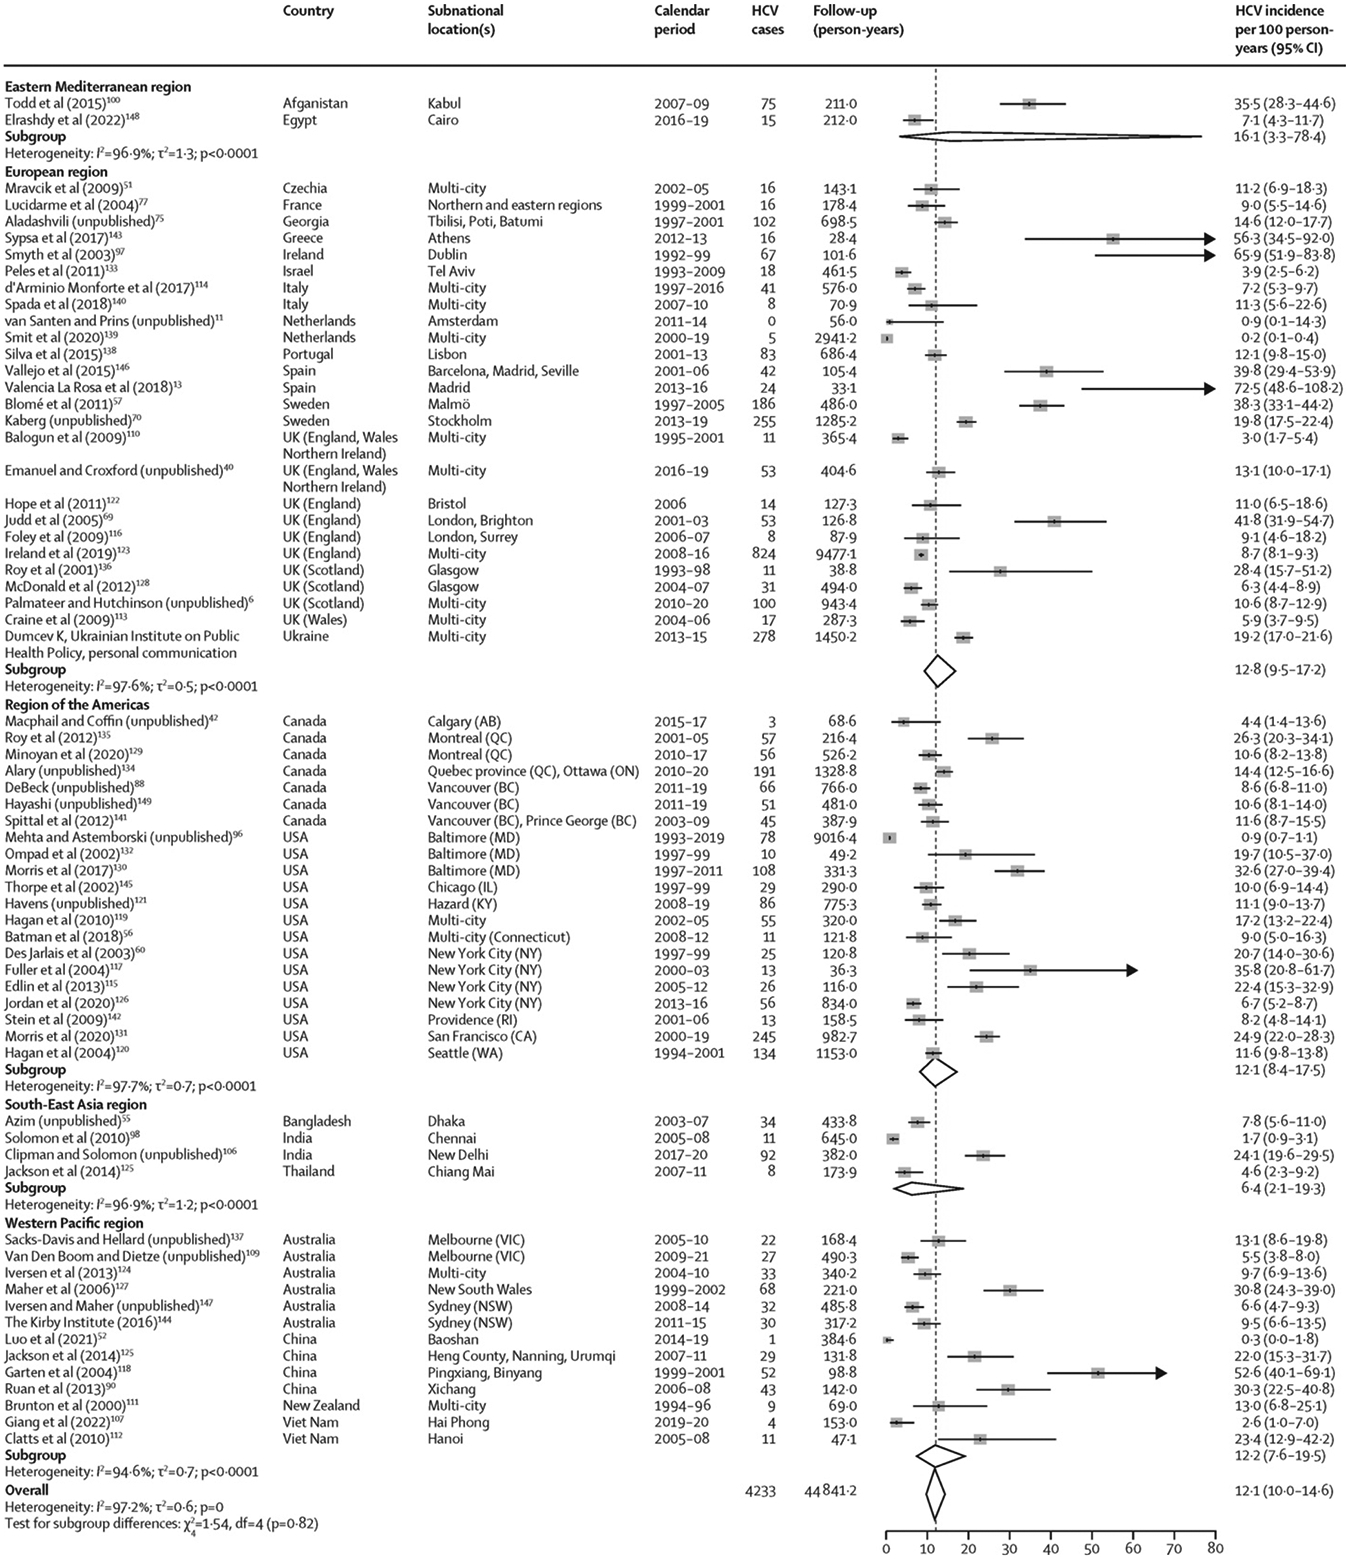
Incidence of HCV among people who inject drugs, stratified by WHO region
For four records (Balogun et al, 2009;110 Emanuel and Croxford, unpublished;40 Hope et al, 2011;122 and Palmateer and Hutchinson, unpublished6), the follow-up duration was imputed from the number of HCV cases and the incidence rate, potentially leading to differences in the estimated 95% CIs relative to those reported in the original study (appendix pp 27–29). Box sizes are proportional to the weight of the study in relation to the pooled incidence. HCV=hepatitis C virus.
Excluding intervention trials or studies that used assays for recent infection in our sensitivity analyses had little effect on pooled HIV and HCV incidence estimates (appendix p 36). Sensitivity analyses pooling estimates with the use of Poisson-normal models instead of the inverse-variance method produced similar results (appendix p 50).
The pooled IRR for HCV versus HIV incidence was 17·4 (95% CI 9·0–33·8; 30 estimates; I2=96·9%; appendix p 14). IRRs varied by WHO region, with the IRR being lowest in South-East Asia (no estimate for the African region).
Results from meta-regression analyses exploring temporal and geographical differences in pooled HIV and HCV incidence rates are shown in the appendix (pp 13, 37). For HIV incidence, results were inconclusive regarding temporal trends, as estimates were imprecise and compatible with a difference in both directions (adjusted IRR per 5-year increase 1·11, 95% CI 0·87–1·41), but LMICs had a significantly higher pooled incidence than HICs (adjusted IRR 2·41, 1·24–4·69). Conversely, for HCV, results were inconclusive regarding a difference between LMICs versus HICs (adjusted IRR 0·67, 0·37–1·23), but we found some evidence for a decrease in incidence with time (adjusted IRR per 5-year increase 0·84, 0·70–1·02), albeit this decrease was not significant. We found no major departures from the normality and linearity assumptions in meta-regression models (appendix pp 15–16) and estimates were robust to sensitivity analyses (appendix pp 40–41).
Overall, young PWID had a greater risk of HIV (RR 1·5, 95% CI 1·2–1·8; 28 estimates;7, 11, 58, 65, 67, 68, 69, 72, 73, 75, 76, 81, 82, 83, 85, 87, 88, 89, 91, 94, 96, 100, 105, 106, 151, 152 I2=66·9%) and HCV (1·5, 1·3–1·8; 33 estimates;6, 11, 40, 42, 51, 69, 70, 75, 77, 88, 96, 97, 100, 106, 109, 113, 119, 121, 124, 127, 128, 131, 134, 136, 137, 146, 147, 149, 152, 153, 154, 155 I2=70·6%) acquisition than older PWID (figure 4; extracted data in appendix pp 43–44). Similarly, women had a greater risk of HIV (RR 1·4, 95% CI 1·1–1·6; 30 estimates;7, 17, 58, 65, 67, 68, 69, 72, 73, 76, 79, 81, 82, 83, 85, 87, 88, 89, 91, 94, 95, 96, 101, 105, 108, 151, 152, 156 I2=55·3%) and HCV (1·2, 1·1–1·3; 35 estimates;6, 40, 51, 57, 69, 70, 77, 88, 96, 97, 109, 111, 113, 119, 120, 121, 124, 127, 128, 131, 134, 135, 136, 137, 141, 145, 146, 147, 149, 152, 153, 154, 155, 156 I2=43·3%) acquisition than men (figure 5; appendix pp 45–46). These associations persisted in subgroup analyses (appendix pp 47–48). We found insufficient evidence of publication bias in any of the four RR measures (appendix p 17). Absolute pooled HIV and HCV incidences stratified by age and sex or gender are presented in the appendix (p 49).
Figure 4.
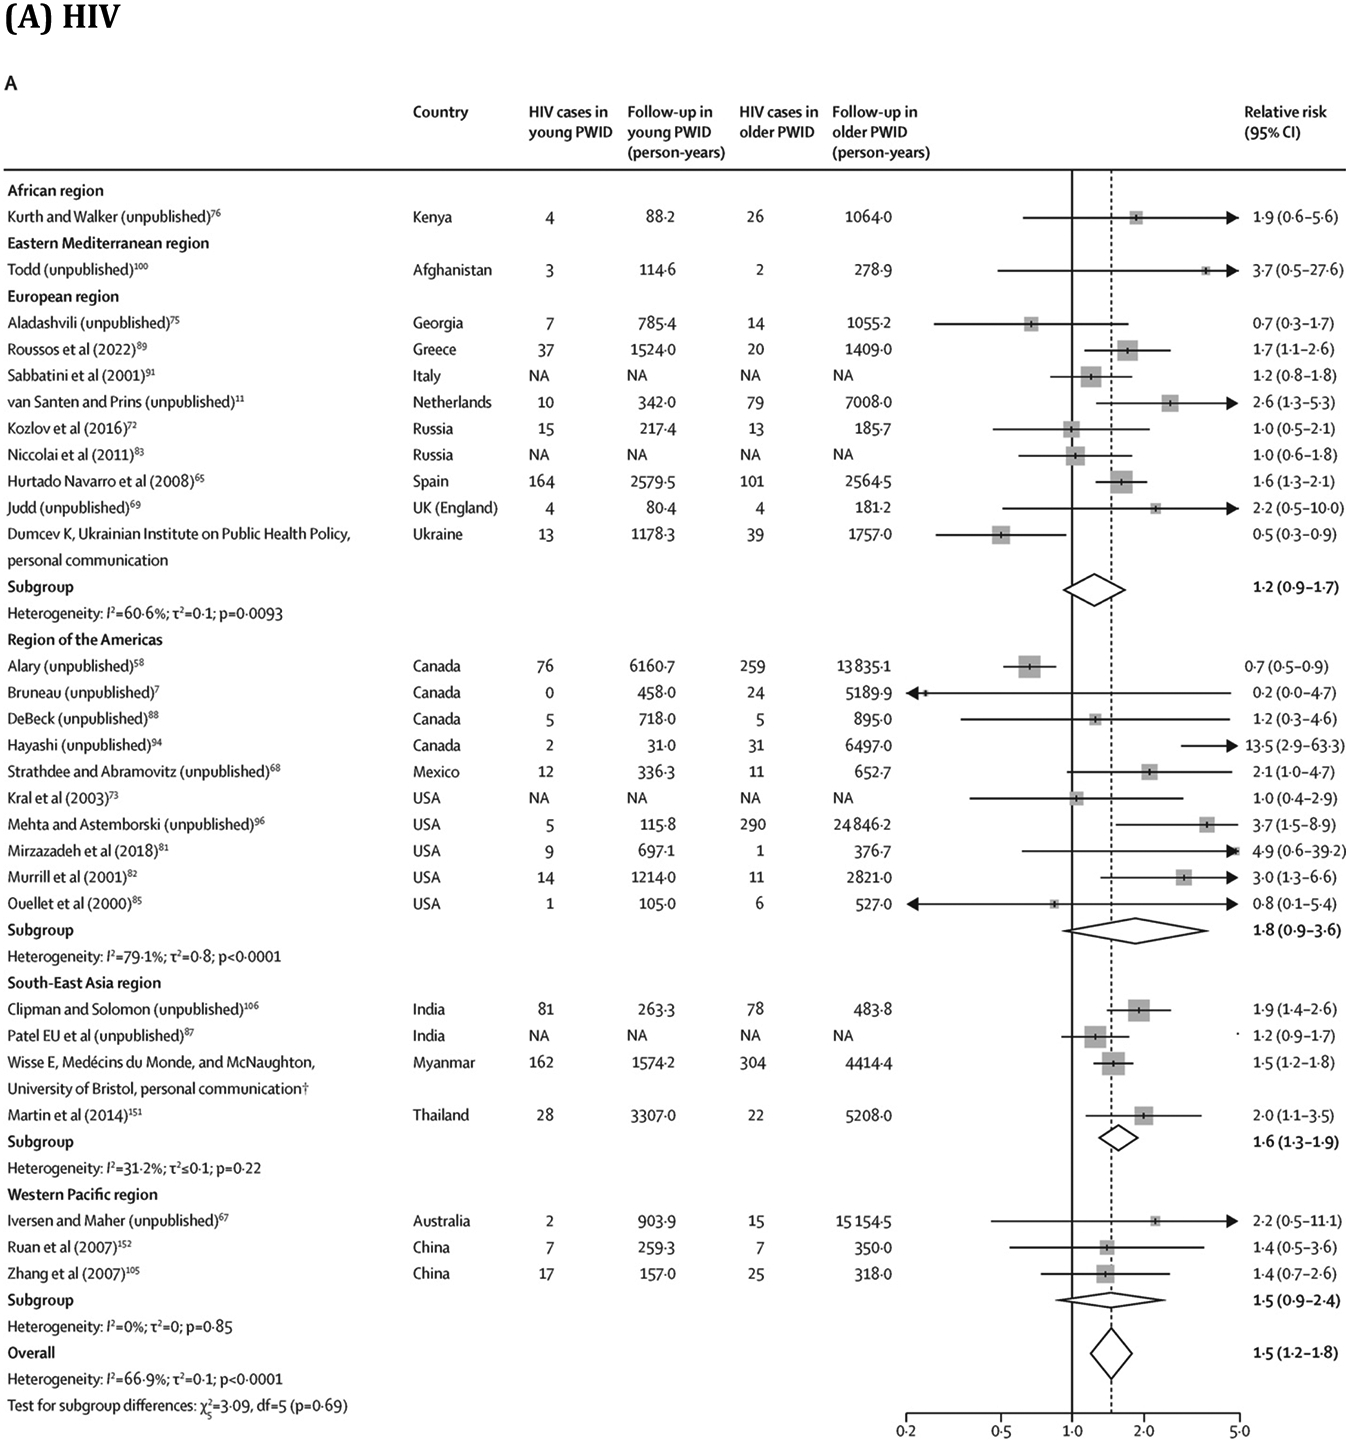
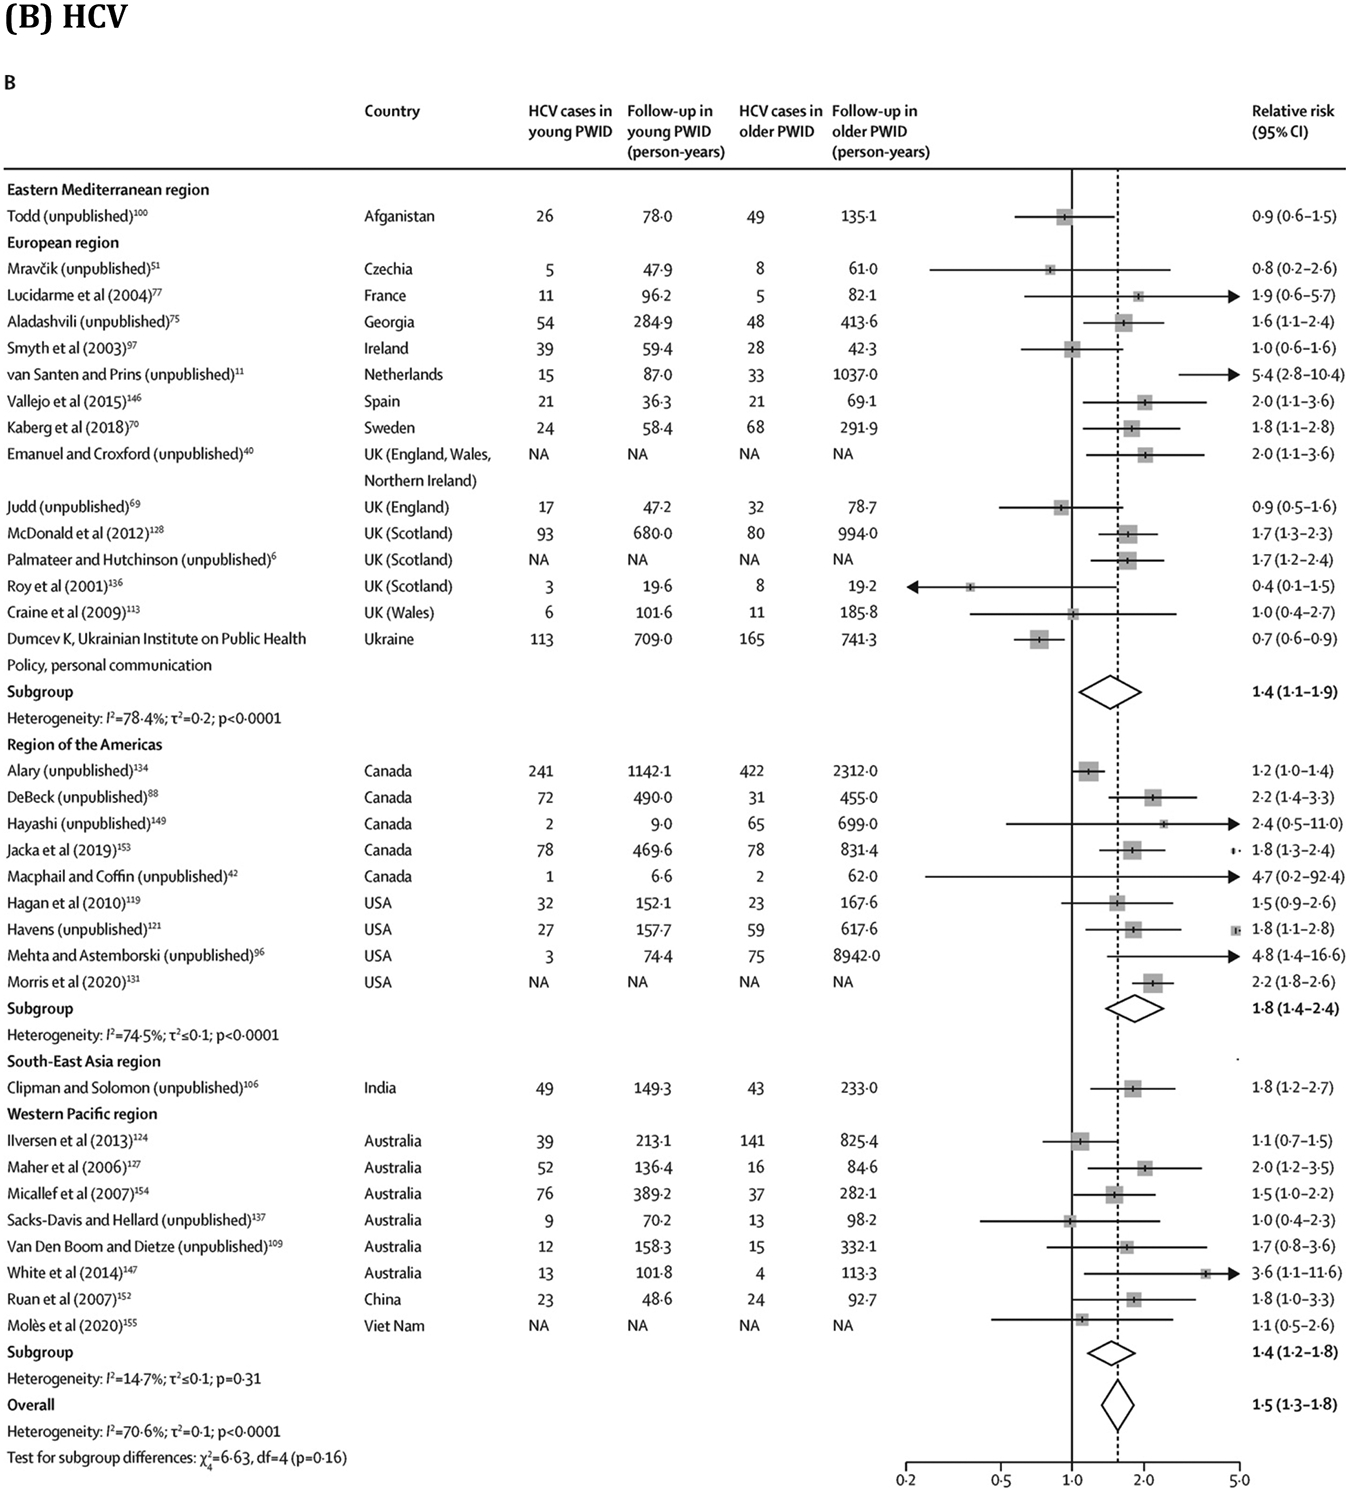
Association between age (young* vs older PWID) and risk of HIV and HCV acquisition
Box sizes are proportional to the weight of the study in relation to the pooled incidence. HCV=hepatitis C virus. NA=not available. PWID=people who inject drugs. *Threshold varied between studies: median value was 25 years (IQR 25–28; range 24–34) for HIV and 25 years (24–25; 20–31) for HCV. †This study has now been published.43
Figure 5.
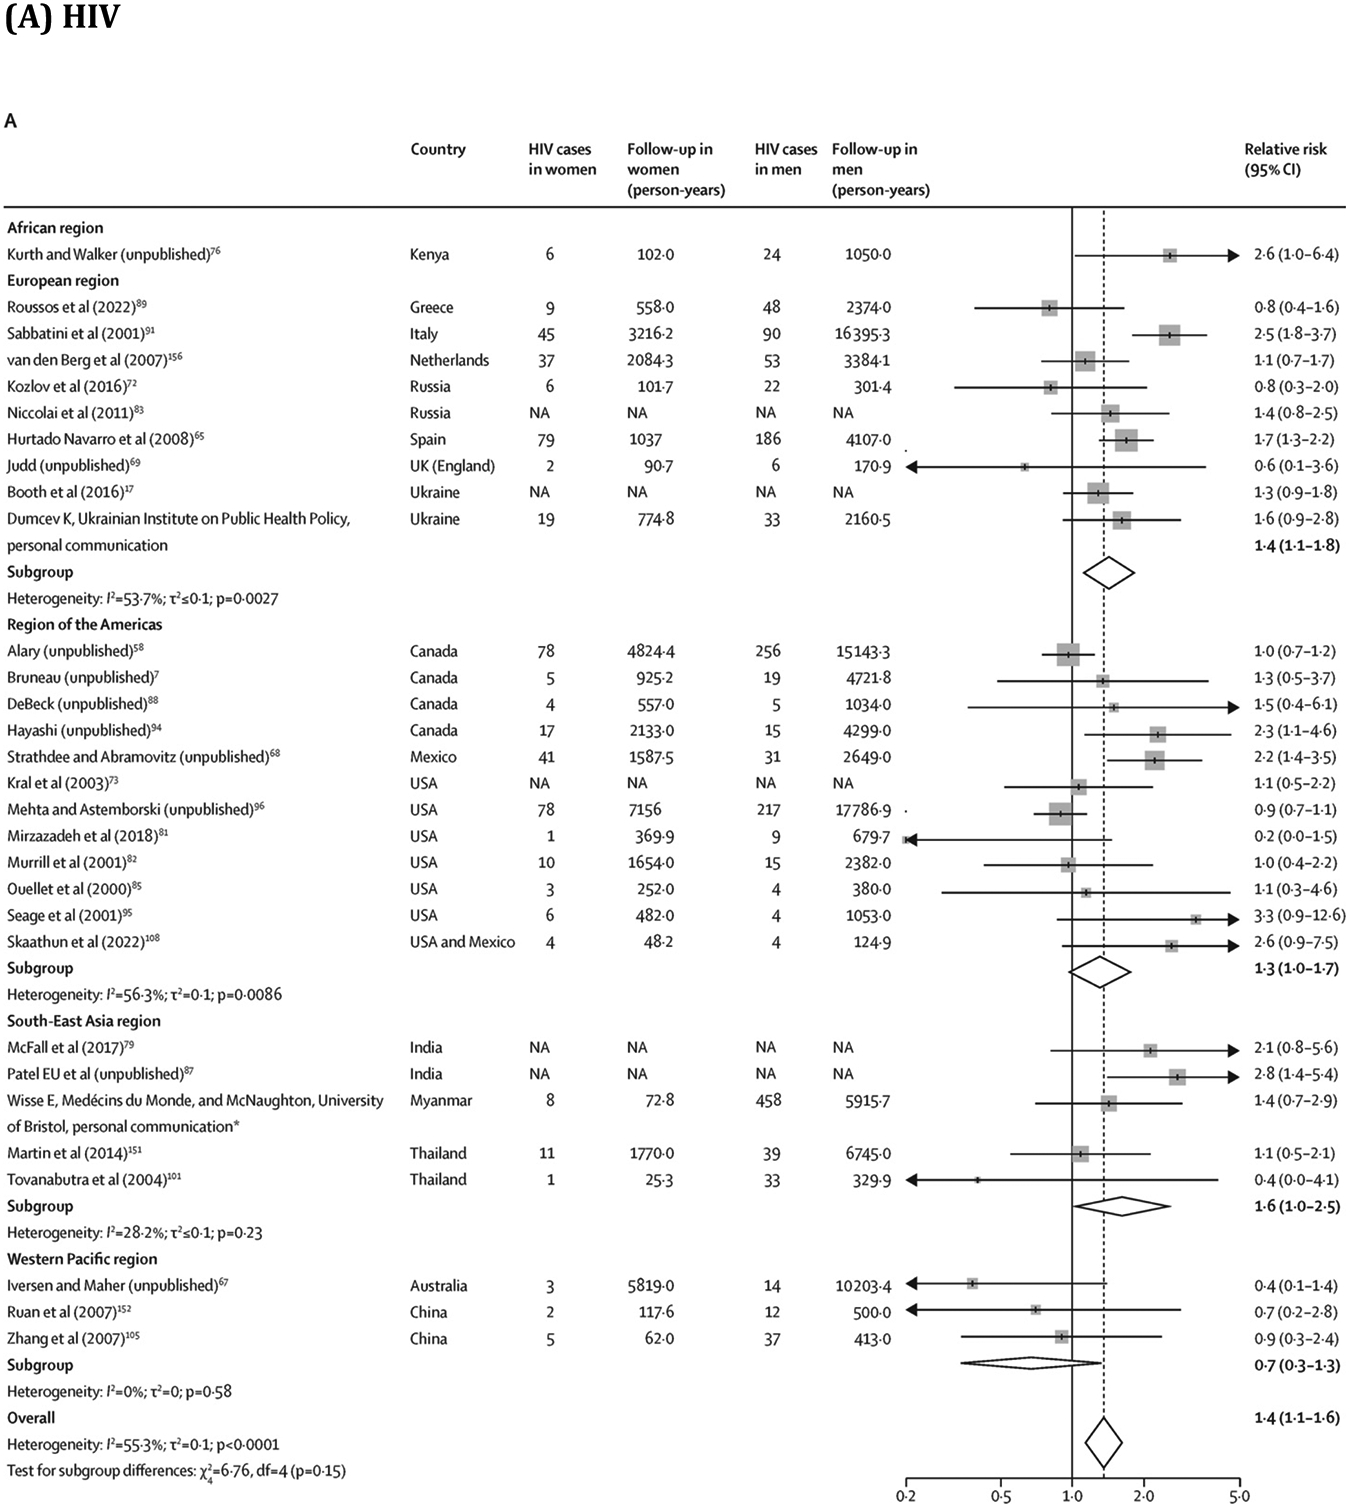
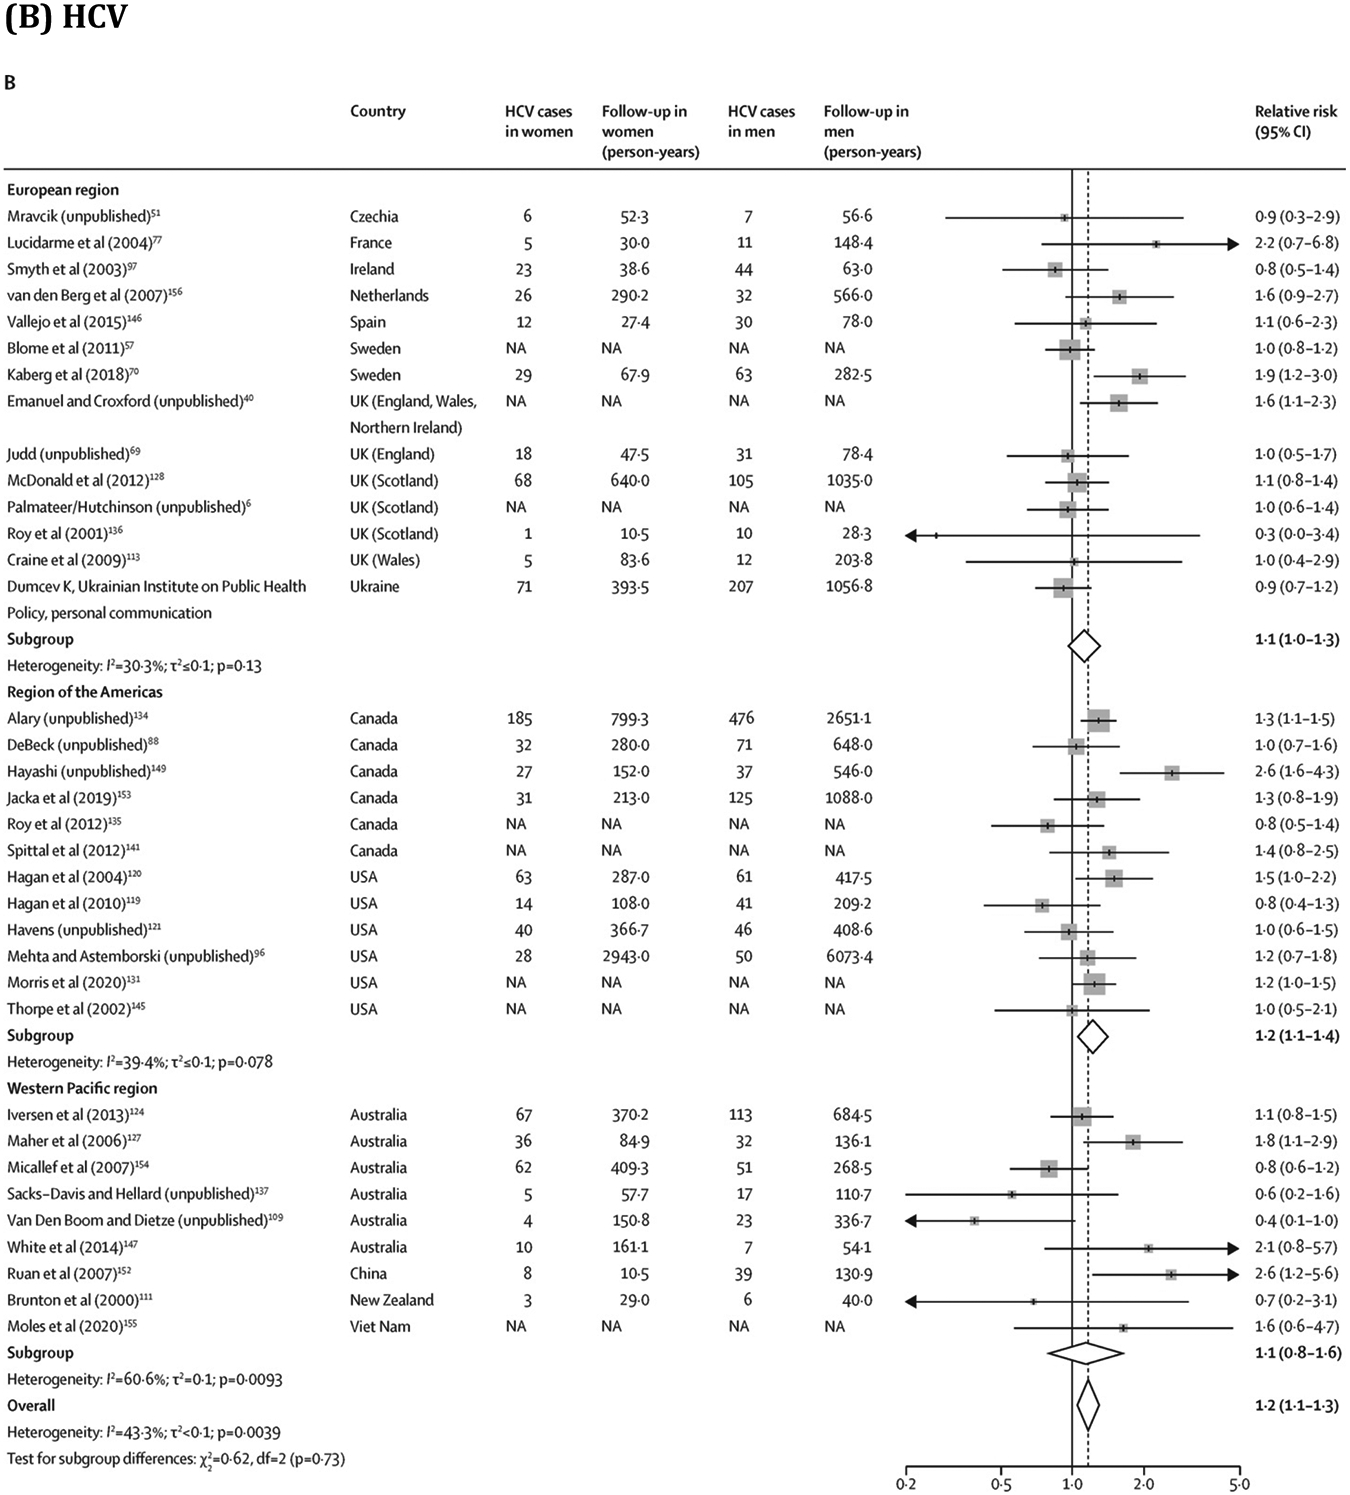
Association between sex or gender and risk of HIV and HCV acquisition in PWID
Box sizes are proportional to the weight of the study in relation to the pooled incidence. HCV=hepatitis C virus. NA=not available. PWID=people who inject drugs. *This study has now been published.43
DISCUSSION
In this systematic review and meta-analysis of HIV and HCV incidence among PWID, studies were highly variable in their methodology and participant characteristics and there were substantial data gaps. HIV incidence ranged from 0·1 per 100 person-years to 31·8 per 100 person-years and HCV incidence ranged from 0·2 per 100 person-years to 72·5 per 100 person-years, with pooled estimates of 1·7 per 100 person-years for HIV and 12·1 per 100 person-years for HCV. Based on a subset of studies with both HIV and HCV incidence data, the incidence of HCV was on average 17·4 times greater than the incidence of HIV. Young PWID had on average a 1·5-times greater risk of HIV and HCV acquisition than older PWID, and women had a 1·4-times greater risk of HIV and a 1·2-times greater risk of HCV than men.
We identified several sources of heterogeneity across pooled HIV and HCV incidence estimates. For example, HIV and HCV incidence estimates were higher in studies in which recruitment occurred through participants’ networks rather than through medical sources, possibly reflecting differences in risk profiles. Studies in which participants had a longer mean duration of follow-up had lower HIV and HCV incidence rates, which could reflect reductions in risk behaviour following repeated risk-reduction messaging or better retention of PWID with lower risk of acquisition. Higher HIV and HCV incidence rates were identified if most participants injected recently (albeit non-significant for HIV) and higher HIV incidence if a lower proportion of the sample received opioid agonist treatment. Our review also illustrates the scarcity of HIV and HCV incidence data among PWID globally, which were available in only 14% and 12% of countries, respectively. Moreover, less than half of estimates were from 2010 onwards and only eight (HIV) and five (HCV) estimates were initiated since 2015. We found a considerable geographical skew in the availability of estimates, with few from middle-income countries for HCV, and only one HIV and HCV incidence estimate from low-income countries. Two-thirds of estimates were from single cities and so might not be nationally representative.
This scarce and heterogeneous body of evidence made the evaluation of geographical and temporal differences in HIV and HCV incidence challenging. In several settings, HIV incidence has been shown to have decreased as a result of the implementation of combined prevention and care.11, 157 However, globally, temporal trend data were scarce and our assessment of the change in incidence with time was mainly based on comparing estimates from different studies. We found no evidence of a decline in HIV incidence with time, which could be due to methodological reasons such as little comparability between estimates, preferential measurement in settings with extreme incidence (very low or very high), and inclusion of estimates averaged over long time periods. However, at least in LMICs, our finding might also reflect a real absence of decline in HIV incidence because of insufficient access to harm reduction interventions.158 Supporting this theory, we found HIV incidence to be more than two-times higher in LMICs than in HICs. Conversely, there was no evidence that HCV incidence varied between geographical regions, and only some weak evidence that HCV incidence declined with time. As with HIV, the scale-up in HCV treatment in many HICs since 2015 might have led to lower HCV incidence in HICs compared with LMICs. However, data from this period are scarce, which might be why we found no difference by LMICs versus HICs.
Estimates of HIV and HCV incidence with time among PWID are important for monitoring the trajectory of epidemics, adapting the public health response, and assessing progress towards achieving the UNAIDS and WHO 2030 targets.4, 159 Although direct methods for measuring HIV and HCV incidence rates are preferred, these methods are not without limitations (eg, high cost and participant attrition) and, in some countries, might not be feasible to implement on a national scale.4 In these contexts, indirect methods of estimating incidence from prevalence data or by the use of mathematical modelling could be preferred.4, 5 Alternatively, our group has shown that changes in chronic HCV prevalence can track changes in HCV incidence when resulting from increases in HCV treatment, and so HCV prevalence could also be reliably used instead.4 Regardless of the options chosen, different data and indicators should be triangulated, including measuring HCV reinfection to keep track of HCV incidence, to adequately monitor these epidemics among PWID.
We found the risks of HIV and HCV acquisition to vary by age and sex or gender. Although the magnitude of the associations varied in stratified analyses, HIV and HCV acquisition risks were consistently greater among young PWID compared with older PWID. These findings align with previous studies that report greater injecting and sexual risk behaviours among young compared with older PWID.20, 21, 22, 23 By contrast, the overall greater risks of HIV and HCV acquisition among women versus men were more modest compared with the age analysis, particularly for HCV. The pooled estimates for sex or gender differences in risk could mask regional differences. We found the magnitude of the association for HIV risk between women and men to be highest in the African and South-East Asia regions and lowest in the Western Pacific region, consistent with findings from a 2019 systematic review focused on prevalence.32 For HCV, there were no estimates for the African and South-East Asia regions to enable a similar comparison. The only other systematic review to have explored the association between gender or sex and incident HCV infection found a 1·36-times greater risk of acquisition in women than in men,35 slightly higher than our pooled estimate, possibly due to methodological differences (eg, including prison samples and adjusted estimates).
Our efforts to include unpublished data increased the number and recency of estimates for all outcomes. Encouragingly, we found no evidence of a difference between published and unpublished estimates. Owing to a preponderance of studies that were more than 10 years old and based in HICs, one of the most important limitations of our review is that our findings provide an incomplete depiction of current global HIV and HCV incidence rates among PWID. The inclusion of data derived through intervention trials and studies that used assays for recent infection might have biased pooled estimates, although results remained largely consistent when these estimates were excluded. Additionally, our assessment of temporal and geographical differences in HIV and HCV incidence rates was exploratory due to sparse data from most global settings, including trend data. Finally, sparse data bias in some studies, owing to a small number of events, small sample sizes, or both, can carry over to the pooled estimates, leading to potentially biased summary estimates and 95% CIs.160, 161 However, pooled estimates were similar in sensitivity analyses that used meta-analytical approaches that are likely to be more suited for sparse data, which is reassuring.
In conclusion, this systematic review and meta-analysis produced, to our knowledge, the first pooled estimates of HIV and HCV incidence rates derived by use of direct methods among PWID. The low availability of incidence estimates globally, particularly in LMICs, suggests that intensified efforts are urgently needed to keep track of the HIV and HCV epidemics among PWID in these countries. Because PWID often face stigma and discrimination, there is a risk that they will be overlooked in elimination efforts if national data on HIV and HCV incidence remain absent. This gap needs to be addressed to achieve the global goals of eliminating HIV and HCV. Given the higher risks of HIV and HCV acquisition in young versus older PWID and in women versus men who inject drugs, age-appropriate and gender-appropriate prevention and harm reduction measures are also urgently needed to serve these subgroups at high risk. Factors other than age and sex or gender are also likely to be influencing HIV and HCV acquisition risks (eg, types of drugs injected and the context of injection, identifying as men who have sex with men, and engaging in sex work), and research is also needed to synthesise the role of these other factors to better strengthen HIV and HCV prevention responses. We plan to explore some of these factors in future studies.
Supplementary Material
RESEARCH IN CONTEXT.
Evidence before this study
We did a global systematic review and meta-analysis of studies presenting data on HIV or primary hepatitis C virus (HCV) incidence among people who inject drugs (PWID) published between Jan 1, 2000, and Dec 12, 2022. We searched MEDLINE, Embase, and PsycINFO, without language restrictions, using terms related to HIV infection, HCV infection, injecting drug use, and study designs that could be used to evaluate HIV or HCV incidence (eg, cohort studies and longitudinal studies). We also contacted authors of identified studies to request unpublished or updated data. We included studies that estimated incidence by longitudinally re-testing people at risk of infection or by using assays for recent infection. No previous study has synthesised global incidence data for either of these two outcomes among PWID. One systematic review gathered data on HCV incidence among PWID in Europe from studies published between 2000 and 2012. This review found data from eight countries, where the incidence of HCV was high and variable, ranging from 2·7 per 100 person-years in one UK study to 66 per 100 person-years in an Irish study, with a median of 13 per 100 person-years; no meta-analysis was done. One systematic review and meta-analysis also synthesised data on the association between sex and HCV incidence among PWID and found that the incidence rate ratio for risk of infection in women who inject drugs compared with men who inject drugs was 1·36 (95% CI 1·13–1·64).
Added value of this study
We identified 64 estimates for HIV incidence and 66 for HCV incidence. Estimates ranged from 0·1 per 100 person-years to 31·8 per 100 person-years for HIV (pooled estimate 1·7 per 100 person-years, 95% CI 1·3–2·3) and from 0·2 per 100 person-years to 72·5 per 100 person-years for HCV (pooled estimate 12·1 per 100 person-years, 10·0–14·6). There was considerable heterogeneity across geographical regions and study and participant characteristics, and there were substantial data gaps. Estimates were found for 31 countries overall, which were mostly high-income and middle-income countries for HIV and high-income countries for HCV. Estimates were available from 27 (14%) of 195 countries for HIV and from 24 (12%) countries for HCV, with 20 (10%) countries having estimates for both HIV and HCV. Approximately two-thirds of estimates were limited to small geographies (eg, a single city). Based on a subset of studies with HIV and HCV incidence data, the incidence of HCV was around 17-times higher than the incidence of HIV. Young PWID (generally defined as ≤25 years) had a greater risk of HIV and HCV acquisition than older PWID, and women who inject drugs had a greater risk of HIV and HCV acquisition than men who inject drugs.
Implications of all the available evidence
Our study highlights the sparse empirical data on HIV and HCV incidence available among PWID, particularly in low-income and middle-income countries. Given that HIV and HCV incidence rates are considered key for monitoring the trajectory of these epidemics, evaluating programmatic effect, and tracking progress towards elimination, our findings suggest that intensified efforts are needed to keep track of these outcomes among PWID. Efforts could include the use of indirect methods for estimating HIV and HCV incidence and alternative indicators, such as changes in HCV viraemic prevalence. In most settings, a range of data and indicators might have to be triangulated to adequately monitor the HIV and HCV epidemics among PWID. Given that young PWID and women who inject drugs have a higher risk of both HIV and HCV acquisition, age-appropriate and gender-appropriate prevention measures are urgently needed to reach and engage these higher risk subgroups.
Acknowledgments
PV, HF, and JS acknowledge support from the US NIDA (grant numbers R01 AI147490, R01 DA033679, R01 DA037773, R21 DA046809, and R01 DA047952). PV, ZW, HF, JS, and MH are supported by the National Institute for Health and Care Research (NIHR) Health Protection Research Units in Behavioural Science and Evaluation at the University of Bristol in partnership with the UK Health Security Agency (UKHSA). MH, PV, NEP, and HF also acknowledge support from the NIHR-funded EPIToPe project. KH and KD acknowledge support from the NIDA (U01DA038886). MA acknowledges funding from the Public Health Agency of Canada and the Ministère de la santé et des services sociaux du Québec. AT acknowledges support from the Wellcome Trust. JA reports grant support through the NIH. JB holds the Canada Research Chair in Addiction Medicine and acknowledges support from the CIHR (grant numbers 175233 and 139149), FRQ-S (grant number 52905), and the NIH (R01 grant). NEP acknowledges support from Public Health Scotland. LM is supported by Australian National Health and Medical Research Council Research Fellowship GNT1154839. Acknowledgments for the members of the HIV and HCV Incidence Review Collaborative Group are provided in the appendix (p 53).
Declaration of interests
AA acknowledges support through postdoctoral fellowships from the Canadian Institute of Health Research (CIHR), Fonds de recherche du Québec – Santé (FRQ-S), and the Canadian Network on Hepatitis C. MA reports grants paid to his institution from the Public Health Agency of Canada and grants from the Ministère de la santé et des services sociaux du Québec, during the conduct of this study, and grants from the CIHR, outside the submitted work. JA reports grants from the National Institutes of Health (NIH), during the conduct of this study. JB reports consulting fees from Gilead Sciences, AbbVie, and Cepheid; payment or honoraria from Gilead Sciences for an educational event; and receipt of equipment, materials, drugs, medical writing, gifts, or other services from Gilead Sciences, as part of an NIH R01 grant, outside of the submitted work. CSC reports grants from Gilead Sciences, Janssen Pharmaceuticals, and GSK (paid to the University of Calgary); consulting fees from Roche Pharmaceuticals, Gilead Sciences, Janssen Pharmaceuticals (paid to the University of Calgary, on behalf of the Canadian Hepatitis B Virus [HBV] Network), and Altimmune (paid to the University of Calgary, on behalf of the Canadian HBV Network); payment or honoraria for lectures, presentations, speakers bureaus, manuscript writing, or educational events through Gilead Sciences; and patents planned, issued, or pending (PCT/CA2021/050234; international patent application title: polypeptides directed against viral infection and uses thereof; compositions and methodologies for the detection and treatment of HBV infection; USA; 62/982,474; Feb 28, 2020). SC reports payments for chairing or presenting at a European HIV Testing Week webinar from the Centre of Excellence for Health, Immunity and Infections, outside the submitted work. KH reports financial support for the present manuscript paid to her institution from the US National Institute of Drug Abuse (NIDA; Vancouver Drug Users Study: the impacts of evolving drug use patterns on HIV/AIDS; U01DA038886), the Michael Smith Foundation for Health Research Scholar Award, and St Paul’s Foundation, and grants or contracts from the CIHR and the William and Ada Isabelle Steel Fund through Simon Fraser University (paid to institution) and the British Columbia Centre on Substance Use (paid to KH). GM reports grants or contracts from AbbVie (clinic support, advisory board, and speaker fees), the Canadian Network on Hepatitis C (research support), Coverdale (clinic support), Gilead Sciences (clinic support and speakers fees), International Network on Health and Hepatitis in Substance Users (INHSU; speaker fees), and TD Bank (clinic support); payment or honoraria from the Canadian Association for the Study of the Liver (scientific planning committee for web-based learning, conjoint with AbbVie; payment to institution), AbbVie (speakers fees for educational podcasts and brochure; payment partly to institution and partly to GM), Gilead Sciences (speaker fees; payment partly to institution and partly to GM), and ECHO plus (honorarium for speaking); and support for attending meetings or travel, or both, from INHSU and being on the advisory board for AbbVie and Gilead. JGW reports grants and contracts from Gilead Sciences and FIND, The Global Alliance for Diagnostics. MH reports having a leadership or fiduciary role as trustee of the Society for the Study of Addiction. All other authors declare no competing interests. Declaration of interests for the members of the HIV and HCV Incidence Review Collaborative Group are provided in the appendix (p 52).
Funding
Canadian Institutes of Health Research, Fonds de recherche du Québec–Santé, Canadian Network on Hepatitis C, UK National Institute for Health and Care Research, and WHO.
Data sharing
Extracted data sheets will be shared with researchers who provide a methodologically sound proposal approved by AA and PV. Proposals should be directed to adelina.artenie@bristol.ac.uk and peter.vickerman@bristol.ac.uk; requesters will need to sign a data access agreement. Data can be made available starting with the date of publication of this Article and up to 5 years thereafter.
REFERENCES
- 1.Degenhardt L, Peacock A, Colledge S, et al. Global prevalence of injecting drug use and sociodemographic characteristics and prevalence of HIV, HBV, and HCV in people who inject drugs: a multistage systematic review. Lancet Glob Health 2017; 5: e1192–207. [DOI] [PMC free article] [PubMed] [Google Scholar]
- 2.UNAIDS. 90–90–90 An ambitious treatment target to help end the AIDS epidemic. Geneva: UNAIDS, 2014. https://www.unaids.org/sites/default/files/media_asset/90-90-90_en.pdf(accessed May 5, 2020). [Google Scholar]
- 3.WHO. Global health sector strategy on viral hepatitis 2016–2021. Geneva, Switzerland: World Health Organization, 2016. http://apps.who.int/iris/bitstream/10665/246177/1/WHO-HIV-2016.06-eng.pdf?ua=1 (accessed Aug 5, 2017). [Google Scholar]
- 4.Artenie A, Luhmann N, Lim AG, et al. Methods and indicators to validate country reductions in incidence of hepatitis C virus infection to elimination levels set by WHO. Lancet Gastroenterol Hepatol 2022; 7: 353–66. [DOI] [PMC free article] [PubMed] [Google Scholar]
- 5.Mitchell KM, Maheu-Giroux M, Dimitrov D, et al. How can progress toward ending the human immunodeficiency virus epidemic in the United States be monitored? Clin Infect Dis 2022; 75: 163–69. [DOI] [PMC free article] [PubMed] [Google Scholar]
- 6.Palmateer NE, Taylor A, Goldberg DJ, et al. Rapid decline in HCV incidence among people who inject drugs associated with national scale-up in coverage of a combination of harm reduction interventions. PLoS One 2014; 9: e104515. [DOI] [PMC free article] [PubMed] [Google Scholar]
- 7.Bruneau J, Daniel M, Abrahamowicz M, Zang G, Lamothe F, Vincelette J. Trends in human immunodeficiency virus incidence and risk behavior among injection drug users in Montreal, Canada: a 16-year longitudinal study. Am J Epidemiol 2011; 173: 1049–58. [DOI] [PMC free article] [PubMed] [Google Scholar]
- 8.Huang YF, Yang JY, Nelson KE, et al. Changes in HIV incidence among people who inject drugs in Taiwan following introduction of a harm reduction program: a study of two cohorts. PLoS Med 2014; 11: e1001625. [DOI] [PMC free article] [PubMed] [Google Scholar]
- 9.Mehta SH, Astemborski J, Kirk GD, et al. Changes in blood-borne infection risk among injection drug users. J Infect Dis 2011; 203: 587–94. [DOI] [PMC free article] [PubMed] [Google Scholar]
- 10.Grebely J, Lima VD, Marshall BD, et al. Declining incidence of hepatitis C virus infection among people who inject drugs in a Canadian setting, 1996–2012. PLoS One 2014; 9: e97726. [DOI] [PMC free article] [PubMed] [Google Scholar]
- 11.van Santen DK, Boyd A, Matser A, et al. The effect of needle and syringe program and opioid agonist therapy on the risk of HIV, hepatitis B and C virus infection for people who inject drugs in Amsterdam, the Netherlands: findings from an emulated target trial. Addiction 2021; 116: 3115–26. [DOI] [PubMed] [Google Scholar]
- 12.White B, Dore GJ, Lloyd AR, Rawlinson WD, Maher L. Opioid substitution therapy protects against hepatitis C virus acquisition in people who inject drugs: the HITS-c study. Med J Aust 2014; 201: 326–29. [DOI] [PubMed] [Google Scholar]
- 13.Valencia La Rosa J, Ryan P, Alvaro-Meca A, et al. HCV seroconversion in a cohort of people who use drugs followed in a mobile harm reduction unit in Madrid: breaking barriers for HCV elimination. PLoS One 2018; 13: e0204795. [DOI] [PMC free article] [PubMed] [Google Scholar]
- 14.Des Jarlais DC, Sypsa V, Feelemyer J, et al. HIV outbreaks among people who inject drugs in Europe, North America, and Israel. Lancet HIV 2020; 7: e434–42. [DOI] [PMC free article] [PubMed] [Google Scholar]
- 15.Lim AG, Walker JG, Mafirakureva N, et al. Effects and cost of different strategies to eliminate hepatitis C virus transmission in Pakistan: a modelling analysis. Lancet Glob Health 2020; 8: e440–50. [DOI] [PMC free article] [PubMed] [Google Scholar]
- 16.Clipman SJ, Mehta SH, Srikrishnan AK, et al. Explosive HIV and HCV epidemics driven by network viremia among PWID. Top Antivir Med 2020; 28: 50. [Google Scholar]
- 17.Booth RE, Davis JM, Dvoryak S, et al. HIV incidence among people who inject drugs (PWIDs) in Ukraine: results from a clustered randomised trial. Lancet HIV 2016; 3: e482–89. [DOI] [PMC free article] [PubMed] [Google Scholar]
- 18.Yang H, Su L, Ye L, et al. Incidence rates of HIV-1 epidemics among 4 high risk groups in Sichuan province during 2011–2015. Zhonghua Liu Xing Bing Xue Za Zhi 2017; 38: 1649–54 (in Chinese). [DOI] [PubMed] [Google Scholar]
- 19.Trickey A, Fraser H, Lim AG, et al. The contribution of injection drug use to hepatitis C virus transmission globally, regionally, and at country level: a modelling study. Lancet Gastroenterol Hepatol 2019; 4: 435–44. [DOI] [PMC free article] [PubMed] [Google Scholar]
- 20.Broz D, Pham H, Spiller M, et al. Prevalence of HIV infection and risk behaviors among younger and older injecting drug users in the United States, 2009. AIDS Behav 2014; 18 (suppl 3): 284–96. [DOI] [PMC free article] [PubMed] [Google Scholar]
- 21.Horyniak D, Dietze P, Degenhardt L, et al. The relationship between age and risky injecting behaviours among a sample of Australian people who inject drugs. Drug Alcohol Depend 2013; 132: 541–46. [DOI] [PubMed] [Google Scholar]
- 22.Ganapathi L, McFall AM, Srikrishnan AK, et al. Young people who inject drugs in India have high HIV incidence and behavioural risk: a cross-sectional study. J Int AIDS Soc 2019; 22: e25287. [DOI] [PMC free article] [PubMed] [Google Scholar]
- 23.Booth RE, Kwiatkowski CF, Mikulich-Gilbertson SK, et al. Predictors of risky needle use following interventions with injection drug users in Ukraine. Drug Alcohol Depend 2006; 82 (suppl 1): S49–55. [DOI] [PubMed] [Google Scholar]
- 24.Krug A, Hildebrand M, Sun N. “We don’t need services. We have no problems”: exploring the experiences of young people who inject drugs in accessing harm reduction services. J Int AIDS Soc 2015; 18 (suppl 1): 19442. [DOI] [PMC free article] [PubMed] [Google Scholar]
- 25.WHO. Technical brief: HIV and young people who inject drugs. Geneva, Switzerland: World Health Organization, 2015. https://www.who.int/publications/i/item/WHO-HIV-2015.10-eng (accessed Oct 20, 2022). [Google Scholar]
- 26.De P, Cox J, Boivin JF, Platt RW, Jolly AM. The importance of social networks in their association to drug equipment sharing among injection drug users: a review. Addiction. 2007; 102: 1730–39. [DOI] [PubMed] [Google Scholar]
- 27.Tassiopoulos K, Bernstein J, Bernstein E. Age and sharing of needle injection equipment in a cohort of Massachusetts injection drug users: an observational study. Addict Sci Clin Pract 2013; 8: 20. [DOI] [PMC free article] [PubMed] [Google Scholar]
- 28.Horyniak D, Dietze P, Degenhardt L, et al. Age-related differences in patterns of criminal activity among a large sample of polydrug injectors in Australia. J Subst Use 2016; 21: 48–56. [Google Scholar]
- 29.Evans JL, Hahn JA, Page-Shafer K, et al. Gender differences in sexual and injection risk behavior among active young injection drug users in San Francisco (the UFO Study). J Urban Health 2003; 80: 137–46. [DOI] [PMC free article] [PubMed] [Google Scholar]
- 30.Tracy D, Hahn JA, Fuller Lewis C, et al. Higher risk of incident hepatitis C virus among young women who inject drugs compared with young men in association with sexual relationships: a prospective analysis from the UFO Study cohort. BMJ Open 2014; 4: e004988. [DOI] [PMC free article] [PubMed] [Google Scholar]
- 31.Iversen J, Page K, Madden A, Maher L. HIV, HCV, and health-related harms among women who inject drugs: implications for prevention and treatment. J Acquir Immune Defic Syndr 2015; 69 (suppl 2): S176–81. [DOI] [PMC free article] [PubMed] [Google Scholar]
- 32.Leung J, Peacock A, Colledge S, et al. A global meta-analysis of the prevalence of HIV, hepatitis C virus, and hepatitis B virus among people who inject drugs—do gender-based differences vary by country-level indicators? J Infect Dis 2019; 220: 78–90. [DOI] [PMC free article] [PubMed] [Google Scholar]
- 33.Hagan H, Des Jarlais DC, Stern R, et al. HCV synthesis project: preliminary analyses of HCV prevalence in relation to age and duration of injection. Int J Drug Policy 2007; 18: 341–51. [DOI] [PubMed] [Google Scholar]
- 34.Des Jarlais DC, Feelemyer JP, Modi SN, Arasteh K, Hagan H. Are females who inject drugs at higher risk for HIV infection than males who inject drugs: an international systematic review of high seroprevalence areas. Drug Alcohol Depend 2012; 124: 95–107. [DOI] [PMC free article] [PubMed] [Google Scholar]
- 35.Esmaeili A, Mirzazadeh A, Carter GM, et al. Higher incidence of HCV in females compared to males who inject drugs: a systematic review and meta-analysis. J Viral Hepat 2017; 24: 117–27 [DOI] [PMC free article] [PubMed] [Google Scholar]
- 36.Moher D, Liberati A, Tetzlaff J, Altman DG. Preferred reporting items for systematic reviews and meta-analyses: the PRISMA statement. Ann Intern Med 2009; 151: 264–69, W64. [DOI] [PubMed] [Google Scholar]
- 37.Arum C, Fraser H, Artenie AA, et al. Homelessness, unstable housing, and risk of HIV and hepatitis C virus acquisition among people who inject drugs: a systematic review and meta-analysis. Lancet Publ Health 2021; 6: e309–23. [DOI] [PMC free article] [PubMed] [Google Scholar]
- 38.Stone J, Fraser H, Lim AG, et al. Incarceration history and risk of HIV and hepatitis C virus acquisition among people who inject drugs: a systematic review and meta-analysis. Lancet Infect Dis 2018; 18: 1397–409. [DOI] [PMC free article] [PubMed] [Google Scholar]
- 39.Smolen-Dzirba J, Wasik TJ. Current and future assays for identifying recent HIV infections at the population level. Med Sci Monit 2011; 17: RA124–33. [DOI] [PMC free article] [PubMed] [Google Scholar]
- 40.Hope VD, Harris RJ, Vickerman P, et al. A comparison of two biological markers of recent hepatitis C virus (HCV) infection: implications for the monitoring of interventions and strategies to reduce HCV transmission among people who inject drugs. Euro Surveill 2018; 23: 1700635. [DOI] [PMC free article] [PubMed] [Google Scholar]
- 41.Page-Shafer K, Pappalardo BL, Tobler LH, et al. Testing strategy to identify cases of acute hepatitis C virus (HCV) infection and to project HCV incidence rates. J Clin Microbiol 2008; 46: 499–506. [DOI] [PMC free article] [PubMed] [Google Scholar]
- 42.Zietara F, Crotty P, Houghton M, Tyrrell L, Coffin CS, Macphail G. Sociodemographic risk factors for hepatitis C virus infection in a prospective cohort study of 257 persons in Canada who inject drugs. Can Liver J 2020; 3: 276–85. [DOI] [PMC free article] [PubMed] [Google Scholar]
- 43.McNaughton AL, Stone J, Oo KT, et al. Trends in HIV incidence following scale-up of harm reduction interventions among people who inject drugs in Kachin, Myanmar, 2008–2020: analysis of a retrospective cohort dataset. Lancet Reg Health West Pac 2023; published online Feb 27. 10.1016/j.lanwpc.2023.100718. [DOI] [PMC free article] [PubMed] [Google Scholar]
- 44.Wells GSB, O’Connell D, Peterson J, et al. The Newcastle–Ottawa Scale (NOS) for assessing the quality of nonrandomised studies in meta-analyses. http://www.ohri.ca/programs/clinical_epidemiology/oxford.asp (accessed April 5, 2017).
- 45.Rothman KJ, Greenland S, Lash TL. Modern epidemiology, 3rd edn. Philadelphia, PA: Lippincott, Williams & Wilkins, 2008. [Google Scholar]
- 46.Higgins JP, Thompson SG. Quantifying heterogeneity in a metaanalysis. Stat Med 2002; 21: 1539–58. [DOI] [PubMed] [Google Scholar]
- 47.Viechtbauer W Chapter 11: Model checking in meta-analysis. In: Fitzmaurice G, ed. Handbook of meta-analysis. 1st edn. London, UK: Chapman & Hall, 2021. [Google Scholar]
- 48.Stijnen T, Hamza TH, Ozdemir P. Random effects meta-analysis of event outcome in the framework of the generalized linear mixed model with applications in sparse data. Stat Med 2010; 29: 3046–67. [DOI] [PubMed] [Google Scholar]
- 49.Harrer M, Cuijpers P, Furukawa TA, Ebert DD. Doing meta-analysis with R: a hands-on guide. 1st edn. Boca Raton, FL and London: Chapman & Hall/CRC Press, 2021. [Google Scholar]
- 50.Viechtbauer W Conducting meta-analyses in R with the metafor package. J Stat Softw 2010; 36: 1–48. [Google Scholar]
- 51.Mravčık V, Petrošová B, Zábranský T, Rehák V, Coufalová M Výskyt VHC u injekčních uživatelů drog – Výsledky studie prováděné mezi klienty nízkoprahových zařízení v letech 2002–2005 [HCV seroprevalence in people who inject drugs—Results of the study in 2002–2005 among clients of low-threshold facilities]. Praha: Úřad vlády České Republiky. (In Czech)––––https://www.drogy-info.cz/data/obj_files/33174/881/Vyskyt_VHC_u_injekcnich_uzivatelu_drog_ePub.pdf (accessed March 10, 2022). [Google Scholar]
- 52.Luo W, Li L, Kong JP, Wu ZY. A five-year prospective cohort study of HIV/HCV infections in community-related injecting drug users. Zhonghua Liu Xing Bing Xue Za Zhi. 2021; 42: 1067–70 (in Chinese). [DOI] [PubMed] [Google Scholar]
- 53.Yang YC, Jin ZY, Tang RH, et al. A cohort study of HIV incidence among injecting drug users in Dehong Prefecture, Yunnan Province. Zhonghua Yu Fang Yi Xue Za Zhi 2016; 50: 966–70 (in Chinese). [DOI] [PubMed] [Google Scholar]
- 54.Anwar S, El Kharrat E, Bakhoum A, El-Sadr WM, Harris TG. Association of sociodemographic factors with needle sharing and number of sex partners among people who inject drugs in Egypt. Glob Public Health 2022; 17: 1689–98. [DOI] [PubMed] [Google Scholar]
- 55.Azim T, Chowdhury EI, Reza M, et al. Prevalence of infections, HIV risk behaviors and factors associated with HIV infection among male injecting drug users attending a needle/syringe exchange program in Dhaka, Bangladesh. Subst Use Misuse 2008; 43: 2124–44. [DOI] [PubMed] [Google Scholar]
- 56.Batman SH, Grau LE, Heimer R. Incidence of hepatitis C virus and other bloodborne virus infections among nonurban residents of Fairfield and New Haven counties, Connecticut who inject drugs. Conn Med 2018; 82: 133–37. [PMC free article] [PubMed] [Google Scholar]
- 57.Blomé MA, Björkman P, Flamholc L, Jacobsson H, Molnegren V, Widell A. Minimal transmission of HIV despite persistently high transmission of hepatitis C virus in a Swedish needle exchange program. J Viral Hepat 2011; 18: 831–39. [DOI] [PubMed] [Google Scholar]
- 58.Blouin K, Leclerc P, Morissette C, et al. Sex work as an emerging risk factor for human immunodeficiency virus seroconversion among people who inject drugs in the SurvUDI Network. Sex Transm Dis 2016; 43: 648–55. [DOI] [PubMed] [Google Scholar]
- 59.Des Jarlais DC, Arasteh K, McKnight C, et al. Consistent estimates of very low HIV incidence among people who inject drugs: New York City, 2005–2014. Am J Public Health 2016; 106: 503–08. [DOI] [PMC free article] [PubMed] [Google Scholar]
- 60.Des Jarlais DC, Diaz T, Perlis T, et al. Variability in the incidence of human immunodeficiency virus, hepatitis B virus, and hepatitis C virus infection among young injecting drug users in New York City. Am J Epidemiol 2003; 157: 467–71. [DOI] [PubMed] [Google Scholar]
- 61.Fuller CM, Vlahov D, Latkin CA, Ompad DC, Celentano DD, Strathdee SA. Social circumstances of initiation of injection drug use and early shooting gallery attendance: implications for HIV intervention among adolescent and young adult injection drug users. J Acquir Immune Defic Syndr 2003; 32: 86–93. [DOI] [PubMed] [Google Scholar]
- 62.Garfein RS, Golub ET, Greenberg AE, et al. A peer-education intervention to reduce injection risk behaviors for HIV and hepatitis C virus infection in young injection drug users. AIDS 2007; 21: 1923–32. [DOI] [PubMed] [Google Scholar]
- 63.Go VF, Frangakis C, Minh NL, et al. Efficacy of a multi-level intervention to reduce injecting and sexual risk behaviors among HIV-infected people who inject drugs in Vietnam: a four-arm randomized controlled trial. PLoS One 2015; 10: e0125909. [DOI] [PMC free article] [PubMed] [Google Scholar]
- 64.Hoffman IF, Latkin CA, Kukhareva PV, et al. A peer-educator network HIV prevention intervention among injection drug users: results of a randomized controlled trial in St. Petersburg, Russia. AIDS Behav 2013; 17: 2510–20. [DOI] [PMC free article] [PubMed] [Google Scholar]
- 65.Hurtado Navarro I, Alastrue I, Del Amo J, et al. Differences between women and men in serial HIV prevalence and incidence trends. Eur J Epidemiol 2008; 23: 435–40. [DOI] [PubMed] [Google Scholar]
- 66.Iversen J, Ul HQS, Zafar M, Busz M, Maher L. HIV incidence and associated risk factors in female spouses of men who inject drugs in Pakistan. Harm Reduct J 2021; 18: 51. [DOI] [PMC free article] [PubMed] [Google Scholar]
- 67.Iversen J, Wand H, Topp L, Kaldor J, Maher L. Extremely low and sustained HIV incidence among people who inject drugs in a setting of harm reduction. AIDS 2014; 28: 275–78. [DOI] [PubMed] [Google Scholar]
- 68.Jain JP, Abramovitz D, Strathdee SA, et al. Sex work as a mediator between female gender and incident HIV infection among people who inject drugs in Tijuana, Mexico. AIDS Behav 2020; 24: 2720–31. [DOI] [PMC free article] [PubMed] [Google Scholar]
- 69.Judd A, Hickman M, Jones S, et al. Incidence of hepatitis C virus and HIV among new injecting drug users in London: prospective cohort study. BMJ 2005; 330: 24–25. [DOI] [PMC free article] [PubMed] [Google Scholar]
- 70.Kaberg M, Naver G, Hammarberg A, Weiland O. Incidence and spontaneous clearance of hepatitis C virus (HCV) in people who inject drugs at the Stockholm needle exchange—importance for HCV elimination. J Viral Hepat 2018; 25: 1452–61. [DOI] [PubMed] [Google Scholar]
- 71.Kozlov AP, Shaboltas AV, Toussova OV, et al. HIV incidence and factors associated with HIV acquisition among injection drug users in St Petersburg, Russia. AIDS 2006; 20: 901–06. [DOI] [PubMed] [Google Scholar]
- 72.Kozlov AP, Skochilov RV, Toussova OV, et al. HIV incidence and behavioral correlates of HIV acquisition in a cohort of injection drug users in St Petersburg, Russia. Medicine (Baltimore) 2016; 95: e5238. [DOI] [PMC free article] [PubMed] [Google Scholar]
- 73.Kral AH, Lorvick J, Gee L, et al. Trends in human immunodeficiency virus seroincidence among street-recruited injection drug users in San Francisco, 1987–1998. Am J Epidemiol 2003; 157: 915–22. [DOI] [PubMed] [Google Scholar]
- 74.Kritsanavarin U, Bloss E, Manopaiboon C, et al. HIV incidence among men who have sex with men and transgender women in four provinces in Thailand. Int J STD AIDS 2020; 31: 1154–60. [DOI] [PMC free article] [PubMed] [Google Scholar]
- 75.Kuniholm MH, Aladashvili M, Del Rio C, et al. Not all injection drug users are created equal: heterogeneity of HIV, hepatitis C virus, and hepatitis B virus infection in Georgia. Subst Use Misuse 2008; 43: 1424–37. [DOI] [PMC free article] [PubMed] [Google Scholar]
- 76.Kurth AE, Cleland CM, Des Jarlais DC, et al. HIV prevalence, estimated incidence, and risk behaviors among people who inject drugs in Kenya. J Acquir Immune Defic Syndr 2015; 70: 420–27. [DOI] [PMC free article] [PubMed] [Google Scholar]
- 77.Lucidarme D, Bruandet A, Ilef D, et al. Incidence and risk factors of HCV and HIV infections in a cohort of intravenous drug users in the north and east of France. Epidemiol Infect 2004; 132: 699–708. [DOI] [PMC free article] [PubMed] [Google Scholar]
- 78.Martin M, Vanichseni S, Suntharasamai P, et al. Factors associated with the uptake of and adherence to HIV pre-exposure prophylaxis in people who have injected drugs: an observational, open-label extension of the Bangkok Tenofovir Study. Lancet HIV 2017; 4: e59–66. [DOI] [PMC free article] [PubMed] [Google Scholar]
- 79.McFall AM, Solomon SS, Lucas GM, et al. High HIV incidence among PWID and MSM attending integrated care centers in India. Top Antivir Med 2017; 25 (suppl 1): 375s. [Google Scholar]
- 80.Metzger DS, Donnell D, Celentano DD, et al. Expanding substance use treatment options for HIV prevention with buprenorphinenaloxone: HIV Prevention Trials Network 058. J Acquir Immune Defic Syndr 2015; 68: 554–61. [DOI] [PMC free article] [PubMed] [Google Scholar]
- 81.Mirzazadeh A, Evans JL, Hahn JA, et al. Continued transmission of HIV among young adults who inject drugs in San Francisco: still room for improvement. AIDS Behav 2018; 22: 1383–94. [DOI] [PMC free article] [PubMed] [Google Scholar]
- 82.Murrill CS, Prevots DR, Miller MS, et al. Incidence of HIV among injection drug users entering drug treatment programs in four US cities. J Urban Health 2001; 78: 152–61. [DOI] [PMC free article] [PubMed] [Google Scholar]
- 83.Niccolai LM, Verevochkin SV, Toussova OV, et al. Estimates of HIV incidence among drug users in St. Petersburg, Russia: continued growth of a rapidly expanding epidemic. Eur J Public Health 2011; 21: 613–19. [DOI] [PMC free article] [PubMed] [Google Scholar]
- 84.Ompad DC, Wang J, Dumchev K, et al. Patterns of harm reduction service utilization and HIV incidence among people who inject drugs in Ukraine: a two-part latent profile analysis. Int J Drug Policy 2017; 43: 7–15. [DOI] [PMC free article] [PubMed] [Google Scholar]
- 85.Ouellet LJ, Thorpe LE, Huo D, et al. Prevalence and incidence of HIV among out-oftreatment injecting drug users, Chicago 1994–1996. J Acquir Immune Defic Syndr 2000; 25: 443–50. [DOI] [PubMed] [Google Scholar]
- 86.Oviedo-Joekes E, Christian CWM, Pearce ME, Schechter MT, Spittal PM. The Cedar Project: vulnerabilities associated with HIV incidence among young aboriginal people who use injection and non-injection drugs in two Canadian cities. Can J Infect Dis Med Microbiol. 2011; 22: 30B–1B. [Google Scholar]
- 87.Patel EU, Solomon SS, Lucas GM, et al. Temporal change in population-level prevalence of detectable HIV viraemia and its association with HIV incidence in key populations in India: a serial cross-sectional study. Lancet HIV 2021; 8: e544–53. [DOI] [PMC free article] [PubMed] [Google Scholar]
- 88.Puri N, DeBeck K, Feng C, Kerr T, Rieb L, Wood E. Gender influences on hepatitis C incidence among street youth in a Canadian setting. J Adolesc Health 2014; 55: 830–34. [DOI] [PMC free article] [PubMed] [Google Scholar]
- 89.Roussos S, Paraskevis D, Psichogiou M, et al. Ongoing HIV transmission following a large outbreak among people who inject drugs in Athens, Greece (2014–20). Addiction 2022; 117: 1670–82. [DOI] [PubMed] [Google Scholar]
- 90.Ruan Y, Liang S, Zhu J, et al. Evaluation of harm reduction programs on seroincidence of HIV, hepatitis B and C, and syphilis among intravenous drug users in southwest China. Sex Transm Dis 2013; 40: 323–28. [DOI] [PubMed] [Google Scholar]
- 91.Sabbatini A, Carulli B, Villa M, Correa Leite ML, Nicolosi A. Recent trends in the HIV epidemic among injecting drug users in Northern Italy, 1993–1999. AIDS 2001; 15: 2181–85. [DOI] [PubMed] [Google Scholar]
- 92.Samo RN, Altaf A, Agha A, et al. High HIV incidence among persons who inject drugs in Pakistan: greater risk with needle sharing and injecting frequently among the homeless. PLoS One 2013; 8: e81715. [DOI] [PMC free article] [PubMed] [Google Scholar]
- 93.Sarna A, Saraswati LR, Sebastian M, et al. High HIV incidence in a cohort of male injection drug users in Delhi, India. Drug Alcohol Depend 2014; 139: 106–14. [DOI] [PubMed] [Google Scholar]
- 94.Scheim AI, Nosova E, Knight R, Hayashi K, Kerr T. HIV incidence among men who have sex with men and inject drugs in a Canadian setting. AIDS Behav 2018; 22: 3957–61. [DOI] [PMC free article] [PubMed] [Google Scholar]
- 95.Seage GR 3rd, Holte SE, Metzger D, et al. Are US populations appropriate for trials of human immunodeficiency virus vaccine? The HIVNET Vaccine Preparedness Study. Am J Epidemiol 2001; 153: 619–27. [DOI] [PubMed] [Google Scholar]
- 96.Smith DK, Pan Y, Rose CE, et al. A brief screening tool to assess the risk of contracting HIV infection among active injection drug users. J Addict Med 2015; 9: 226–32. [DOI] [PMC free article] [PubMed] [Google Scholar]
- 97.Smyth B, O’Connor J, Barry J, Keenan E. Retrospective cohort study examining incidence of HIV and hepatitis C infection among injecting drug users in Dublin. J Epidemiol Community Health 2003; 57: 310–11. [DOI] [PMC free article] [PubMed] [Google Scholar]
- 98.Solomon SS, Celentano DD, Srikrishnan AK, et al. Low incidences of human immunodeficiency virus and hepatitis C virus infection and declining risk behaviors in a cohort of injection drug users in Chennai, India. Am J Epidemiol 2010; 172: 1259–67. [DOI] [PMC free article] [PubMed] [Google Scholar]
- 99.Teixeira SL, Bastos FI, Telles PR, et al. HIV-1 infection among injection and ex-injection drug users from Rio de Janeiro, Brazil: prevalence, estimated incidence and genetic diversity. J Clin Virol 2004; 31: 221–26. [DOI] [PubMed] [Google Scholar]
- 100.Todd CS, Nasir A, Stanekzai MR, et al. Hepatitis C and HIV incidence and harm reduction program use in a conflict setting: an observational cohort of injecting drug users in Kabul, Afghanistan. Harm Reduct J 2015; 12: 22. [DOI] [PMC free article] [PubMed] [Google Scholar]
- 101.Tovanabutra S, Beyrer C, Sakkhachornphop S, et al. The changing molecular epidemiology of HIV type 1 among northern Thai drug users, 1999 to 2002. AIDS Res Hum Retroviruses 2004; 20: 465–75. [DOI] [PubMed] [Google Scholar]
- 102.Valencia J, Ryan P, Alvaro-Meca A, et al. High HIV seroconversion rate in hepatitis C virus-infected drug users followed in a harm reduction unit: a lost opportunity for preexposure prophylaxis. AIDS 2018; 32: 1157–63. [DOI] [PubMed] [Google Scholar]
- 103.Wei L, Chen J, Rodolph M, et al. HIV incidence, retention, and changes of high-risk behaviors among rural injection drug users in Guangxi, China. Subst Abus 2006; 27: 53–61. [DOI] [PubMed] [Google Scholar]
- 104.Yen YF, Rodwell TC, Yen MY, et al. HIV infection risk among injection drug users in a methadone maintenance treatment program, Taipei, Taiwan 2007–2010. Am J Drug Alcohol Abuse 2012; 38: 544–50. [DOI] [PMC free article] [PubMed] [Google Scholar]
- 105.Zhang Y, Shan H, Trizzino J, et al. HIV incidence, retention rate, and baseline predictors of HIV incidence and retention in a prospective cohort study of injection drug users in Xinjiang, China. Int J Infect Dis 2007; 11: 318–23. [DOI] [PubMed] [Google Scholar]
- 106.Clipman SJ, Mehta SH, Mohapatra S, et al. Deep learning and social network analysis elucidate drivers of HIV transmission in a highincidence cohort of people who inject drugs. Sci Adv 2022; 8: eabf0158. [DOI] [PMC free article] [PubMed] [Google Scholar]
- 107.Giang HT, Duc NQ, Molès JP, et al. “Maintaining HIV and HCV prevention and care for people who inject drugs despite COVID-19 in Hai Phong, Vietnam”. Int J Drug Policy 2022; 110: 103870. [DOI] [PMC free article] [PubMed] [Google Scholar]
- 108.Skaathun B, Shrader CH, Borquez A, et al. High HIV incidence among PWID on the US/Mexico border during the COVID-19 pandemic. Top Antivir Med 2022; 30 (suppl 1): 315–16. [Google Scholar]
- 109.Aitken CK, Agius PA, Higgs PG, Stoove MA, Bowden DS, Dietze PM. The effects of needle-sharing and opioid substitution therapy on incidence of hepatitis C virus infection and reinfection in people who inject drugs. Epidemiol Infect 2017; 145: 796–801. [DOI] [PMC free article] [PubMed] [Google Scholar]
- 110.Balogun MA, Murphy N, Nunn S, et al. Prevalence and incidence of hepatitis C in injecting drug users attending genitourinary medicine clinics. Epidemiol Infect 2009; 137: 980–87. [DOI] [PubMed] [Google Scholar]
- 111.Brunton C, Kemp R, Raynel P, Harte D, Baker M. Cumulative incidence of hepatitis C seroconversion in a cohort of seronegative injecting drug users. N Z Med J 2000; 113: 98–101. [PubMed] [Google Scholar]
- 112.Clatts MC, Colon-Lopez V, Giang LM, Goldsamt LA. Prevalence and incidence of HCV infection among Vietnam heroin users with recent onset of injection. J Urban Health 2010; 87: 278–91. [DOI] [PMC free article] [PubMed] [Google Scholar]
- 113.Craine N, Hickman M, Parry JV, et al. Incidence of hepatitis C in drug injectors: the role of homelessness, opiate substitution treatment, equipment sharing, and community size. Epidemiol Infect 2009; 137: 1255–65. [DOI] [PubMed] [Google Scholar]
- 114.d’Arminio Monforte A, Antinori A, Iardino R, et al. Incidence and progression to cirrhosis of new hepatitis C virus infections in persons living with human immunodeficiency virus. Clin Microbiol Infect 2017; 23: 267.e1–4. [DOI] [PubMed] [Google Scholar]
- 115.Edlin BR, Winkelstein ER, Shu MA, et al. HCV transmission among young IDUs in New York City: the Swan project. Hepatology 2013; 1: 1296A–7A. [Google Scholar]
- 116.Foley S, Abou-Saleh MT. Risk behaviors and transmission of hepatitis C in injecting drug users. Addict Disord Their Treat 2009; 8: 13–21. [Google Scholar]
- 117.Fuller CM, Ompad DC, Galea S, Wu Y, Koblin B, Vlahov D. Hepatitis C incidence—a comparison between injection and noninjection drug users in New York City. J Urban Health 2004; 81: 20–24. [DOI] [PMC free article] [PubMed] [Google Scholar]
- 118.Garten RJ, Lai S, Zhang J, et al. Rapid transmission of hepatitis C virus among young injecting heroin users in southern China. Int J Epidemiol 2004; 33: 182–88. [DOI] [PubMed] [Google Scholar]
- 119.Hagan H, Pouget ER, Williams IT, et al. Attribution of hepatitis C virus seroconversion risk in young injection drug users in 5 US cities. J Infect Dis 2010; 201: 378–85. [DOI] [PubMed] [Google Scholar]
- 120.Hagan H, Thiede H, Des Jarlais DC. Hepatitis C virus infection among injection drug users: survival analysis of time to seroconversion. Epidemiology 2004; 15: 543–49. [DOI] [PubMed] [Google Scholar]
- 121.Havens JR, Lofwall MR, Frost SD, Oser CB, Leukefeld CG, Crosby RA. Individual and network factors associated with prevalent hepatitis C infection among rural Appalachian injection drug users. Am J Public Health 2013; 103: e44–52. [DOI] [PMC free article] [PubMed] [Google Scholar]
- 122.Hope VD, Hickman M, Ngui SL, et al. Measuring the incidence, prevalence and genetic relatedness of hepatitis C infections among a community recruited sample of injecting drug users, using dried blood spots. J Viral Hepat 2011; 18: 262–70. [DOI] [PubMed] [Google Scholar]
- 123.Ireland G, Simmons R, Hickman M, Eastwood B, Ramsay M, Mandal S. Mapping the hepatitis C cascade of care in people attending drug treatment services in England: a data linkage study. Int J Drug Policy 2019; 72: 55–60. [DOI] [PubMed] [Google Scholar]
- 124.Iversen J, Wand H, Topp L, Kaldor J, Maher L. Reduction in HCV incidence among injection drug users attending needle and syringe programs in Australia: a linkage study. Am J Public Health 2013; 103: 1436–44. [DOI] [PMC free article] [PubMed] [Google Scholar]
- 125.Jackson JB, Wei L, Liping F, et al. Prevalence and seroincidence of hepatitis B and hepatitis C infection in high risk people who inject drugs in China and Thailand. Hepat Res Treat 2014; 2014: 296958. [DOI] [PMC free article] [PubMed] [Google Scholar]
- 126.Jordan AE, Cleland CM, Wyka K, Schackman BR, Perlman DC, Nash D. Hepatitis C virus incidence in a cohort in medicationassisted treatment for opioid use disorder in New York City. J Infect Dis 2020; 222 (suppl 5): S322–34. [DOI] [PMC free article] [PubMed] [Google Scholar]
- 127.Maher L, Jalaludin B, Chant KG, et al. Incidence and risk factors for hepatitis C seroconversion in injecting drug users in Australia. Addiction 2006; 101: 1499–508. [DOI] [PubMed] [Google Scholar]
- 128.McDonald SA, Hutchinson SJ, Cameron SO, Innes HA, McLeod A, Goldberg DJ. Examination of the risk of reinfection with hepatitis C among injecting drug users who have been tested in Glasgow. Int J Drug Policy 2012; 23: 353–57. [DOI] [PubMed] [Google Scholar]
- 129.Minoyan N, Artenie AA, Zang G, Jutras-Aswad D, Turcotte ME, Bruneau J. Harm reduction coverage and hepatitis C incidence: findings from a cohort of people who inject drugs. Am J Prev Med 2020; 58: 845–53. [DOI] [PubMed] [Google Scholar]
- 130.Morris MD, Shiboski S, Bruneau J, et al. Geographic differences in temporal incidence trends of hepatitis C virus infection among people who inject drugs: the InC3 collaboration. Clin Infect Dis 2017; 64: 860–69. [DOI] [PMC free article] [PubMed] [Google Scholar]
- 131.Morris MD, Yen IH, Shiboski S, Evans JL, Page K. Housing stability and hepatitis C infection for young adults who inject drugs: examining the relationship of consistent and intermittent housing status on HCV infection risk. J Urban Health 2020; 97: 831–44. [DOI] [PMC free article] [PubMed] [Google Scholar]
- 132.Ompad DC, Fuller CM, Vlahov D, Thomas D, Strathdee SA. Lack of behavior change after disclosure of hepatitis C virus infection among young injection drug users in Baltimore, Maryland. Clin Infect Dis 2002; 35: 783–88. [DOI] [PubMed] [Google Scholar]
- 133.Peles E, Schreiber S, Rados V, Adelson M. Low risk for hepatitis C seroconversion in methadone maintenance treatment. J Addict Med 2011; 5: 214–20. [DOI] [PubMed] [Google Scholar]
- 134.Roy E, Alary M, Morissette C, et al. High hepatitis C virus prevalence and incidence among Canadian intravenous drug users. Int J STD AIDS 2007; 18: 23–27. [DOI] [PubMed] [Google Scholar]
- 135.Roy E, Arruda N, Leclerc P, Haley N, Bruneau J, Boivin JF. Injection of drug residue as a potential risk factor for HCV acquisition among Montreal young injection drug users. Drug Alcohol Depend 2012; 126: 246–50. [DOI] [PubMed] [Google Scholar]
- 136.Roy KM, Goldberg D, Taylor A, et al. A method to detect the incidence of hepatitis C infection among injecting drug users in Glasgow 1993–98. J Infect 2001; 43: 200–05. [DOI] [PubMed] [Google Scholar]
- 137.Sacks-Davis R, Aitken CK, Higgs P, et al. High rates of hepatitis C virus reinfection and spontaneous clearance of reinfection in people who inject drugs: a prospective cohort study. PLoS One 2013; 8: e80216. [DOI] [PMC free article] [PubMed] [Google Scholar]
- 138.Silva MJ, Lopes P, Carvalho D, et al. Incidence of hepatitis C in an European low threshold methadone program. J Hepatol 2015; 62: S844. [Google Scholar]
- 139.Smit C, Boyd A, Rijnders BJA, et al. HCV micro-elimination in individuals with HIV in the Netherlands 4 years after universal access to direct-acting antivirals: a retrospective cohort study. Lancet HIV 2021; 8: e96–105. [DOI] [PubMed] [Google Scholar]
- 140.Spada E, Rezza G, Garbuglia AR, et al. Incidence and risk factors for hepatitis C virus infection among illicit drug users in Italy. J Urban Health 2018; 95: 99–110. [DOI] [PMC free article] [PubMed] [Google Scholar]
- 141.Spittal PM, Pearce ME, Chavoshi N, et al. The Cedar Project: high incidence of HCV infections in a longitudinal study of young Aboriginal people who use drugs in two Canadian cities. BMC Public Health 2012; 12: 632. [DOI] [PMC free article] [PubMed] [Google Scholar]
- 142.Stein MD, Herman DS, Anderson BJ. A trial to reduce hepatitis C seroincidence in drug users. J Addict Dis 2009; 28: 389–98. [DOI] [PMC free article] [PubMed] [Google Scholar]
- 143.Sypsa V, Vickerman P, Wiessing L, Malliori M, Hatzakis A. High levels of transmission of HCV infection among people who inject drugs in Greece. J Hepatol 2017; 66 (suppl 1): S416. [Google Scholar]
- 144.The Kirby Institute. HIV, viral hepatitis and sexually transmissible infections in Australia. Annual surveillance report 2016. Sydney NSW 2052: The Kirby Institute, UNSW Sydney; 2016. https://kirby.unsw.edu.au/sites/default/files/kirby/report/SERP_Annual-SurveillanceReport-2016_UPD170627.pdf (accessed Feb 15, 2022). [Google Scholar]
- 145.Thorpe LE, Ouellet LJ, Hershow R, et al. Risk of hepatitis C virus infection among young adult injection drug users who share injection equipment. Am J Epidemiol 2002; 155: 645–53. [DOI] [PubMed] [Google Scholar]
- 146.Vallejo F, Barrio G, Brugal MT, et al. High hepatitis C virus prevalence and incidence in a community cohort of young heroin injectors in a context of extensive harm reduction programmes. J Epidemiol Community Health 2015; 69: 599–603. [DOI] [PubMed] [Google Scholar]
- 147.White B, Madden A, Prins M, et al. Assessing the feasibility of hepatitis C virus vaccine trials: results from the Hepatitis C Incidence and Transmission Study-community (HITS-c) vaccine preparedness study. Vaccine 2014; 32: 5460–67. [DOI] [PMC free article] [PubMed] [Google Scholar]
- 148.Elrashdy F, Hagag S, Mohamed R, et al. Incidence of hepatitis C virus infection among people living with HIV: an Egyptian cohort study. South Afr J HIV Med 2022; 23: 1442. [DOI] [PMC free article] [PubMed] [Google Scholar]
- 149.Bach P, Walton G, Hayashi K, et al. Benzodiazepine use and hepatitis C seroconversion in a cohort of persons who inject drugs. Am J Public Health 2016; 106: 1067–72. [DOI] [PMC free article] [PubMed] [Google Scholar]
- 150.Worldometer. How many countries are there in the world? https://www.worldometers.info/geography/how-many-countries-are-there-inthe-world/ (accessed March 5, 2023).
- 151.Martin M, Vanichseni S, Suntharasamai P, et al. Risk behaviors and risk factors for HIV infection among participants in the Bangkok tenofovir study, an HIV pre-exposure prophylaxis trial among people who inject drugs. PLoS One 2014; 9: e92809. [DOI] [PMC free article] [PubMed] [Google Scholar]
- 152.Ruan Y, Qin G, Yin L, et al. Incidence of HIV, hepatitis C and hepatitis B viruses among injection drug users in southwestern China: a 3-year follow-up study. AIDS 2007; 21: S39–46. [DOI] [PubMed] [Google Scholar]
- 153.Jacka B, Roy E, Hoj S, et al. Sexual behaviour as a risk factor for hepatitis C virus infection among people who inject drugs in Montreal, Canada. J Viral Hepat 2019; 26: 1413–22. [DOI] [PubMed] [Google Scholar]
- 154.Micallef JM, Macdonald V, Jauncey M, et al. High incidence of hepatitis C virus reinfection within a cohort of injecting drug users. J Viral Hepat 2007; 14: 413–18. [DOI] [PubMed] [Google Scholar]
- 155.Molès J-P, Vallo R, Khue PM, et al. HIV control programs reduce HIV incidence but not HCV incidence among people who inject drugs in HaiPhong, Vietnam. Sci Rep 2020; 10: 1–8. [DOI] [PMC free article] [PubMed] [Google Scholar]
- 156.Van Den Berg C, Smit C, Van Brussel G, Coutinho R, Prins M. Full participation in harm reduction programmes is associated with decreased risk for human immunodeficiency virus and hepatitis C virus: evidence from the Amsterdam Cohort Studies among drug users. Addiction 2007; 102: 1454–62. [DOI] [PMC free article] [PubMed] [Google Scholar]
- 157.Des Jarlais DC, Kerr T, Carrieri P, Feelemyer J, Arasteh K. HIV infection among persons who inject drugs: ending old epidemics and addressing new outbreaks. AIDS 2016; 30: 815–26. [DOI] [PMC free article] [PubMed] [Google Scholar]
- 158.Grebely J, Larney S, Peacock A, et al. Global, regional, and countrylevel estimates of hepatitis C infection among people who have recently injected drugs. Addiction 2018; 114: 150–66. [DOI] [PMC free article] [PubMed] [Google Scholar]
- 159.WHO. Interim guidance for country validation of viral hepatitis elimination. Geneva, Switzerland: World Health Organization, 2021. https://www.who.int/publications/i/item/9789240028395 (accessed June 12, 2021). [Google Scholar]
- 160.Richardson DB, Cole SR, Ross RK, Poole C, Chu H, Keil AP. Meta-analysis and sparse-data bias. Am J Epidemiol 2021; 190: 336–40. [DOI] [PubMed] [Google Scholar]
- 161.Lin L Bias caused by sampling error in meta-analysis with small sample sizes. PLoS One 2018; 13: e0204056. [DOI] [PMC free article] [PubMed] [Google Scholar]
Associated Data
This section collects any data citations, data availability statements, or supplementary materials included in this article.
Supplementary Materials
Data Availability Statement
Extracted data sheets will be shared with researchers who provide a methodologically sound proposal approved by AA and PV. Proposals should be directed to adelina.artenie@bristol.ac.uk and peter.vickerman@bristol.ac.uk; requesters will need to sign a data access agreement. Data can be made available starting with the date of publication of this Article and up to 5 years thereafter.