

ABSTRACT
The deterioration in reproductive performance in association with low fertility leads to significant economic losses on dairy farms. The uterine microbiota has begun to attract attention as a possible cause of unexplained low fertility. We analyzed the uterine microbiota associated with fertility by 16S rRNA gene amplicon sequencing in dairy cows. First, the alpha (Chao1 and Shannon) and beta (unweighted and weighted UniFrac) diversities of 69 cows at four dairy farms that had passed the voluntary waiting period before the first artificial insemination (AI) were analyzed with respect to factors including farm, housing style, feeding management, parity, and AI frequency to conception. Significant differences were observed in the farm, housing style, and feeding management, except parity and AI frequency to conception. The other diversity metrics did not show significant differences in the tested factors. Similar results were obtained for the predicted functional profile. Next, the microbial diversity analysis of 31 cows at a single farm using weighted UniFrac distance matrices revealed a correlation with AI frequency to conception but not with parity. In correlation with AI frequency to conception, the predicted function profile appeared to be slightly modified and a single bacterial taxon, Arcobacter, was detected. The bacterial associations related to fertility were estimated. Considering these, the uterine microbiota in dairy cows can be varied depending on the farm management practices and may become one of the measures for low fertility.
IMPORTANCE We examined the uterine microbiota associated with low fertility in dairy cows derived from four commercial farms via a metataxonomic approach using endometrial tissues prior to the first artificial insemination. The present study provided two new insights into the relevance of uterine microbiota with respect to fertility. First, the uterine microbiota varied depending on housing style and feeding management. Next, a subtle change was observed in functional profile analysis: a formation of uterine microbiota was detected to be different in correlation with fertility in one farm studied. Considering these insights, an examination system on bovine uterine microbiota is hopefully established based on continuous research on this topic.
KEYWORDS: dairy cows, low fertility, uterine microbiota, microbial diversity, bacterial association
INTRODUCTION
The deterioration in reproductive performance caused by prolonged intervals from calving to conception in dairy cows is causing significant economic losses to dairy farms (1–4). The increase in the net cost of 1 day until the time to conceive is estimated to range from €0.28 to €1.10 per cow per day (1). As much as 25% of dairy cows are culled because of reproductive problems, which accounts for a higher proportion than other major factors, such as mastitis and lameness (3, 5). Low fertility is one of the major factors underlying the deterioration in reproductive performance (3, 4). The causes of low fertility vary widely, from management factors (e.g., heat detection, nutritional control, and cowshed environment) to cow-specific factors (e.g., reproductive tract infections, endocrine disorders, and defective ova) (6, 7). However, some cases remain unexplained by these factors, resulting in losses to farms without adequate countermeasures (6). Thus, the study of factors potentially associated with low fertility is important, because it may lead to the development of new measures for reproductive management.
The uterine microbiota has recently gained interest in this field of research. Although the uterus has been thought of as being germfree for decades, the advances in next-generation sequencing technology have revealed the existence of uterine microbiota; contrarily, the microbiota that otherwise cannot be isolated using conventional bacterial culture techniques (8, 9). Pioneer studies on the relationship between the uterine microbiota and fertility have been performed in humans (10). Depending on the type of bacteria present in the uterine microbiota, positive and negative relationships with reproductive function have been shown (10). Studies comparing the compositions of the uterine microbiota of pregnant and nonpregnant women have revealed that the presence of Lactobacillus-dominated microbiota is associated with significantly increased pregnancy rates (11–13), whereas higher proportions of Atopobium spp., Bifidobacterium spp., Gardnerella spp., Klebsiella spp., and Streptococcus spp. cause inflammation in the reproductive tract and are considered to be negatively associated with fertility (14, 15). Thus, the uterine microbiota can be one of the possible factors related to conception in humans.
The concerns regarding the uterine microbiota throughout the process from postpartum uterine involutions to conception by artificial insemination (AI) are increasing in cows as well. To facilitate reproductive management, each farm sets a voluntary waiting period (VWP) between calving and first insemination to ensure sufficient time for uterine involution to prepare for the next pregnancy. In dairy cows, generally, the VWP is set at 60 days after parturition (16–18). The uterine microbiota of cows is presently being studied with respect to the relations to postpartum uterine inflammation (19–21). Increased relative abundances of Bacteroidetes and Fusobacterium and decreased relative abundances of Proteobacteria and Tenericutes are reported to be significantly associated with postpartum uterine inflammation, resulting in delayed uterine involutions (19–21). Conversely, few studies are available on the uterine microbiota associated with fertility after the VWP, despite its importance in understanding the causes of unexplained low fertility (22, 23). The relationship between conception rate and uterine microbiota within timed AI sampled by a uterine lavage approach in beef cows has been recently examined, and a lower microbial diversity with specific bacterial genera is found in nonpregnant cows compared with that in pregnant cows (23). To evaluate the relationship between the uterine microbiota and fertility clinically, cows must be monitored until conception is confirmed (2–4). Because the AI frequency to conception can be used as a measure of fertility (6), the relationship between the uterine microbiota and AI frequency to conception is worth investigating.
Endometrial tissue biopsies enable the detection of bacteria not only on the surface layer of mucus, inside the mucus layer, but also on the endometrium (24–26). In this study, the uterine microbiota associated with low fertility was investigated via a metataxonomic approach using endometrial biopsy samples from dairy cows after the VWP, before the first insemination.
RESULTS
Uterine microbial community analysis.
The microbiota data using 16S rRNA amplicon sequencing were collected from endometrial tissue biopsy samples. Sixty-nine cows bred on four commercial dairy farms were enrolled in this study (see Fig. S1 in the supplemental material). From the clinical point of view, cows that do not conceive within the first three inseminations are clinically recognized as having low fertility (6). The rates of low-fertility cows (≥4 AI) ranged from 27 to 39% among the farms. The information on the dairy farms is provided in Table 1.
TABLE 1.
Information about the four farms
| Farm | Herd size (head) | Housing style | Feeding managementa | No. of cows studied |
|---|---|---|---|---|
| F | 70 | Tie stall barn | Separate feeding | 13 |
| ND | 50 | Tie stall barn | TMR_B | 11 |
| NG | 144 | Free barn | TMR_A | 31 |
| S | 65 | Tie stall barn | TMR_B | 14 |
TMR_A, total mixed ration (TMR) supplied at own farm; TMR_B, TMR purchased from the TMR center, which is a cooperative organization of farmers who supply TMR feed from harvest; separate feeding, the cows were fed roughage and concentrate separately.
We obtained 3,020,657 reads in total (mean ± standard deviation, 43,778 ± 16,666 reads/sample). Read trimming and exclusion of chimeric reads were carried out using DADA2 software and produced a total of 1,648,384 reads (23,890 ± 8,703 reads/sample). The relative abundance of the bacterial community was calculated using these data (Fig. 1A). At the phylum level, the majority of bacterial taxa were Firmicutes, Proteobacteria, Bacteroidota, Actinobacteriota, and Euryarchaeota, with average proportions of 38.9%, 11.6%, 10.0%, 5.0%, and 1.8%, respectively; the abundances of unassigned and other bacterial taxa were calculated to be 30.4% and 2.2%, respectively.
FIG 1.

Relative abundance of uterine microbiota. (A) Taxon bar plots at the phylum level. The bacterial taxa are indicated using distinct colors, as shown on the bottom. The farms are indicated below the bar chart on the horizontal axis. The combined relative abundances totaled 100% for each cow. (B) Distribution of relative abundance at the genus level. The dots in the swarm plot represent the bacterial taxa.
Moreover, the taxonomy abundance at the genus level was observed. There were 14, 77, 177, and 584 taxa at ≥1%, 1 to 0.1%, 0.1 to 0.01%, and <0.01% relative abundances, respectively (Fig. 1B). The taxa at ≥1% included Pseudomonas (7.8%), Romboutsia (5.2%), UCG-005 (family Oscillospiraceae) (3.9%), unassigned (family Lachnospiraceae) (3.2%), Paeniclostridium (2.6%), Turicibacter (2.6%), Bacteroides (2.4%), Corynebacterium (2.0%), Clostridium sensu stricto 1 (1.7%), Methanobrevibacter (1.7%), Rikenellaceae RC9 gut group (1.3%), UCG-010 (family UCG-010) (1.1%), Streptococcus (1.1%), and Lachnospiraceae NK3A20 group (1.1%).
Diversity analysis of uterine microbiota in the cows of four farms.
We compared the microbial diversities related to the farm, housing style, and feeding management and examined the correlation of microbial diversity with parity and the AI frequency to conception. First, alpha diversity was analyzed using Shannon and Chao1 indices. No significant differences were observed regarding the farm, housing style, and feeding management (Table 2); moreover, the pairwise analysis showed no significant differences between the groups (Fig. S2). No significant correlation of these alpha diversity indices with parity and AI frequency to conception was observed (Fig. S3 and Table S1).
TABLE 2.
Microbial diversity analysis with respect to farm, feeding management, and housing style for the cows of all the farms
| Parameter |
P value |
||
|---|---|---|---|
| Farm | Housing style | Feed management | |
| Alpha diversitya | |||
| Chao1 | 0.697 | 0.469 | 0.553 |
| Shannon | 0.465 | 0.151 | 0.284 |
| Beta diversityb | |||
| Weighted UniFrac | 0.198 | 0.196 | 0.09 |
| Unweighted UniFrac | 0.033 | 0.029 | 0.012 |
Statistical analysis according to Kruskal-Wallis test.
Statistical analysis using a permutational multivariate analysis of variance (PERMANOVA).
Next, beta diversity was examined by principal-coordinate analysis using unweighted and weighted UniFrac distances. Significant differences were observed using unweighted UniFrac with respect to farm, housing style, and feeding management (Table 2 and Fig. S4; P < 0.05); however, no significant correlation was observed with parity and AI frequency to conception (Table S1; P ≥ 0.05). The pairwise analysis in unweighted UniFrac showed a significant difference between groups with respect to housing style and feeding management (Table 3 and Fig. S4; q < 0.05). On the farms, the comparative groups F-NG, F-S, and NG-S exhibited a low q value (i.e., q < 0.1).
TABLE 3.
Comparison of the unweighted UniFrac distance matrices between two groups, with respect to farm, feeding management, and housing style for the cows of all the farms
| Comparison groupa | Sample size | No. of permutations | Pseudo-F | P value | q value |
|---|---|---|---|---|---|
| Farm | |||||
| F vs ND | 24 | 999 | 1.059941 | 0.287 | 0.4092 |
| F vs NG | 44 | 999 | 1.715226 | 0.020 | 0.0780 |
| F vs S | 27 | 999 | 1.650406 | 0.033 | 0.0780 |
| ND vs NG | 42 | 999 | 1.053892 | 0.341 | 0.4092 |
| ND vs S | 25 | 999 | 0.875121 | 0.637 | 0.6370 |
| NG vs S | 45 | 999 | 1.525050 | 0.039 | 0.0780 |
| Feeding management | |||||
| Separate feeding vs TMR_A | 38 | 999 | 1.563091 | 0.038 | 0.0460 |
| Separate feeding vs TMR_B | 44 | 999 | 1.715226 | 0.027 | 0.0460 |
| TMR_A vs TMR_B | 56 | 999 | 1.558256 | 0.046 | 0.0460 |
| Housing style | |||||
| Free barn vs tie stall barn | 69 | 999 | 1.666939 | 0.031 | 0.0310 |
Statistical analysis using a pairwise PERMANOVA between groups was performed.
In contrast, no significant difference was observed using weighted UniFrac with respect to farm, housing style, and feeding management; moreover, no correlation between weighted UniFrac and parity and AI frequency to conception was observed (Table 2 and Table S1; P ≥ 0.05). The pairwise analysis in weighted UniFrac revealed an absence of significant differences with respect to farm, housing style, and feeding management (Fig. S4 and Table S2).
Considering these results, the composition of the uterine microbiota was influenced by farm, housing style, and feeding management, not by parity or AI frequency to conception.
Functional prediction of uterine microbial data from four farms.
We predicted the functional profile from the microbiota data using PICRUSt2 (27). The ortholog data in the predicted functional profile were analyzed by principal-coordinate analysis using the Euclidean distance. First, examining the data with respect to farm, housing style, and feeding management, significant differences were observed in all the variables (Table 4; P < 0.05). Moreover, examining the correlation of Euclidean distance matrices with respect to parity and AI frequency to conception, the correlation was not observed on either variable (Table 5; P > 0.05). These results suggested that the function profile varied depending on the farm, housing style, and feeding management and were almost similar to the microbiota diversity results.
TABLE 4.
Principal-coordinate analysis of predicted functional profile with respect to farm, feeding management, and housing style for the cows of all the farms
| Comparison groupa | Sample size | No. of permutations | Pseudo-F | P valueb | q value |
|---|---|---|---|---|---|
| Farm | 0.019 | ||||
| F vs ND | 24 | 999 | 0.841423 | 0.432 | 0.4320 |
| F vs NG | 44 | 999 | 4.605098 | 0.004 | 0.024 |
| F vs S | 27 | 999 | 1.695891 | 0.143 | 0.2145 |
| ND vs NG | 42 | 999 | 4.626088 | 0.01 | 0.03 |
| ND vs S | 25 | 999 | 1.128699 | 0.306 | 0.3672 |
| NG vs S | 45 | 999 | 2.418319 | 0.036 | 0.072 |
| Feeding management | 0.008 | ||||
| Separate feeding vs TMR_A | 38 | 999 | 1.118281 | 0.323 | 0.323 |
| Separate feeding vs TMR_B | 44 | 999 | 4.605098 | 0.007 | 0.018 |
| TMR_A vs TMR_B | 56 | 999 | 3.666663 | 0.012 | 0.018 |
| Housing style | 0.009 | ||||
| Tie stall barn | 69 | 999 | 4.192042 | 0.006 | 0.006 |
Statistical analysis using PERMANOVA was performed.
P values in bold indicate the result of PERMANOVA in each analysis; other P values indicate the result of pairwise PERMANOVA between groups.
TABLE 5.
Mantel test using Spearman’s correlation coefficient of predicted function profile, with parity and AI frequency to conception, for the cows of all the farms
| Parameter | Spearman’s correlation coefficient | P value |
|---|---|---|
| Parity | −0.074521 | 0.128 |
| AI frequency to conception | −0.050931 | 0.403 |
Diversity analysis of the uterine microbiota at the NG farm in association with parity and AI frequency to conception.
Based on the above-described results showing that the farm, housing style, and feeding management influenced the uterine microbiota, we considered the possibility of a correlation of the uterine microflora with the AI frequency to conception on one farm. Because the NG farm had the highest number of study-enrolled cows among the four farms with twice to a third as many as the other three farms (Table 1), we analyzed the uterine microbiota of 31 cows kept on the NG farm. The rate of low-fertility cows on the NG farm was 39%. We reprocessed the data of sequence reads from the 31 cows using the DADA2 software and obtained a total of 678,928 reads (21,901 ± 8,334 reads/sample). We examined the correlation of microbial diversity with parity and AI frequency to conception (Table 6). First, parity was not significantly correlated with the alpha and beta diversity metrics (P ≥ 0.05). A correlation of weighted UniFrac distance matrices with respect to AI frequency to conception was detected (P < 0.05). Meanwhile, correlations of Chao1 and Shannon indices with AI frequency to conception were not observed (P ≥ 0.05); those of unweighted UniFrac distance matrices with respect to AI frequency to conception were not observed (P ≥ 0.05).
TABLE 6.
Microbial diversity analysis of the uterine microbiota in the NG farm cows
| Parameter | Parity |
AI frequency to conception |
||
|---|---|---|---|---|
| Spearman’s rank correlation coefficient | P value | Spearman’s rank correlation coefficient | P value | |
| Alpha diversity | ||||
| Chao1 | 0.0308 | 0.869 | −0.1223 | 0.512 |
| Shannon | 0.0123 | 0.948 | 0.0231 | 0.902 |
| Beta diversitya | ||||
| Weighted UniFrac | 0.010735 | 0.839 | 0.190533 | 0.012 |
| Unweighted UniFrac | −0.001651 | 0.970 | 0.009424 | 0.919 |
The data were analyzed by the Mantel test (Spearman’s rank correlation and 999 permutations).
These results suggested that the bacterial taxa at high abundance seemed to be modified depending on the AI frequency to conception without changes in species richness at the NG farm.
Differential abundance analysis in association with AI frequency to conception in the NG farm cows.
We searched for the bacterial taxa at the genus level related to AI frequency to conception, using a differential abundance analysis. As a result, only the taxon of Arcobacter was detected to be positively associated with AI frequency to conception, while no other bacterial taxa associated with AI frequency to conception were detected (Table S3; adjusted P < 0.05). Moreover, we further analyzed the trends of Arcobacter abundance in relation to AI frequency to conception by fitting the regression curve using a least-squares method (Fig. 2). The examination of the regression model using an analysis of variance identified significant differences (P = 0.0002); 71.0% (22/31) of the cows were placed within the 99% reliable area of the model. Considering this result, the Arcobacter genus was considered to be positively associated with AI frequency to conception.
FIG 2.

Relationship of the abundance of the Arcobacter genus with AI frequency to conception. The least-square curve with a 99% reliable area is indicated by a straight line with the area enclosed with dash lines. When the vertical and horizontal axes were used as Y and X, respectively, the least-square curve was calculated as Y = 0.0173118 × X – 0.003614.
Functional prediction of uterine microbial data from the NG farm.
We analyzed the functional profile of the uterine microbiota of NG farm predicted by PICRUSt2. Examining the correlation of Euclidean distance matrices with parity and AI frequency to conception, correlation with statistical significance was not observed (Table S4; P > 0.05). Thus, the overall functional profile was not considered to be influenced by parity or AI frequency to conception. Moreover, we then searched for the functional orthologs correlated with AI frequency to conception. Three functional orthologs included K10873, K00861, and K01350, which were positively correlated with AI frequency to conception (Table S5; adjusted P < 0.05). We then examined these functional orthologs against the Kyoto Encyclopedia of Genes and Genomes (KEGG) database, targeting only the prokaryotes. The functional orthologs K10873 and K00861 were assigned to DNA repair and recombination protein RAD52 and riboflavin kinase, respectively, while K01350 was not assigned. Thus, the function profile in the uterine microbiota appeared to be slightly modified with respect to AI frequency to conception.
Microbial co-occurrence network patterns of the uterine microbiota associated with low fertility in the NG farm cows.
Understanding the microbial co-occurrence network analysis can provide insights into the robustness of ecological systems (28). The microbial co-occurrence network helps decipher complex microbial association patterns, and differential network analysis deciphers the bacterial associations differentially associated between two groups (28). In this study, the cows that conceived within three AIs were categorized as being normal, whereas the cows that underwent three or more consecutive AIs without conception were categorized as having low fertility. Of 31 cows on the NG farm, 19 and 12 were categorized into normal (≤3 AIs) and low-fertility (≥4 AIs) groups, respectively. We estimated the bacterial associations with normal and low fertility by a combination method of co-occurrence network analysis of all cows at the NG farm with differential network analysis of the two groups (Fig. 3A).
FIG 3.
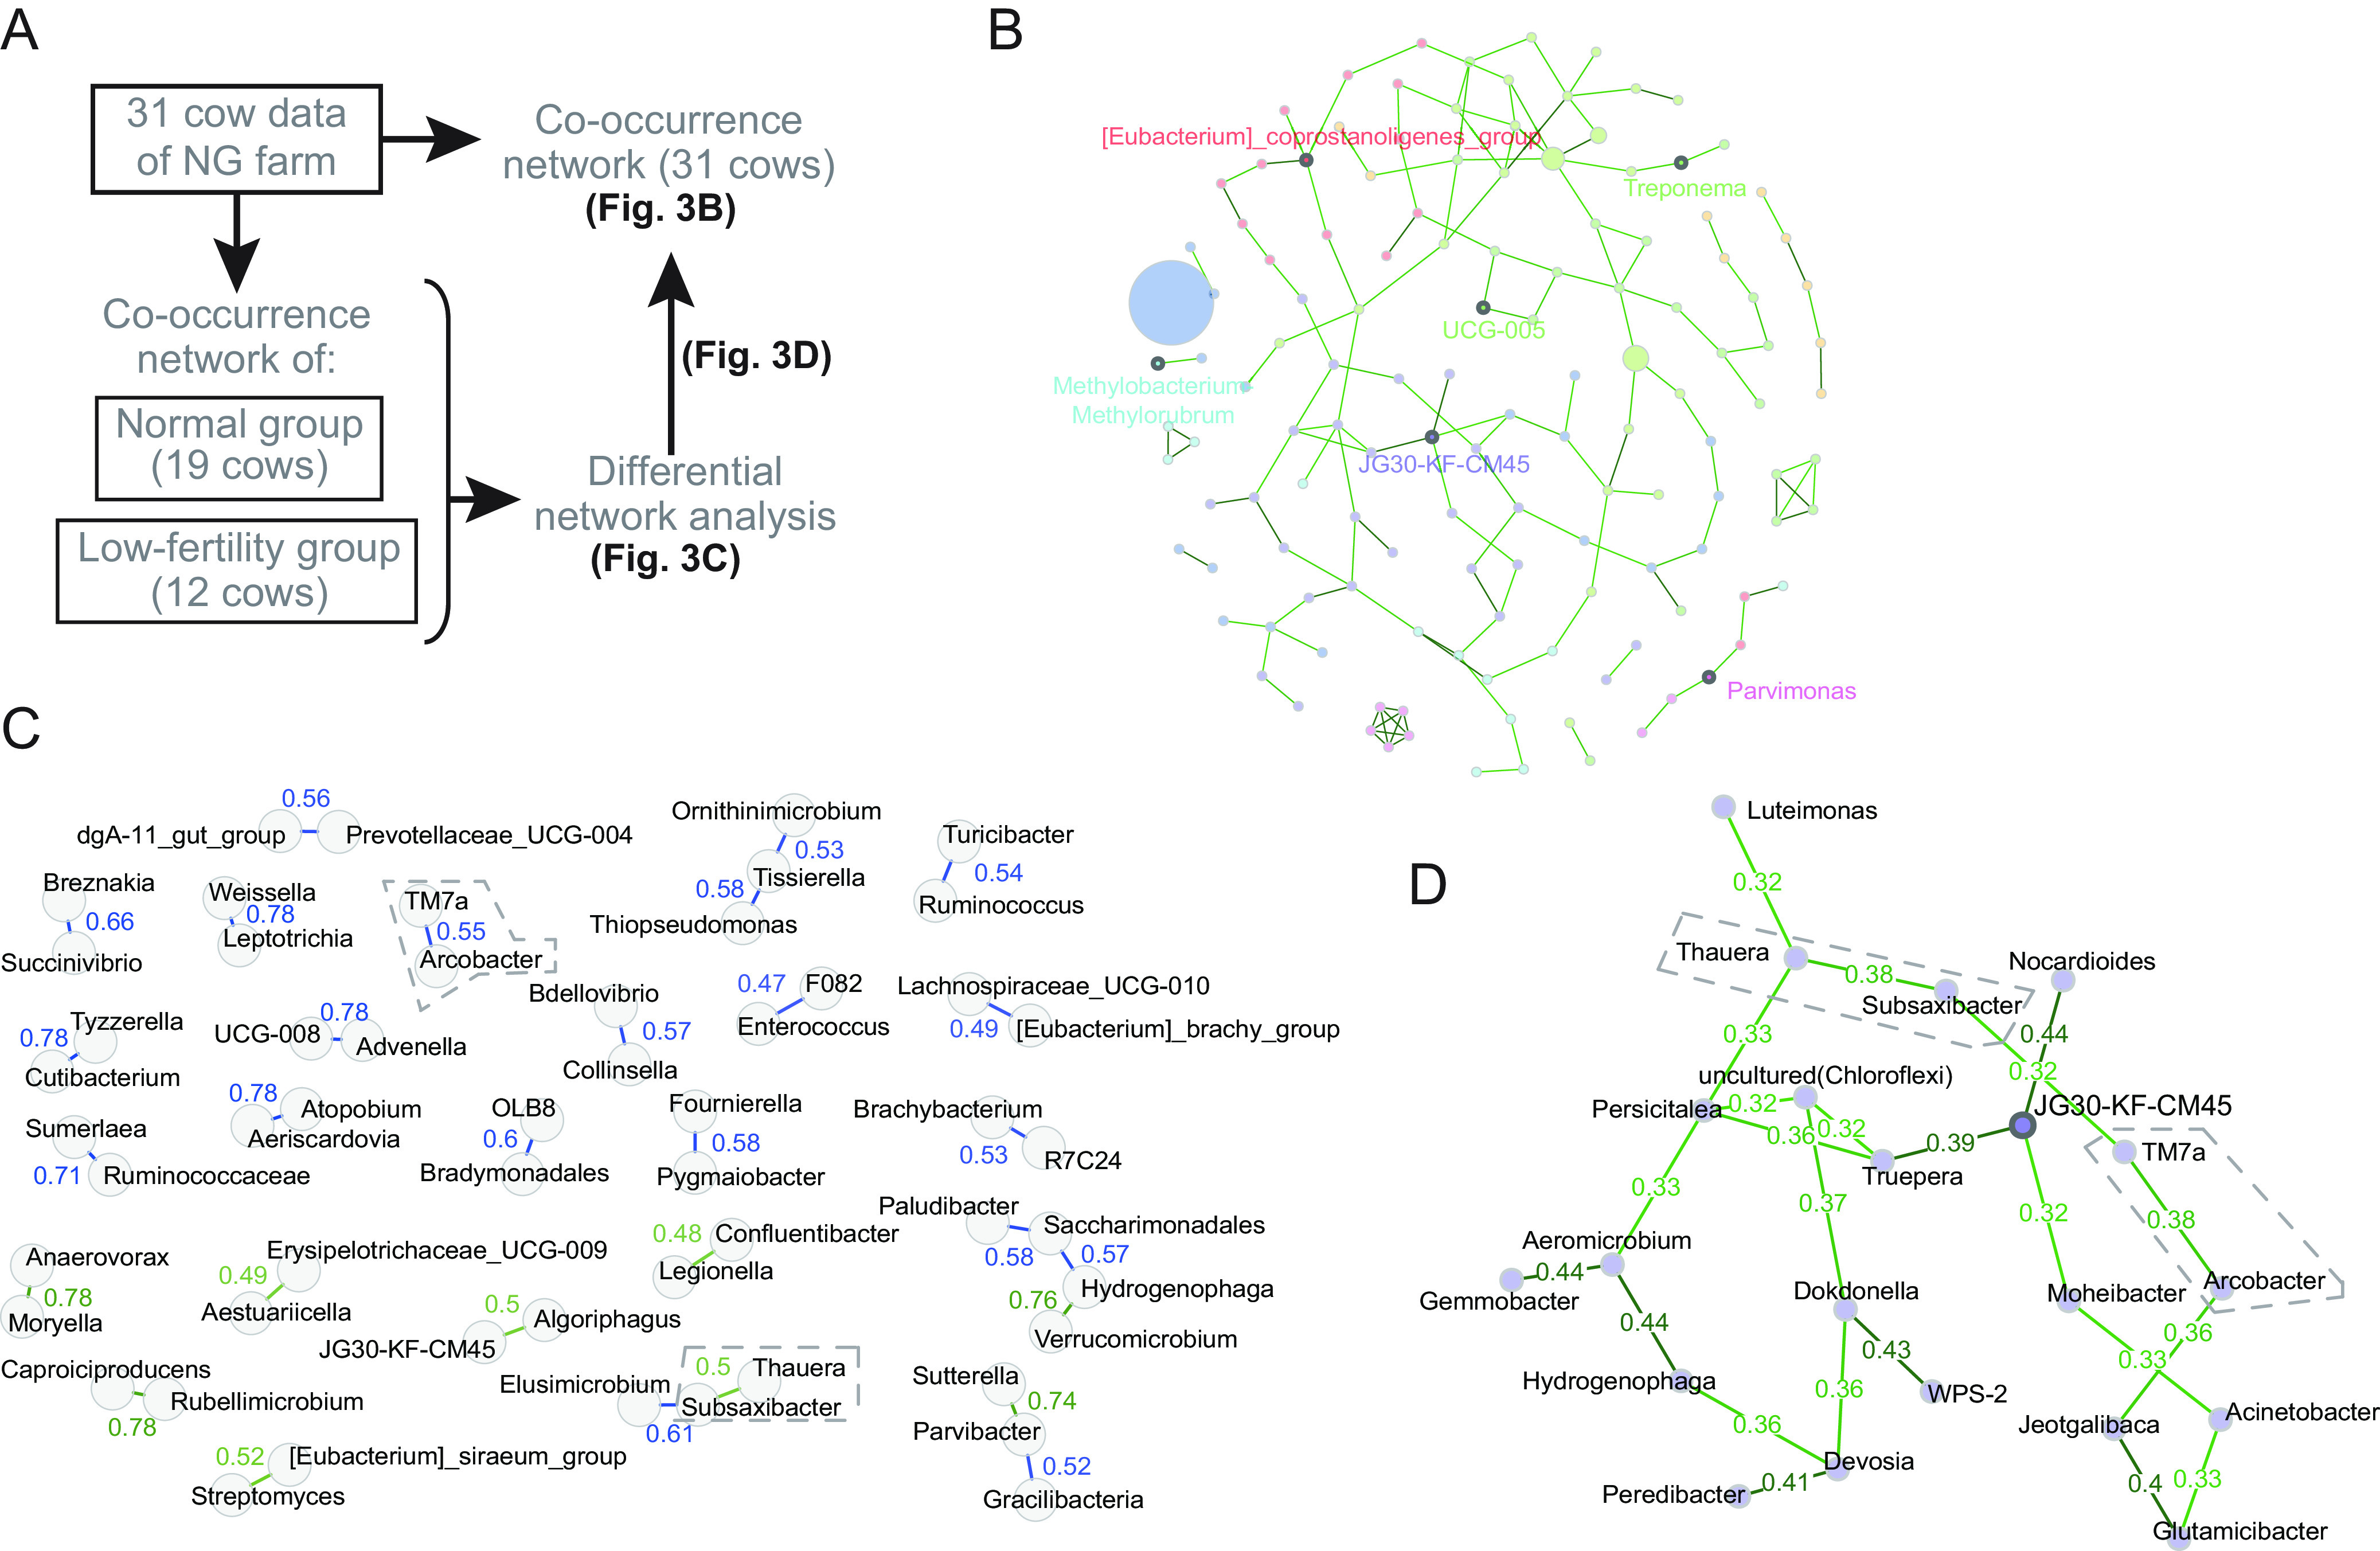
Assumption of bacterial associations by microbial co-occurrence network analysis in the NG farm. (A) Analysis procedure to assume the bacterial associations related to fertility. (B) Co-occurrence network of the uterus microbiota of all the cows in the farm. The node size represents the abundance of bacterial taxa. The numbers adjacent to the edges are the edge weights. Bold points with a name in the network represent the hubs calculated from the centralities. In the network, based on the network centralities, Eubacterium_coprostanoligene (order Oscillospirales), Methylobacterium-Methylorubrum (family Beijerinckiaceae), Parvimonas (order Peptostreptococcales-Tissierellales), JG30-KF-CM45 (order Thermomicrobiales), Treponema (family Spirochaetaceae), and UCG-005 (family Oscillospiraceae) were assumed to be hub bacteria. (C) Normal-group-preponderance and low-fertility-group-preponderance associations detected in a differential network. Thirty edges with the highest differences were extracted from the differential network analysis. Green and blue lines are normal-group-associated and low-fertility-group-associated edges, respectively. The edge weights are shown in numbers adjacent to the edges. (D) A cluster of co-occurrence network of the uterus microbiota, containing JG30-KF-CM45 as a hub. The cluster, which is a part of the co-occurrence network of the NG farm cows, contained the low-fertility-group-preponderance association of Arcobacter-TM7 and the normal-group-preponderance association of Thauera-Subsaxibacter, which are enclosed with dashed lines in panels C and D.
First, the microbial association estimation at the genus level was made by the conditional dependence method using the microbiota data of NG farm, and the co-occurrence network was constructed (Fig. 3B and Fig. S5). Next, we estimated the co-occurrence patterns of the normal and low-fertility groups by the method described above, and the differential network was produced from the comparison of co-occurrence patterns using a nonparametric method (Fig. S6). Thirty edges with the highest weights were selected from the differential network (Fig. 3C), including 21 low-fertility-group-preponderance and 9 normal-group-preponderance associations. Moreover, these 30 highly weighted associations in the differential network were searched in the co-occurrence network derived from the NG farm cows (Fig. S5). As a result, the low-fertility-group-preponderance association of Arcobacter-TM7 and the normal-group-preponderance association of Thauera-Subsaxibacter were found in the cluster containing JG30-KF-CM45 as a hub (Fig. 3D); the other associations were not found in the network. The relative abundances of Arcobacter, TM7, Thauera, and Subsaxibacter on the NG farm were, on average, 0.031%, 0.036%, 0.048%, and 0.021%, respectively.
DISCUSSION
The present study focused on the uterine microbiota of dairy cows that had passed the VWP to examine the relevancy to fertility. First, the microbiota of cows housed on four farms was described at the phylum and genus levels. The uterine microbiota was found to vary depending on the farm management practices such as housing style and feeding management of cows were overall similar to those in the other study at the phylum level; however, they were not similar at the genus level, and the farm management practices, such as housing style and feeding management, were found to influence the uterine microbiota among farms. Next, the study focusing on the NG farm revealed that the diversity of the uterine microbiota was correlated with the AI frequency to conception. Furthermore, a study in correlation with AI frequency to conception revealed the partial modification of the predicted function profile and relation of a single bacterial taxon Arcobacter. The bacterial associations related to fertility were estimated.
First, the majority of bacterial taxa obtained in the study were, in order of abundance of the phyla, Firmicutes, Proteobacteria, Bacteroidota, Actinobacteriota, and Euryarchaeota. With reference to the several studies using a uterine lavage approach at a similar postpartum period, these phyla were also found to be predominant, indicating that they are the major bacteria present in the uterus of cows, although the order of abundance differs (22, 29). This suggested that the bacterial taxa obtained from the uterus of cows were overall similar to the other study at the phylum level. On the contrary, the difference was also observed in abundance at the genus level (29). The genital microbiota of cows is recognized to vary depending on the examination method, the condition of cows, and the environment in which the cows are placed (24, 30, 31). Thus, this difference in uterine microbiota may be attributed to the sampling method as well as factors such as the breed of cow, farm management practices, and regional characteristics.
Second, the farm management practices, such as housing style and feeding management, were found to influence the microbial diversity, suggesting the importance of confirming the variation in the uterine microbiota among farms. In addition, the farm management practices appeared to be reflected in the functional profile. The variety of housing styles on dairy farms (e.g., tie stall barn, free stall barn, free barn, etc.), as well as the bedding materials (e.g., barley straw, woodchips, sand, etc.), are reported to contribute to the establishment of unique uterine and fecal microbiotas on individual farms (31, 32). For feeding management, different food components, such as fiber and starch, are regarded as forming different gut microbiota (33, 34). The gut microbiota regulates the estrogen level in the blood mediated by secretion of β-glucuronidase (35), and changes in estrogen level may influence the uterine microbiota in the cows. In addition, the gut microbiota may translocate hematogenously from the gut to the uterus and may also be the cause of a possible change in the uterine microbiota (36). Thus, the formation of the uterine microbiota is dependent on farm management practices.
Third, because farm management practices influence the formation of the uterine microbiota, we believed that the analysis of one farm could elucidate a farm-specific relationship between the uterine microflora and fertility. Analysis of the uterine microbiota of cows housed on the NG farm showed that the diversity of the uterine microbiota correlated with AI frequency to conception. Subsequent differential abundance analysis of the uterine microbiota showed that the Arcobacter genus positively correlated with AI frequency to conception. Arcobacter has been reported to be associated with ruminant abortions, which suggested the possibility of reducing fertility (37). The pathogenesis of Arcobacter is referred as the adhesion, invasion, and cytotoxic potential of this bacterium in in vitro settings (38). However, the relative abundance of Arcobacter was not high, averaging 0.031% on the NG farm, and Arcobacter was not considered to be a major bacterial taxon group. In addition, because the detected pathways were limited within the functional profile analysis, the overall effects on the uterine environment in relation to fertility were difficult to estimate. The above-described results suggested that it was unlikely to have an immediately direct impact on uterine environments in low-fertility cows on the NG farm.
Finally, a co-occurrence network analysis was performed on the cows of NG farm. The low-fertility-group-preponderance association of Arcobacter-TM7 and the normal-group-preponderance association of Thauera-Subsaxibacter were detected from the cluster containing JG30-KF-CM45 as a hub in the co-occurrence network of the NG farm. These two associations found in this study can be keystones with respect to the fertility on the NG farm. Arcobacter has been discussed to co-occur with other bacteria, to affect the maternal maintenance of pregnancy (37), and, as discussed above, to be one of the possible etiologic infectious abortion agents in ruminants. TM7, which is symbiotic bacterium recalcitrant to the conventional culture method, has been reported to be associated with periodontitis (39). On the other hand, although the function of Subsaxibacter is scant to our knowledge, Thauera is reported to degrade excessive amounts of testosterone (40), potentially having a positive effect on fertility, as testosterone present in the endometrium has a detrimental effect on reproductive function (41). Thus, the uterine microbiota in cows on the NG farm is likely to be balanced in relation to fertility.
Based on this study, two points can be discussed for the future application of the uterine microbiota in cows: the possible functions in uterus and the biomarker for low fertility. First, recent studies have speculated that the uterine microbiota contributes to the regulation of endometrial physiology and reproductive function, thereby affecting fertility, although direct evidence is still lacking (42). Because subtle changes in the uterine microbiota and function profile were observed, we considered that a significant alternation in endometrial functions is not present on the NG farm. However, more obvious changes in uterine function could be observed on other farms, as the present study showed farm-to-farm variation in the formation of the uterine microbiota. Thus, multiple studies on individual farms examining the uterine microbiota associated with fertility are required to estimate direct effects on the endometrium. Second, it is of concern whether the Arcobacter abundance can be a biomarker for low fertility in general, because Arcobacter was detected to be associated with low fertility in both differential abundance and co-occurrence network analyses on the NG farm. The differential abundance analysis of uterine microbiota on the other three farms did not detect positive associations of Arcobacter taxon with AI frequency to conception, either by statistical significance or by low adjusted P values (data not shown). The factors influencing low fertility and the featured bacteria in the uterine microbiota may be different from farm to farm. To discover the common microbial biomarker for low fertility, studies with a large number of cows housed on various farms are required.
In human practice, the uterine microbiota is becoming generally utilized as a biomarker for a poor reproductive prognosis. In addition, treatment to normalize the uterine microbiota mediated by gut immunity, such as oral administration of prebiotics, has been attempted based on the outcome of uterine microbiota testing (43). The present study provided new insights into the relationship of the uterine microbiota with fertility in dairy cows, suggesting that uterine microbiota testing may be applicable in cows. We hope that uterine microbiota data will be accumulated from a variety of cows, leading to the establishment of the examination system and its application to solve problems associated with low fertility.
Conclusion.
This metataxonomic analysis using bovine endometrium illustrated the potential associations of uterus microbiota with AI frequency to conception, which deciphers the two following points. (i) Because the uterine microbiota varied on a farm-by-farm basis, the causative factors for low fertility with respect to the uterine microbiota may differ. (ii) The small change in the uterine microbiota, and the cooperation between bacteria, may be related to unexplained low fertility. It is hoped that the accumulation of uterine microbiota data will help to develop an examination system for unexplained low fertility in cows and contribute to improvement in reproductive management.
MATERIALS AND METHODS
Animals.
Ninety-eight Holstein-Friesian cows (4.3 ± 1.0 years old; 2.8 ± 0.9 parity; 3.0 ± 0.1 body condition score; 71.4 ± 7.2 days postpartum) were enrolled in the study between October 2018 and February 2021. The cows were kept on four commercial dairy farms (F, ND, NG, and S) in Hokkaido, Japan. Cows on these farms were fed under different feeding managements: the F farm fed cows by a separate feeding, i.e., a method to supply feeds separately, and the ND, NG, and S farms fed cows by a total mixed ration (TMR), i.e., a method to supply feeds in a mixture. Among the farms that fed TMR, the NG farm fed TMR prepared by the farm owner (TMR_A) and the ND and S farms fed purchased TMR (TMR_B). Diets were formulated in each farm using the National Research Council (2001) model or Cornell-Penn-Miner dairy model (44) to satisfy nutritional requirements of 30 to 40 kg/day of milk production (Table S6). The F, ND, and S farms housed cows in a tie stall barn, and the NG farm housed cows in a free barn.
The inclusion criteria for cows were as follows: a parity of 2 to 5, a body condition score of 2.75 to 3.25, no history of treatment for systemic disease within 30 days, no signs of lameness (45, 46), and a clinically healthy genital tract. The health status of the genital tract was confirmed by vaginoscopy and ultrasonography. Vaginoscopy assessed the vaginal discharge score as a diagnostic indicator of clinical endometritis using a scale of 0 to 5: 0, no discharge, 1, clear mucus, 2, mucus with flecks of pus, 3, mucopurulent discharge, 4, purulent discharge, and 5, foul-smelling discharge (47). Ultrasonography evaluated abnormalities based on the diameter of the images depicted: in the uterus, a uterine luminal fluid greater than 2 mm (48), and in the ovaries, an ovarian cyst filled with anechoic structures greater than 25 mm (49). Cows with a vaginal discharge score of <2 and no abnormalities by ultrasonography were included in the study. During the monitoring period, the cows that exhibited systemic symptomatic disease, lameness, or genital tract abnormalities were excluded from the study. No evaluation was made in this study regarding the genetic ability for the reproductive performance of the cows (50, 51).
Experimental design.
The biopsy samples were collected between 60 and 85 days postpartum during the diestrus phase, which was determined by the size of the corpus luteum (>20 mm in diameter) using ultrasonography (49, 52, 53) and the absence of estrus signs based on behavioral observation, vaginoscopic examination, and uterine palpation (54). Once the samples were collected, AI was performed after estrus detection and ovulation was confirmed on the day after AI. To avoid the embryonic lethality possibly caused by the Holstein-Friesian lethal haplotype, the selection of semen and AI was conducted after checking for the carriage of the known haplotype in the bulls (55, 56). AIs were repeated until pregnancy. Pregnancy was diagnosed ca. 60 days after AI using ultrasonography (Tringa Linear, Esaote Pie Medical, Genoa, Italy).
Biopsy sampling.
Endometrial tissues were collected using a biopsy instrument (Fujihira Kogyo Co., Ltd., Japan) under caudal epidural anesthesia with 5 mL of 2% procaine hydrochloride, as described previously (57). The endometrial tissue at each bifurcation of the right and left uterine horns was collected by pressing the sample against the hole in the outer cylinder and hollowing it out with the inner cylinder. The samples were cut into small pieces immediately at the farm and placed in 2 mL of phosphate buffer at 4°C. The solution containing the sample was stirred and temporarily stored at −20°C. The biopsy samples were stored at −80°C at the laboratory until use.
Extraction and examination of DNA.
Biopsy samples suspended in phosphate-buffered saline (PBS) were directly subjected to DNA extraction using an ISOSPIN fecal DNA kit (Nippon Gene, Tokyo, Japan) according to the manufacturer’s instructions. The DNA solutions were examined using a spectrophotometer (NanoDrop 1000; Thermo Scientific, Wilmington, DE, USA) to measure the DNA quality and amount. To determine the study enrollment, the presence and quality of bacterial DNA were then examined by PCR targeting the 16S rRNA gene, as described previously (58).
Sequencing.
The DNAs were subjected to 16S rRNA gene amplicon sequencing. The V3-V4 region of the 16S rRNA gene that was amplified by PCR with forward primer 341F (5′-CCTACGGGNGGCWGCAG-3′) and reverse primer 785R (5′-GACTACHVGGGTATCTAATCC-3′) was analyzed using Illumina MiSeq with a MiSeq reagent kit v3 (600 cycles; Illumina, San Diego, CA, USA), as described previously (59).
Data processing and taxonomy assignment.
The sequence data were processed using the Quantitative Insights into Microbial Ecology 2 (QIIME2) pipeline v. 2021.11.0 (60). The DADA2 software package v2021.8.0 incorporated into QIIME 2 was used to correct the amplicon sequence errors and to construct an amplicon sequence variant table. The amplicon sequence variant table was rarefied. Microbial taxonomy was assigned using a pretrained taxonomical classifier available on the QIIME2 webpage (a naive Bayes classifier trained on the Silva 138 99% operational taxonomic unit [OTU] full-length sequences; https://github.com/qiime2/docs/blob/master/source/data-resources.rst; accessed 1 April 2022).
Analysis of microbial diversity.
Metrics of alpha diversity, including Faith’s phylogenetic diversity (Faith-PD), the Chao1 index (Chao1), and Shannon’s index (Shannon), and those of beta diversity, including unweighted and weighted UniFrac, were calculated using the QIIME2 pipeline (60).
The data were analyzed using statistics implemented in QIIME2. The data were examined with respect to categorical and numerical variables by the Kruskal-Wallis test and Spearman’s correlation coefficient, respectively. In the principal-coordinate analysis, the distant metrics were analyzed with categorical and numeric variables by permutational multivariate analysis of variance (PERMANOVA) and the Mantel test using Spearman’s correlation coefficient, respectively.
Analysis of predicted functional profile.
The microbial profile was predicted using PICRUSt2 plugin q2-picrust2 2021.11_0, which was installed in QIIME2 v2021.8.0 (27, 60, 61). The Euclidian distance was obtained from the predicted functional profile data of KEGG orthologs (i.e., KO), using the QIIME2 pipeline. In the principal coordinate analysis, the distant metrics were analyzed with categorical and numeric variables using Spearman’s correlation coefficient by PERMANOVA and the Mantel test, respectively. Moreover, the KEGG ortholog data were analyzed by differential abundance analysis described below. The KEGG ortholog data were examined in the KEGG database (https://www.genome.jp/kegg/; accessed 11 January 2023) (62).
Differential abundance analysis.
The differential abundance analysis was done using the software package DAtest v2.8.0 in R statistical software, v. 4.1.3 (63). The statistical models were examined with the data using the “testDA” function with 1,000 repeats (Tables S7 and S8). The microbiota abundance data and the predicted function profile data were analyzed using the quasi-Poisson generalized linear model and Pearson correlation coefficient, respectively, which were implemented in the DAtest package. The statistical significance was set as an adjusted P value of <0.05.
Microbial co-occurrence network analysis.
Microbial associations were estimated from the microbiota data at the genus level by the SPRING model using 150 edges with the highest variance (64). The co-occurrence network was constructed with the default setting with the removal of singletons. The cluster was inferred using the Louvain method. In the differential network analysis, the associations in the networks were compared via a permutation test with 1,000 replicates, and the differential associations with an alpha of 0.05 were selected. All the co-occurrence network analyses and their visualization were performed using the NetCoMi package v. 1.0.2 in R software v. 4.0.2 (65). Finally, the associations in the co-occurrence network were compared with the associations with the highest weights in the differential network, and the associations that were seen in both networks were highlighted as low-fertility-group-preponderance and normal-group-preponderance associations.
Visualization for figures.
The figure visualization was done using JMP Pro 16.2.0 software (SAS Institute, Cary, NC, USA) or R software v. 4.0.2 (65), unless otherwise stated.
Ethics approval and consent to participate.
The farms included in the study expressed willingness to cooperate and had data available for reproduction and disease management. The care and handling of the animals were in accordance with Azabu University animal experiment guidelines. All experiments were reviewed and approved by the Ethics Committee of Azabu University (approval number 210720-5).
Data availability.
Raw sequence data were deposited in the DNA Data Bank of Japan (DDBJ) sequence read archive (DRA014763) under BioProject no. PRJDB14269.
ACKNOWLEDGMENTS
We especially thank Anicom Pafe, Inc., for the next-generation sequencing and OnLine English Ltd. for English proofreading.
The present study was financially supported by a grant from the Ito Memorial Foundation in 2020.
All the authors of this article declare no conflict of interest.
T.Y. and J.U. designed the study. T.Y. and S.A. collected the samples. T.Y., J.U., and I.T-U., performed the experiments, analyzed the data, and wrote the manuscript. All authors reviewed and critically revised the manuscript.
Footnotes
Supplemental material is available online only.
Contributor Information
Jumpei Uchiyama, Email: uchiyama@okayama-u.ac.jp.
Se-Ran Jun, University of Arkansas for Medical Sciences.
REFERENCES
- 1.Meadows C, Rajala-Schultz PJ, Frazer GS. 2005. A spreadsheet-based model demonstrating the nonuniform economic effects of varying reproductive performance in Ohio dairy herds. J Dairy Sci 88:1244–1254. doi: 10.3168/jds.S0022-0302(05)72791-0. [DOI] [PubMed] [Google Scholar]
- 2.Grohn YT, Rajala-Schultz PJ. 2000. Epidemiology of reproductive performance in dairy cows. Anim Reprod Sci 60–61:605–614. doi: 10.1016/s0378-4320(00)00085-3. [DOI] [PubMed] [Google Scholar]
- 3.Seegers H. 2006. Economics of the reproductive performance of dairy herds, p 292–302. In 24th World Buiatrics Congress. International Veterinary Information Service (IVIS), La Jolla, CA. [Google Scholar]
- 4.Inchaisri C, Jorritsma R, Vos PL, van der Weijden GC, Hogeveen H. 2010. Economic consequences of reproductive performance in dairy cattle. Theriogenology 74:835–846. doi: 10.1016/j.theriogenology.2010.04.008. [DOI] [PubMed] [Google Scholar]
- 5.Chiumia D, Chagunda MG, Macrae AI, Roberts DJ. 2013. Predisposing factors for involuntary culling in Holstein-Friesian dairy cows. J Dairy Res 80:45–50. doi: 10.1017/S002202991200060X. [DOI] [PubMed] [Google Scholar]
- 6.Yusuf M, Nakao T, Ranasinghe RB, Gautam G, Long ST, Yoshida C, Koike K, Hayashi A. 2010. Reproductive performance of repeat breeders in dairy herds. Theriogenology 73:1220–1229. doi: 10.1016/j.theriogenology.2010.01.016. [DOI] [PubMed] [Google Scholar]
- 7.Abraham F. 2017. An overview on functional causes of infertility in cows. J Fertili In Vitro 5:1000203. [Google Scholar]
- 8.Chen C, Song X, Wei W, Zhong H, Dai J, Lan Z, Li F, Yu X, Feng Q, Wang Z, Xie H, Chen X, Zeng C, Wen B, Zeng L, Du H, Tang H, Xu C, Xia Y, Xia H, Yang H, Wang J, Wang J, Madsen L, Brix S, Kristiansen K, Xu X, Li J, Wu R, Jia H. 2017. The microbiota continuum along the female reproductive tract and its relation to uterine-related diseases. Nat Commun 8:875. doi: 10.1038/s41467-017-00901-0. [DOI] [PMC free article] [PubMed] [Google Scholar]
- 9.Berg G, Rybakova D, Fischer D, Cernava T, Verges MC, Charles T, Chen X, Cocolin L, Eversole K, Corral GH, Kazou M, Kinkel L, Lange L, Lima N, Loy A, Macklin JA, Maguin E, Mauchline T, McClure R, Mitter B, Ryan M, Sarand I, Smidt H, Schelkle B, Roume H, Kiran GS, Selvin J, Souza RSC, van Overbeek L, Singh BK, Wagner M, Walsh A, Sessitsch A, Schloter M. 2020. Microbiome definition re-visited: old concepts and new challenges. Microbiome 8:103. doi: 10.1186/s40168-020-00875-0. [DOI] [PMC free article] [PubMed] [Google Scholar]
- 10.Toson B, Simon C, Moreno I. 2022. The endometrial microbiome and its impact on human conception. Int J Mol Sci 23:485. doi: 10.3390/ijms23010485. [DOI] [PMC free article] [PubMed] [Google Scholar]
- 11.Moreno I, Codoner FM, Vilella F, Valbuena D, Martinez-Blanch JF, Jimenez-Almazan J, Alonso R, Alama P, Remohi J, Pellicer A, Ramon D, Simon C. 2016. Evidence that the endometrial microbiota has an effect on implantation success or failure. Am J Obstet Gynecol 215:684–703. doi: 10.1016/j.ajog.2016.09.075. [DOI] [PubMed] [Google Scholar]
- 12.Moreno I, Garcia-Grau I, Perez-Villaroya D, Gonzalez-Monfort M, Bahceci M, Barrionuevo MJ, Taguchi S, Puente E, Dimattina M, Lim MW, Meneghini G, Aubuchon M, Leondires M, Izquierdo A, Perez-Olgiati M, Chavez A, Seethram K, Bau D, Gomez C, Valbuena D, Vilella F, Simon C. 2022. Endometrial microbiota composition is associated with reproductive outcome in infertile patients. Microbiome 10:1. doi: 10.1186/s40168-021-01184-w. [DOI] [PMC free article] [PubMed] [Google Scholar]
- 13.Kyono K, Hashimoto T, Kikuchi S, Nagai Y, Sakuraba Y. 2019. A pilot study and case reports on endometrial microbiota and pregnancy outcome: an analysis using 16S rRNA gene sequencing among IVF patients, and trial therapeutic intervention for dysbiotic endometrium. Reprod Med Biol 18:72–82. doi: 10.1002/rmb2.12250. [DOI] [PMC free article] [PubMed] [Google Scholar]
- 14.Hashimoto T, Kyono K. 2019. Does dysbiotic endometrium affect blastocyst implantation in IVF patients? J Assist Reprod Genet 36:2471–2479. doi: 10.1007/s10815-019-01630-7. [DOI] [PMC free article] [PubMed] [Google Scholar]
- 15.Liu Y, Ko EY, Wong KK, Chen X, Cheung WC, Law TS, Chung JP, Tsui SK, Li TC, Chim SS. 2019. Endometrial microbiota in infertile women with and without chronic endometritis as diagnosed using a quantitative and reference range-based method. Fertil Steril 112:707–717.e1. doi: 10.1016/j.fertnstert.2019.05.015. [DOI] [PubMed] [Google Scholar]
- 16.Miller RH, Norman HD, Kuhn MT, Clay JS, Hutchison JL. 2007. Voluntary waiting period and adoption of synchronized breeding in dairy herd improvement herds. J Dairy Sci 90:1594–1606. doi: 10.3168/jds.S0022-0302(07)71645-4. [DOI] [PubMed] [Google Scholar]
- 17.Inchaisri C, Jorritsma R, Vos PL, van der Weijden GC, Hogeveen H. 2011. Analysis of the economically optimal voluntary waiting period for first insemination. J Dairy Sci 94:3811–3823. doi: 10.3168/jds.2010-3790. [DOI] [PubMed] [Google Scholar]
- 18.Stangaferro ML, Wijma R, Masello M, Thomas MJ, Giordano JO. 2018. Extending the duration of the voluntary waiting period from 60 to 88 days in cows that received timed artificial insemination after the Double-Ovsynch protocol affected the reproductive performance, herd exit dynamics, and lactation performance of dairy cows. J Dairy Sci 101:717–735. doi: 10.3168/jds.2017-13046. [DOI] [PubMed] [Google Scholar]
- 19.Pascottini OB, Van Schyndel SJ, Spricigo JFW, Rousseau J, Weese JS, LeBlanc SJ. 2020. Dynamics of uterine microbiota in postpartum dairy cows with clinical or subclinical endometritis. Sci Rep 10:12353. doi: 10.1038/s41598-020-69317-z. [DOI] [PMC free article] [PubMed] [Google Scholar]
- 20.Jeon SJ, Vieira-Neto A, Gobikrushanth M, Daetz R, Mingoti RD, Parize AC, de Freitas SL, da Costa AN, Bicalho RC, Lima S, Jeong KC, Galvao KN. 2015. Uterine microbiota progression from calving until establishment of metritis in dairy cows. Appl Environ Microbiol 81:6324–6332. doi: 10.1128/AEM.01753-15. [DOI] [PMC free article] [PubMed] [Google Scholar]
- 21.Galvao KN, Bicalho RC, Jeon SJ. 2019. Symposium review: the uterine microbiome associated with the development of uterine disease in dairy cows. J Dairy Sci 102:11786–11797. doi: 10.3168/jds.2019-17106. [DOI] [PubMed] [Google Scholar]
- 22.Ault TB, Clemmons BA, Reese ST, Dantas FG, Franco GA, Smith TPL, Edwards JL, Myer PR, Pohler KG. 2019. Bacterial taxonomic composition of the postpartum cow uterus and vagina prior to artificial insemination. J Anim Sci 97:4305–4313. doi: 10.1093/jas/skz212. [DOI] [PMC free article] [PubMed] [Google Scholar]
- 23.Ault TB, Clemmons BA, Reese ST, Dantas FG, Franco GA, Smith TPL, Edwards JL, Myer PR, Pohler KG. 2019. Uterine and vaginal bacterial community diversity prior to artificial insemination between pregnant and nonpregnant postpartum cows. J Anim Sci 97:4298–4304. doi: 10.1093/jas/skz210. [DOI] [PMC free article] [PubMed] [Google Scholar]
- 24.Knudsen LR, Karstrup CC, Pedersen HG, Angen O, Agerholm JS, Rasmussen EL, Jensen TK, Klitgaard K. 2016. An investigation of the microbiota in uterine flush samples and endometrial biopsies from dairy cows during the first 7 weeks postpartum. Theriogenology 86:642–650. doi: 10.1016/j.theriogenology.2016.02.016. [DOI] [PubMed] [Google Scholar]
- 25.Riganelli L, Iebba V, Piccioni M, Illuminati I, Bonfiglio G, Neroni B, Calvo L, Gagliardi A, Levrero M, Merlino L, Mariani M, Capri O, Pietrangeli D, Schippa S, Guerrieri F. 2020. Structural variations of vaginal and endometrial microbiota: hints on female infertility. Front Cell Infect Microbiol 10:350. doi: 10.3389/fcimb.2020.00350. [DOI] [PMC free article] [PubMed] [Google Scholar]
- 26.Liu Y, Wong KK, Ko EY, Chen X, Huang J, Tsui SK, Li TC, Chim SS. 2018. Systematic comparison of bacterial colonization of endometrial tissue and fluid samples in recurrent miscarriage patients: implications for future endometrial microbiome studies. Clin Chem 64:1743–1752. doi: 10.1373/clinchem.2018.289306. [DOI] [PubMed] [Google Scholar]
- 27.Douglas GM, Maffei VJ, Zaneveld JR, Yurgel SN, Brown JR, Taylor CM, Huttenhower C, Langille MGI. 2020. PICRUSt2 for prediction of metagenome functions. Nat Biotechnol 38:685–688. doi: 10.1038/s41587-020-0548-6. [DOI] [PMC free article] [PubMed] [Google Scholar]
- 28.Matchado MS, Lauber M, Reitmeier S, Kacprowski T, Baumbach J, Haller D, List M. 2021. Network analysis methods for studying microbial communities: a mini review. Comput Struct Biotechnol J 19:2687–2698. doi: 10.1016/j.csbj.2021.05.001. [DOI] [PMC free article] [PubMed] [Google Scholar]
- 29.Clemmons BA, Reese ST, Dantas FG, Franco GA, Smith TPL, Adeyosoye OI, Pohler KG, Myer PR. 2017. Vaginal and uterine bacterial communities in postpartum lactating cows. Front Microbiol 8:1047. doi: 10.3389/fmicb.2017.01047. [DOI] [PMC free article] [PubMed] [Google Scholar]
- 30.Adnane M, Chapwanya A. 2022. A review of the diversity of the genital tract microbiome and implications for fertility of cattle. Animals (Basel) 12:460. doi: 10.3390/ani12040460. [DOI] [PMC free article] [PubMed] [Google Scholar]
- 31.Nguyen TT, Miyake A, Tran TTM, Tsuruta T, Nishino N. 2019. The relationship between uterine, fecal, bedding, and airborne dust microbiota from dairy cows and their environment: a pilot study. Animals (Basel) 9:1007. doi: 10.3390/ani9121007. [DOI] [PMC free article] [PubMed] [Google Scholar]
- 32.Hagey JV, Bhatnagar S, Heguy JM, Karle BM, Price PL, Meyer D, Maga EA. 2019. Fecal microbial communities in a large representative cohort of California dairy cows. Front Microbiol 10:1093. doi: 10.3389/fmicb.2019.01093. [DOI] [PMC free article] [PubMed] [Google Scholar]
- 33.Plaizier JC, Danesh Mesgaran M, Derakhshani H, Golder H, Khafipour E, Kleen JL, Lean I, Loor J, Penner G, Zebeli Q. 2018. Review: Enhancing gastrointestinal health in dairy cows. Animal 12:s399–s418. doi: 10.1017/S1751731118001921. [DOI] [PubMed] [Google Scholar]
- 34.Thoetkiattikul H, Mhuantong W, Laothanachareon T, Tangphatsornruang S, Pattarajinda V, Eurwilaichitr L, Champreda V. 2013. Comparative analysis of microbial profiles in cow rumen fed with different dietary fiber by tagged 16S rRNA gene pyrosequencing. Curr Microbiol 67:130–137. doi: 10.1007/s00284-013-0336-3. [DOI] [PubMed] [Google Scholar]
- 35.Chadchan SB, Singh V, Kommagani R. 2022. Female reproductive dysfunctions and the gut microbiota. J Mol Endocrinol 69:R81–R94. doi: 10.1530/JME-21-0238. [DOI] [PMC free article] [PubMed] [Google Scholar]
- 36.Jeon SJ, Cunha F, Vieira-Neto A, Bicalho RC, Lima S, Bicalho ML, Galvao KN. 2017. Blood as a route of transmission of uterine pathogens from the gut to the uterus in cows. Microbiome 5:109. doi: 10.1186/s40168-017-0328-9. [DOI] [PMC free article] [PubMed] [Google Scholar]
- 37.Di Blasio A, Traversa A, Giacometti F, Chiesa F, Piva S, Decastelli L, Dondo A, Gallina S, Zoppi S. 2019. Isolation of Arcobacter species and other neglected opportunistic agents from aborted bovine and caprine fetuses. BMC Vet Res 15:257. doi: 10.1186/s12917-019-2009-3. [DOI] [PMC free article] [PubMed] [Google Scholar]
- 38.Ferreira S, Queiroz JA, Oleastro M, Domingues FC. 2016. Insights in the pathogenesis and resistance of Arcobacter: a review. Crit Rev Microbiol 42:364–383. doi: 10.3109/1040841X.2014.954523. [DOI] [PubMed] [Google Scholar]
- 39.Bor B, Bedree JK, Shi W, McLean JS, He X. 2019. Saccharibacteria (TM7) in the human oral microbiome. J Dent Res 98:500–509. doi: 10.1177/0022034519831671. [DOI] [PMC free article] [PubMed] [Google Scholar]
- 40.Chiang YR, Wei ST, Wang PH, Wu PH, Yu CP. 2020. Microbial degradation of steroid sex hormones: implications for environmental and ecological studies. Microb Biotechnol 13:926–949. doi: 10.1111/1751-7915.13504. [DOI] [PMC free article] [PubMed] [Google Scholar]
- 41.Mokhtar MH, Giribabu N, Salleh N. 2020. Testosterone decreases the number of implanting embryos, expression of pinopode and L-selectin ligand (MECA-79) in the endometrium of early pregnant rats. Int J Environ Res Public Health 17:2293. doi: 10.3390/ijerph17072293. [DOI] [PMC free article] [PubMed] [Google Scholar]
- 42.Luecke SM, Webb EM, Dahlen CR, Reynolds LP, Amat S. 2022. Seminal and vagino-uterine microbiome and their individual and interactive effects on cattle fertility. Front Microbiol 13:1029128. doi: 10.3389/fmicb.2022.1029128. [DOI] [PMC free article] [PubMed] [Google Scholar]
- 43.Molina NM, Sola-Leyva A, Saez-Lara MJ, Plaza-Diaz J, Tubic-Pavlovic A, Romero B, Clavero A, Mozas-Moreno J, Fontes J, Altmae S. 2020. New opportunities for endometrial health by modifying uterine microbial composition: present or future? Biomolecules 10:593. doi: 10.3390/biom10040593. [DOI] [PMC free article] [PubMed] [Google Scholar]
- 44.Tedeschi LO, Chalupa W, Janczewski E, Fox DG, Sniffen C, Munson R, Kononoff PJ, Boston R. 2008. Evaluation and application of the CPM dairy nutrition model. J Agric Sci 146:171–182. doi: 10.1017/S0021859607007587. [DOI] [Google Scholar]
- 45.Van Nuffel A, Zwertvaegher I, Pluym L, Van Weyenberg S, Thorup VM, Pastell M, Sonck B, Saeys W. 2015. Lameness detection in dairy cows: part 1. How to distinguish between non-lame and lame cows based on differences in locomotion or behavior. Animals (Basel) 5:838–860. doi: 10.3390/ani5030387. [DOI] [PMC free article] [PubMed] [Google Scholar]
- 46.Gibbons J, Haley DB, Higginson Cutler J, Nash C, Zaffino Heyerhoff J, Pellerin D, Adam S, Fournier A, de Passille AM, Rushen J, Vasseur E. 2014. Technical note: a comparison of 2 methods of assessing lameness prevalence in tiestall herds. J Dairy Sci 97:350–353. doi: 10.3168/jds.2013-6783. [DOI] [PubMed] [Google Scholar]
- 47.McDougall S, Macaulay R, Compton C. 2007. Association between endometritis diagnosis using a novel intravaginal device and reproductive performance in dairy cattle. Anim Reprod Sci 99:9–23. doi: 10.1016/j.anireprosci.2006.03.017. [DOI] [PubMed] [Google Scholar]
- 48.Jaureguiberry M, Giuliodori MJ, Mang AV, Madoz LV, Pothmann H, Drillich M, de la Sota RL. 2017. Short communication: Repeat breeder cows with fluid in the uterine lumen had poorer fertility. J Dairy Sci 100:3083–3085. doi: 10.3168/jds.2016-11406. [DOI] [PubMed] [Google Scholar]
- 49.Ribadu AY, Nakao T. 1999. Bovine reproductive ultrasonography: a review. J Reprod Dev 45:13–28. doi: 10.1262/jrd.45.13. [DOI] [Google Scholar]
- 50.Madureira AML, Denis-Robichaud J, Guida TG, Cerri RLA, Vasconcelos JLM. 2022. Association between genomic daughter pregnancy rates and reproductive parameters in Holstein dairy cattle. J Dairy Sci 105:5534–5543. doi: 10.3168/jds.2021-21766. [DOI] [PubMed] [Google Scholar]
- 51.Lima FS, Silvestre FT, Penagaricano F, Thatcher WW. 2020. Early genomic prediction of daughter pregnancy rate is associated with improved reproductive performance in Holstein dairy cows. J Dairy Sci 103:3312–3324. doi: 10.3168/jds.2019-17488. [DOI] [PubMed] [Google Scholar]
- 52.Bisinotto RS, Castro LO, Pansani MB, Narciso CD, Martinez N, Sinedino LD, Pinto TL, Van de Burgwal NS, Bosman HM, Surjus RS, Thatcher WW, Santos JE. 2015. Progesterone supplementation to lactating dairy cows without a corpus luteum at initiation of the Ovsynch protocol. J Dairy Sci 98:2515–2528. doi: 10.3168/jds.2014-9058. [DOI] [PubMed] [Google Scholar]
- 53.Battocchio M, Gabai G, Mollo A, Veronesi MC, Soldano F, Bono G, Cairoli F. 1999. Agreement between ultrasonographic classification of the CL and plasma progesterone concentration in dairy cows. Theriogenology 51:1059–1069. doi: 10.1016/s0093-691x(99)80011-9. [DOI] [PubMed] [Google Scholar]
- 54.Roelofs J, Lopez-Gatius F, Hunter RH, van Eerdenburg FJ, Hanzen C. 2010. When is a cow in estrus? Clinical and practical aspects. Theriogenology 74:327–344. doi: 10.1016/j.theriogenology.2010.02.016. [DOI] [PubMed] [Google Scholar]
- 55.Hoze C, Escouflaire C, Mesbah-Uddin M, Barbat A, Boussaha M, Deloche MC, Boichard D, Fritz S, Capitan A. 2020. Short communication: A splice site mutation in CENPU is associated with recessive embryonic lethality in Holstein cattle. J Dairy Sci 103:607–612. doi: 10.3168/jds.2019-17056. [DOI] [PubMed] [Google Scholar]
- 56.Hafliger IM, Spengeler M, Seefried FR, Drogemuller C. 2022. Four novel candidate causal variants for deficient homozygous haplotypes in Holstein cattle. Sci Rep 12:5435. doi: 10.1038/s41598-022-09403-6. [DOI] [PMC free article] [PubMed] [Google Scholar]
- 57.Katagiri S, Takahashi Y. 2004. Changes in EGF concentrations during estrous cycle in bovine endometrium and their alterations in repeat breeder cows. Theriogenology 62:103–112. doi: 10.1016/j.theriogenology.2003.08.019. [DOI] [PubMed] [Google Scholar]
- 58.Neo S, Takemura-Uchiyama I, Uchiyama J, Murakami H, Shima A, Kayanuma H, Yokoyama T, Takagi S, Kanai E, Hisasue M. 2022. Screening of bacterial DNA in bile sampled from healthy dogs and dogs suffering from liver- or gallbladder-associated disease. J Vet Med Sci 84:1019–1022. doi: 10.1292/jvms.22-0090. [DOI] [PMC free article] [PubMed] [Google Scholar]
- 59.Uchiyama J, Osumi T, Mizukami K, Fukuyama T, Shima A, Unno A, Takemura-Uchiyama I, Une Y, Murakami H, Sakaguchi M. 2022. Characterization of the oral and faecal microbiota associated with atopic dermatitis in dogs selected from a purebred Shiba Inu colony. Lett Appl Microbiol 75:1607–1616. doi: 10.1111/lam.13828. [DOI] [PubMed] [Google Scholar]
- 60.Bolyen E, Rideout JR, Dillon MR, Bokulich NA, Abnet CC, Al-Ghalith GA, Alexander H, Alm EJ, Arumugam M, Asnicar F, Bai Y, Bisanz JE, Bittinger K, Brejnrod A, Brislawn CJ, Brown CT, Callahan BJ, Caraballo-Rodriguez AM, Chase J, Cope EK, Da Silva R, Diener C, Dorrestein PC, Douglas GM, Durall DM, Duvallet C, Edwardson CF, Ernst M, Estaki M, Fouquier J, Gauglitz JM, Gibbons SM, Gibson DL, Gonzalez A, Gorlick K, Guo J, Hillmann B, Holmes S, Holste H, Huttenhower C, Huttley GA, Janssen S, Jarmusch AK, Jiang L, Kaehler BD, Kang KB, Keefe CR, Keim P, Kelley ST, Knights D, et al. 2019. Reproducible, interactive, scalable and extensible microbiome data science using QIIME 2. Nat Biotechnol 37:852–857. doi: 10.1038/s41587-019-0209-9. [DOI] [PMC free article] [PubMed] [Google Scholar]
- 61.Bokulich NA, Kaehler BD, Rideout JR, Dillon M, Bolyen E, Knight R, Huttley GA, Gregory Caporaso J. 2018. Optimizing taxonomic classification of marker-gene amplicon sequences with QIIME 2’s q2-feature-classifier plugin. Microbiome 6:90. doi: 10.1186/s40168-018-0470-z. [DOI] [PMC free article] [PubMed] [Google Scholar]
- 62.Kanehisa M, Sato Y, Kawashima M. 2022. KEGG mapping tools for uncovering hidden features in biological data. Protein Sci 31:47–53. doi: 10.1002/pro.4172. [DOI] [PMC free article] [PubMed] [Google Scholar]
- 63.Russel J, Thorsen J, Brejnrod AD, Bisgaard H, Sørensen SJ, Burmølle M. 2018. DAtest: a framework for choosing differential abundance or expression method. bioRxiv. 241802. doi: 10.1101/241802. [DOI]
- 64.Yoon G, Gaynanova I, Muller CL. 2019. Microbial networks in SPRING—semi-parametric rank-based correlation and partial correlation estimation for quantitative microbiome data. Front Genet 10:516. doi: 10.3389/fgene.2019.00516. [DOI] [PMC free article] [PubMed] [Google Scholar]
- 65.Peschel S, Muller CL, von Mutius E, Boulesteix AL, Depner M. 2021. NetCoMi: network construction and comparison for microbiome data in R. Brief Bioinform 22:bbaa290. doi: 10.1093/bib/bbaa290. [DOI] [PMC free article] [PubMed] [Google Scholar]
Associated Data
This section collects any data citations, data availability statements, or supplementary materials included in this article.
Supplementary Materials
Fig. S1 to S6 and Tables S1 to S8. Download spectrum.04764-22-s0001.pdf, PDF file, 1.1 MB (1.1MB, pdf)
Data Availability Statement
Raw sequence data were deposited in the DNA Data Bank of Japan (DDBJ) sequence read archive (DRA014763) under BioProject no. PRJDB14269.