

Abstract
The evolutionary history of vertebrates is replete with emergence of novel brain morphologies, including the origin of the human brain. Existing model organisms and toolkits for investigating drivers of neuroanatomical innovations have largely proceeded on mammals. As such, a compelling non‐mammalian model system would facilitate our understanding of how unique brain morphologies evolve across vertebrates. Here, we present the domestic chicken breed, white crested Polish chickens, as an avian model for investigating how novel brain morphologies originate. Most notably, these crested chickens exhibit cerebral herniation from anterodorsal displacement of the telencephalon, which results in a prominent protuberance on the dorsal aspect of the skull. We use a high‐density geometric morphometric approach on cephalic endocasts to characterize their brain morphology. Compared with standard white Leghorn chickens (WLCs) and modern avian diversity, the results demonstrate that crested chickens possess a highly variable and unique overall brain configuration. Proportional sizes of neuroanatomical regions are within the observed range of extant birds sampled in this study, but Polish chickens differ from WLCs in possessing a relatively larger cerebrum and smaller cerebellum and medulla. Given their accessibility, phylogenetic proximity, and unique neuroanatomy, we propose that crested breeds, combined with standard chickens, form a promising comparative system for investigating the emergence of novel brain morphologies.
Keywords: domestication, endocasts, Gallus, geometric morphometrics, micro‐CT imaging
High‐density morphometric analysis on brain endocasts of Polish crested chickens demonstrates that this breed exhibits a unique brain configuration that is distinct from not only standard white Leghorn chickens, but also neuroanatomical diversity observed across extant birds. The study underscores the potential of crested chickens, coupled with standard chickens, as a promising comparative model system for exploring mechanisms underpinning the emergence of novel brain morphologies.

1. INTRODUCTION
Vertebrates exhibit incredible diversity in brain morphology—from the elephantine cerebellum of mormyrid electric fishes (Nieuwenhuys & Nicholson, 1967) to the strongly convoluted brains of cetaceans (Marino et al., 2002). Identifying the mechanisms underlying these variations is crucial for understanding how novel brain configurations evolve and how the etiology of brain disorders relates to extreme neuroanatomical variation. Due to their relevance for understanding human origins and disease, brain variation studies have proceeded mainly on mammals, including primate and rodent models. For example, comparative epigenomic studies on primates have found candidate genes associated with neocortical expansion in humans (e.g., Reilly et al., 2015), and knockout and knockdown experiments on rodent models have revealed key genes implicated in brain size (e.g., Florio et al., 2015). Although these findings are crucial, an establishment of compelling non‐mammalian models would facilitate a more holistic understanding of how neuroanatomical novelties originate across vertebrates.
Among vertebrates, extant birds provide an excellent comparative system to mammals due to shared higher cognitive behaviors, gross brain morphologies, and organization of neuronal features (Striedter, 2005). For instance, birds possess highly encephalized brains that are comparable in relative size to many mammalian groups (Butler & Hodos, 2005; Northcutt, 2002). In addition, the avian brain comprises alternating layers of integrated neurons in the pallium (Stacho et al., 2020), high neuronal densities (Olkowicz et al., 2016), expanded cerebra, and a dorsoventrally flexed brain configuration that, at least superficially, collectively resemble features of human brains. Given these neuroanatomical similarities, birds form a suitable non‐mammalian comparative system to study how exceptional brains, like those of primates, develop and have evolved.
Research on existing avian models, most notably the standard domestic chicken (Gallus gallus) and zebra finch (Taeniopygia guttata), has contributed foundational knowledge on brain development, form, and function (e.g., Hauber et al., 2021; Höglund et al., 2020; Kawabe et al., 2015). While these models have yielded important insights, existing focal taxa are distantly related to each other, which could limit the comparability of species due to the enormity of accumulated genetic changes between lineages. Gene knockdown and knockout approaches on these model systems permit targeted examination of genotype–phenotype relationships. However, gross phenotypic effects are often too subtle relative to clade‐wide variation to be broadly informative or too extreme to produce viable and sufficiently neurotypical individuals for further study (Collins et al., 2019). Given these shortcomings, an ideal model for investigating the origins of novel brain morphologies should (i) comprise closely related lineages, minimizing genetic distances; (ii) exhibit disparate brain morphologies, maximizing phenotypic variation; and (iii) be easily obtainable and maintained, promoting accessibility as a model system. Domesticated avian systems fulfill these criteria, often presenting striking variations in cephalic anatomy, including pigeons (Boer et al., 2021; Shapiro et al., 2013) and chickens (Stange et al., 2018). In fact, previous studies have even noted unusual brain configurations in some breeds, including ducks (Cnotka et al., 2008), pigeons (Rehkämper et al., 1988), and chickens (Rehkämper et al., 2003).
Here, we present a modern phenotypic treatment of the brain morphology of Polish crested chickens (PCCs). This domestic chicken breed has been artificially selected for elaborate cranial feathers (Figure 1a), which overlie a bony protuberance on the dorsal aspect of its skull. A “dumbbell”‐shaped brain is associated with these features, where the cerebrum herniates dorsally into the skull roof (Figure 1b,c; Frahm & Rehkämper, 1998)—a phenomenon noted by Darwin (1868). Previous studies have reported on the volumetric differences in the brains of PCCs and white Leghorn chickens (WLCs; Frahm & Rehkämper, 1998; Yoshimura et al., 2012) and alleles linked to this phenotype (Li et al., 2021; Wang et al., 2012; Yoshimura et al., 2012). However, a systematic investigation using modern phenotypic techniques on a robust sampling of this breed has been elusive. Using high‐resolution endocranial reconstructions and geometric morphometric methods, we characterize and test gross neuroanatomical variation in PCC compared with that of WLC and a broad sample of modern avian diversity. By demonstrating the novelty of their brain morphologies, we aim to establish PCCs, coupled with WLCs, as a promising comparative system for exploring mechanisms underpinning the emergence of new brain phenotypes.
FIGURE 1.

Characteristic phenotypes of white crested Polish chickens. (a) A photograph of white crested black Polish chicken showing its elaborate cranial feathers (photographed by Todd L. Green). (b) CT reconstruction of the skull (semi‐transparent) and endocast of an adult white Leghorn chicken. (c) CT reconstruction of the skull (semi‐transparent) and endocast of Polish crested chicken (GGP‐003). CT, computed tomography.
2. MATERIALS AND METHODS
2.1. Specimens and imaging
Skulls Unlimited (Oklahoma City, OK, USA) provided 22 skulls of adult white crested Polish chickens (Table 1) comparable in size to somatically mature WLC. These specimens lacked information on sex or pedigree. To create endocranial reconstructions, we performed micro‐computed tomography (µCT) imaging on these specimens using the Nikon XT H 225 ST scanner at the MicroCT Imaging Consortium for Research and Outreach (MICRO) facility. Scan parameters were selected to optimize image resolution and contrast while considering scan time (Table 1). The sampling for WLC included postnatal developmental series of 14 individuals comprising four hatchlings, two 1‐week‐old, two 3‐week‐old, two 6‐week‐old, and four >8‐week‐old chickens (Table S1). For comparisons with other extant birds, we also included an interspecific sampling of avian endocasts that consists of 37 species in addition to the domesticated chicken breeds (Table S1).
TABLE 1.
List of Polish crested chicken specimens, imaging parameters, and endocranial volumes.
| Specimen ID | CT voltage (kV) | CT current (mA) | Voxel size (μm) | Endocranial volume (mm3) |
|---|---|---|---|---|
| GGP‐001 | 100 | 200 | 42.181 | 2914.23 |
| GGP‐002 | 175 | 79 | 45.598 | 3522.05 |
| GGP‐003 | 175 | 79 | 40.904 | 3300.34 |
| GGP‐004 | 175 | 79 | 40.904 | 3587.34 |
| GGP‐005 | 175 | 79 | 41.879 | 2775.79 |
| GGP‐006 | 175 | 79 | 41.879 | 4155.99 |
| GGP‐007 | 175 | 79 | 40.154 | 3474.50 |
| GGP‐008 | 175 | 79 | 41.879 | 3179.78 |
| GGP‐009 | 175 | 79 | 40.242 | 3362.19 |
| GGP‐010 | 175 | 79 | 40.242 | 3289.04 |
| GGP‐011 | 175 | 79 | 41.911 | 3628.78 |
| GGP‐012 | 175 | 79 | 41.911 | 3162.97 |
| GGP‐013 | 175 | 79 | 41.911 | 3506.18 |
| GGP‐014 | 175 | 79 | 41.911 | 3444.72 |
| GGP‐015 | 175 | 79 | 41.911 | 3099.19 |
| GGP‐016 | 175 | 79 | 43.190 | 3474.20 |
| GGP‐017 | 175 | 79 | 45.617 | 3386.57 |
| GGP‐018 | 175 | 79 | 43.190 | 3206.80 |
| GGP‐019 | 175 | 79 | 41.911 | 3212.96 |
| GGP‐020 | 175 | 79 | 40.232 | 3427.74 |
| GGP‐021 | 175 | 79 | 41.911 | 3328.95 |
| GGP‐022 | 175 | 79 | 41.911 | 3339.12 |
Note: Specimens sampled for the interspecific data are listed in Table S1. Please refer to Balanoff et al. (2013) and Watanabe et al. (2019) for the imaging parameters for the white Leghorn chicken and other avian specimens. Morphometric data of all specimens sampled in this study are available as Supplementary Information.
2.2. Endocranial reconstructions
The CT‐generated image data were imported into Amira v2019.3 (Thermo Fisher Scientific) to create three‐dimensional (3‐D) models of the endocasts (internal mold of the braincase), following the guidelines recommended by Balanoff et al. (2016). The resulting models were exported as Polygon mesh files (PLY) and imported into Geomagic Wrap v2021 (3D Systems) for further processing, including smoothing using its “Quick Smooth” feature. We considered endocasts to closely represent actual brain size and shape, as shown previously for G. gallus domesticus and other extant birds (Iwaniuk & Nelson, 2002; Jerison, 1973; Watanabe et al., 2019; Zusi, 1993). Accordingly, we refer to endocranial regions by the name of the underlying brain feature (e.g., “cerebrum” for the surface impression of the cerebrum and adjacent soft tissue on the endocast).
2.3. Geometric morphometric data
The landmark scheme for this study follows previously published studies (Gold & Watanabe, 2018; Watanabe et al., 2019, 2021). Using the “patch” function in the program Landmark Editor v3.0 (Wiley et al., 2005), we collected high‐density 3‐D coordinate data to characterize the shape of the overall endocast and its major brain regions, including the cerebrum, optic lobe, cerebellum, and medulla (Figure 2). Initially, both the left and right sides of the endocasts were digitized to prevent artifacts related to aligning unilateral landmark data of bilaterally symmetric structures (Cardini, 2016, 2017). With the “geomorph” v4.0.4 (Adams & Otárola‐Castillo, 2013) and “Morpho” v2.10 (Schlager, 2017) R packages, we then performed a generalized Procrustes alignment (Gower, 1975; Rohlf & Slice, 1990) while minimizing total bending energy (Gunz et al., 2005; Gunz & Mitteroecker, 2013) on a pooled dataset that combines the coordinate data from PCCs with those of WLCs and other crown birds from published studies (Watanabe et al., 2019, 2021). Endocranial coordinate data of somatically mature modern birds and a postnatal developmental series of WLCs were obtained from previous studies (Gold & Watanabe, 2018; Watanabe et al., 2021). We included the postnatal developmental series of WLCs to assess whether somatically mature PCC brain morphology remains divergent throughout the ontogeny of WLCs.
FIGURE 2.
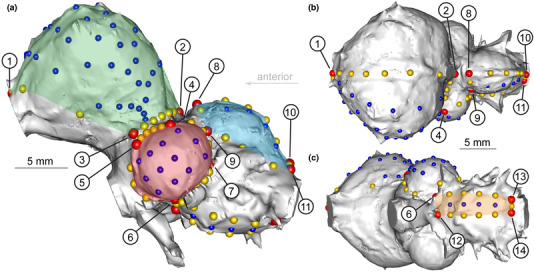
Landmark scheme used in this study in (a) lateral, (b) dorsal, and (c) ventral views on an endocranial reconstruction of Polish crested chicken (specimen GGP‐001). Red, yellow, and blue points denote discrete, curve, and surface (semi‐)landmarks, respectively. Green, red, blue, and orange areas indicate the cerebrum, optic lobe, cerebellum, and medulla, respectively, as characterized in the study. The encircled numbers correspond to the landmark numbers assigned to discrete landmarks, as listed in Table 2.
Centroid size and shape data were extracted from the coordinate data (Supplementary Information). After alignment, (semi‐)landmarks on the right side were removed, resulting in shape data comprising 14 discrete (fixed) landmarks defined anatomically, 49 curve semi‐landmarks that demarcate each brain region, and 56 surface semi‐landmarks to quantify the shape within each region (Table 2; Figure 2; Supplementary Information). In addition to shape data, centroid sizes from coordinate data were used as proxies for absolute brain size, because they are known to be a good approximation (Marugán‐Lobón et al., 2016). We calculated the proportional size of each neuroanatomical region by dividing the centroid size of locally aligned coordinate data of a given region by the sum of centroid sizes of other regions, each locally aligned separately. This approach allows extraction of volumetric measurements based on surface anatomy of endocasts when information on the internal boundaries of brain regions is absent.
TABLE 2.
Landmark scheme used in this study comprising discrete landmarks with curve and surface semi‐landmarks (sLMs).
| Region | Curve sLMs | Surface sLMs | Discrete landmark definition |
|---|---|---|---|
| Cerebrum | 15 | 36 | 1. Anterior‐most median point of the cerebrum on dorsal side |
| 2. Posteromedial point of the cerebrum on dorsal side | |||
| 3. Anteroventral‐most junction (or convergence) point of cerebrum and optic lobe on the cerebral margin | |||
| Optic lobe | 14 | 12 | 4. Dorsal‐most junction point of cerebrum and optic lobe on the optic lobe surface |
|
5. Anteroventral‐most junction (or convergence) point of cerebrum and optic lobe on the optic lobe margin 6. Junction point of optic lobe and dorsal margin of the medulla | |||
| 7. Junction point of optic lobe, cerebellum, and medulla | |||
| Cerebellum | 10 | 4 | 8. Anterior‐most median point of cerebellum on dorsal side |
| 9. Anterolateral points of the cerebellum on the dorsal side | |||
| 10. Posterior‐most median point of the cerebellum on dorsal side | |||
| 11. Posterolateral point of the cerebellum | |||
| Medulla | 10 | 4 | 12. Anterior‐most median point adjacent to midbrain on ventral side |
| 6. (reused) Junction point of optic lobe and medulla | |||
| 13. Posterolateral point of medulla | |||
| 14. Posterior‐most median point of medulla |
Note: Each major neuroanatomical region was characterized by discrete landmarks, curve semi‐landmarks that define the regional boundaries, and surface semi‐landmarks to characterize the shape within each region. The numbers assigned to discrete landmarks correspond to Figure 2.
2.4. Analysis
All statistical analyses were conducted in R (R Core Development Team, 2022). First, we visualized the pattern of endocranial shape variation in PCCs, WLCs, and other birds by constructing morphospaces based on principal components (PC) axes. When comparing size differences between PCCs and other birds, phylogenetically naïve analysis of variance was used to evaluate whether the neuroanatomical variation within PCCs is comparable to the interspecific variation observed across avian diversity. To explicitly test whether the endocranial shape of PCC is different compared with WLC and other modern birds, the procD.lm (Collyer & Adams, 2018) function in the “geomorph” R package (Adams & Otárola‐Castillo, 2013) was used. We measured shape disparity by calculating the Procrustes variance of endocranial shape within each group.
3. RESULTS
3.1. Endocranial size differences
With respect to absolute endocranial size, PCCs are comparable to relatively mature WLC individuals (>8 weeks old), where ranges in mean centroid sizes (dimensionless unit) are 144.9–159.5 and 142.5–153.6 respectively. Although the sample size for mature WLCs is low (n = 4), we performed parametric ANOVA on PCCs and somatically mature WLCs. The results indicate that PCCs exhibit significantly larger proportional size for the cerebrum (R 2 = 0.376; p = 0.009)—although there is overlap among endocasts with the more extreme “dumbbell” shape (Figure 3b). While proportional optic lobe size is comparable to mature WLCs (R 2 = 0.0008; p = 0.67), PCCs possess proportionately smaller cerebellum and medulla (R 2 = 0.011, 0.528; p = 0.002, <0.001 respectively). Some PCC specimens exhibit regional proportional sizes that more closely resemble those of perinatal WLCs (i.e., GGP002 for optic lobe size, GGP005 for medulla size), indicating wide size variation in PCCs even among mature individuals.
FIGURE 3.
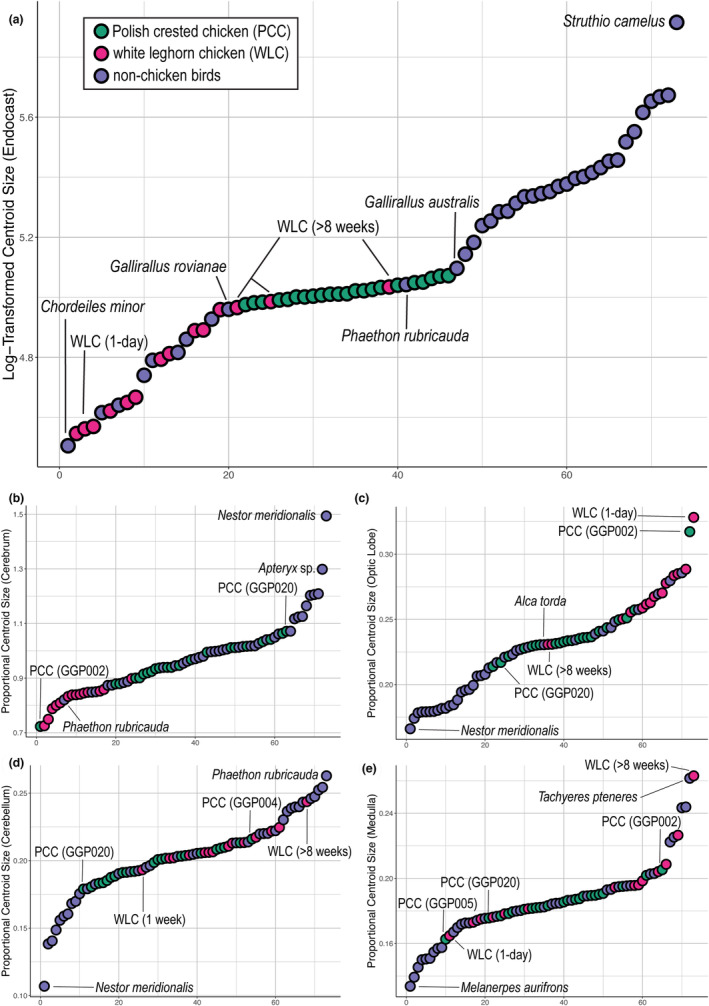
Ranked centroid size data for (a) log‐transformed endocranial size and proportional centroid size of (b) cerebrum, (c) optic lobe, (d) cerebellum, and (e) medulla.
When compared to adult endocranial size of other birds, PCCs show a restricted range of total endocranial size (5.2% of the range across crown birds) that is well within the avian neuroanatomical diversity (Figure 3a). Besides mature WLCs, the rail Gallirallus and the tropicbird Phaethon are closest in size to PCCs (Figure 3a; Supplementary Information). In contrast to overall endocranial size, PCCs collectively show high variability within each neuroanatomical region relative to interspecific variation (Figure 3b–e), where the ranges of proportional sizes encompass 51.8%, 86.3%, 23.7%, and 33.4% of the range in crown birds for the cerebrum, optic lobe, cerebellum, and medulla, respectively. For all regions, the proportional sizes are well within the observed ranges of modern birds.
3.2. Endocranial shape differences
The PC morphospace of endocranial shapes shows that those of PCCs and WLCs are distinct, without overlap along PC1 axis but strong overlap in PC2 values (Figure 4a). This difference, which is mainly along PC1, includes relative anteroposterior elongation of the endocast, dorsoventral position of the cerebrum and cerebellum, mediolateral extent of the optic lobe, and relative anteroposterior position of the medulla. The total endocranial shape differs between adult PCCs and the entire postnatal ontogenetic series of WLCs (R 2 = 0.590; p < 0.001). This outcome provides statistical support for the visual distinction between the endocranial shape of all PCCs and the entire postnatal ontogenetic series of PCCs observed in the morphospace. Notably, the neuroanatomical disparity in PCCs is substantially larger than WLCs, occupying a more expansive area of the morphospace (Procrustes variance = 0.00662 and 0.00394, respectively). This greater variance in PCCs is especially remarkable given that the WLC sampling includes the entire postnatal developmental range. The neuroanatomical breadth in PCCs encompasses the spectrum from the previously reported “dumbbell” shape to a configuration with anteroposteriorly elongated cerebrum. As noted above for size analysis, the sample size of adult WLCs is low, but MANOVAs show that PCCs and adult WLCs possess disparate total endocranial shape (R 2 = 0.407; p < 0.0001), cerebrum shape (R 2 = 0.407; p < 0.0001), optic lobe shape (R 2 = 0.265; p = 0.0002), cerebellum shape (R 2 = 0.163; p = 0.0005), and medulla shape (R 2 = 0.173; p = 0.0004). Therefore, endocranial shape in PCCs, including the major neuroanatomical regions, is distinct relative to WLCs.
FIGURE 4.

Morphospaces constructed from first two principal components (PC) axes of (a) endocranial shape between PCC and WLC; (b) PCC and crown birds; (c) cerebrum shape; (d) optic lobe shape; (e) cerebellum shape; and (f) medulla shape. Inset point cloud images along axes illustrate shape changes associated with PC 1 and 2 axes, colored by brain regions. Inset images of endocranial reconstructions are not to actual scale. PCC, Polish crested chicken; WLC, white Leghorn chicken.
Compared with other modern birds, PCCs show a unique overall brain shape with respect to their endocranial diversity (Figure 4b). While the postnatal series of WLCs lies within areas of the morphospace occupied by extant birds, PCCs generally exhibit distinct morphologies in all four regions that we characterized (Figure 4c–f). In the cerebrum, the dorsal margin is more dorsoventrally convex, and the posterior area is positioned relatively more posteriorly in PCCs compared with other birds, including WLCs (R 2 = 0.427; p < 0.001). The optic lobe in PCCs is more globular than other birds (R 2 = 0.271; p < 0.001). Compared with cerebrum and optic lobe shapes, PCCs show cerebellum and medulla shapes that overlap more strongly with some of the modern birds. In PCCs, the difference in cerebellum shape is associated with possessing a more strongly arched profile dorsoventrally (R 2 = 0.189; p < 0.001), which is a feature shared with other avian species, including Nestor (kea) and all three species of Tachyeres (steamer ducks) sampled in this study. Lastly, the medulla shape in PCCs deviates only slightly from the other birds, where the former exhibit more anteroposteriorly narrow brainstems (R 2 = 0.236; p < 0.001). Along PC1, PCCs overlap most closely with paleognaths (Dromaius, Casuarius, Rhea), Nestor, and Tachyeres.
4. DISCUSSION
4.1. Neuroanatomical novelty in PCCs
The results demonstrate that the overall brain shape of PCCs is unique when compared to both WLCs and modern avian diversity, despite showing high variability. This novelty is primarily due to their characteristic cerebral herniation and “dumbbell”‐shaped brain configuration, which has been noted previously (Darwin, 1868; Frahm & Rehkämper, 1998; Requate, 1959). Our high‐density geometric morphometric approach reveals additional features of PCC brains that are distinct in their co‐occurrence, including the globular optic lobes, more strongly arched dorsal margin of the cerebellum, and posteriorly shifted medulla. Although previous work has identified alleles and gene duplication possibly associated with cerebral herniation in crested fowls (Li et al., 2021; Wang et al., 2012; Yoshimura et al., 2012), the genetic control for neuroanatomical novelty in PCCs is yet to be fully explored. For instance, the genes underlying cerebral herniation in PCCs could have pleiotropic effects on other neuroanatomical regions, as discussed conceptually (e.g., Bruner, 2015; Montgomery et al., 2016) and reported in domestic chickens (Höglund et al., 2020). Alternatively, the “dumbbell” shape could result from the cerebral herniation imposing unique physical interactions between the brain, dura, and skull during development (e.g., Bruner et al., 2015; Fabbri et al., 2017).
In contrast to shape differences, total endocranial sizes in PCCs generally resemble those of mature WLCs and are well within the range observed in other birds. However, proportional sizes of neuroanatomical regions reveal that most PCC individuals exhibit proportionately larger cerebra than WLCs, while their cerebella and medullae are relatively smaller. These regional size differences could be driven by cerebral herniation in PCCs, which—regardless of the mechanism—likely results in coordinated changes in proportional sizes. While our results do not contradict previous studies on crested chickens (Frahm et al., 2001), the size metric used in this study has some limitations. First, because centroid size is based on endocranial surface, it may not necessarily reflect the volume of the underlying brain region. However, the surface area of the impressions of select regions on the avian endocasts (optic lobe, Wulst) was found to correspond closely to their actual brain tissue volumes (Early et al., 2020). As such, we expect our size metric to be an adequate approximation of actual regional brain size. The second limitation of using the sizes of external surfaces is that they are naïve to internal neuroanatomical properties. Although restricted to the telencephalon, a previous study reported differences in the distribution of telencephalic regions between PCC and WLC, as well as in lower neuron density and disordered astrocyte distribution in PCCs (Tao et al., 2020). Whether similar cytoarchitectural differences occur in other neuroanatomical regions decoupled from their proportional sizes is yet to be examined.
4.2. Neuroanatomical variation in PCCs
PCCs have greater endocranial shape variation than the entire postnatal ontogenetic series of WLCs (Figure 4a). Remarkably, this endocranial disparity is comparable to the interspecific variation across avian diversity (Figure 4b). This result parallels the similarity in the amount of skull shape disparity between domesticated dog breeds and wild carnivoran mammals (Drake & Klingenberg, 2010). The variation spans a gradient of brain morphologies, from those with anteroposteriorly elongated cerebra to ones that exemplify the “dumbbell” configuration. This trend in PCCs agrees with a corpus of studies showing that domesticated animals exhibit greater phenotypic variation compared with original stock (Stange et al., 2018; and references therein). Unfortunately, the lack of genealogical and sex information of the PCC samples precludes analysis of PCC‐WLC hybridization and sexual dimorphism as potential factors contributing to the variation. For example, male crested chickens tend to exhibit larger crest and cranial feathers than females (Wang et al., 2012), which raises the possibility of further, extreme neuroanatomical disparities between the sexes.
4.3. PCC as a model system
This study provides a modern, quantitative approach to demonstrate the novelty of brain morphology in PCCs using a robust sample size for this crested breed. By doing so, we aim to underscore the potential of PCCs as a model system for brain evolution and development, especially cerebral expansion mechanisms. This phenomenon has relevance to how the hypertrophied cerebrum in crown birds evolved from dinosaurian ancestors (Balanoff et al., 2013; Ksepka et al., 2020; Watanabe et al., 2021), as well as how neocortical expansion progressed in human brain evolution (Berg et al., 2021; Herculano‐Houzel et al., 2014; Namba et al., 2021; Stacho et al., 2020). Furthermore, the results of high‐density shape analysis support the utility of PCCs as a model for untangling factors leading to accelerated neuroanatomical changes, especially within a short evolutionary timeline. A comprehensive historical study proposed that chicken domestication first occurred around ~1650 to 1250 B.C.E. (Peters et al., 2022). This conclusion implies that PCCs and WLCs diverged well within ~3500 years ago, with the earliest archeological evidence of crested breeds from fourth century C.E. (Brothwell, 1979). Because PCCs are closely related to WLCs, the wealth of molecular toolkits already available for WLCs (e.g., antibodies, CRISPR) is expected to work on PCCs, amplifying their utility as a model organism. Taken together, we propose PCCs and WLCs as a promising, closely related, and accessible model system for exploring mechanisms underpinning the emergence of novel brain morphologies.
AUTHOR CONTRIBUTIONS
Akinobu Watanabe and Paul M. Gignac conceived the ideas and designed the methodology. Akinobu Watanabe, Sylvia S. Marshall, and Paul M. Gignac collected the data. Akinobu Watanabe and Sylvia S. Marshall analyzed the data. Akinobu Watanabe and Sylvia S. Marshall led the writing of the manuscript. All authors contributed critically to the drafts and gave final approval for publication.
CONFLICT OF INTEREST STATEMENT
The authors declare no conflict of interest.
Supporting information
Data S1.
Data S2.
Table S1.
ACKNOWLEDGEMENTS
The authors thank Michelle Hayer (formerly at Skulls Unlimited) for skulls of Polish crested chickens; Manon Wilson, and Lyndon Colvin (MICRO Facility, University of Arkansas, Fayetteville) for CT imaging; Kelsi Hurdle (Visualization Center, New York Institute of Technology) for CT segmentation assistance; Todd L. Green for helpful discussions and providing and permitting the use of photographs of Polish crested chickens; Brian Marshall for assistance with coding; and two anonymous reviewers for providing helpful comments that improved the quality of the article. This study was funded by the National Science Foundation (IOS‐2045466, DEB‐1406849 to A.W.; DEB‐1457180 to P.M.G.), New York Institute of Technology College of Osteopathic Medicine (startup funds to A.W., Summer Research Program to S.S.M.), the Oklahoma State University Center for Health Sciences (to P.M.G.), and the University of Arizona College of Medicine (to P.M.G.).
Watanabe, A. , Marshall, S.S. & Gignac, P.M. (2023) Dumbbell‐shaped brains of Polish crested chickens as a model system for the evolution of novel brain morphologies. Journal of Anatomy, 243, 421–430. Available from: 10.1111/joa.13883
Akinobu Watanabe and Sylvia S. Marshall contributed equally to the work.
DATA AVAILABILITY STATEMENT
The data used for the study has been uploaded as a supplementary file.
REFERENCES
- Adams, D.C. & Otárola‐Castillo, E. (2013) geomorph: an R package for the collection and analysis of geometric morphometric shape data. Methods in Ecology and Evolution, 4(4), 393–399. Available from: 10.1111/2041-210X.12035 [DOI] [Google Scholar]
- Balanoff, A.M. , Bever, G.S. , Colbert, M.W. , Clarke, J.A. , Field, D.J. , Gignac, P.M. et al. (2016) Best practices for digitally constructing endocranial casts: examples from birds and their dinosaurian relatives. Journal of Anatomy, 229(2), 173–190. [DOI] [PMC free article] [PubMed] [Google Scholar]
- Balanoff, A.M. , Bever, G.S. , Rowe, T.B. & Norell, M.A. (2013) Evolutionary origins of the avian brain. Nature, 501(7465), 93–96. Available from: 10.1038/nature12424 [DOI] [PubMed] [Google Scholar]
- Berg, J. , Sorensen, S.A. , Ting, J.T. , Miller, J.A. , Chartrand, T. , Buchin, A. et al. (2021) Human neocortical expansion involves glutamatergic neuron diversification. Nature, 598(7879), 151–158. Available from: 10.1038/s41586-021-03813-8 [DOI] [PMC free article] [PubMed] [Google Scholar]
- Boer, E.F. , Van Hollebeke, H.F. , Maclary, E.T. , Holt, C. , Yandell, M. & Shapiro, M.D. (2021) A ROR2 coding variant is associated with craniofacial variation in domestic pigeons. Current Biology, 31(22), 5069–5076.e5. Available from: 10.1016/j.cub.2021.08.068 [DOI] [PMC free article] [PubMed] [Google Scholar]
- Brothwell, D. (1979) Roman evidence of a crested form of domestic fowl, as indicated by a skull showing associated cerebral hernia. Journal of Archaeological Science, 6(3), 291–293. Available from: 10.1016/0305-4403(79)90007-4 [DOI] [Google Scholar]
- Bruner, E. (2015) Functional craniology and brain evolution. In: Bruner, E. (Ed.) Human Paleoneurology, Vol. 3. Cham: Springer, pp. 57–94. [Google Scholar]
- Bruner, E. , Amano, H. , de la Cuétara, J.M. & Ogihara, N. (2015) The brain and the braincase: a spatial analysis on the midsagittal profile in adult humans. Journal of Anatomy, 227(3), 268–276. Available from: 10.1111/joa.12355 [DOI] [PMC free article] [PubMed] [Google Scholar]
- Butler, A.B. & Hodos, W. (2005) Comparative vertebrate neuroanatomy: evolution and adaptation. Hoboken: Wiley‐Interscience. [Google Scholar]
- Cardini, A. (2016) Lost in the other half: improving accuracy in geometric morphometric analyses of one side of bilaterally symmetric structures. Systematic Biology, 65(6), 1096–1106. Available from: 10.1093/sysbio/syw043 [DOI] [PubMed] [Google Scholar]
- Cardini, A. (2017) Left, right or both? Estimating and improving accuracy of one‐side‐only geometric morphometric analyses of cranial variation. Journal of Zoological Systematics and Evolutionary Research, 55(1), 1–10. Available from: 10.1111/jzs.12144 [DOI] [Google Scholar]
- Cnotka, J. , Tiemann, I. , Frahm, H.D. & Rehkämper, G. (2008) Unusual brain composition in Crested Ducks (Anas platyrhynchos f.d.)‐including its effect on behavior and genetic transmission. Brain Research Bulletin, 76(3), 324–328. Available from: 10.1016/j.brainresbull.2008.03.009 [DOI] [PubMed] [Google Scholar]
- Collins, S.C. , Mikhaleva, A. , Vrcelj, K. , Vancollie, V.E. , Wagner, C. , Demeure, N. et al. (2019) Large‐scale neuroanatomical study uncovers 198 gene associations in mouse brain morphogenesis. Nature Communications, 10(1), 1–12. Available from: 10.1038/s41467-019-11431-2 [DOI] [PMC free article] [PubMed] [Google Scholar]
- Collyer, M.L. & Adams, D.C. (2018) RRPP: an R package for fitting linear models to high‐dimensional data using residual randomization. Methods in Ecology and Evolution, 9(7), 1772–1779. Available from: 10.1111/2041-210X.13029 [DOI] [Google Scholar]
- Darwin, C. (1868) The variation of animals and plants under domestication. London: Murray. [Google Scholar]
- Drake, A.G. & Klingenberg, C.P. (2010) Large‐scale diversification of skull shape in domestic dogs: disparity and modularity. American Naturalist, 175(3), 289–301. Available from: 10.1086/650372 [DOI] [PubMed] [Google Scholar]
- Early, C.M. , Iwaniuk, A.N. , Ridgely, R.C. & Witmer, L.M. (2020) Endocast structures are reliable proxies for the sizes of corresponding regions of the brain in extant birds. Journal of Anatomy, 237(6), 1162–1176. Available from: 10.1111/joa.13285 [DOI] [PMC free article] [PubMed] [Google Scholar]
- Fabbri, M. , Mongiardino Koch, N. , Pritchard, A.C. , Hanson, M. , Hoffman, E. , Bever, G.S. et al. (2017) The skull roof tracks the brain during the evolution and development of reptiles including birds. Nature Ecology and Evolution, 1(10), 1543–1550. Available from: 10.1038/s41559-017-0288-2 [DOI] [PubMed] [Google Scholar]
- Florio, M. , Albert, M. , Taverna, E. , Namba, T. , Brandl, H. , Lewitus, E. et al. (2015) Human‐specific gene ARHGAP11B promotes basal progenitor amplification and neocortex expansion. Science, 347(6229), 1465–1470. Available from: 10.1126/science.aaa1975 [DOI] [PubMed] [Google Scholar]
- Frahm, H. & Rehkämper, G. (1998) Allometric comparison of the brain and brain structures in the white crested Polish chicken with uncrested domestic chicken breeds. Brain, Behavior and Evolution, 52(6), 292–307. Available from: 10.1159/000006574 [DOI] [PubMed] [Google Scholar]
- Frahm, H.D. , Rehkämper, G. & Werner, C.W. (2001) Brain alterations in crested versus non‐crested breeds of domestic ducks (Anas platyrhynchos f.d.). Poultry Science, 80(9), 1249–1257. Available from: 10.1093/ps/80.9.1249 [DOI] [PubMed] [Google Scholar]
- Gold, M.E.L. & Watanabe, A. (2018) Flightless birds are not neuroanatomical analogs of non‐avian dinosaurs. BMC Evolutionary Biology, 18(190), 1–11. Available from: 10.1186/s12862-018-1312-0 [DOI] [PMC free article] [PubMed] [Google Scholar]
- Gower, J.C. (1975) Generalized Procrustes analysis. Psychometrika, 40(1), 33–51. Available from: 10.1007/BF02291478 [DOI] [Google Scholar]
- Gunz, P. & Mitteroecker, P. (2013) Semilandmarks: a method for quantifying curves and surfaces. Hystrix, 24(1), 103–109. Available from: 10.4404/hystrix-24.1-6292 [DOI] [Google Scholar]
- Gunz, P. , Mitteroecker, P. & Bookstein, F.L. (2005) Semilandmarks in three dimensions. In: Slice, D.E. (Ed.) Modern morphometrics in physical anthropology. Amsterdam: Kluwer Academic/Plenum Publishers, pp. 73–98. [Google Scholar]
- Hauber, M.E. , Louder, M.I. & Griffith, S.C. (2021) The natural history of model organisms neurogenomic insights into the behavioral and vocal development of the zebra finch. eLife, 10, 1–19. Available from: 10.7554/eLife.61849 [DOI] [PMC free article] [PubMed] [Google Scholar]
- Herculano‐Houzel, S. , Manger, P.R. & Kaas, J.H. (2014) Brain scaling in mammalian evolution as a consequence of concerted and mosaic changes in numbers of neurons and average neuronal cell size. Frontiers in Neuroanatomy, 8(77), 1–28. Available from: 10.3389/fnana.2014.00077 [DOI] [PMC free article] [PubMed] [Google Scholar]
- Höglund, A. , Strempfl, K. , Fogelholm, J. , Wright, D. & Henriksen, R. (2020) The genetic regulation of size variation in the transcriptome of the cerebrum in the chicken and its role in domestication and brain size evolution. BMC Genomics, 21(1), 1–11. Available from: 10.1186/s12864-020-06908-0 [DOI] [PMC free article] [PubMed] [Google Scholar]
- Iwaniuk, A.N. & Nelson, J.E. (2002) Can endocranial volume be used as an estimate of brain size in birds? Canadian Journal of Zoology, 80(1), 16–23. [Google Scholar]
- Jerison, H.J. (1973) Evolution of the brain and intelligence. New York: Academic Press. [Google Scholar]
- Kawabe, S. , Matsuda, S. , Tsunekawa, N. & Endo, H. (2015) Ontogenetic shape change in the chicken brain: implications for paleontology. PLoS One, 10(6), e0129939. Available from: 10.1371/journal.pone.0129939 [DOI] [PMC free article] [PubMed] [Google Scholar]
- Ksepka, D.T. , Balanoff, A.M. , Smith, N.A. , Bever, G.S. , Bhullar, B.‐A.S. , Bourdon, E. et al. (2020) Tempo and pattern of avian brain size evolution. Current Biology, 30(11), 2026–2036. Available from: 10.1016/j.cub.2020.03.060 [DOI] [PubMed] [Google Scholar]
- Li, J. , Lee, M.O. , Davis, B.W. , Wu, P. , Li, S.M.H. , Chuong, C.M. et al. (2021) The crest phenotype in domestic chicken is caused by a 197 bp duplication in the intron of HOXC10. G3: Genes, Genomes, Genetics, 11(2), jkaa048. Available from: 10.1093/G3JOURNAL/JKAA048 [DOI] [PMC free article] [PubMed] [Google Scholar]
- Marino, L. , Sudheimer, K.D. , Pabst, D.A. , McLellan, W.A. , Filsoof, D. & Johnson, J.I. (2002) Neuroanatomy of the common dolphin (Delphinus delphis) as revealed by magnetic resonance imaging (MRI). Anatomical Record, 268(4), 411–429. Available from: 10.1002/ar.10181 [DOI] [PubMed] [Google Scholar]
- Marugán‐Lobón, J. , Watanabe, A. & Kawabe, S. (2016) Studying avian encephalization with geometric morphometrics. Journal of Anatomy, 229(2), 191–203. Available from: 10.1111/joa.12476 [DOI] [PMC free article] [PubMed] [Google Scholar]
- Montgomery, S.H. , Mundy, N.I. & Barton, R.A. (2016) Brain evolution and development: adaptation, allometry and constraint. Proceedings of the Royal Society B: Biological Sciences, 283(1838), 20160433. Available from: 10.1098/rspb.2016.0433 [DOI] [PMC free article] [PubMed] [Google Scholar]
- Namba, T. , Nardelli, J. , Gressens, P. & Huttner, W.B. (2021) Metabolic regulation of neocortical expansion in development and evolution. Neuron, 109(3), 408–419. Available from: 10.1016/j.neuron.2020.11.014 [DOI] [PubMed] [Google Scholar]
- Nieuwenhuys, R. & Nicholson, C. (1967) Cerebellum of mormyrids. Nature, 215, 764–765. [DOI] [PubMed] [Google Scholar]
- Northcutt, R.G. (2002) Understanding vertebrate brain evolution. Integrative and Comparative Biology, 42, 743–756. Available from: 10.1093/icb/42.4.743 [DOI] [PubMed] [Google Scholar]
- Olkowicz, S. , Kocourek, M. , Lučan, R.K. , Porteš, M. , Fitch, W.T. , Herculano‐Houzel, S. et al. (2016) Birds have primate‐like numbers of neurons in the forebrain. Proceedings of the National Academy of Sciences of the United States of America, 113(26), 7255–7260. Available from: 10.1073/pnas.1517131113 [DOI] [PMC free article] [PubMed] [Google Scholar]
- Peters, J. , Lebrasseur, O. , Irving‐Pease, E.K. , Paxinos, P.D. , Best, J. , Smallman, R. et al. (2022) The biocultural origins and dispersal of domestic chickens. Proceedings of the National Academy of Sciences of the United States of America, 119(24), 1–9. Available from: 10.1073/pnas.2121978119 [DOI] [PMC free article] [PubMed] [Google Scholar]
- R Core Development Team . (2022) R: a language and environment for statistical computing. Vienna, Austria: R Foundation for Statistical Computing. https://www.r‐project.org [Google Scholar]
- Rehkämper, G. , Haase, E. & Frahm, H.D. (1988) Allometric comparison of brain weight and brain structure volumes in different breeds of the domestic pigeon, Columba livia f.d.(Fantails, Homing Pigeons, Strassers). Brain, Behavior and Evolution, 31(3), 141–149. Available from: 10.1159/000116581 [DOI] [PubMed] [Google Scholar]
- Rehkämper, G. , Kart, E. , Frahm, H.D. & Werner, C.W. (2003) Discontinuous variability of brain composition among domestic chicken breeds. Brain, Behavior and Evolution, 61(2), 59–69. Available from: 10.1159/000069352 [DOI] [PubMed] [Google Scholar]
- Reilly, S.K. , Yin, J. , Ayoub, A.E. , Emera, D. , Leng, J. , Cotney, J. et al. (2015) Evolutionary changes in promoter and enhancer activity during human corticogenesis. Science, 347(6226), 1155–1159. [DOI] [PMC free article] [PubMed] [Google Scholar]
- Requate, H. (1959) Federhauben bei Vögeln. Eine genetische und entwicklungsphysiologische Studie zum Problem der Parallelbildungen. Zeitschrift für Wissenschaftliche Zoologie, 162, 191–313. [Google Scholar]
- Rohlf, F.J. & Slice, D.E. (1990) Extensions of the Procrustes method for the optimal superimposition of landmarks. Systematic Biology, 39(1), 40–59. [Google Scholar]
- Schlager, S. (2017) Morpho and Rvcg ‐ shape analysis in R: R‐packages for geometric morphometrics, shape analysis and surface manipulations. In: Zhen, G. , Li, S. & Szekely, G. (Eds.) Statistical shape and deformation analysis: methods, implementation and applications. Cambridge, MA: Academic Press, pp. 217–256. [Google Scholar]
- Shapiro, M.D. , Kronenberg, Z. , Li, C. , Domyan, E.T. , Pan, H. , Campbell, M. et al. (2013) Genomic diversity and evolution of the head crest in the rock pigeon. Science, 339(6123), 1063–1067. Available from: 10.1126/science.1230422 [DOI] [PMC free article] [PubMed] [Google Scholar]
- Stacho, M. , Herold, C. , Rook, N. , Wagner, H. , Axer, M. , Amunts, K. et al. (2020) A cortex‐like canonical circuit in the avian forebrain. Science, 369(6511), eabc5534. Available from: 10.1126/science.abc5534 [DOI] [PubMed] [Google Scholar]
- Stange, M. , Núñez‐León, D. , Sánchez‐Villagra, M.R. , Jensen, P. & Wilson, L.A.B. (2018) Morphological variation under domestication: how variable are chickens? Royal Society Open Science, 5(8), 180993. Available from: 10.1098/rsos.180993 [DOI] [PMC free article] [PubMed] [Google Scholar]
- Striedter, G.F. (2005) Principles of brain evolution. Sunderland: Sinauer Associates. [Google Scholar]
- Tao, Y. , Zhou, X. , Zheng, X. , Li, S. & Mou, C. (2020) Deciphering the forebrain disorder in a chicken model of cerebral hernia. Genes, 11(9), 1–20. Available from: 10.3390/genes11091008 [DOI] [PMC free article] [PubMed] [Google Scholar]
- Wang, Y. , Gao, Y. , Imsland, F. , Gu, X. , Feng, C. , Liu, R. et al. (2012) The crest phenotype in chicken is associated with ectopic expression of HOXC8 in cranial skin. PLoS One, 7(4), e34012. Available from: 10.1371/journal.pone.0034012 [DOI] [PMC free article] [PubMed] [Google Scholar]
- Watanabe, A. , Balanoff, A.M. , Gignac, P.M. , Gold, M.E. & Norell, M.A. (2021) Novel neuroanatomical integration and scaling define avian brain shape evolution and development. eLife, 10, e68809. Available from: 10.1101/2021.04.20.440700 [DOI] [PMC free article] [PubMed] [Google Scholar]
- Watanabe, A. , Gignac, P.M. , Balanoff, A.M. , Green, T.L. , Kley, N.J. & Norell, M.A. (2019) Are endocasts good proxies for brain size and shape in archosaurs throughout ontogeny? Journal of Anatomy, 234(3), 291–305. Available from: 10.1111/joa.12918 [DOI] [PMC free article] [PubMed] [Google Scholar]
- Wiley, D.F. , Amenta, N. , Alcantara, D.A. , Ghosh, D. , Kil, Y.J. , Delson, E. et al. (2005) Landmark Editor (3.6). graphics.idav.ucdavis.edu/research?EvoMorph
- Yoshimura, K. , Kinoshita, K. , Mizutani, M. , Matsuda, Y. & Saito, N. (2012) Inheritance and developmental pattern of cerebral hernia in the crested Polish chicken. Journal of Experimental Zoology Part B: Molecular and Developmental Evolution, 318(8), 613–620. Available from: 10.1002/jez.b.22464 [DOI] [PubMed] [Google Scholar]
- Zusi, R.L. (1993) Patterns of diversity in the avian skull. In: Hanken, J. & Hall, B.K. (Eds.) The skull: patterns of structural and systematic diversity, volume 2. Chicago: The University of Chicago Press, pp. 391–437. [Google Scholar]
Associated Data
This section collects any data citations, data availability statements, or supplementary materials included in this article.
Supplementary Materials
Data S1.
Data S2.
Table S1.
Data Availability Statement
The data used for the study has been uploaded as a supplementary file.