Abstract
Breast cancer is a heterogeneous disease with diverse prognosis and treatment outcomes. Current gene signatures for prognostic prediction are limited to specific subtypes of breast cancer. Cellular senescence is a state of irreversible cell cycle arrest that affects various physiological and pathological processes. This study aimed to develop and validate a senescence-related signature for predicting the prognosis of breast cancer patients. We retrieved 744 senescence-associated genes from the SeneQuest database and analyzed their expression profiles in 2 large datasets of breast cancer patients: The Cancer Genome Atlas (TCGA) and the Molecular Taxonomy of Breast Cancer International Consortium (METABRIC). We used univariate Cox regression analysis, least absolute shrinkage and selection operator (LASSO) regression, and multivariate Cox regression analysis to derive a 29-gene senescence-related risk signature. The risk signature was significantly associated with disease-specific survival (DSS), clinical characteristics, molecular subtypes, and immune checkpoint genes expressions in both datasets. The risk signature also stratified high-risk and low-risk patients within the same clinical stage and molecular subtype. The risk signature was an independent prognostic factor for breast cancer patients. The senescence-related signature may be a useful biomarker for predicting prognosis and immunotherapy response of breast cancer patients. The risk signature may also guide adjuvant chemotherapy decisions, especially in hormone receptor positive (HR+) and human epidermal growth factor receptor type 2 (HER2)− subtypes.
Keywords: bioinformatics, breast cancer, prognosis, senescence
1. Introduction
Breast cancer is the most common cancer among women worldwide, but its prognosis varies widely depending on the molecular subtype, clinical stage, and treatment response. Current methods for predicting the prognosis of breast cancer patients are based on gene signatures, such as the 21-gene and 70-gene assays.[1,2] The 21-gene signature test, also known as Oncotype DX, analyzes the expression of 21 genes. These genes are related to tumor proliferation, estrogen receptor (ER) signaling, and human epidermal growth factor receptor type 2 (HER2) amplification. The test is primarily used in hormone receptor-positive (HR+), HER2− breast cancer patients to identify those who are at low risk of recurrence and can be spared from unnecessary chemotherapy.[3,4] The 70-gene signature test, also known as MammaPrint, analyzes the expression of 70 genes associated with tumor invasion and proliferation. It is primarily used to identify early-stage breast cancer patients who have a high risk of recurrence and may benefit from additional chemotherapy.[5,6] Although these risk signatures have proven prognostic value, they only apply to a subset of patients with HR+/HER2−/LN− breast cancers. There is a lack of effective prognostic prediction methods for patients with other subtypes of breast cancer, especially those who may benefit from immunotherapy. Immunotherapy is a promising strategy that harnesses the power of the immune system to fight cancer cells. However, not all patients respond well to immunotherapy, and some may even experience adverse effects. Therefore, there is a need to identify biomarkers that can predict the response and outcome of immunotherapy in breast cancer patients. One potential source of biomarkers is the cellular senescence process, which is a state of irreversible cell cycle arrest that can affect various aspects of tumor biology and the immune microenvironment.[7–12]
In this study, we aimed to investigate the role of senescence in the prognosis of breast cancer and its association with immunotherapy response. We retrieved genes related to senescence from a database called SeneQuest[9] and analyzed their expression profiles in 2 large datasets of breast cancer patients: The Cancer Genome Atlas (TCGA) and the Molecular Taxonomy of Breast Cancer International Consortium (METABRIC). We developed a senescence-related risk signature that stratified patients into high-risk or low-risk groups based on their disease-specific survival (DSS). We also explored the relationship between this risk signature and various clinical characteristics, molecular subtypes, and immune checkpoint expression in breast cancer patients.
2. Materials and methods
2.1. Datasets
The data on tumor gene expression and clinical parameters of 1091 patients from the TCGA breast cancer project were retrieved from the UCSC Xena browser (http://xena.ucsc.edu/). To reduce the impact of varying sample collection methods, we only included samples with “01A” at the 14th to 16th digits of the TCGA barcode, resulting in the inclusion of 1072 primary breast cancer samples. In addition, we obtained microarray-based tumor gene expression data and clinical information of 1904 patients from the METABRIC dataset[13] via cBioPortal (http://www.cbioportal.org/). Supplemental Digital Content (Table S1, http://links.lww.com/MD/I967) provides a summary of the patients’ information from these 2 datasets.
2.2. Consensus clustering
Breast tissue-specific genes were obtained by accessing the user interface of SeneQuest (http://senequest.net/), and a total of 744 senescence-associated genes were extracted for further analysis (see Supplemental Digital Content (Table S2, http://links.lww.com/MD/I968) for details). The top 50% most variable genes were used for the consensus clustering analysis, which was carried out using the R package “ConsensusClusterPlus”[14] in R language v4.0. The generated graphics were also produced using this package.
2.3. Construction of risk signature
First, the TCGA datasets were randomly divided into training and validation data sets in a 7:3 ratio. After univariate Cox regression analysis, 57 genes related to the DSS status of breast cancer patients in the training dataset were obtained, and the least absolute shrinkage and selection operator (LASSO) was used to exclude less informative genes. Finally, the weight of each gene was calculated using multivariate Cox regression analysis. The risk signature formula is as follows:
The exp is the expression level of gene i, while the coef means its regression coefficient.
Cox regression analysis was performed using the R package “survival,” and LASSO analysis was performed using the R package “glmnet.”[15]
2.4. Bioinformatics and statistical analysis
The statistical analysis in this study was performed using R language, version 4.0. Various statistical tests were used for different analyses, such as Student t test for comparing risk scores between subgroups of patients, chi-square test for comparing differences in clinicopathological characteristics between groups of patients, K-M curve analysis for evaluating differences in DSS between subgroups, univariate and multivariate Cox regression analyses for testing independent prognostic factors, and time-dependent receiver operating curve analysis for assessing the performance of the prognostic risk signature using the “timeROC” R package.[16] Differential gene expression analysis was performed using the “limma” R package,[17] and gene set enrichment analysis was performed using the “ClusterProfiler” R package.[18]
3. Results and discussion
3.1. Senescence-associated genes correlated with clinical features of breast cancer patients
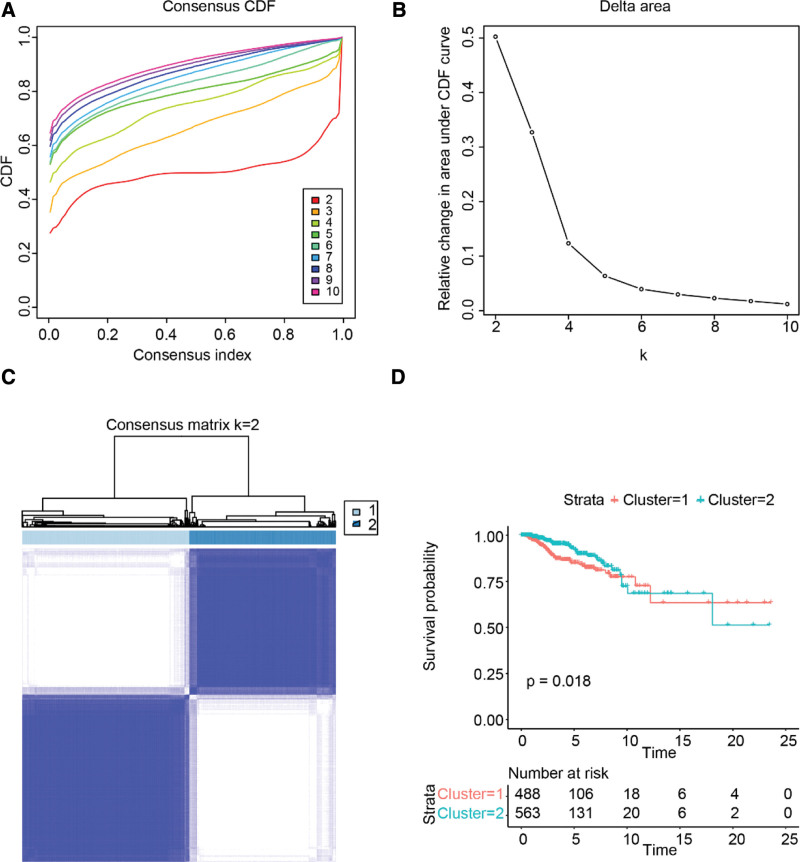
First, we clustered breast cancer samples according to the expression level of senescence-related genes. The results showed that the breast cancer patients in TCGA can be divided into different subgroups by senescence-related genes. The cumulative distribution function and consensus matrix showed that the consensus and cluster confidence were the highest when the number of subgroups, k, equaled 2 (as shown in Fig. 1A–C). Furthermore, the K-M survival analysis revealed that the disease-free survival rate of cluster 1 was significantly lower than that of cluster 2, as illustrated in Figure 1D.
Figure 1.
Consensus clustering of TCGA breast cancer patients by senescence-related genes. (A) Plot of CDF. (B) Area under the CDF curve. (C) Heatmap of the consensus matrix for k = 2. (D) Kaplan–Meier survival curve. CDF = cumulative distribution function, TCGA = The Cancer Genome Atlas.
As shown in Table 1, cluster 2 had more patients with HR+ breast cancer, while cluster 1 had more patients with basal-like and HER2+ breast cancers. Moreover, patients in cluster 1 tended to have a higher American Joint Committee on Cancer stage than those in cluster 2. We performed the same analysis on patients from the METABRIC dataset and obtained similar results (Supplemental Digital Content (Fig. S1a–d, http://links.lww.com/MD/I969 and Table S3, http://links.lww.com/MD/I970)). These results indicated that senescence-related genes were significantly associated with the clinical features of breast cancer.
Table 1.
Characteristics of patients in cluster 1 and cluster 2 in the TCGA dataset.
| Characteristics | N | Cluster 1 | Cluster 2 | P value |
|---|---|---|---|---|
| Total cases | 1072 | 501 | 571 | |
| Age (yr) | .31 | |||
| >50 | 780 | 357 | 423 | |
| ≤50 | 291 | 144 | 147 | |
| NA | 1 | 0 | 1 | |
| Subtype | <.001 | |||
| Luminal A | 413 | 36 | 377 | |
| Luminal B | 185 | 142 | 43 | |
| HER2+ | 66 | 56 | 10 | |
| Basal-like | 136 | 136 | 0 | |
| Normal-like | 22 | 9 | 13 | |
| NA | 250 | 122 | 128 | |
| Node status | .739 | |||
| Negative | 375 | 147 | 201 | |
| Positive | 397 | 190 | 207 | |
| NA | 300 | 137 | 163 | |
| Stage | <.001 | |||
| I | 176 | 58 | 118 | |
| II | 608 | 310 | 298 | |
| III | 246 | 127 | 129 | |
| IV | 20 | 12 | 8 | |
| NA | 22 | 4 | 18 |
HER2 = Human Epidermal Growth Factor Receptor Type 2, TCGA = The Cancer Genome Atlas.
3.2. Establishment of a 29-gene risk signature
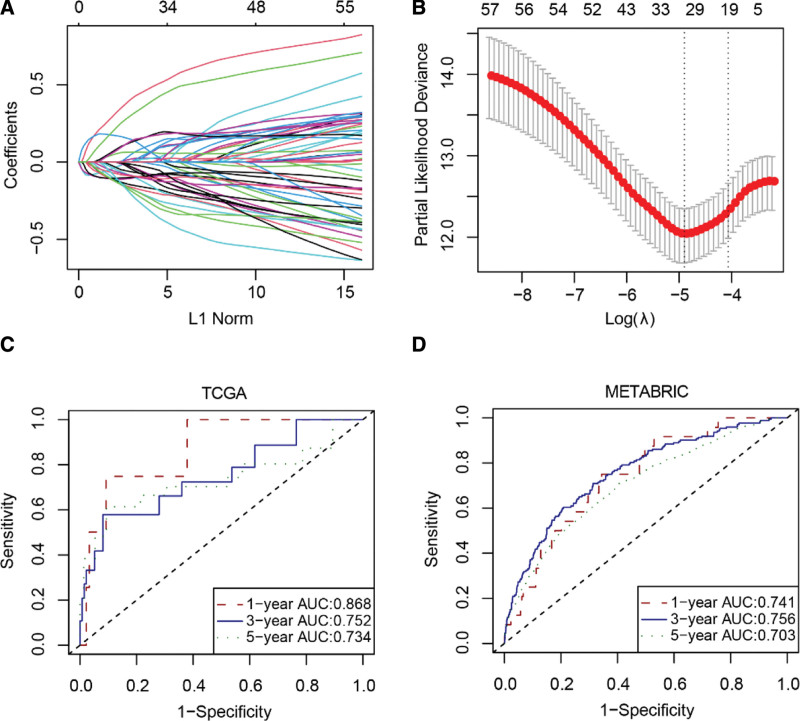
To better predict the prognosis of patients with breast cancer, a risk signature was constructed, composed of 29 senescence-related genes (Supplemental Digital Content (Table S4, http://links.lww.com/MD/I971)) (Fig. 2A and B). The area under the curve (AUC) values at 1 year, 3 years, and 5 years were calculated for the TCGA training dataset and yielded values of 0.940, 0.894, and 0.887, respectively (Supplemental Digital Content (Fig. S2, http://links.lww.com/MD/I972)). For the TCGA validation dataset, AUC values were 0.868, 0.752, and 0.734, respectively (Fig. 2C). In the external dataset METABRIC, AUC values were 0.741, 0.756, and 0.703, respectively (Fig. 2D). These results suggest that the risk signature, constructed based on the expression levels of senescence-related genes, demonstrated a good ability to discriminate the DSS status of patients with breast cancer.
Figure 2.
Construction of a senescence-related risk signature. (A) Plot of nonzero coefficients. (B) Cross-validation curve. (C–D) Receiver operating characteristic curve. AUC = area under the curve, METABRIC = Molecular Taxonomy of Breast Cancer International Consortium, TCGA = The Cancer Genome Atlas.
3.3. The risk signature was related to the clinical characteristics of breast cancer patients
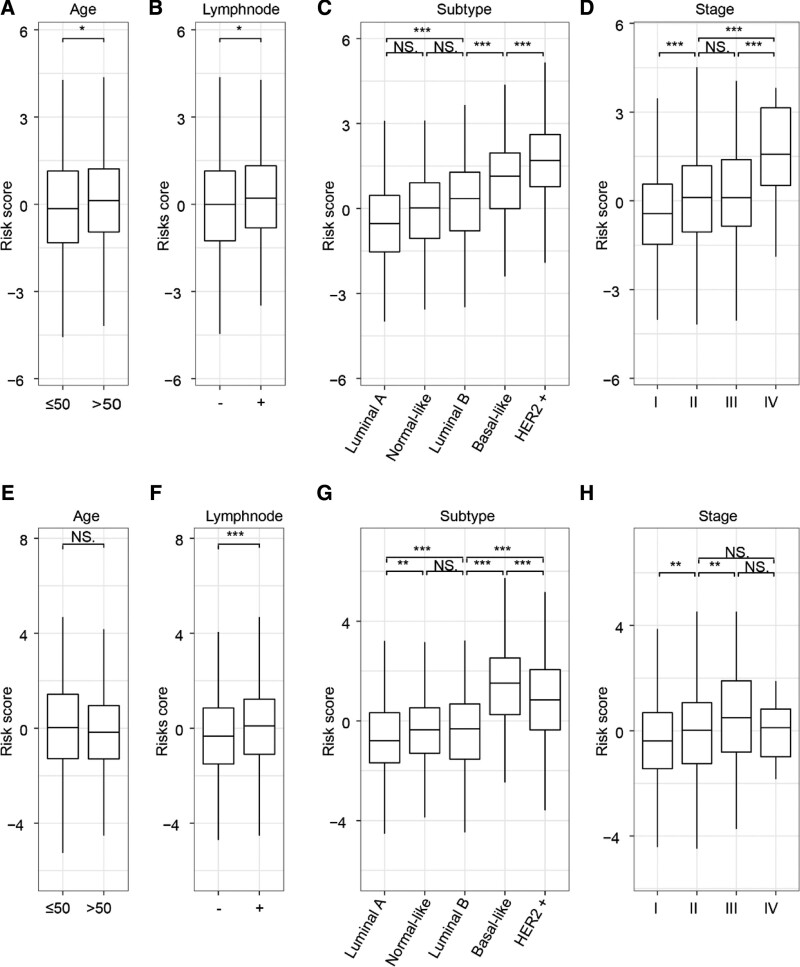
The relationship between the risk signature and the clinical characteristics and molecular subtypes of breast cancer patients was investigated. In the TCGA dataset, the risk score of older or lymph node positive patients was higher compared to younger or lymph node negative patients, as shown in Figure 3A and B. Additionally, the risk score of the more invasive subtypes, such as basal-like and HER2 + patients, was significantly lower than that of the less invasive subtypes, such as luminal A and luminal B (Fig. 3C). The risk score was also higher in patients with higher clinical stages compared to those with lower clinical stages (Fig. 3D). Similar results were obtained from the analysis of patients in the METABRIC dataset (Fig. 3E–H). Therefore, it is speculated that the risk signature has a certain correlation with the clinical characteristics of breast cancer.
Figure 3.
Relationship between risk signature and clinicopathological characteristics of breast cancer patients. (A–H) Differences of the risk score in breast cancer patients stratified by age, molecular subtypes, lymph node status, and AJCC stage. The Student t test was used to determine P values. *P < .05, **P < .01, ***P < .001. AJCC = American Joint Committee on Cancer, METABRIC = Molecular Taxonomy of Breast Cancer International Consortium, TCGA = The Cancer Genome Atlas.
3.4. The risk signature was related to the prognosis of breast cancer patients
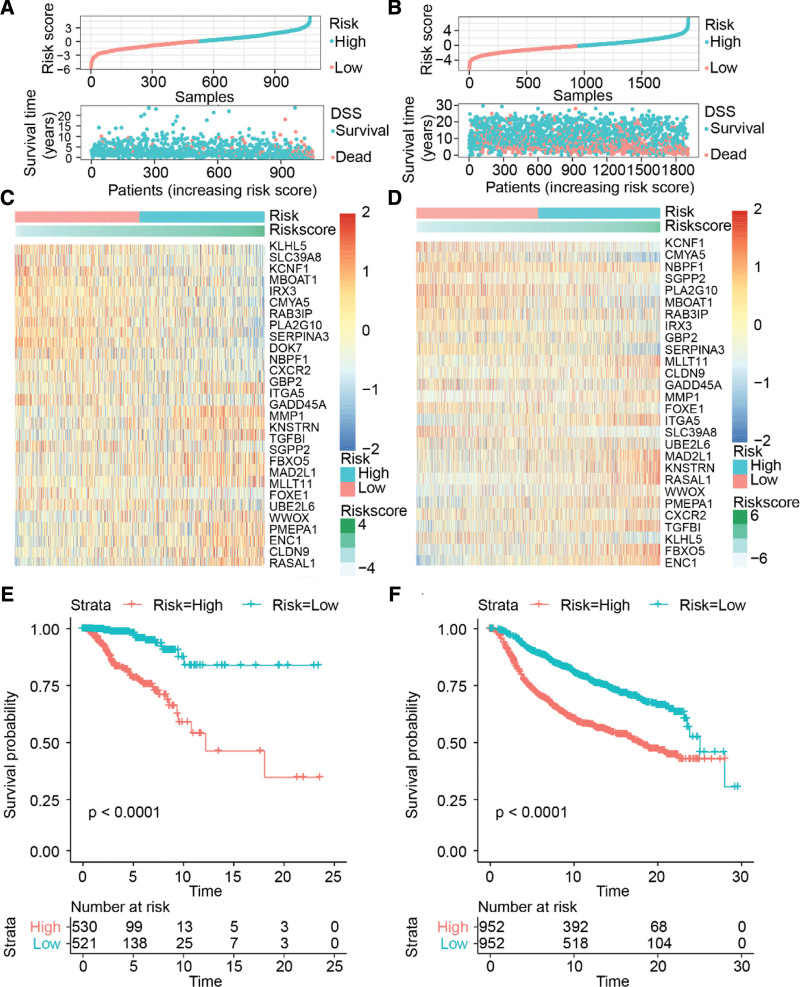
We divided the patients with breast cancer into high-risk and low-risk groups based on the median risk score of all patients. The number of disease-specific deaths in the high-risk group was significantly higher than that in the low-risk group (Fig. 4A and B). The expression differences of the 29 senescence-related genes in both TCGA and METABRIC patients were similar. ITGA5, KNSTRN, TGFBI, WWOX, MLLT11, CLDN9, FBXO5, MAD2L1, MMP1, RASAL1, ENC1, and PMEPA1 showed higher expression in the high-risk group than in the low-risk group. In contrast, KLHL5, SLC39A8, KCNF1, MBOAT1, IRX3, GADD45A, DOK7, RAB3IP, NBPF1, SGPP2, CXCR2, FOXE1, CMYA5, PLA2G10, and SERPINA3 showed lower expression in the high-risk group than in the low-risk group. However, UBE2L, GBP2, and NBPF1 did not show any significant expression differences between the high and low-risk groups (Fig. 4C and D).
Figure 4.
Distribution and prognostic value of the risk score. (A and B) Distribution of the risk scores. (C and D) Heatmap of the senescence-related genes. (E and F) Kaplan–Meier survival curve. METABRIC = Molecular Taxonomy of Breast Cancer International Consortium, TCGA = The Cancer Genome Atlas.
K-M curve analysis showed that the DSS rate in the high-risk group was significantly lower than that in the low-risk group (Fig. 4E and F). The results indicated that there were significant differences in the molecular characteristics between the high and low-risk groups, and the prognosis of the high-risk group was worse than that of the low-risk group.
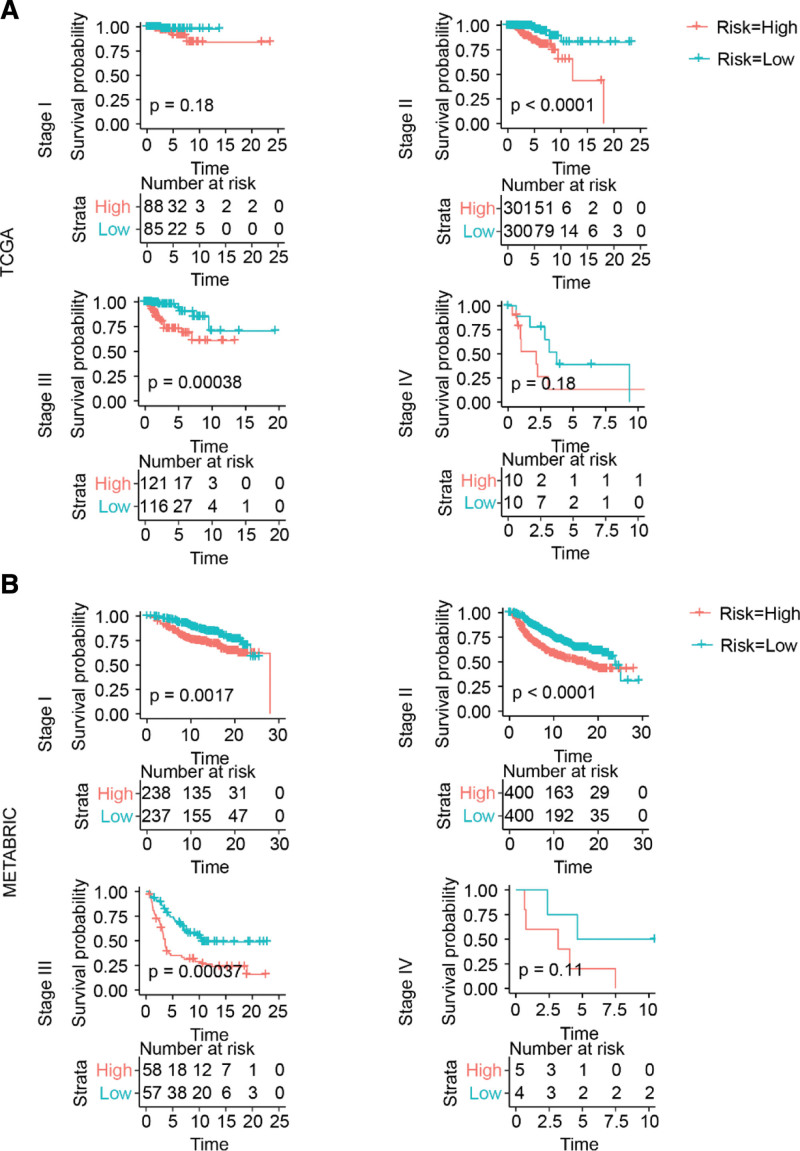
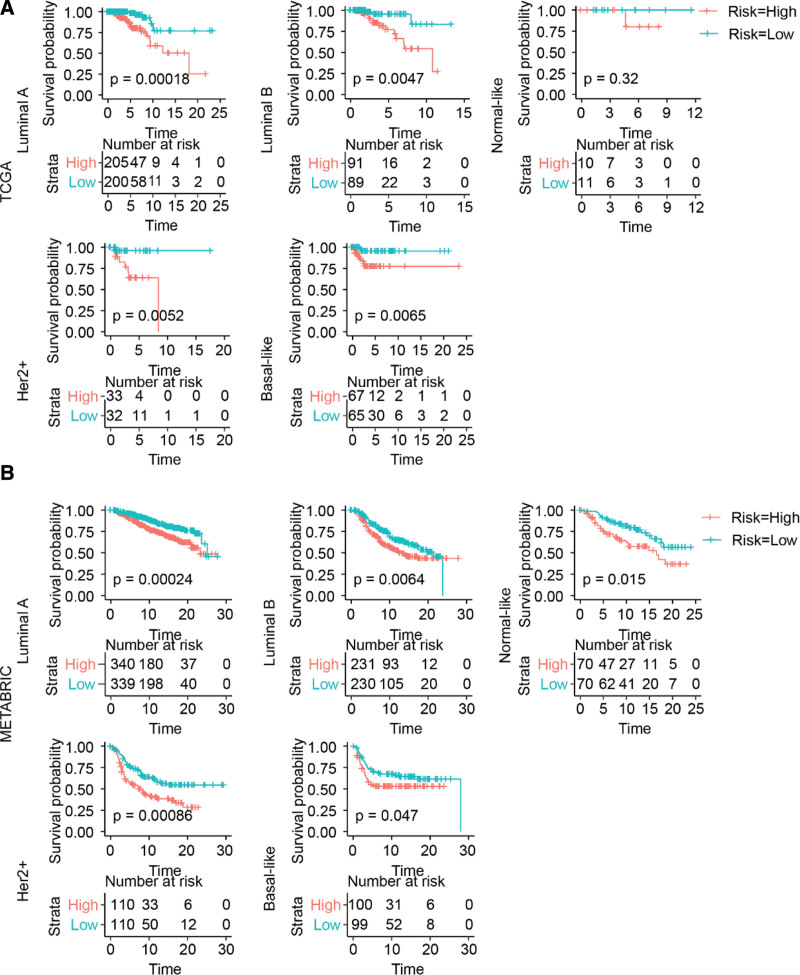
To further explore the prognostic value of this risk signature in patients with breast cancer, we determined its prognostic value in patients with the same clinical stage and molecular subtype.
As shown in Figure 5A and B, the prognosis of patients with breast cancer in the high-risk group was worse than that of those in the low-risk group. However, for stage IV patients, the number of patients was too small to obtain a significant P value between the high- and low-risk score groups.
Figure 5.
Risk signature prognosticated survival within the same clinical stage of breast cancer. (A and B) Kaplan–Meier survival curve. METABRIC = Molecular Taxonomy of Breast Cancer International Consortium, TCGA = The Cancer Genome Atlas.
Similarly, the risk signature also performed well with respect to distinguishing worst prognostic patients from the others within the same molecular subtype (Fig. 6A and B).
Figure 6.
Risk signature prognosticated survival within the same molecular subtype of breast cancer. (A and B) Kaplan–Meier survival curve. METABRIC = Molecular Taxonomy of Breast Cancer International Consortium, TCGA = The Cancer Genome Atlas.
3.5. The risk signature was an independent prognostic factor for breast cancer patients
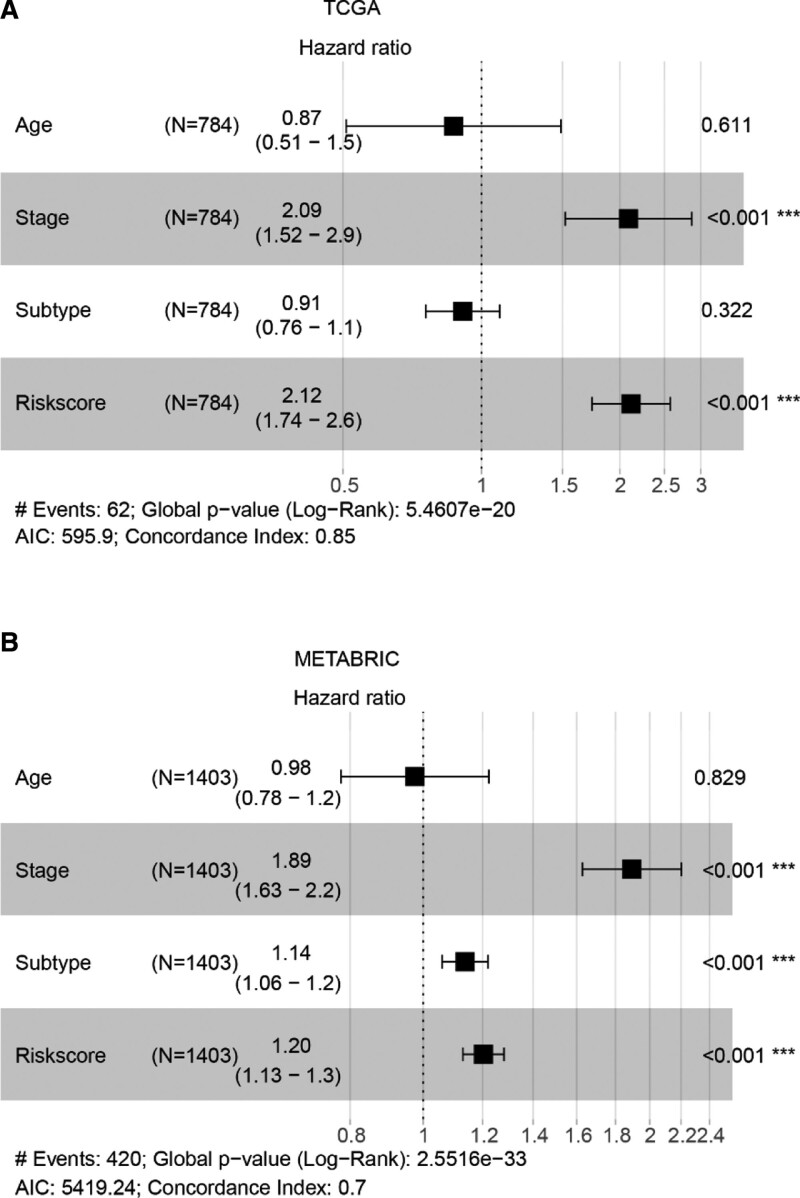
We performed multivariate Cox regression analysis to determine whether the risk score is an independent prognostic factor. The results revealed that stage (hazard ratio [HR]: 2.09, 95% confidence interval [CI]: 1.52–2.9; P < .001) and risk signature (HR: 2.12, 95% CI: 1.74–2.6; P < .001) were independent prognostic factors in the TCGA dataset, as shown in Figure 6. For the METABRIC dataset, stage (HR: 1.89, 95% CI: 1.63–2.2; P < .001), subtype (HR: 1.14, 95% CI: 1.06–1.2; P < .001), and risk signature (HR: 1.2, 95% CI: 1.13–1.3, P < .001) were independent prognostic factors, as shown in Figure 7A and B.
Figure 7.
Forest plot of hazard ratios. (A) Forest plot of TCGA. (B) Forest plot of METABRIC. *P < .05, **P < .01, ***P < .001. METABRIC = Molecular Taxonomy of Breast Cancer International Consortium, TCGA = The Cancer Genome Atlas.
In conclusion, the risk signature was an independent prognostic factor for patients with breast cancer.
3.6. The risk signature was correlated with the expression level of immune checkpoint genes
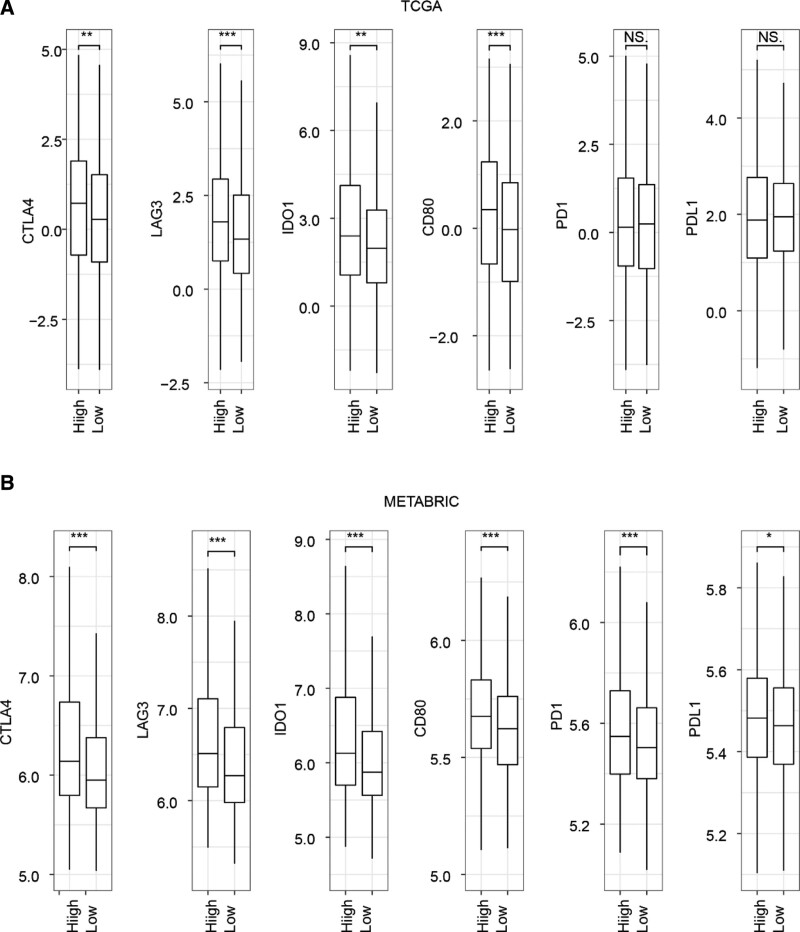
Immunotherapy is gaining recognition as an effective method for managing cancer, and one of the factors that affects its efficacy is the expression level of various immune checkpoint genes.[19] Therefore, we further investigated the relationship between the risk signature and the expression levels of these genes. We found that the expression levels of the immune checkpoint genes CTLA4, LAG3, IDO1, and CD80 were significantly higher in the high-risk group compared to the low-risk group. However, only the expression levels of PD1 and PDL1 showed significant differences in the METABRIC dataset (Fig. 8A and B).
Figure 8.
Relationship between risk score and expression level of immune checkpoint genes. The Student t test was used to determine P values. *P < .05, **P < .01, ***P < .001. CTLA4 = cytotoxic T-lymphocyte-associated protein 4, IDO1 = indoleamine dioxygenase 1, LAG3 = lymphocyte activation gene 3, METABRIC = Molecular Taxonomy of Breast Cancer International Consortium, PD-1 = programmed death-1, PD-L1 = programmed death ligand-1, TCGA = The Cancer Genome Atlas.
These findings suggest that patients with high-risk scores may benefit more from immunotherapy.
3.7. The risk signature was associated with specific cancer hallmarks
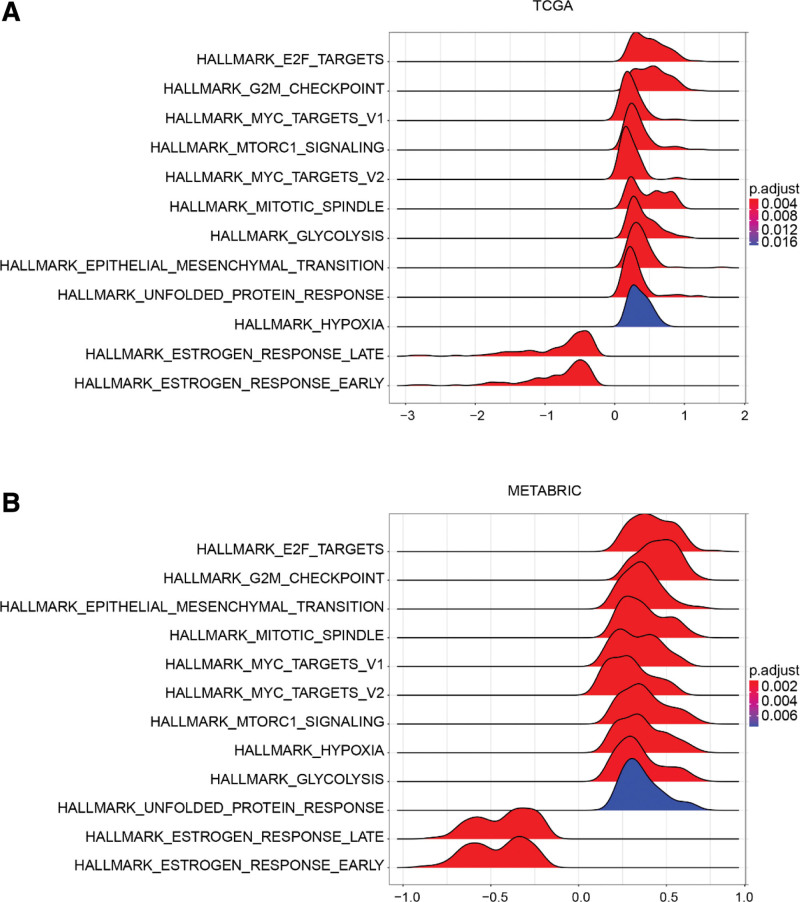
We further investigated the associated signaling pathways between the high-risk and low-risk groups using gene set enrichment analysis. The results showed that tumors with high-risk scores were significantly enriched for E2F targets, G2/M checkpoint, mTORC1 signaling, MYC targets v1 and v2, mitotic spindle, epithelial–mesenchymal transition, hypoxia, glycolysis, and unfolded protein response in both the TCGA and METABRIC datasets (Fig. 9A and B, Supplemental Digital Content (Table S5, http://links.lww.com/MD/I973 and Table S6, http://links.lww.com/MD/I974)). Tumors with low scores were enriched only for early and late estrogen responses (Supplemental Digital Content (Table S5, http://links.lww.com/MD/I973 and Table S6, http://links.lww.com/MD/I974)).
Figure 9.
Gene set enrichment analysis (GSEA). (A) GSEA of TCGA. (B) GSEA of METABRIC. METABRIC = Molecular Taxonomy of Breast Cancer International Consortium, TCGA = The Cancer Genome Atlas.
4. Discussion
In recent years, numerous studies have reported that senescence is involved in the occurrence and development of various tumors.[7–12,20–22] Although there are several gene-based assays for predicting breast cancer prognosis, there is scarce information on the relationship between senescence and breast cancer prognosis. We retrieved 744 senescence-related genes from the SeneQuest database. After univariate Cox proportional hazards regression analysis, 57 genes were selected for LASSO regression, and 29 genes were identified for the construction of the risk signature. Existing studies have reported that most of these 29 genes are closely related to the development of breast cancer. Genes such as ENC1,[23] MAD2L1,[24] MLLT11,[25] ITGA5,[26] MMP1,[27] and PMEPA1[28] have been reported to promote breast cancer metastasis and chemoresistance. Some genes could inhibit breast cancer development, such as GBP2.[29,30] Additionally, hypermethylation of DOK7[31] and NBPF1[32] has been proposed as a powerful epigenetic blood-based biomarker for breast cancer.
Molecular typing has become the standard tool for guiding treatment decisions for patients with breast cancer.[33] For the HER2+ and triple-negative subtypes, the routine use of adjuvant chemotherapy is strongly recommended. However, there is no satisfactory marker to help assess the need for adjuvant chemotherapy for patients with HR+ and HER2− luminal A and luminal B breast cancers.[34] The senescence-related signature was able to identify the high-risk group from the luminal A and luminal B subtypes (Fig. 6). This result implies that the signature may help in identifying patients who will benefit from the combination of adjuvant chemotherapy.
Recently introduced immunotherapy is gaining popularity as one of the main modalities of cancer treatment.[35] Although the survival rate of patients with breast cancer has improved significantly in the past 2 decades, conventional treatment is still unable to effectively cure advanced breast cancer, and immunotherapy is expected to become one of the methods to provide a cure. Different subtypes of breast cancer show different responses to immunotherapy,[36–38] and the efficiency of immune agents as single-drug applications is not high; hence, effective screening of the population for potential high response to immunotherapy and administration of precise treatment is of great significance.[19] In our study, we found that senescence-related genes were associated with the tumor immune microenvironment and that patients with high senescence-related scores were more likely to benefit from immunotherapy.
5. Conclusions
In this study, we used the transcriptome data of senescence-related genes to construct a risk signature that could predict the prognosis of breast cancer patients. Our findings may provide new insights into the relationship between breast cancer and senescence and may serve as an important reference in the treatment of breast cancer. Although the signature performs well in TCGA and METABRIC datasets, more clinical trials are needed to verify the reliability of this risk signature.
Author contributions
Conceptualization: Qiang Zou.
Data curation: Yiyi Hu, Hongying Wang, Qiang Zou.
Formal analysis: Tengfei Xing.
Methodology: Hongying Wang.
Supervision: Qiang Zou.
Validation: Yiyi Hu, Hongying Wang, Qiang Zou.
Visualization: Tengfei Xing, Yiyi Hu.
Writing – original draft: Tengfei Xing.
Writing – review & editing: Qiang Zou.
Supplementary Material
Abbreviations:
- AUC
- area under the curve
- CI
- confidence interval
- DSS
- disease-specific survival
- ER
- estrogen receptor
- HER2
- human epidermal growth factor receptor type 2
- HR
- hazard ratio
- HR+
- hormone receptor positive
- LASSO
- least absolute shrinkage and selection operator
- METABRIC
- molecular taxonomy of breast cancer international consortium
- TCGA
- the cancer genome atlas
The datasets generated during and/or analyzed during the current study are publicly available.
Supplemental Digital Content is available for this article.
The authors have no funding and conflicts of interest to disclose.
This article was based on bioinformatics analysis of publicly available gene expression data and clinical information, without involving human or animal experiments. This article cited 2 sources of datasets (TCGA and METABRIC), and stated that these datasets had obtained ethical approval from the corresponding institutions.
How to cite this article: Xing T, Hu Y, Wang H, Zou Q. A senescence-related signature for predicting the prognosis of breast cancer: A bioinformatics analysis. Medicine 2023;102:19(e33739).
Contributor Information
Tengfei Xing, Email: 634836479@qq.com.
Yiyi Hu, Email: 462695339@qq.com.
Hongying Wang, Email: x15237185216@163.com.
References
- [1].Li G, Hu J, Hu G. Biomarker studies in early detection and prognosis of breast cancer. Adv Exp Med Biol. 2017;1026:27–39. [DOI] [PubMed] [Google Scholar]
- [2].Mamounas EP, Tang G, Fisher B, et al. Association between the 21-gene recurrence score assay and risk of locoregional recurrence in node-negative, estrogen receptor-positive breast cancer: results from NSABP B-14 and NSABP B-20. J Clin Oncol. 2010;28:1677–83. [DOI] [PMC free article] [PubMed] [Google Scholar]
- [3].Albain KS, Barlow WE, Shak S, et al. Prognostic and predictive value of the 21-gene recurrence score assay in postmenopausal women with node-positive, oestrogen-receptor-positive breast cancer on chemotherapy: a retrospective analysis of a randomised trial. Lancet Oncol. 2010;11:55–65. [DOI] [PMC free article] [PubMed] [Google Scholar]
- [4].Paik S, Tang G, Shak S, et al. Gene expression and benefit of chemotherapy in women with node-negative, estrogen receptor-positive breast cancer. J Clin Oncol. 2006;24:3726–34. [DOI] [PubMed] [Google Scholar]
- [5].Glas AM, Floore A, Delahaye LJ, et al. Converting a breast cancer microarray signature into a high-throughput diagnostic test. BMC Genomics. 2006;7:278. [DOI] [PMC free article] [PubMed] [Google Scholar]
- [6].Mook S, Knauer M, Bueno-de-Mesquita JM, et al. Metastatic potential of T1 breast cancer can be predicted by the 70-gene MammaPrint signature. Ann Surg Oncol. 2010;17:1406–13. [DOI] [PubMed] [Google Scholar]
- [7].Hernandez-Segura A, Nehme J, Demaria M. Hallmarks of cellular senescence. Trends Cell Biol. 2018;28:436–53. [DOI] [PubMed] [Google Scholar]
- [8].Coppe JP, Desprez PY, Krtolica A, et al. The senescence-associated secretory phenotype: the dark side of tumor suppression. Annu Rev Pathol. 2010;5:99–118. [DOI] [PMC free article] [PubMed] [Google Scholar]
- [9].Gorgoulis V, Adams PD, Alimonti A, et al. Cellular senescence: defining a path forward. Cell. 2019;179:813–27. [DOI] [PubMed] [Google Scholar]
- [10].Demaria M, O’Leary MN, Chang J, et al. Cellular senescence promotes adverse effects of chemotherapy and cancer relapse. Cancer Discov. 2017;7:165–76. [DOI] [PMC free article] [PubMed] [Google Scholar]
- [11].Milanovic M, Fan DNY, Belenki D, et al. Senescence-associated reprogramming promotes cancer stemness. Nature. 2018;553:96–100. [DOI] [PubMed] [Google Scholar]
- [12].Eggert T, Wolter K, Ji J, et al. Distinct functions of senescence-associated immune responses in liver tumor surveillance and tumor progression. Cancer Cell. 2016;30:533–47. [DOI] [PMC free article] [PubMed] [Google Scholar]
- [13].Curtis C, Shah SP, Chin SF, et al. The genomic and transcriptomic architecture of 2,000 breast tumours reveals novel subgroups. Nature. 2012;486:346–52. [DOI] [PMC free article] [PubMed] [Google Scholar]
- [14].Wilkerson MD, Hayes DN. ConsensusClusterPlus: a class discovery tool with confidence assessments and item tracking. Bioinformatics. 2010;26:1572–3. [DOI] [PMC free article] [PubMed] [Google Scholar]
- [15].Friedman J, Hastie T, Tibshirani R. Regularization paths for generalized linear models via coordinate descent. J Stat Softw. 2010;33:1–22. [PMC free article] [PubMed] [Google Scholar]
- [16].Blanche P, Dartigues JF, Jacqmin-Gadda H. Estimating and comparing time-dependent areas under receiver operating characteristic curves for censored event times with competing risks. Stat Med. 2013;32:5381–97. [DOI] [PubMed] [Google Scholar]
- [17].Ritchie ME, Phipson B, Wu D, et al. limma powers differential expression analyses for RNA-sequencing and microarray studies. Nucleic Acids Res. 2015;43:e47. [DOI] [PMC free article] [PubMed] [Google Scholar]
- [18].Yu G, Wang LG, Han Y, et al. clusterProfiler: an R package for comparing biological themes among gene clusters. OMICS. 2012;16:284–7. [DOI] [PMC free article] [PubMed] [Google Scholar]
- [19].Emens LA. Breast cancer immunotherapy: facts and hopes. Clin Cancer Res. 2018;24:511–20. [DOI] [PMC free article] [PubMed] [Google Scholar]
- [20].Coppe JP, Patil CK, Rodier F, et al. Senescence-associated secretory phenotypes reveal cell-nonautonomous functions of oncogenic RAS and the p53 tumor suppressor. PLoS Biol. 2008;6:2853–68. [DOI] [PMC free article] [PubMed] [Google Scholar]
- [21].Elmore LW, Di X, Dumur C, et al. Evasion of a single-step, chemotherapy-induced senescence in breast cancer cells: implications for treatment response. Clin Cancer Res. 2005;11:2637–43. [DOI] [PubMed] [Google Scholar]
- [22].Roberson RS, Kussick SJ, Vallieres E, et al. Escape from therapy-induced accelerated cellular senescence in p53-null lung cancer cells and in human lung cancers. Cancer Res. 2005;65:2795–803. [DOI] [PubMed] [Google Scholar]
- [23].Zhou Y, Tang X, Niu L, et al. Ectodermal-neural cortex 1 as a novel biomarker predicts poor prognosis and induces metastasis in breast cancer by promoting Wnt/beta-catenin pathway. J Cell Mol Med. 2020;24:8826–35. [DOI] [PMC free article] [PubMed] [Google Scholar]
- [24].Wang Z, Katsaros D, Shen Y, et al. Biological and clinical significance of MAD2L1 and BUB1, genes frequently appearing in expression signatures for breast cancer prognosis. PLoS One. 2015;10:e0136246. [DOI] [PMC free article] [PubMed] [Google Scholar]
- [25].Park J, Kim S, Joh J, et al. MLLT11/AF1q boosts oncogenic STAT3 activity through Src-PDGFR tyrosine kinase signaling. Oncotarget. 2016;7:43960–73. [DOI] [PMC free article] [PubMed] [Google Scholar]
- [26].Xiao Y, Li Y, Tao H, et al. Integrin alpha5 down-regulation by miR-205 suppresses triple negative breast cancer stemness and metastasis by inhibiting the Src/Vav2/Rac1 pathway. Cancer Lett. 2018;433:199–209. [DOI] [PubMed] [Google Scholar]
- [27].Lim JP, Nair S, Shyamasundar S, et al. Silencing Y-box binding protein-1 inhibits triple-negative breast cancer cell invasiveness via regulation of MMP1 and beta-catenin expression. Cancer Lett. 2019;452:119–31. [DOI] [PubMed] [Google Scholar]
- [28].Nie Z, Wang C, Zhou Z, et al. Transforming growth factor-beta increases breast cancer stem cell population partially through upregulating PMEPA1 expression. Acta Biochim Biophys Sin. 2016;48:194–201. [DOI] [PubMed] [Google Scholar]
- [29].Godoy P, Cadenas C, Hellwig B, et al. Interferon-inducible guanylate binding protein (GBP2) is associated with better prognosis in breast cancer and indicates an efficient T cell response. Breast Cancer. 2014;21:491–9. [DOI] [PubMed] [Google Scholar]
- [30].Zhang J, Zhang Y, Wu W, et al. Guanylate-binding protein 2 regulates Drp1-mediated mitochondrial fission to suppress breast cancer cell invasion. Cell Death Dis. 2017;8:e3151. [DOI] [PMC free article] [PubMed] [Google Scholar]
- [31].Heyn H, Carmona FJ, Gomez A, et al. DNA methylation profiling in breast cancer discordant identical twins identifies DOK7 as novel epigenetic biomarker. Carcinogenesis. 2013;34:102–8. [DOI] [PMC free article] [PubMed] [Google Scholar]
- [32].Li D, Li P, Wu J, et al. Methylation of NBPF1 as a novel marker for the detection of plasma cell-free DNA of breast cancer patients. Clin Chim Acta. 2018;484:81–6. [DOI] [PubMed] [Google Scholar]
- [33].Parker JS, Mullins M, Cheang MC, et al. Supervised risk predictor of breast cancer based on intrinsic subtypes. J Clin Oncol. 2009;27:1160–7. [DOI] [PMC free article] [PubMed] [Google Scholar]
- [34].Gradishar WJ, Anderson BO, Abraham J, et al. Breast cancer, version 3.2020, NCCN clinical practice guidelines in oncology. J Natl Compr Canc Netw. 2020;18:452–78. [DOI] [PubMed] [Google Scholar]
- [35].Esteva FJ, Hubbard-Lucey VM, Tang J, et al. Immunotherapy and targeted therapy combinations in metastatic breast cancer. Lancet Oncol. 2019;20:e175–86. [DOI] [PubMed] [Google Scholar]
- [36].Savas P, Salgado R, Denkert C, et al. Clinical relevance of host immunity in breast cancer: from TILs to the clinic. Nat Rev Clin Oncol. 2016;13:228–41. [DOI] [PubMed] [Google Scholar]
- [37].Cimino-Mathews A, Thompson E, Taube JM, et al. PD-L1 (B7-H1) expression and the immune tumor microenvironment in primary and metastatic breast carcinomas. Hum Pathol. 2016;47:52–63. [DOI] [PMC free article] [PubMed] [Google Scholar]
- [38].Lotfinejad P, Asghari Jafarabadi M, Abdoli Shadbad M, et al. Prognostic role and clinical significance of Tumor-Infiltrating Lymphocyte (TIL) and Programmed Death Ligand 1 (PD-L1) Expression in Triple-Negative Breast Cancer (TNBC): a systematic review and meta-analysis study. Diagnostics (Basel). 2020;10:704. [DOI] [PMC free article] [PubMed] [Google Scholar]
Associated Data
This section collects any data citations, data availability statements, or supplementary materials included in this article.


