

Abstract
Immune recognition occurs at specialized cell-cell junctions when immune cells and target cells physically touch. In this junction, groups of receptor-ligand complexes assemble and experience molecular forces that are ultimately generated by the cellular cytoskeleton. These forces are in the range of piconewton (pN) but play crucial roles in immune cell activation and subsequent effector responses. In this minireview, we will review the development of DNA based molecular tension sensors and their applications in mapping and quantifying mechanical forces experienced by immunoreceptors including T-cell receptor (TCR), Lymphocyte function-associated antigen (LFA-1), and the B-cell receptor (BCR) among others. In addition, we will highlight the use of DNA as a mechanical gate to manipulate mechanotransduction and decipher how mechanical forces regulate antigen discrimination and receptor signaling.
Keywords: DNA tension probe, immunoreceptor, force sensing, force manipulating, mechanical signalling
Graphical Abstract

Graphical Abstract

In this minireview, we summarized the recent development of DNA nanotechnology for investigating mechanical forces in the immune system. We discussed the force sensing mechanisms of different DNA structures (DNA hairpin and DNA duplex), followed by a survey of DNA tension sensors and gates used to detect the immunoreceptor forces and manipulate mechanical signaling, respectively.
1. Introduction
One important class of biological signaling is described as juxtacrine, which involves binding of a ligand and receptor at the junction between two cells that physically touch. Because the ligands and the receptors are membrane bound molecules, binding and receptor activation can only occur when the two cells come in contact.[1] In this class of signaling, the ligand and the receptor typically experience biophysical forces due to the motion of the two cells, membrane dynamics, and also because of the coupling between the ligands/receptors and the cellular cytoskeleton.[2] Cytoskeleton protein activity such as the polymerization of actin into filaments and the action of motor proteins such as myosin generate forces that are transmitted to these junctional receptor-ligand complexes.[3] Accordingly, the vast majority of immune receptors will experience energized biophysical forces that alter protein structure and signaling.[4] In a broad sense, forces alter protein structure and function in a manner akin to how posttranslational modifications, such as phosphorylation, can activate a signaling cascade.[5] But compared to the tools developed by the chemical biology community to study posttranslational modifications, the tools available to study receptor mechanotransduction are nascent and very limited. The goal of this mini-review is to describe what is arguably the most powerful probe to study immune receptor mechanotransduction - DNA sensors that can quantify and map the forces and help elucidate how mechanics is transduced into chemical signals.
Over the past decade, many studies have converged on the idea that immune cell signaling is mediated at least in part by mechanotransduction.[6] For example, single molecule microscopy experiments reported that applying tens of pN forces to TCR-ligand bonds triggers T-cell activation within minutes.[7] Inhibiting cytoskeleton contractility dampens B-cell and T-cell antigen discrimination,[8] T-cell activation,[9] and subsequent cytotoxic killing.[10] In an attempt to better understand mechanotransduction and elucidate its roles in immune activities, many tools have been developed to visualize and quantify immune receptor forces. Traction force microcopy (TFM) was the earliest force measurement technique used to quantify cellular forces and is based on deformation of the material underneath the cell.[9, 11] Through TFM, Liu et al. found that B-cells exert 10–20 nanonewton (nN) force to antigen coated substrates.[12] Kam et al. used microfabricated polymer structures to measure traction force and reported that T-cells spread and generate up to 100 pN centripetal force onto individual micro-pillars along of the edge of the cell.[13] Note that TFM measures the forces averaged among an ensemble of ~103–105 receptors within micron scale elements.
To measure and map the forces generated by individual receptors, our lab developed molecular tension sensor that allows one to spatially and temporally map receptor forces.[14] In this design, an elastic molecule such as polymer is modified with a fluorophore-quencher FRET pair and presents ligand at one end to engage the receptor of interest. Upon binding to tension sensor, forces transmitted to the receptor will extend the molecule and separate the fluorophore-quencher pair, leading to a significant fluorescence enhancement. In 2011, a PEG polymer based tension sensor was developed to map EGFR forces[15] and then this was applied to measure integrin forces.[16] Subsequently, we and others developed new types of molecular tension sensors by replacing the PEG “spring” with other extendable molecules such as spider silk peptide,[17] and folded proteins.[18] Our early work employing these entropic tension probes used ensemble fluorescence imaging to estimate receptor forces. To more accurately determine the absolute force magnitude from single receptors and avoid the issues with signal averaging, several groups moved toward single molecule scale with the (GPGGA)8 extendable spider silk peptide tension sensor design. For example, Dunn and colleagues suggested that integrins transmit ~2–5 pN forces to their ligands using this approach.[19] Schutz et al. reported that TCR transmits a peak force of 5 pN to its ligands anchored on synthetic substrates.[20] But the use of entropic springs as a force sensor is problematic as it tends to under-estimate force because the dynamic range of such sensors is limited to ~8 pN and the signal to noise (S/N) ratio for single molecule experiments is rather limited. To address these limitations, we designed a DNA hairpin-based tension probe (DNA-TP) where the elastic spring was replaced with a fluorophore-quencher modified DNA hairpin. Unlike PEG and peptide repeats, DNA hairpin only unfolds at a specific force threshold and thus reports cellular forces in a digital manner.[21] With DNA-TPs, one can use ensemble fluorescence imaging to accurately map and measure receptor forces with easy set-up and high S/N. Additionally, DNA-TPs are highly tunable and able to detect force up to 19 pN, hence are currently the main workhorse tools in the field. In this review, we will summarize the development of the DNA-TPs and their applications in mapping forces experienced by the immunoreceptors including TCR,[8b] LFA-1,[22] PD-1[23] and BCR.[24]
To study mechanotransduction, it is necessary to measure forces experienced by receptors and then to correlate this force to signaling events (calcium, phosphorylation, conformational changes, etc…). In biochemistry, a very important tool to determine causal relationships is the ability to introduce mutations at the single protein or single amino-acid level.[25] Thus, it is desirable to develop probes that induce “mechanical mutations” that modulate a force at a single ligand-receptor complex and then determine signaling consequences. To address this need, Ha and coworkers designed “tension gauge tethers (TGTs)” comprised of DNA duplexes with a defined force tolerance (Ttol) that terminates the mechanotransduction when the force exceeds the Ttol.[26] With this design, Ha and co-workers controlled the forces experienced by the Notch receptors and found that F < 12 pN is able to activate Notch receptors. Later, our group and others applied the TGT concept to manipulate immunoreceptor mechanotransduction and demonstrated that the mechanical force is of great importance to immune responses and its presence amplifies antigen discrimination and receptor signaling. In this second part of this review, we will also highlight applications of DNA duplexes to introduce mechanical mutations in an immune pathway and determine the role of mechanical forces in immune responses.
2. DNA mechanics
2.1. Mechanical melting versus thermal melting of DNA hairpins
Most of the chemistry community is very familiar with the idea that heating double stranded DNA (dsDNA) will lead to its denaturation into random coil single strand DNA (ssDNA). Figure 1 illustrates the reversable unfolding of a hairpin stem-loop secondary structure into ssDNA. This transition can be quantified using a temperature-controlled UV-vis spectrophotometer as the extinction coefficient of ssDNA differs from that of dsDNA, which allows one to easily determine the thermal melting temperature (Tm) of a transition (Figure 1a). The Tm of any given hairpin or duplex is highly dependent on its thermodynamic stability, i.e. the GC content, length, and other solution parameters. Interestingly, one can also melt dsDNA hairpins mechanically (Figure 1b) by applying external force in an orientation that pulls apart the folded structure. The probability of mechanical unfolding at any given force is dictated by how the force shifts the free energy diagram of a DNA structure. Because of the well characterized structure of B-form DNA, the melting and hybridization of a hairpin can be approximated using an ideal two-state system separated by an activation barrier (Figure 1c).[27] At zero force, the folded structure is more thermodynamically stable, but as the external force is increased, the unfolded state becomes more stable. Interestingly, the applied F can shift the equilibrium, and the F1/2, akin to the Tm, is defined as the force that renders these two states isoenergetic and equally probable. DNA will thus spend half its time in each state. The applied force can also accelerate the rate of unfolding by dampening the barrier to unfolding (Figure 1c and Equation 1).[28]
| (1) |
Figure 1. Mechanical melting vs thermal melting of DNA hairpins.
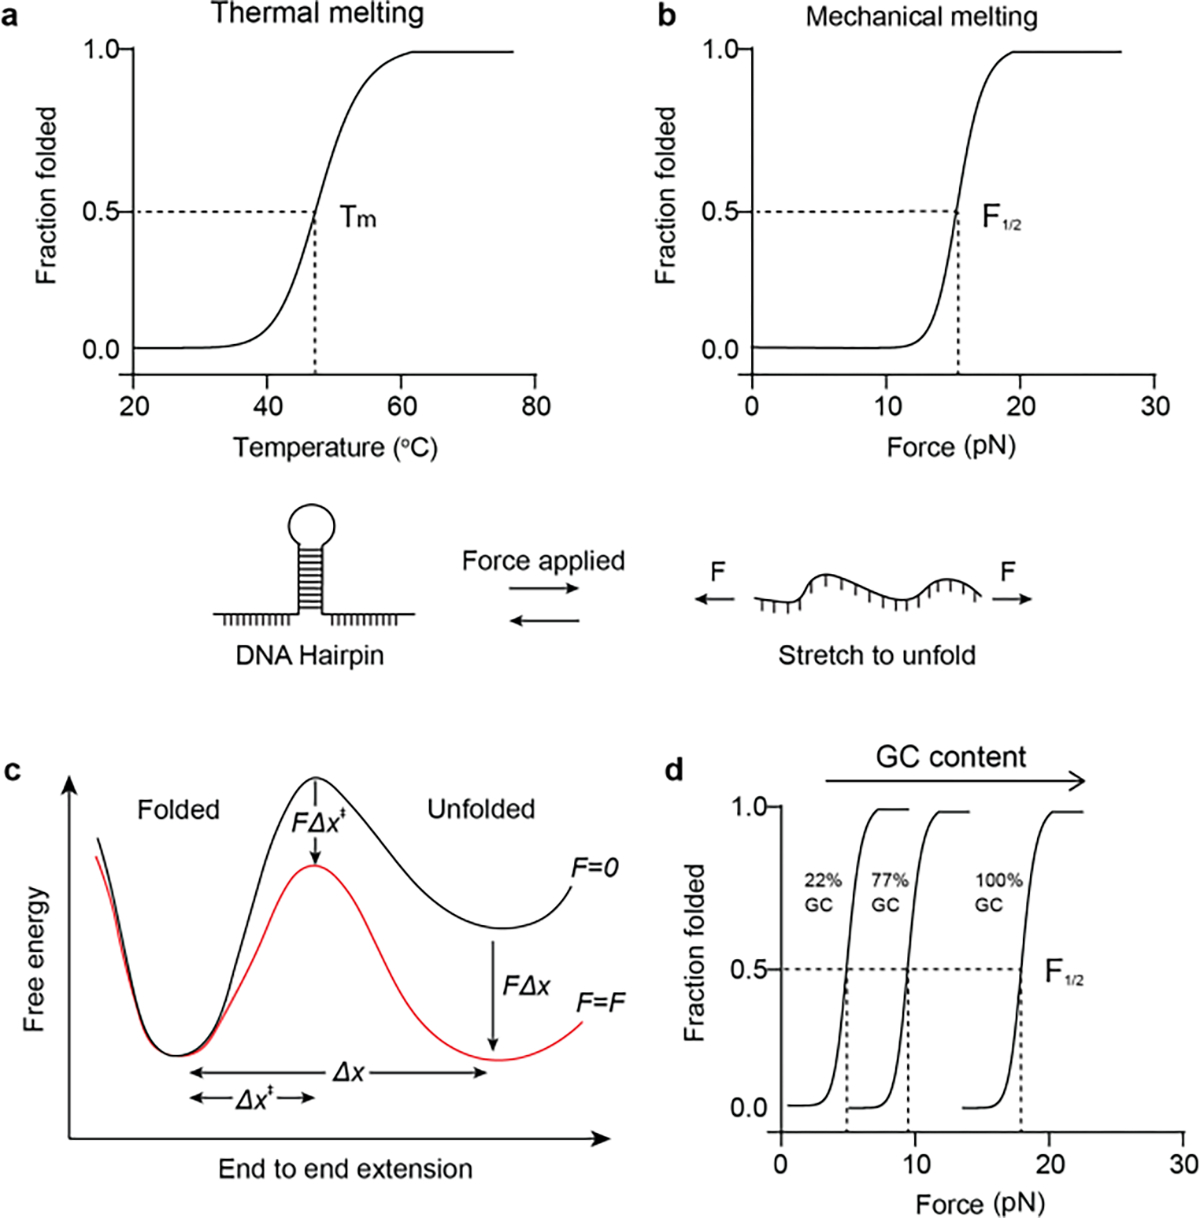
a-b) DNA melting curves showing that the DNA hairpin unfolds with increased temperature or increased mechanical forces. c) Energy landscape of DNA mechanical unfolding “reaction”. Applied force alters the rate and the equilibrium of the reaction by lowering the transition state energy and unfolded state energy, respectively. d) Theoretical plot showing F1/2 increases with the GC content of the DNA hairpin stem region.
Importantly, the barrier of DNA unfolding is fairly simple and lacks complex hidden states that are characteristic of protein unfolding transitions. As a result, the time scale for hairpin unfolding transitions is typically at the μsec time scale.[29] This is important, as it means that hairpin tension sensors are effectively real time probes that dynamically adopt the equilibrium state in response to external force within short duration that are smaller than the time scales of biological biophysical events. This is particularly relevant to immune receptors that display ~msec - sec bond lifetimes (and ~msec-sec force lifetimes).[7b] Much of our understanding of the biophysical chemistry of mechanical transitions in DNA come from single-molecule force spectroscopy (SMFS) measurements along with theoretical modeling.[27b, 30] This vast library of literature provides the metaphorical “shoulder of giants” that has allowed the rational design of DNA TPs as a tool for studying mechanotransduction at molecular scales.
For DNA hairpin structures, the free energy change during the unfolding process under an applied F can be described as:
| (2) |
When F = F1/2, at equilibrium (ΔG=0) the molecule has an equal probability of being in folded and unfolded states such that ([unfolded])/([folded]) = 1. Accordingly, equation 2 can be reorganized as the following:
| (3) |
where, is the free energy for unfolding the hairpin without force. is the free energy for stretching the ssDNA from its folded coordinates, which can be calculated with the worm like chain model below:
| (4) |
where Lp is the persistence length of ssDNA (~1.3 nm), L0 is the contour length of ssDNA and equals (0.63*n) nm, x is the hairpin extension from equilibrium and can be calculated by (0.44*(n-1)) nm, where n is the number of the bases in the stem-loop of the hairpin. Note that to get Δx in equation 3, a distance of 2 nm needs to be subtracted from x. 2 nm corresponds to the width of the DNA hairpin stem duplex where the unfolding process starts.
Considering that is the free energy of hybridization of the hairpin, it is dependent on the temperature, ion concentration, the GC content and length of the hairpin “stem” region. Meanwhile, these factors also affect . By varying the hairpin sequence and stem/loop length while keeping constant ion concentration (140 mM Na+, 2 mM Mg2+) and temperature, a library of DNA hairpins can be designed that have F1/2 ranging from 2 pN to 19 pN (Figure 1d).[21] DNA hairpin with an extremely low F1/2 can breathe and have a high probability Of nonspecific unfolding. Therefore, the lowest F1/2 applied for immune cell force studies is 4.7 pN with a 22% GC content.
2.2. Mechanical melting of a DNA duplex
In the previous section, we emphasized the reversible mechanical unfolding of DNA hairpins, but another important class of mechanically responsive probes is comprised of DNA duplexes that are irreversibly ruptured by forces in the piconewton scale.[31] The rupture force is highly dependent on the force application geometry and can be divided in to two geometries - unzipping, shearing.[32] As is shown in Figure 2a, shearing of a duplex requires applying antiparallel forces to either the opposite 3’ −3’ or 5’−5’ ends of the bound duplex while unzipping of a duplex involves applying 5’−3’ pulling perpendicularly to the duplex. Because there is no connection between the two strands after separation, DNA duplex rupture under force is irreversible and hence the process is highly dependent on F duration.
Figure 2. DNA duplexes melting under force.
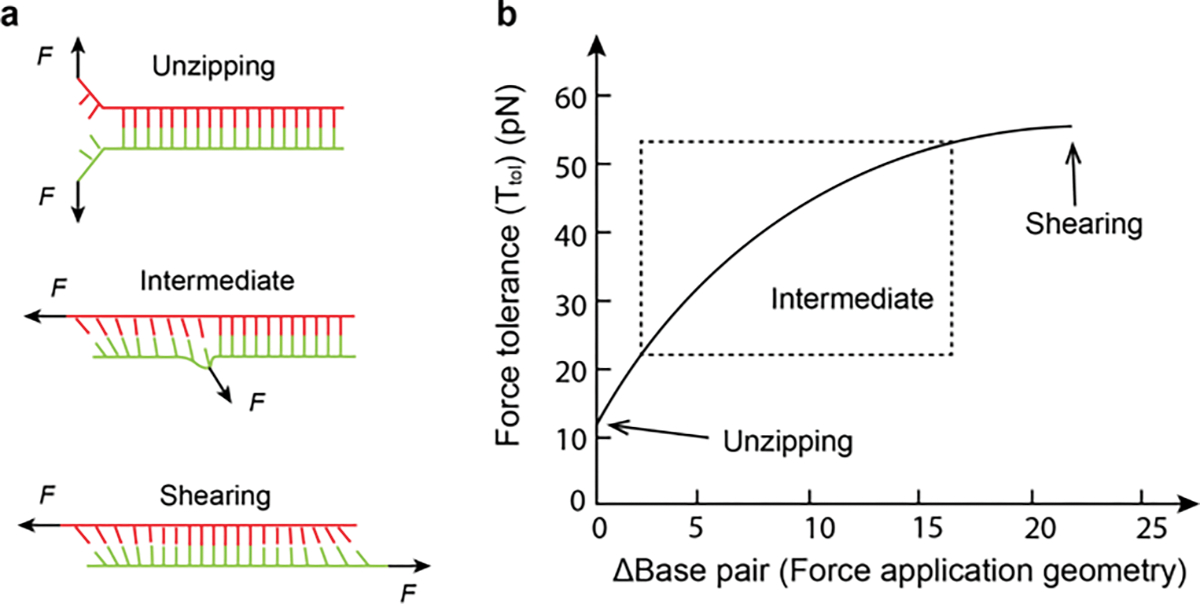
a) Schematic showing rupturing a DNA duplex with different force application geometries (unzipping, shearing and intermediate). b) Δ Base pair determines the force application geometry, and it represents the number of base pairs between force application points. Plot showing the Ttol of a 21 mer DNA duplex increases with Δ Base pair.
For example, one cannot define a F1/2 for the mechanical unfolding of DNA duplexes because the process is irreversible. Instead, we use the term Ttol which is dependent on F orientation and duration.[26] Unzipping and shearing of identical DNA duplexes will lead to different Ttol. Previously, SMFS experiments done at room temperature in PBS buffer showed that the force required to open a DNA duplex in the shearing geometry is dependent on the number of base pairs (bp). Shearing Ttol reaches an limit of ~60 pN at a length of about ~30 bp because for a long DNA, the force is only distributed onto a finite number of base pairs closed to the DNA terminus instead of all the base pairs in the whole duplex.[33] In contrast, Ttol for unzipping geometry is significantly smaller (~12 pN) because the external force is focused onto the terminal base pair, and breaks base-pairs one at a time (Figure 2b). The rupture force can be estimated using the de Gennes model which describes dsDNA as an elastic ladder held together using hydrogen bonds.[34] The rupture F is described as:
| (5) |
where fc is the rupture force for a single bond (fc = 3.9 pN), L is the number of DNA base pairs between the two anchor points, and X−1 represents the finite length that can be calculated with the spring constant (Q) of stretched DNA backbone and spring constant (R) of the stretched hydrogen bond between base pairs. [26] Note that several refinements to the de Gennes “toy” model have been developed and these updated models more accurately capture the sequence specific response of DNA shearing and unzipping as well as the length and temperature dependence of the force response. We would particularly encourage readers to review the work by Mosayebi et al. as this model offers an optimal match to experimental force spectroscopy results.[35]
3. DNA-TPs for mapping immunoreceptor forces
3.1. TCR force
To protect against cancer and viral infections, T-cells actively scan the surface of target cells seeking to recognize abnormal protein fragments presented on the major histocompatibility complex (pMHC). All nucleated cell types display pMHCs on their surface which aid in allowing the immune system to clear cancer cells and infected cells. Upon binding to the cognate pMHC, the TCR goes through a number of signaling cascades that ultimately activate the T-cell to eventually destroy target cells.[36] Several studies have suggested that the TCR is a mechanosensor - mechanical forces transmitted through pMHC-TCR bonds regulate its binding kinetics and enhance selective and differential levels of TCR activation.[7] To map and quantify the force exerted from TCR to its ligand, in 2016 our lab designed DNA hairpin tension probes (DNA-TPs) to sensitively convert pN TCR forces into fluorescence (Figure 3a).[8b] The DNA TP was comprised of three DNA strands: an anchor strand labeled with a quencher and a chemical moiety that immobilizes the TP onto the surface, a ligand strand labeled with fluorophore and antigen, and a hairpin with arms that were complementary to these two strands (Figure 3a). Depending on the needs, our group has employed different surface chemistries to immobilize DNA onto the substrate for different purposes, including thiol-gold chemosorption (low background signal),[8b] copper free click reaction[22] (bioorthogonal) and thiol-maleimide Michael addition (high reaction rate).[37] These chemistries are compatible with biological media, physically stable to withstand mechanical dissociation at the time scales of TCR forces, and afford facile and efficient chemical coupling. Note that the DNA TPs are not surface anchored using biotin-streptavidin for immune studies. This chemistry instead is used to link the immune ligands, such as pMHC and ICAM to the DNA since the ligands can be biotinylated enzymatically with little loss in their avidity. In particular, the biotin-streptavidin interaction is considered the strongest noncovalent bond which is physically robust and can withstand the force exerted by immune receptors.[38]
Figure 3. Studying TCR force with DNA hairpin tension sensor.
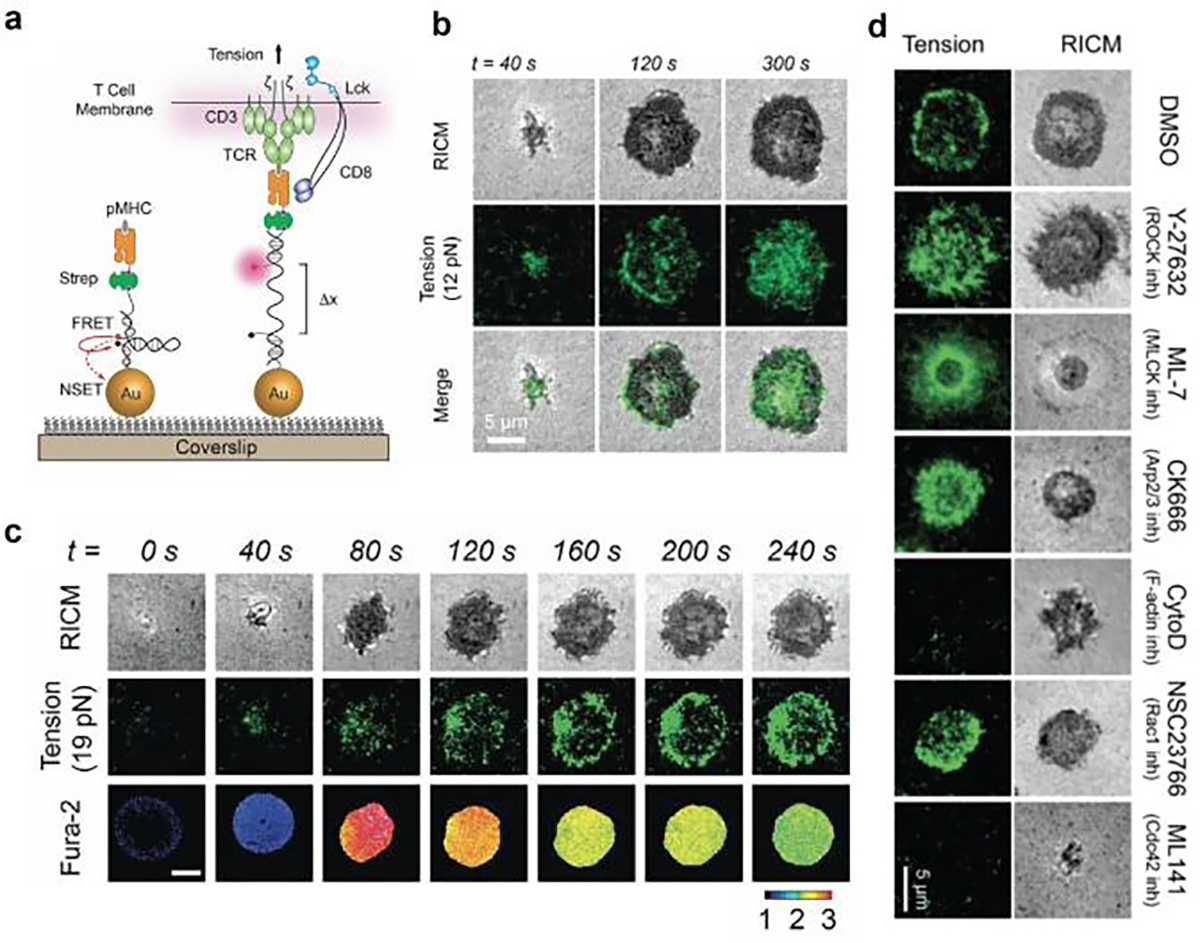
a) Schematic of DNA-TPs for mapping TCR-mediated tension. b) Time lapse images showing T-cell spread on DNA-TPs surface, and 12 pN tension signal was observed underneath the T-cell. c) TCR tension signal was correlated with calcium flux signal. d) Representative images showing that cytoskeleton inhibitors abolished TCR tension signal. Reproduced with permission.[8b] Copyright 2016, National Academy of Sciences, USA.
When the TCR engages pMHC ligand and exerts a force greater than F1/2, the DNA-TPs become unfolded. This causes the fluorophore and quencher to separate, leading to the restoration of the fluorescence signal and resulting in a 20-fold increase in fluorescence intensity.[21] In the first proof of concept experiment, our group seeded primary naïve T cells to a substrate coated with DNA-TPs that present pMHC. Upon the cells adhering to the substrate, we observed that the DNA-TP with a F1/2 of 12 pN exhibited a dynamic tension signal, indicating transient TCR forces of up to 12 pN. This occurred within seconds of adhesion and binding. (Figure 3b). The TCR tension signal was rapidly followed by a rise in calcium flux, which is a hallmark of T-cell activation (Figure 3c), showing the involvement of mechanical force in T-cell activation. We also found that inhibiting the cytoskeleton activity modulated the tension signal and demonstrating that DNA hairpin unfolding arises from TCR tension, and the cytoskeleton regulates T-cell mechanics (Figure 3d). Importantly, tension was highly sensitive to co-receptor binding as well as proximal kinase activity – which further underscores that mechanics are highly regulated and related to TCR functional responses.
One limitation of this work pertains to the use of glass substrate as a support for tension probe. Glass is chemically and physically different from the membrane of antigen presenting cell. To better mimic the cell-cell interface, our group and others tethered DNA-TPs to supported lipid bilayer (SLB) to mimic the membrane of antigen presenting cells.[24, 39] SLBs are phospholipid membranes that self-assemble onto a glass slide and retain high lateral fluidity as to cell membrane so that pMHC ligand diffuse laterally on the surface and clusters upon engaging TCR (Figure 4a). To decouple tension signal from density, this tension probe includes two fluorescence reporters for ratiometric measurement. One fluorophore is insensitive to DNA hairpin unfolding and serves as a density reporter and the other fluorophore next to the quencher reports on both forces and sensor density. With this assay, we revealed that TCR experienced forces >4.7 pN during lateral translocation (Figure 4b).
Figure 4. DNA-TPs on fluid membrane.
a) Ratiometric DNA-TPs for mapping TCR force on the SLB. TCR force unfolds DNA hairpin and separates the Cy3B/BHQ2 FRET pair, leading to an enhancement of Cy3B fluorescence over that of Atto488 which is insensitive to mechanical force. b) Representative images showing TCRs exerted forces to antigens on fluid substrate. Reproduced with permission.[39a] Copyright 2016, American Chemical Society
In addition to lateral mobility, another factor that most tension measurements lack pertains to the curvature of cell-cell interface. Unlike coverslip that possesses a flat and continuous contact zone, cell-cell touching interface is highly dynamic with a non-planar geometry.[40] To fill this gap in knowledge, we designed a DNA based microparticle tension sensor (μTS) where DNA tension sensors are anchored onto a microparticle platform (Figure 5a).[37] Note in this assay, instead of using DNA-TPs, we engineered TGT as a tension sensor. Wang et al. originally developed TGT to manipulate the force experienced by receptors. Later they modified TGT with a FRET pair to detect cellular force exceeding the Ttol (Figure 5a). As aforementioned, since the mehcanical melting of DNA duplex is irreversible, TGT tension sensor is not capable of visualizing real-time tension like DNA-TPs, and instead provides peak force signals that accumulate overtime. Although it fails to provide temporal resolution of the force dynamics, TGT tension sensor records the tension history and offers a higher S/N compared to DNA-TPs.
Figure 5. DNA based microparticle tension for investigating TCR force on non-planar geometry.
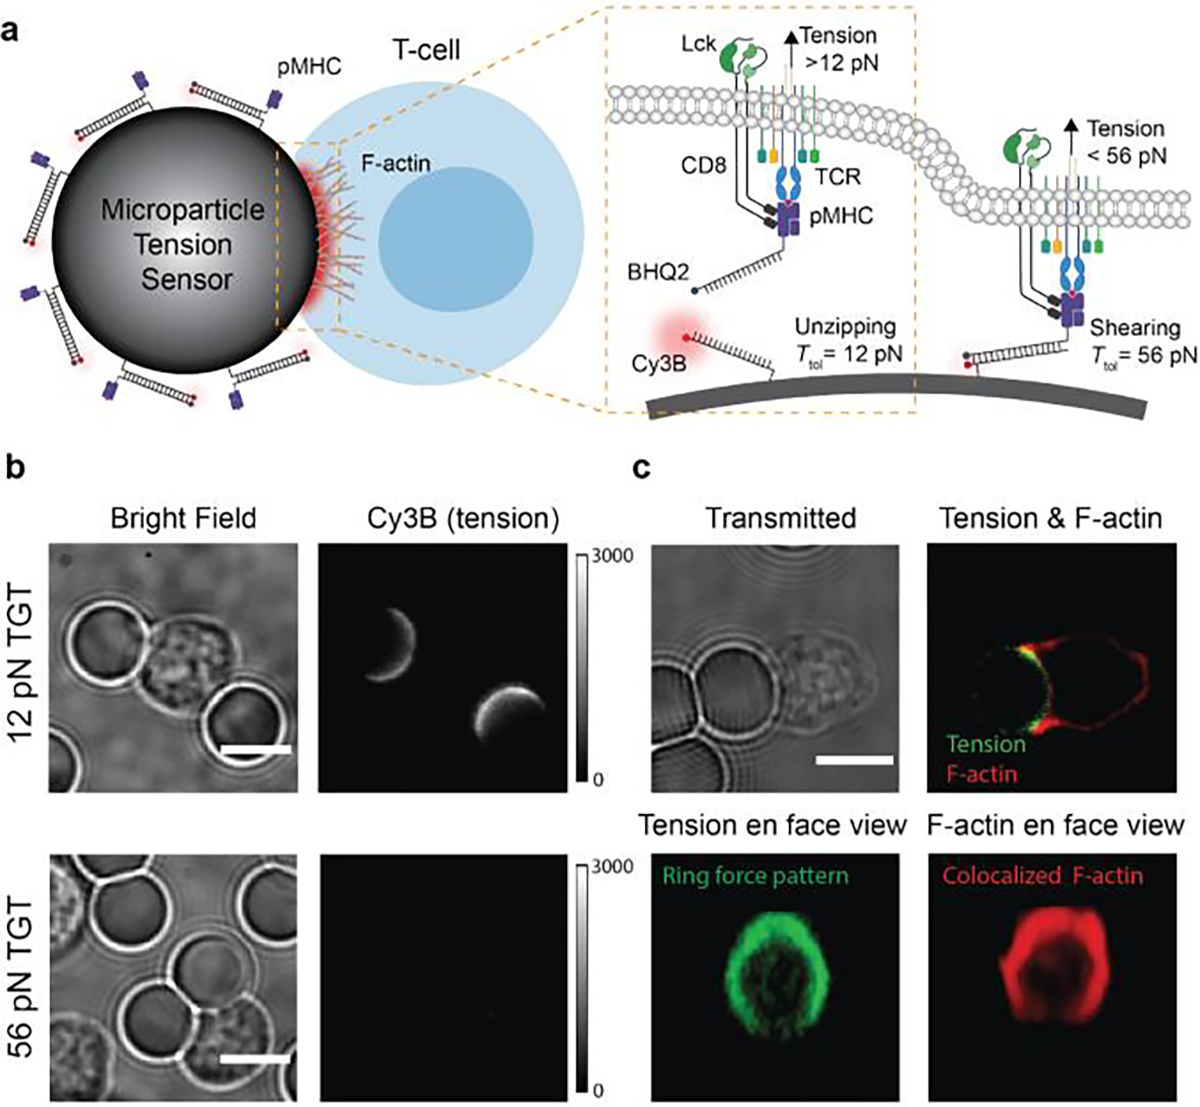
a) Schematic of μTS for mapping TCR forces at cell-μTS junctions. b) Representative images showing the interaction between T-cell and μTS and tension signal at the junction. c) Representative confocal images showing the colocalized ring-like force (green) and F-actin (red) patterns at the T-cell-μTS junction. Reproduced with permission. Copyright 2021, Wiley-VCH.
With TGT modified μTS, we revealed that force experienced by TCR on curved geometry is in the range of 12 to 56 pN (Figure 5b). Z-stack reconstruction of the confocal images resolved the force pattern at the T-cell-bead junction. Interestingly, the tension signal was stronger at the periphery of the synapse and exhibit a ring-like pattern, indicating that TCR-pMHC complexes are more mechanically active at the periphery of a T-cell adhered on non-planar surfaces (Figure 5c). F-actin signal was also enriched at the cell edge and colocalized with the tension signal, suggesting that F-actin polymerization contributed to TCR mechanotransduction. (Figure 5c).
3.2. LFA-1 force
The TCR mechanosensor model has been gaining prominence but it is important to emphasize that T-cell activation is also regulated by co-receptor engagement, such as lymphocyte function-associated antigen 1 (LFA-1), CD28, and the now widely recognized programmed death receptor-1 (PD-1). LFA-1 is an integrin receptor expressed on T cell surface and stabilizes the interaction between T-cell and APC by binding to the intercellular adhesion molecule 1 (ICAM-1) presented on the APC membrane. Because integrin is coupled to cytoskeleton through adaptor proteins such as talin, cytoskeleton contraction as well as cell motion will likely transmit force to LFA-1-ICAM-1 complexes to regulate T-cell function. Our recent work with DNA-TPs revealed that the LFA-1/ICAM-1 complexes experience >4.7 pN forces, and that a small subgroup of LFA-1s at the edge of the T-cell spreading region transmit forces exceeding 19 pN (Figure 6a and 6b).[22] In addition, we demonstrated that the dynamics of actin turnover, as opposed to myosin contractility, plays a primary role in the initial T-cell spreading, motility, and tension generation that is mediated by LFA-1. Furthermore, using multiplexed TPs we concurrently visualized TCR and LFA-1 forces on the same cell and found that LFA-1 forces were primarily found at the lamella while the TCR forces localized to the focal zone of migrating T cells (Figure 6c and 6d).
Figure 6. DNA-TPs for mapping LFA-1 forces.
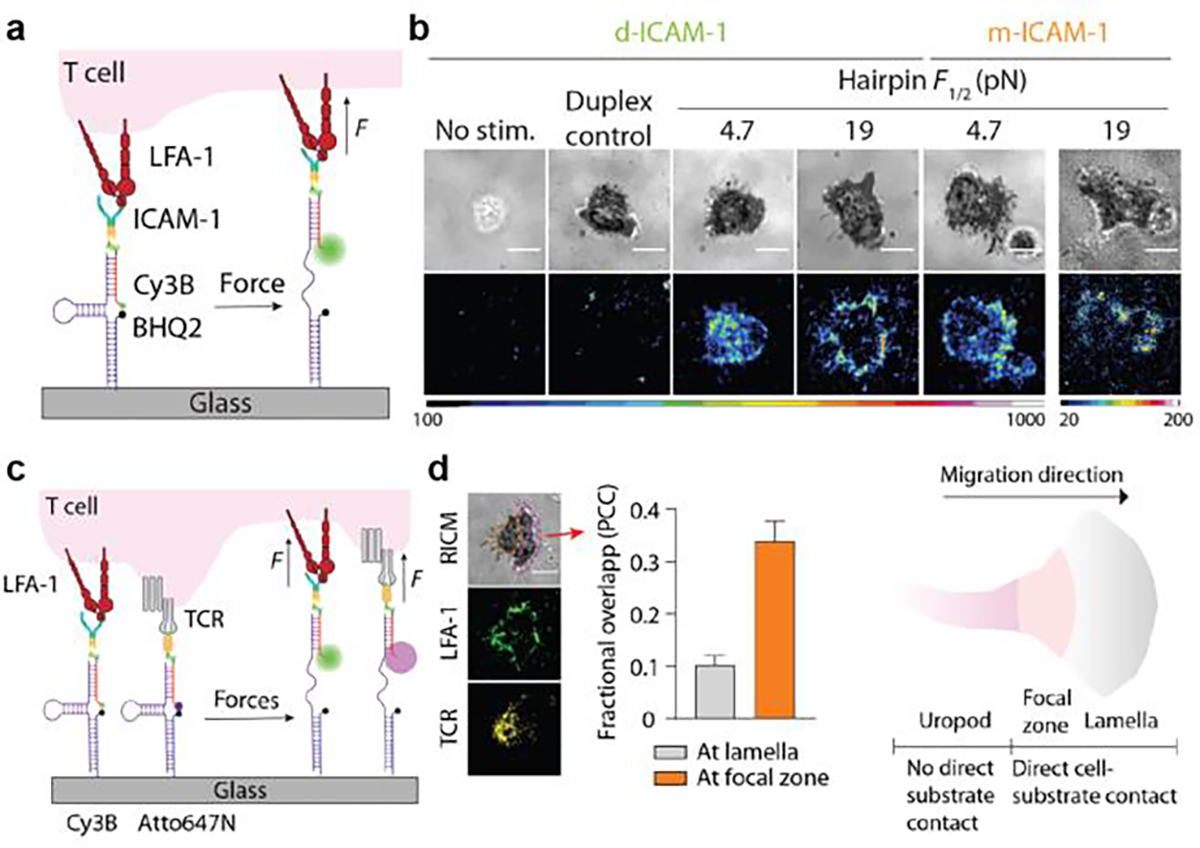
a) Scheme of ICAM-1 DNA-TPs. b) Representative images show that T-cells spread and exerted tension on surfaces coated with DNA-TPs with a F1/2 of 4.7 or 19 pN. c) Schematic showing that spectrally encoded DNA-TPs simultaneously map TCR and LFA-1 forces. d) Tension maps of the LFA-1 and TCR forces. Colocalization analysis confirmed the lack of colocalization of LFA-1 and TCR forces at the lamella region of a spreading T-cell, but moderate colocalization was observed at the focal zone. Reproduced with permission.[22] Copyright 2022, American Association for the Advancement of Science
DNA-TPs are reversible and provide real time spatiotemporal maps of mechanical events. This allows one to elucidate the correlation between force transmission and immune activities at molecular scales. For example, recently Wang et al. examined the association between LFA-1 force and cytotoxic degranulation with DNA-TPs.[41] In the adaptive immune response, cytotoxic T lymphocytes (CTL) bind to virally infected or tumor cells forming an immune synapse. Afterwards, lytic granules accumulate at the immune synapse and are secreted by CTL, releasing perforin and granzyme to kill the target cell. TFM showed that CTLs exert nN scale forces to their substrate and secretory events occur in regions of active force exertion.[10] To identify the receptors guiding force transmission and cytotoxic secretion, Wang et al. seeded CTLs expressing pH sensitive GFP to DNA hairpin TPs surfaces (Figure 7a). GFP fluorescence was initially quenched due to acidic environment of granule and became visible only upon degranulation. They found a marked enrichment of LFA-1 tension signal in the degranulation zone, indicative of an intimate connection between cytotoxic secretion and force exertion through LFA-1 (Figure 7b and 7c). Surprisingly, TCR force were not found to be associated with degranulation. This work underscores the importance of molecular DNA-TPs in elucidating the molecular mechanisms of mechanotransduction, as conventional TFM would not be able to make this conclusion.
Figure 7. LFA-1 forces are correlated with cytotoxic degranulation.
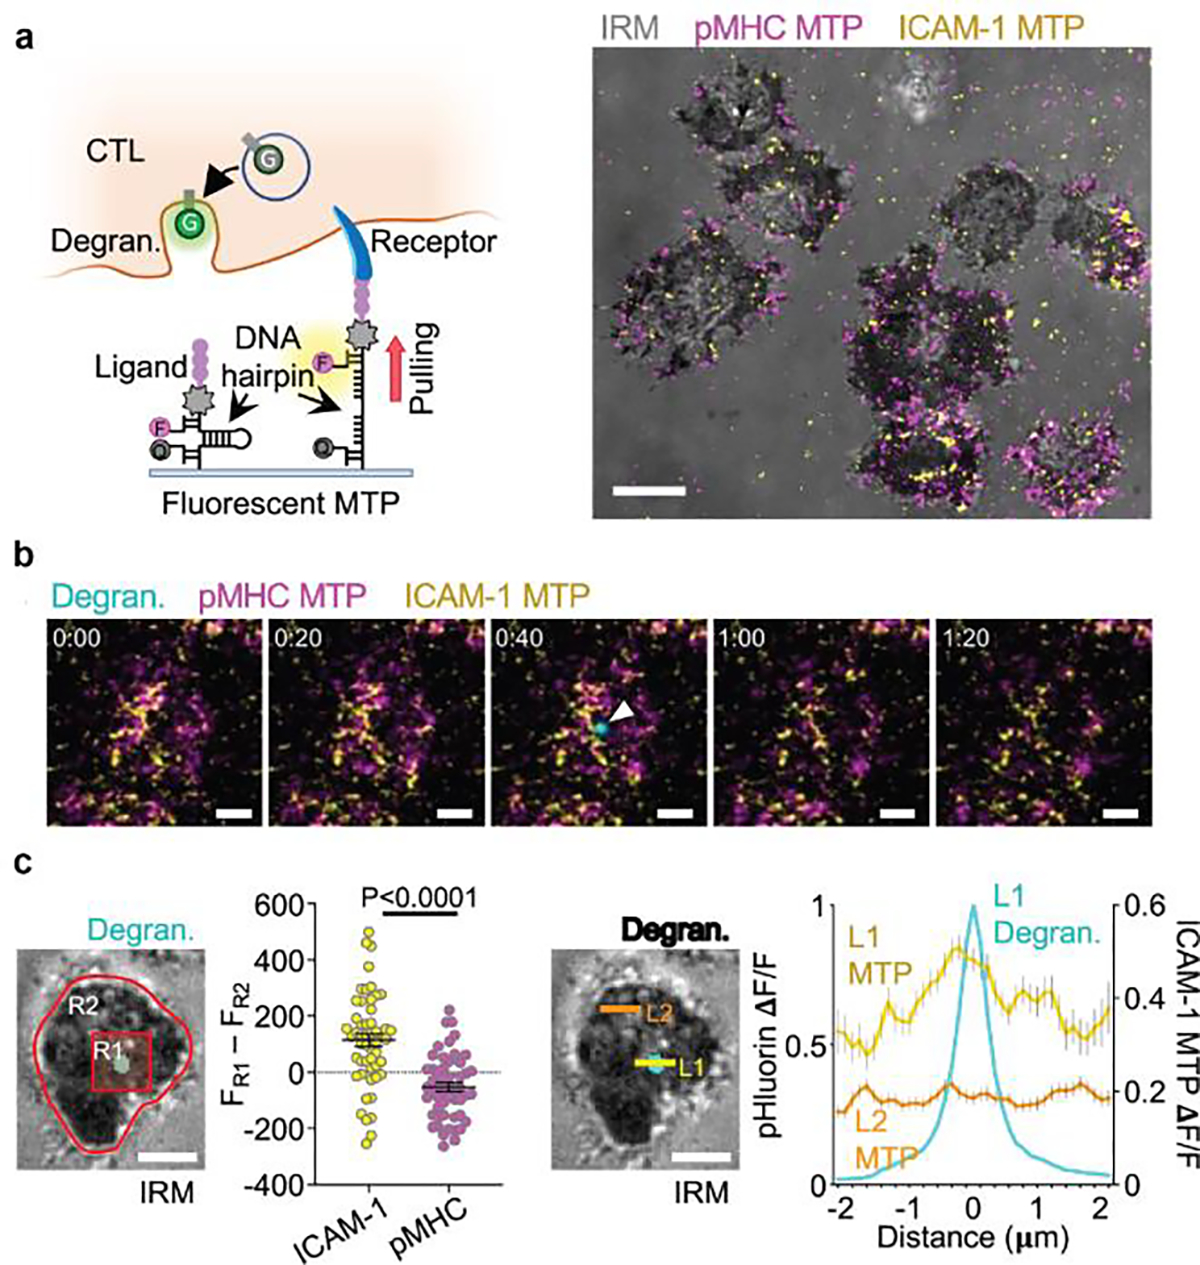
a) Investigating spatiotemporal correlations between degranulation events and receptor force events with DNA-TPs. F = fluorophore, Q = quencher, G = pHluorin. Representative images showing the T-cell spreading and real-time TCR and LFA-1 tension signals underneath the T-cell. b) Time-lapse images showing a representative degranulation event (indicated by a white arrowhead) together with TCR and LFA-1 tension signals. c) Comparison of TCR force and LFA-1 signals at the degranulation spots. Line scan analysis confirmed the correlation between LFA-1 force and degranulation signal. Reproduced with permission.[41] Copyright 2022, Springer Nature.
3.3. BCR force
B-cells are responsible for antibody response in the adaptive immune response. The B-cell receptor (BCR) on the surface of naïve B-cell binds to cognate antigen presented on the APC. BCR-antigen interactions lead to the formation of immunological synapse between B-cells and APCs and initiate BCR signaling, which triggers antigen internalization and presentation of the antigen to helper T-cells for T-cell dependent antibody production. BCR signaling is regulated by a complex combination of affinity and specificity to antigen. Tolar and colleagues showed that B-cell use mechanical energy to help discriminate antigen affinity[8a]. It is believed that myosin II driven pulling forces rupture BCR-antigen bonds and promote internalization of only high affinity BCR clusters for antigen processing. In other words, the B cell performs a mechanical test of BCR-antigen bonds to select for high affinity and specificity. However, the magnitude of the force transmitted to the BCR-antigen bonds was unclear from the initial proposal of this model. To address this limitation, Tolar and coworkers developed a ratiometric DNA-TP to investigate the BCR mechanics at the B-cell synapse formed on SLB (Figure 8a). The sensor was decorated with anti-Igκ antigen at the DNA terminus allowing the recognition of BCR. When F> F1/2, the DNA TP unfolds and separates the Atto647N/BHQ2 FRET pair, leading to an enhancement of Atto647N fluorescence over that of Atto550 which is insensitive to mechanical force (Figure 8a).[24] With this design, they found that naïve B-cells opened DNA hairpin with F1/2 of 7 pN but not 9 or 14 pN, indicating that BCR-antigen bonds experience force less than 9 pN. In contrast, germinal center (GC) B cells showed more frequent events at >7 pN than naïve B-cells and a subset of BCRs transmit F>14 pN (Figure 8b and 8c). This suggests that GC B-cells are more mechanically active and in line with the finding that GC B-cells exhibit stronger myosin contractility and extract antigen with better affinity discrimination than naive B cells. Furthermore, Kwak et al. employed this ratiometric DNA-TP design to study human dark zone (DZ) and light zone (LZ) GC B-cells[39b]. Here, human BCRs clustered and concentrated in the area of contact forming pod-like structures enriched in actin and ezrin. LZ and DZ GC B-cells exerted F>9 pN to BCR-antigen bonds and the force was restricted to the pod-like contacts (Figure 8d and 8e). This is an exciting development as it demonstrates the application of using DNA-TPs in human immunology.
Figure 8. DNA-TPs for mapping BCR forces.
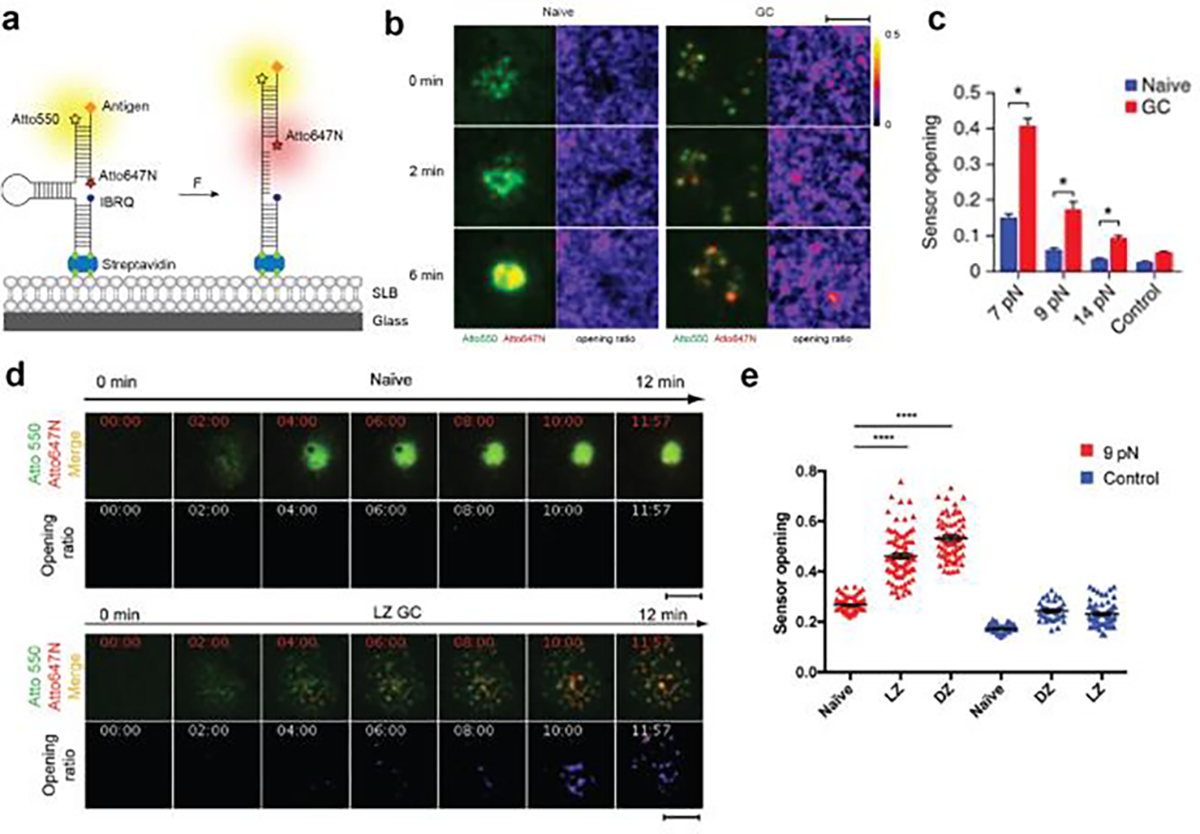
a) Design of DNA-TPs for measuring BCR forces. b) Time lapse images showing the growth of BCR force signal exerted by naïve and GC B-cells. c) Quantitative comparison of tension signal of naïve and GC B-cells on different F1/2 DNA-TPs. Reproduced with permission.[24] Copyright 2016, Springer Nature. d) Time lapse images showing the dynamics of BCR force signal across the human naïve and LZ GC B-cell surfaces. Reproduced with permission. e) Quantification of tension signal exerted by human naïve and GC B-cells.[39b] Copyright 2018, American Association for the Advancement of Science
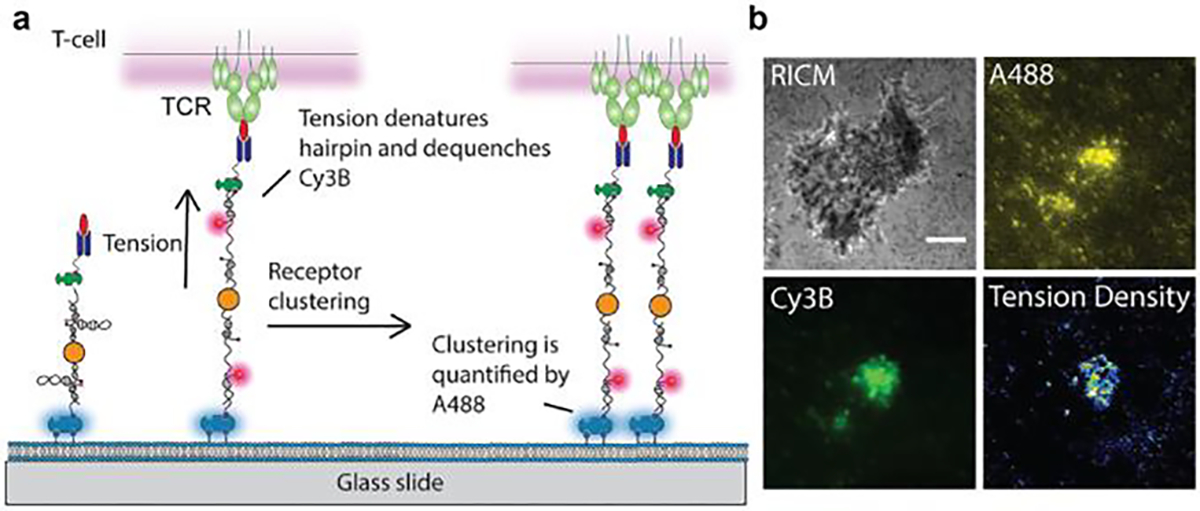
3.4. Force triggered DNA binding for capturing transient mechanical events
One limitation of DNA-TPs in detecting mechanical forces in immunology pertains to its low S/N. In contrast to other receptors, immunoreceptors are expressed at relatively low levels (e.g.,~105 TCRs expressed on the surface of CTL) and therefore offer a sparse density of mechanical events to image. In addition, receptor-ligand interactions are highly transient with a subsec lifetimes,[7b] which is difficult to capture by CCD cameras. To enhance the tension signal, one could use irreversibly ruptured DNA duplex as a tension sensor. However, DNA duplexes require as a minimum F> 12 pN and therefore this threshold is not suitable for detecting weak mechanical events by immunoreceptors. To address this need, our lab developed a general strategy for force-induced binding.[23] Essentially, the hairpin TP conceals a binding site for a “lock” oligo, but the binding is kinetically hindered by the hairpin. Only when the F>F1/2 and the hairpin unravels is the binding site exposed. The binding prevents hairpin refolding and thus this “locking” strategy allows the TP to accumulate force signal. The scheme in Figure 9a shows a locking DNA strand that selectively hybridizes to mechanically opened hairpin and prevents its refolding. With this strategy, the force signal at TCR-pMHC bonds accumulated overtime and was enhanced ~190 fold after 10 min (Figure 9b). Signal accumulation levels correlated with the potency of antigens and decreased when confronting T-cells with noncognate antigens. This suggested less frequent mechanical sampling for weak antigens and underscored the role of mechanical forces in antigen discrimination. Furthermore, with the locking strategy, previously nondetectable PD-1 receptor forces were resolved and the results demonstrated that the F> 4.7 pN and featured a punctate pattern (Figure 9c).
Figure 9. Force triggered DNA binding for capturing transient force events.
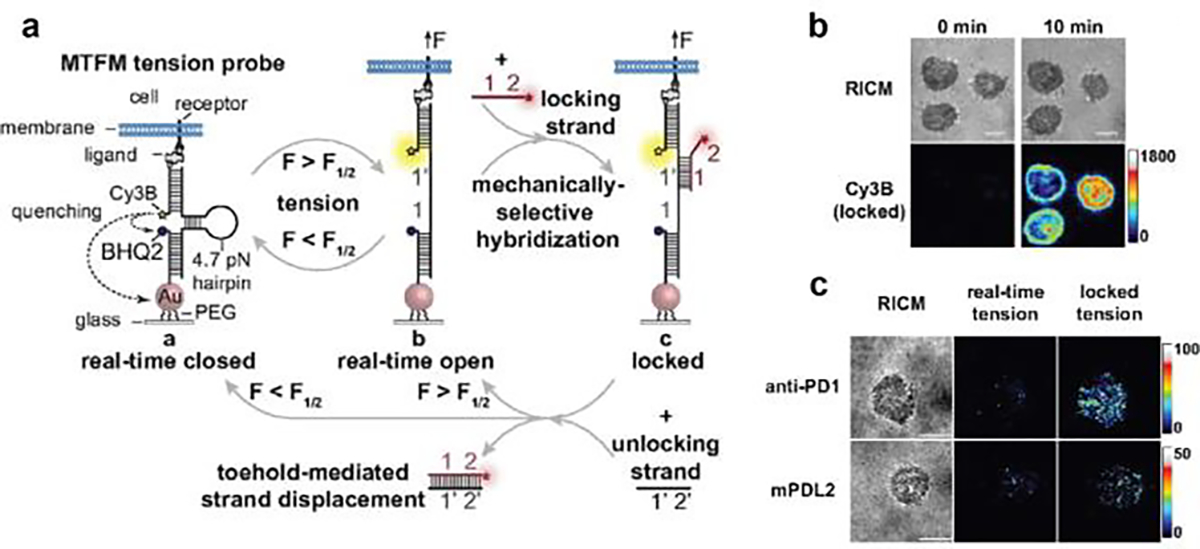
a) Schematic showing that locking strand selectively binds to mechanically opened DNA-TPs and locked it at the open state. Unlocking strand can release the locking strand through toehold-mediated strand displacement reaction. b) Time lapse imaging showing the TCR tension signal increased over time after addition of locking strand. c) Representative images showing PD-1 tension signal before (real-time tension) and after adding locking strand (locked tension). Reproduced with permission.[23] Copyright 2019, National Academy of Sciences, USA.
4. DNA as a mechanical gate to manipulate mechanotransduction in the immune system
4.1. The magnitude of TCR force amplifies T-cell recognition
Upon TCR engagement, Src tyrosine kinase (Lck) phosphorylates the immunoreceptor tyrosine-based activation motif (ITAM) located at TCR ζ chain subunits, which leads to sequential recruitment of signaling molecules and adaptors to the TCR/CD3 complexes including ZAP70, SLP76, LAT and PLCγ1.[5] Activated PLCγ1 hydrolyzes PIP2 into IP3, which triggers Ca2+ influx to activate the T-cell. TCR signaling is highly sensitive and specific as single pMHC ligands are sufficient to activate the T-cell and elicit cytokine secretion.[42] Several models have been proposed to account for robust T-cell triggering include kinetic proofreading,[43] serial triggering,[44] kinetic segregation[45], multimerization,[46] and conformational change.[47] The conformational change model postulates that the structure of the TCR changes upon interaction with stimulatory pMHC and makes the ITAM region accessible to phosphorylation by Lck. However, the trigger that transitions TCR structure from inactive to active state remains controversial. Reinherz and Lang et al. reported that applying forces to TCR-antigen bonds drove conformation change of TCR and led to T-cell activation.[4] This data led to the mechanosensor model which suggests that TCR transmits forces generated by the T cell cytoskeleton to its antigen and these forces contribute to TCR triggering by driving a conformational change in the TCR. Zhu, Evavold, Garcia and others also argue for the existence of “catch bonds” between the TCR and antigen where the complex is stabilized under moderate 10–20 pN forces.[7b, 48] To validate the role of mechanical force in TCR signaling, our lab leveraged the TGT design to manipulate the forces experienced by TCR and tracked T-cell signaling level change (phosphorylation of signaling molecules, pYZAP70). As aforementioned, TGT is comprised of DNA duplex with a defined force tolerance (Ttol) that terminates the mechanotransduction when the F > Ttol. Note that Ttol is tunable and dependent on force application geometry. In our work, we anchored antigens with TGT of Ttol = 12 and 56 pN (Figure 10a). As demonstrated by DNA-TPs, TCRs experience force in the range of 12 to 19 pN. With the 12 pN TGT design, the TCR force would rupture the DNA duplex and terminate the mechanotransduction thus dampening signaling. This is in contrast to the 56pN TGTs, which remains intact under TCR force and maintain force transduction. As expected, T-cell displayed stronger pYZap70 signal when spreading on 56 pN TGT antigen surfaces compare to 12 pN TGT (Figure 10b), suggesting that the mechanical force enhanced the TCR signaling. By contrast, the less potent antigens did not show different pYZAP70 responses to forces (Figure 10c) and there was no significant difference among antigens with 12 pN TGT. This work demonstrated that mechanical forces at the TCR-antigen bonds enhance the TCR signaling and antigen discrimination.
Figure 10. TCR forces amplify the specificity of T-cell recognition.
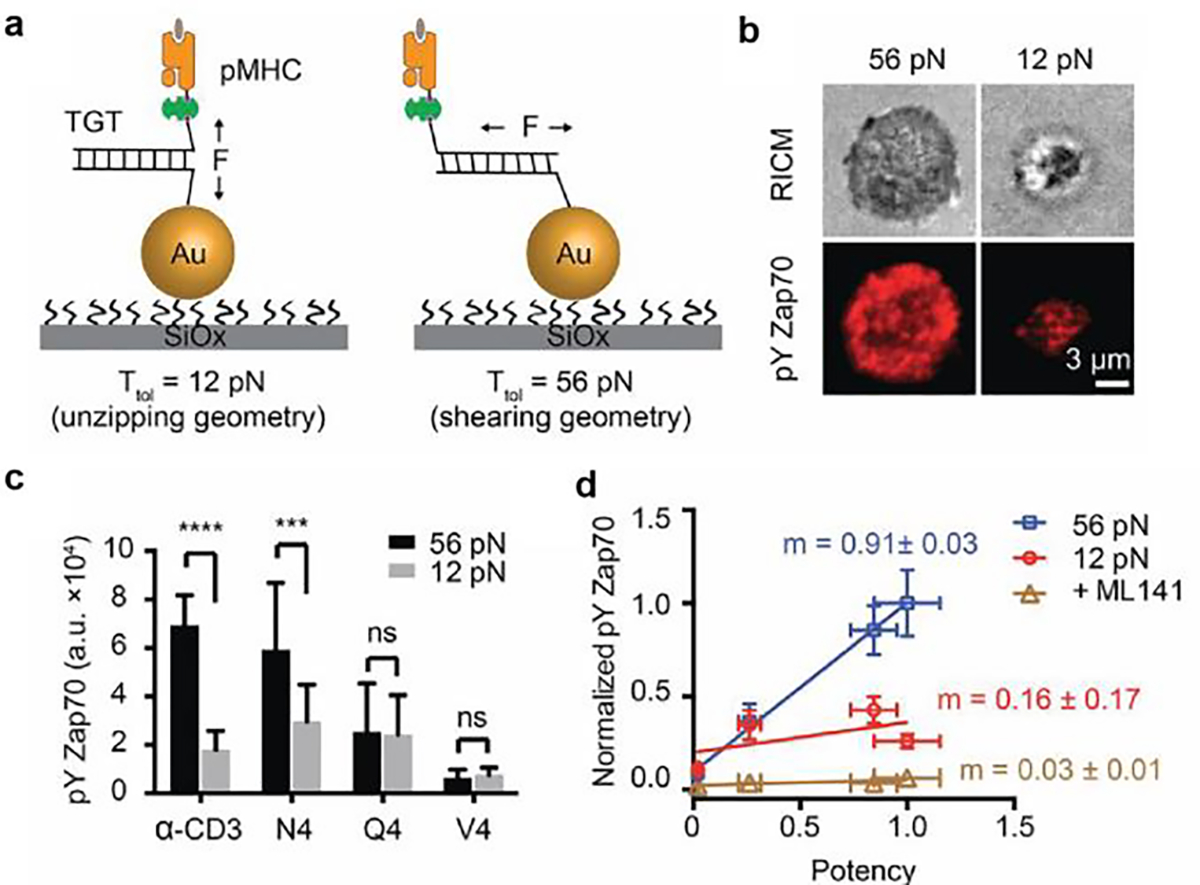
a) Schematic showing pMHC tagged TGTs can be utilized to manipulate TCR forces. The threshold of TGT is dependent on the force applying geometry which is tuneable by changing the ligand position. b) Representative images showing stronger T-cell activation signal on 12 pN TGT surfaces compared with 56 pN TGT surfaces. c) Bar graphs showing pYZap70 levels of T-cells seeded on surface presenting antigens with different potencies. Antigens were anchored on 12 and 56 pN TGTs. d) Plot showing pYZAP70 levels of T-cells in response to antigens on 12 and 56 pN TGT surfaces. The slopes (m) of lines indicate the specificities of T-cells to antigens in each condition. Reproduced with permission.[8b] Copyright 2016, National Academy of Sciences, USA.
4.2. The magnitude of LFA-1 force fine tunes TCR signaling and antigen discrimination
As discussed earlier in this review LFA-1 not only functions as an adhesion molecule between the T-cell and APC, but also as a coreceptor that transduces costimulatory signal to amplify TCR activation. For example, LFA-1 engagement increases the antigen potency and discriminatory power of TCR.[49] In vivo studies also showed that LFA-1 decreases the threshold of TCR signaling and the antigen dose required for T-cell activation and proliferation.[50] Given that LFA-1 integrin is linked to the cytoskeleton through adaptor proteins (talin and vinculin), it has been reported that the activity of LFA-1 is regulated by cytoskeleton dynamics. Springer and our lab demonstrated that actin polymerization transmits forces through LFA-1 to its ligand ICAM-1.[22, 51] The force signal is correlated with the active conformation of LFA-1 integrin, suggesting that the force facilitates the conformation change of LFA-1 for high affinity ligand binding and costimulatory signaling. Disruption of these forces via depletion of the adaptor molecule talin abrogates T-cell effector response.[41] To correlate this force to signaling events and determine how the magnitude of LFA-1 force tunes T-cell activation, our lab used the TGT design to tune the mechanical resistance of ICAM-1 ligands (Figure 11a).[22] We found that ICAM-1 tethered onto 56 pN TGT induced stronger T-cell spreading and TCR signaling compared to that of 12 pN TGT, suggesting that > 12 pN LFA-1 force is needed to promote TCR-mediated T-cell activation (Figure 11b). Interestingly, the signaling level difference between 12 and 56 pN TGT became less pronounced when the cognate TCR antigen on the substrate was replaced with a less potent antigen, suggesting that LFA-1/ICAM-1 mechanical signaling promotes TCR antigen discrimination (Figure 11c). To further explore the cooperation between TCR and LFA-1 forces in tuning TCR signaling, we designed a multiplexed TGT surface that presents both ICAM and pMHC to simultaneous manipulate TCR and LFA-1 force. (Figure 11d). We found that signaling was the weakest when antigen and ICAM-1 were both presented by 12 pN TGT. However, signaling was enhanced when either ICAM-1 or antigen was anchored to 56-pN TGTs (Figure 11e). This type of response is reminiscent of a “mechanical OR gate”, where the mechanical forces through each ligand-receptor pair functions as an “input” and the cell activation is the “output”.
Figure 11. LFA-1-ICAM-1 force regulates TCR signalling.
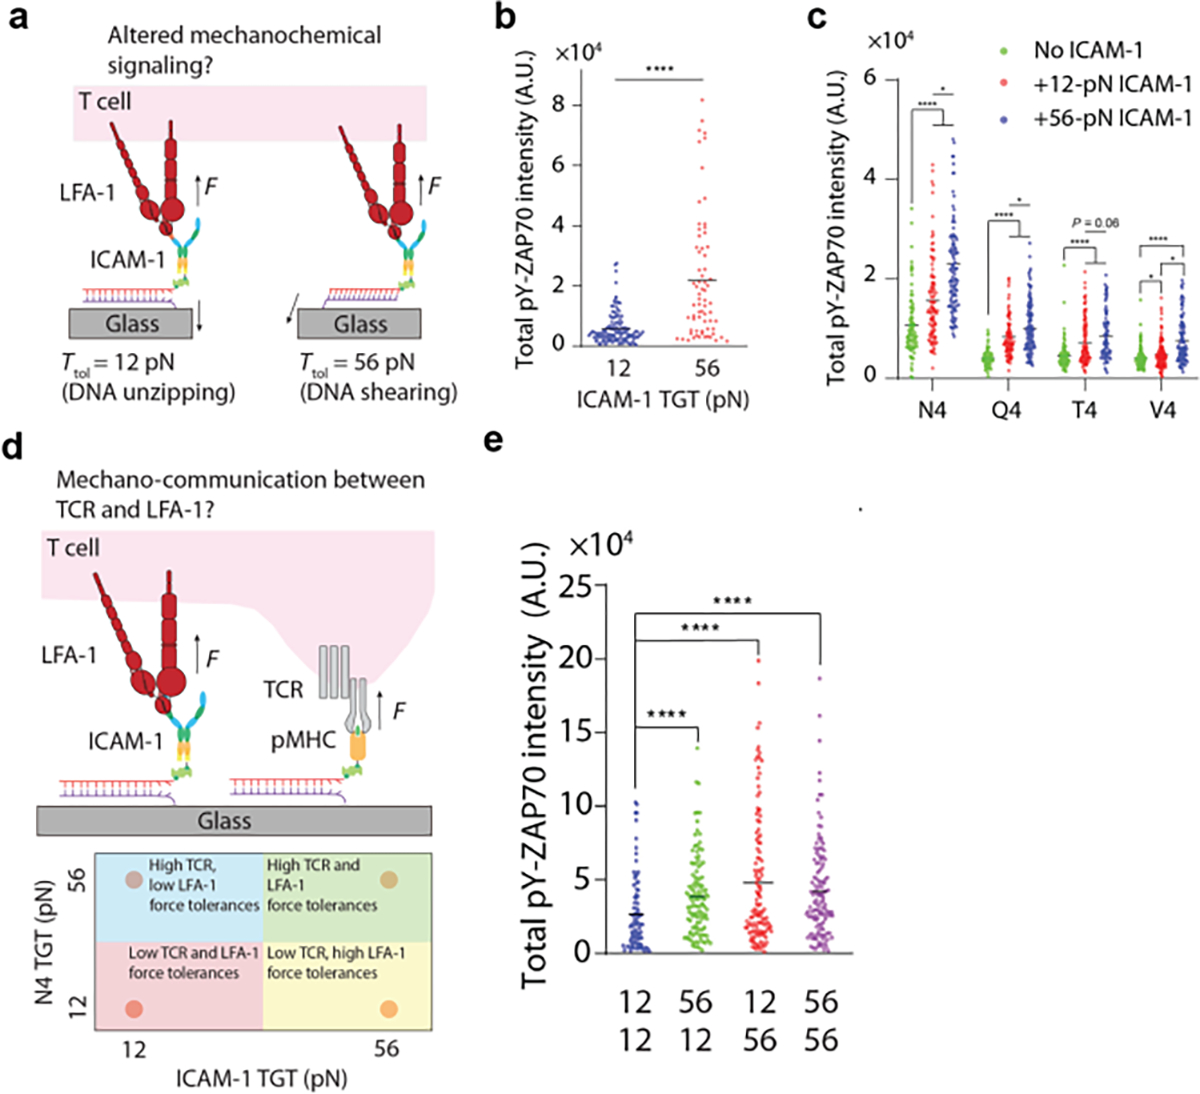
a) ICAM-1 TGT for manipulating the forces transmitted to LFA-1-ICAM bonds. b) Plot showing T-cell displayed higher pYZAP70 intensities on 12 pN ICAM-1 TGT substrates. c) Plot quantifying the pYZap70 intensity of cells seeded on altered peptide antigens together with 12/56 pN ICAM TGTs d) Schematic showing multiplexed TGT surfaces where ICAM and antigen were both tethered to 12 or 56 TGT. e) Plot quantifying pYZap70 levels on multiplexed TGT surfaces. Reproduced with permission.[22] Copyright 2022, American Association for the Advancement of Science
4.3. The magnitude of BCR force impacts on BCR signaling and activation
Prior work reported that B-cell activation is sensitive to mechanical cues. For example, increasing the stiffness of the antigen presenting substrate amplifies B-cell activation.[52] Inhibiting actomyosin contractility impedes the formation of B-cell immune synapse and reduces BCR-dependent signaling.[53] DNA-TPs revealed the presence of mechanical forces at BCR-antigen bonds.[24] To investigate their role in regulating B-cell signaling and activation, Wan et al. anchored the BCR antigen to TGTs and tested a series of 8 TGT sensors with Ttol = 12, 16, 23, 33, 43, 50, 54, and 56 pN respectively to modulate BCR forces (Figure 12a).[54] After B-cell recognition, the BCRs accumulate at the B-cell immune synapse as a hallmark of activation. Accordingly, the authors analyzed the accumulation of BCR in response to these TGT molecules to determine how the mechanical forces delivered to BCR-antigen bonds regulate BCR activation. B-cell activation levels increased with the Ttol of TGTs. Three levels of B-cell activation were observed on low-force (12–16 pN) TGTs, the intermediate-force (23–43 pN) TGTs and the high-force (50–56 pN) TGTs, respectively (Figure 12b). This multi-level effect also applied to the volume of BCR microclusters generated on TGT surfaces, suggesting that mechanical forces are important to BCR clustering (Figure 12c). The authors also quantified BCR signaling based on the recruitment of phosphorylated signaling molecules to the B-cell immune synapse. They found that BCR signaling levels decreased with the lower TGT force thresholds and confirmed that mechanical forces transmitted to BCR-antigen bonds promotes BCR signaling (Figure 12d). These findings were observed on IgM BCRs on naïve B-cell membrane. However, memory B-cells displaying IgG and IgE BCRs are independent of mechanical forces ranging from 12 to 56 pN, meaning activation of memory IgG-BCRs or IgE-BCRs does not rely on mechanotransduction or requires a force smaller than 12 pN.
Figure 12. BCR forces facilitate BCR signaling and B-cell activation.
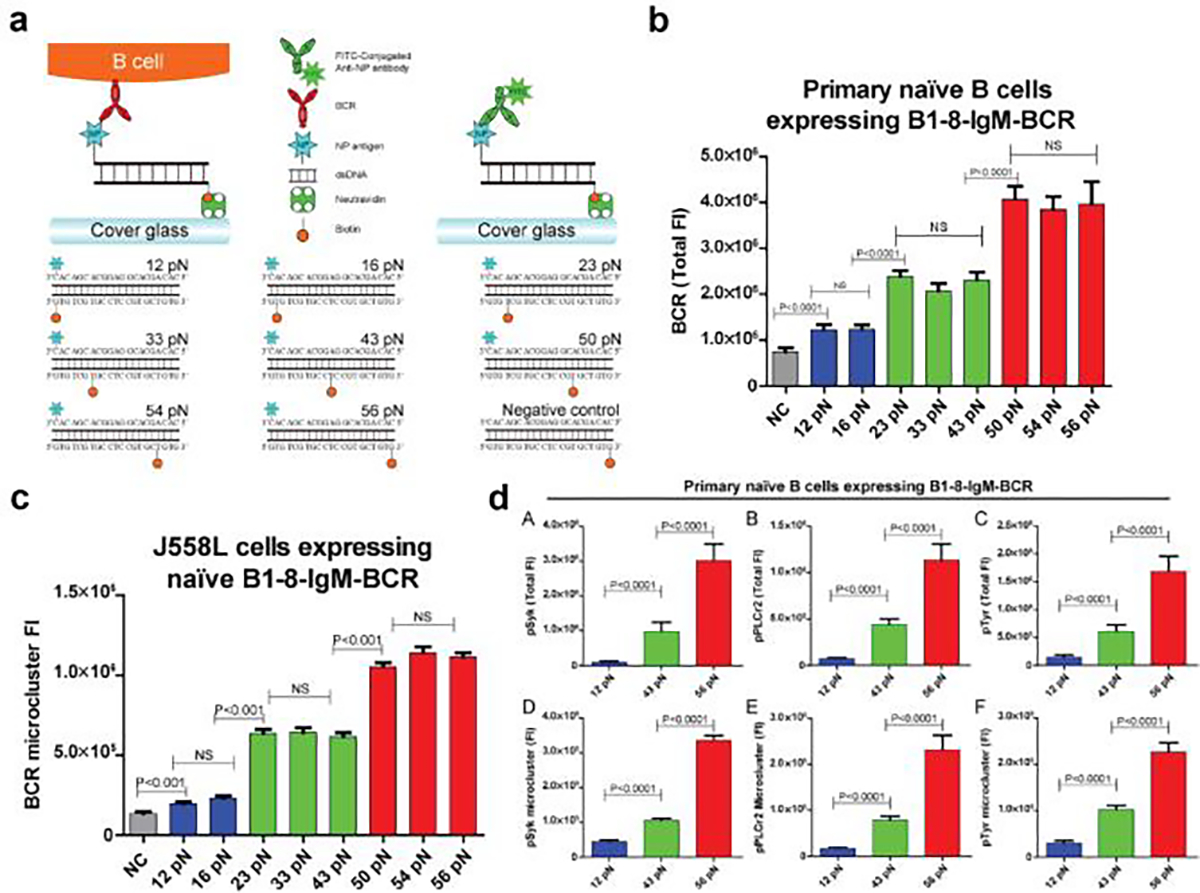
a) Schematic showing the designs of TGT with thresholds ranging from 12 to 56 pN to manipulate BCR forces. b) Bar graphs comparing the levels of BCR accumulation on different TGT surfaces. c) Bar graphs illustrates the variations in the sizes of BCR microclusters across different TGT surfaces. d) Bar graphs quantifying the recruitments of signaling molecules pSyk, pPLCγ2, and pTyr to the B-cell IS. Reproduced with permission.[54] Copyright 2015. eLife Sciences Publications.
4. Summary and outlook
In this minireview, we summarized the recent development of DNA nanotechnology for investigating mechanical forces in the immune system. We discussed the mechanical properties of DNA structures (DNA hairpins and duplexes) and how they were employed as probes or gates to visualize or manipulate the forces experienced by immunoreceptors. Both DNA hairpins and DNA duplex are responsive to pN scale cellular forces, yet their structural changes under force are different. DNA hairpins rapidly unfold when force exceeds its F1/2 and fold back when force diminishes. This reversible change allows DNA hairpins to sense immunoreceptor forces in real time when tagged with a FRET pair. This tension probe design termed as DNA-TPs have been leveraged by our lab and colleagues in the past decade to map the immunoreceptor forces and demonstrate the association of cell mechanical forces with immune cell activation and cytotoxic secretion. In addition to mapping the dynamics of cell forces, by varying the GC content/length of DNA-TPs, one can change the force threshold of DNA-TPs to detect different magnitudes of forces and quantify the immunoreceptor forces. For example, TCR force can open 12 pN but not 19 pN DNA-TPs in the absence of ICAM-1, suggesting LFA-1 engagement enhances TCR mechanics. One limitation of DNA-TPs is that the F1/2 is not infinitely tunable and reaches a limit around 19 pN, which restricts the detection of mechanical events >19 pN. Recently Li et al. combined the concepts of TGT and DNA-TPs and designed a reversible DNA tension sensor design (RSDTP) capable of mapping real-time force up to 60 pN. [55] Applying this design to immunoreceptor force could identify strong mechanical events and determine whether immune activities such as cytotoxic secretion is regulated with strong mechanical events.
In contrast to DNA hairpin, mechanically melting a DNA duplex is an irreversible process. Because of the irreversible rupture, DNA duplex was used mainly as a tension gauge tether (TGT) to control the peak force experienced by immunoreceptors and study the role of mechanical force in immune cell signaling. The levels of TCR and BCR signaling were found to decrease with the magnitude of force experienced by immmunoreceptors. In addition to manipulating force transduction, one could also modify TGT with a FRET pair to detect force that leads to DNA denaturation. However, because DNA duplex rupture is irreversible, TGT tension sensor provides a history tension signal instead of real-time tension signal displayed by DNA-TPs. It is therefore not suitable for studying the force dynamics and investigating the correlation between immunoreceptor forces and signaling events. Nonetheless, TGT tension sensor can still be used to detect and measure the receptor forces with an even broader force range (12–56 pN) than DNA-TPs.
There are some advances in DNA force sensors that we do not cover in this review but could be employed into immune cells to better characterize the role of mechanical force in immune responses. For example, as more and more of the mysteries of receptor mechanics and its role in cell biology have been solved, recent research has been pushing imaging resolution to the nanometer level for force mapping. Recently our lab and Jungmann et al. combined DNA-TPs with DNA-PAINT to visualize integrin tension signal at a resolution below 100 nm.[56] This technique if applied to immune cells would help resolve the mechanical events at TCR clusters composed of hundreds of TCR-antigen bonds in nm size. Second, DNA-TPs only provide the magnitude of cell forces. The directions of the immunoreceptor forces remain unclear. Accumulating evidence suggests TCR is an anisotropic mechanosensor. In optical tweezer experiments, T-cell was activated only when force was applied tangentially relative to the T cell, suggesting TCR is sensitive to shear force.[4b] Alternative explanation, however, may exist. For example, tangentially pulling the bead will make the applied force unevenly distributed on TCR-pMHC complexes and concentrate the magnitude of forces at the area where fewer TCRs engage.[7a] Nonetheless, it is necessary to develop a tension probe that can sense both the magnitude and direction of molecular TCR forces to complement the TCR mechanosensor model. We and the Mattheyses lab coupled fluorescence polarization microscopy with DNA-TPs to visualize the orientations of platelet integrin forces.[57] This approach called molecular force microscopy could also be applied to immune cells to map the 3D orientation of TCR forces and help investigate anisotropic TCR mechanosensing. Lastly, recently our lab leveraged the DNA hybridization chain reaction and Cas12a system to amplify the force signal detected by DNA force probes.[58] These techniques could also be applied to immune cells to boost the immunoreceptor force signal especially for receptors with a low surface density or short bond lifetime.
DNA molecules are not only used as a force sensor but also an efficient drug delivery platform. Interestingly, the binding affinity between encapsulated drug and DNA is highly sensitive to external force. Stejskalova et al. have demonstrated that pN scale forces can regulate the binding affinity between the growth factor and its corresponding DNA aptamer by ten to twelve orders of magnitude.[59] Lei et al. recently showed that T-cell force can unzip DNA gatekeepers on the silica beads and release drug preloaded in the mesopores.[60] These findings suggest that cellular forces at immune synapse between T-cell and target cell can be harnessed to unwind DNA nanostructures encapsulating adjuvant/anticancer drugs and control drug release in a mechanically selective manner to enhance therapeutic outcomes in immunotherapy.
Despite the encouraging advances that have been made, there are still some challenges and questions to be addressed. For example, DNA sensors suffer from degradation by nucleases and proteases secreted by cells. Nuclease-resistant and thermostable DNA-TPs are in demand, which will enable continuous force mapping for immune cells in culture and thus allow to investigate the role of mechanical force in long-term immune response. Moreover, so far most of the force measurements for immunoreceptor forces are performed on planar substrates, which is not deformable and displays a flattened topology not representative of the immune cell-target cell contacts. Furthermore, though the mechanosensor model postulates mechanical force drives TCR conformation change and facilitates TCR signaling, there is no direct evidence showing the spatiotemporal correlation between force and structural changes at TCR-antigen bonds. Coupling the DNA tension probes with in-situ proximity FRET assays is likely a good starting point for such investigations.
Acknowledgements
K.S. acknowledges the financial support from NIH (R01 AI172452 and R01 GM131099). Y.H. is a recipient of the National Cancer Institute Predoctoral to Postdoctoral Fellow Transition Award (F99CA274690). Y.D. is a recipient of American Heart Association Postdoctoral Fellowship (23POST1028975).
Biographies

Yuesong Hu received his BSc from Lanzhou University and is currently pursuing his PhD at Emory University under the supervision of Prof. Khalid Salaita. His current research interests focus on studying the role of mechanical forces in T-cell functions with DNA nanotechnologies.

Yuxin Duan received his BSc from Peking University in 2017 and PhD in chemistry from Emory University in 2022 co-mentored by Prof. Khalid Salaita and Prof. Yonggang Ke. He is currently an American Heart Association Postdoctoral Fellow at Emory University. His research interests focus on developing novel nucleic acid nanotechnologies for biophysics studies and clinical application such as platelet diagnostic method.

Khalid Salaita is the Samuel Chandler Dobbs Professor of Chemistry and a Program Faculty in the Department of Biomedical Engineering at Emory University in Atlanta, Georgia (USA). Khalid obtained his Ph.D. with Prof. Chad Mirkin at Northwestern University (Evanston, IL) in 2006. From 2006–2009, Khalid was a postdoctoral scholar with Prof. Jay T. Groves at the University of California at Berkeley (USA). In 2009, Khalid started his own lab at Emory University, where he develops molecular probes to study living systems. His group has pioneered the development of molecular force sensors, DNA mechanotechnology, and smart nucleic acid drugs. Khalid has been recognized with thethe Alfred P. Sloan Research Fellowship, the Camille-Dreyfus Teacher Scholar award, the National Science Foundation Early CAREER award, and the Kavli Fellowship.
References
- [1].Huppa JB, Davis MM, Nat. Rev. Immunol. 2003, 3, 973–983. [DOI] [PubMed] [Google Scholar]
- [2].a Hoffman BD, Grashoff C, Schwartz MA, Nature 2011, 475, 316–323; [DOI] [PMC free article] [PubMed] [Google Scholar]; b Vining KH, Mooney DJ, Nat. Rev. Mol. Cell Biol. 2017, 18, 728–742; [DOI] [PMC free article] [PubMed] [Google Scholar]; c Trepat X, Wasserman MR, Angelini TE, Millet E, Weitz DA, Butler JP, Fredberg JJ, Nat. Phys. 2009, 5, 426–430; [Google Scholar]; d Huse M, Nat. Rev. Immunol. 2017, 17, 679–690. [DOI] [PMC free article] [PubMed] [Google Scholar]
- [3].Murrell M, Oakes PW, Lenz M, Gardel ML, Nat. Rev. Mol. Cell Biol. 2015, 16, 486–498. [DOI] [PMC free article] [PubMed] [Google Scholar]
- [4].a Das DK, Feng Y, Mallis RJ, Li X, Keskin DB, Hussey RE, Brady SK, Wang JH, Wagner G, Reinherz EL, Lang MJ, Proc. Natl. Acad. Sci. U S A 2015, 112, 1517–1522; [DOI] [PMC free article] [PubMed] [Google Scholar]; b Kim ST, Takeuchi K, Sun ZY, Touma M, Castro CE, Fahmy A, Lang MJ, Wagner G, Reinherz EL, J. Biol. Chem. 2009, 284, 31028–31037. [DOI] [PMC free article] [PubMed] [Google Scholar]
- [5].Gaud G, Lesourne R, Love PE, Nat. Rev. Immunol. 2018, 18, 485–497. [DOI] [PubMed] [Google Scholar]
- [6].a Harrison DL, Fang Y, Huang J, Frontiers in Physics 2019, 7, 45; [DOI] [PMC free article] [PubMed] [Google Scholar]; b Chen W, Zhu C, Immunol. Rev. 2013, 256, 160–176. [DOI] [PMC free article] [PubMed] [Google Scholar]
- [7].a Feng Y, Brazin KN, Kobayashi E, Mallis RJ, Reinherz EL, Lang MJ, Proc. Natl. Acad. Sci. U S A 2017, 114, E8204–E8213; [DOI] [PMC free article] [PubMed] [Google Scholar]; b Liu B, Chen W, Evavold BD, Zhu C, Cell 2014, 157, 357–368; [DOI] [PMC free article] [PubMed] [Google Scholar]; c Hu KH, Butte MJ, J. Cell Biol. 2016, 213, 535–542. [DOI] [PMC free article] [PubMed] [Google Scholar]
- [8].a Natkanski E, LEE W, Mistry B, Casal A, Molly JE, Tolar P, Science 2013, 340, 1587–1590; [DOI] [PMC free article] [PubMed] [Google Scholar]; b Liu Y, Blanchfield L, Ma VP, Andargachew R, Galior K, Liu Z, Evavold B, Salaita K, Proc. Natl. Acad. Sci. U S A 2016, 113, 5610–5615. [DOI] [PMC free article] [PubMed] [Google Scholar]
- [9].Colin-York H, Javanmardi Y, Skamrahl M, Kumari S, Chang VT, Khuon S, Taylor A, Chew TL, Betzig E, Moeendarbary E, Cerundolo V, Eggeling C, Fritzsche M, Cell Rep. 2019, 26, 3369–3379. [DOI] [PMC free article] [PubMed] [Google Scholar]
- [10].Basu R, Whitlock BM, Husson J, Le Floc’h A, Jin W, Oyler-Yaniv A, Dotiwala F, Giannone G, Hivroz C, Biais N, Lieberman J, Kam LC, Huse M, Cell 2016, 165, 100–110. [DOI] [PMC free article] [PubMed] [Google Scholar]
- [11].a Kumari A, Pineau J, Lennon-Dumenil AM, Balland M, Pierobon P, J. Vis. Exp. 2020, 161, e60947; [DOI] [PubMed] [Google Scholar]; b Legant WR, Miller JS, Blakely BI, Cohen DM, Genin GM, Chen CS, Nature Methods 2010, 7, 969–971; [DOI] [PMC free article] [PubMed] [Google Scholar]; c Vorselen D, Wang Y, de Jesus MM, Shah PK, Footer MJ, Huse M, Cai W, Theriot JA, Nat. Commun. 2020, 11, 20. [DOI] [PMC free article] [PubMed] [Google Scholar]
- [12].Wang J, Lin F, Wan Z, Sun X, Lu Y, Huang J, Wang F, Zeng Y, Chen Y, Shi Y, Zheng W, Li Z, Xiong C, Liu W, Sci. Signal. 2018, 11, eaai9192. [DOI] [PubMed] [Google Scholar]
- [13].Jin W, Tamzalit F, Chaudhuri PK, Black CT, Huse M, Kam LC, Proc. Natl. Acad. Sci. U S A 2019, 116, 19835–19840. [DOI] [PMC free article] [PubMed] [Google Scholar]
- [14].Liu Y, Galior K, Ma VP, Salaita K, Acc. Chem. Res. 2017, 50, 2915–2924. [DOI] [PMC free article] [PubMed] [Google Scholar]
- [15].Stabley DR, Jurchenko C, Marshall SS, Salaita KS, Nat Methods 2011, 9, 64–67. [DOI] [PubMed] [Google Scholar]
- [16].Liu Y, Yehl K, Narui Y, Salaita K, J. Am. Chem. Soc. 2013, 135, 5320–5323. [DOI] [PMC free article] [PubMed] [Google Scholar]
- [17].Morimatsu M, Mekhdjian AH, Adhikari AS, Dunn AR, Nano Lett 2013, 13, 3985–3989. [DOI] [PMC free article] [PubMed] [Google Scholar]
- [18].Galior K, Liu Y, Yehl K, Vivek S, Salaita K, Nano Lett 2016, 16, 341–348. [DOI] [PMC free article] [PubMed] [Google Scholar]
- [19].Chang AC, Mekhdjian AH, Morimatsu M, Denisin AK, Pruitt BL, Dunn AR, ACS Nano 2016, 10, 10745–10752. [DOI] [PMC free article] [PubMed] [Google Scholar]
- [20].Gohring J, Kellner F, Schrangl L, Platzer R, Klotzsch E, Stockinger H, Huppa JB, Schutz GJ, Nat. Commun. 2021, 12, 2502. [DOI] [PMC free article] [PubMed] [Google Scholar]
- [21].Zhang Y, Ge C, Zhu C, Salaita K, Nat. Commun. 2014, 5, 5167. [DOI] [PMC free article] [PubMed] [Google Scholar]
- [22].Ma VP, Hu Y, Kellner AV, Brockman JM, Velusamy A, Blanchard AT, Evavold BD, Alon R, Salaita K, Sci. Adv. 2022, 8, eabg4485. [DOI] [PMC free article] [PubMed] [Google Scholar]
- [23].Ma R, Kellner AV, Ma VP, Su H, Deal BR, Brockman JM, Salaita K, Proc. Natl. Acad. Sci. U S A 2019, 116, 16949–16954. [DOI] [PMC free article] [PubMed] [Google Scholar]
- [24].Nowosad CR, Spillane KM, Tolar P, Nat. Immunol. 2016, 17, 870–877. [DOI] [PMC free article] [PubMed] [Google Scholar]
- [25].Lo WL, Shah NH, Ahsan N, Horkova V, Stepanek O, Salomon AR, Kuriyan J, Weiss A, Nat. Immunol. 2018, 19, 733–741. [DOI] [PMC free article] [PubMed] [Google Scholar]
- [26].Wang X, Ha T, Science 2013, 340, 991–994. [DOI] [PMC free article] [PubMed] [Google Scholar]
- [27].a Bustamante C, Chemla YR, Forde NR, Izhaky D, Annu Rev Biochem 2004, 73, 705–748; [DOI] [PubMed] [Google Scholar]; b Woodside MT, Behnke-Parks WM, Larizadeh K, Travers K, Herschlag D, Block SM, Proc. Natl. Acad. Sci. U S A 2006, 103, 6190–6195. [DOI] [PMC free article] [PubMed] [Google Scholar]
- [28].Bell GI, Science 1978, 200, 618–627. [DOI] [PubMed] [Google Scholar]
- [29].a Ansari A, Kuznestsov S, J. Phys. Chem. B 2005, 109, 12982–12989; [DOI] [PubMed] [Google Scholar]; b Grunwell JR, Glass JL, Lacoste TD, Deniz AA, Chemla DS, Schultz PG, J. Am. Chem. Soc. 2001, 123, 4295–4303. [DOI] [PubMed] [Google Scholar]
- [30].a Greenleaf WJ, Woodside MT, Abbondanzieri EA, Block SM, Phys. Rev. Lett. 2005, 95, 208102; [DOI] [PMC free article] [PubMed] [Google Scholar]; b Bustamante C, Tinoco I, Biophysical Chemistry 2002, 101, 513–533; [DOI] [PubMed] [Google Scholar]; c Bercy M, Bockelmann U, Nucleic Acids Res 2015, 43, 9928–9936. [DOI] [PMC free article] [PubMed] [Google Scholar]
- [31].Albrecht C, Blank K, Lalic-Multhaler M, Hirler S, Mai T, Gilbert I, Schiffmann S, Bayer T, Clausen-Schaumann H, Gaub HE, Science 2003, 310, 367–369. [DOI] [PubMed] [Google Scholar]
- [32].a Mishra RK, Mishra G, Li MS, Kumar S, Phys. Rev. E. 2011, 84, 032903; [DOI] [PubMed] [Google Scholar]; b Cocco S, Monasson R, Marko JF, Proc. Natl. Acad. Sci. U S A 2001, 98, 8608–8613. [DOI] [PMC free article] [PubMed] [Google Scholar]
- [33].a Hatch K, Danilowicz C, Coljee V, Prentiss M, Phys Rev E Stat Nonlin Soft Matter Phys 2008, 78, 011920; [DOI] [PubMed] [Google Scholar]; b Krautbauer R, Rief M, Gaub HE, Nano Lett 2003, 3, 493–496. [Google Scholar]
- [34].Gennes PGD, Acad CR. Sci. Paris 2001, 2, 1505–1508. [Google Scholar]
- [35].Mosayebi M, Louis AA, Doye JPK, Ouldridge TE, ACS Nano 2015, 9, 11993–12003. [DOI] [PubMed] [Google Scholar]
- [36].Courtney AH, Lo WL, Weiss A, Trends. Biochem. Sci. 2018, 43, 108–123. [DOI] [PMC free article] [PubMed] [Google Scholar]
- [37].Hu Y, Ma VP, Ma R, Chen W, Duan Y, Glazier R, Petrich BG, Li R, Salaita K, Angew. Chem. Int. Ed. Engl. 2021, 60, 18044–18050. [DOI] [PMC free article] [PubMed] [Google Scholar]
- [38].Moy VT, Florin EL, Gaub HE, Science 1994, 266, 257–259. [DOI] [PubMed] [Google Scholar]
- [39].a Ma VP, Liu Y, Blanchfield L, Su H, Evavold BD, Salaita K, Nano Lett 2016, 16, 4552–4559; [DOI] [PMC free article] [PubMed] [Google Scholar]; b Kwak K, Quizon N, Sohn H, Saniee A, Manzella-Lapeira J, Holla P, Brzostowski J, Lu J, Xie H, Xu C, Spillane KM, Tolar P, Pierce SK, Sci. Immunol. 2018, 3, eaau6598. [DOI] [PMC free article] [PubMed] [Google Scholar]
- [40].Ritter AT, Asano Y, Stinchcombe JC, Dieckmann NM, Chen BC, Gawden-Bone C, van Engelenburg S, Legant W, Gao L, Davidson MW, Betzig E, Lippincott-Schwartz J, Griffiths GM, Immunity 2015, 42, 864–876. [DOI] [PMC free article] [PubMed] [Google Scholar]
- [41].Wang MS, Hu Y, Sanchez EE, Xie X, Roy NH, de Jesus M, Winer BY, Zale EA, Jin W, Sachar C, Lee JH, Hong Y, Kim M, Kam LC, Salaita K, Huse M, Nat. Commun. 2022, 13, 3222. [DOI] [PMC free article] [PubMed] [Google Scholar]
- [42].a Sykulev Y, Joo M, Vturina I, Tsomides TJ, Eisen HN, Immunity 1996, 4, 565–571; [DOI] [PubMed] [Google Scholar]; b Huang J, Brameshuber M, Zeng X, Xie J, Li QJ, Chien YH, Valitutti S, Davis MM, Immunity 2013, 39, 846–857. [DOI] [PMC free article] [PubMed] [Google Scholar]
- [43].a Tischer DK, Weiner OD, Elife 2019, 8, e42498; [DOI] [PMC free article] [PubMed] [Google Scholar]; b Mckeithan TW, Proc. Natl. Acad. Sci. U S A 1995, 92, 5042–5046. [DOI] [PMC free article] [PubMed] [Google Scholar]
- [44].Lanzavecchia A, Padovan E, Cella M, Muller S, Valitutti S, Nature 1995, 375, 148–151. [DOI] [PubMed] [Google Scholar]
- [45].Davis SJ, van der Merwe PA, Nat. Immunol. 2006, 7, 803–809. [DOI] [PubMed] [Google Scholar]
- [46].Boniface JJ, Rabinowitz JD, Wulfing C, Hampl J, Reich Z, Altman JD, Kantor RM, Beeson C, McConnell HM, Davis MM, Immunity 1998, 9, 459–466. [DOI] [PubMed] [Google Scholar]
- [47].Minguet S, Swamy M, Alarcon B, Luescher IF, Schamel WW, Immunity 2007, 26, 43–54. [DOI] [PubMed] [Google Scholar]
- [48].Sibener LV, Fernandes RA, Kolawole EM, Carbone CB, Liu F, McAffee D, Birnbaum ME, Yang X, Su LF, Yu W, Dong S, Gee MH, Jude KM, Davis MM, Groves JT, Goddard WA 3rd, Heath JR, Evavold BD, Vale RD, Garcia KC, Cell 2018, 174, 672–687 e627. [DOI] [PMC free article] [PubMed] [Google Scholar]
- [49].Pettmann J, Huhn A, Abu Shah E, Kutuzov MA, Wilson DB, Dustin ML, Davis SJ, van der Merwe PA, Dushek O, Elife 2021, 10, e67092. [DOI] [PMC free article] [PubMed] [Google Scholar]
- [50].Wang Y, Shibuya K, Yamashita Y, Shirakawa J, Shibata K, Kai H, Yokosuka T, Saito T, Honda S, Tahara-Hanaoka S, Shibuya A, Int. Immunol. 2008, 20, 1119–1127. [DOI] [PubMed] [Google Scholar]
- [51].Nordenfelt P, Elliott HL, Springer TA, Nat. Commun. 2016, 7, 13119. [DOI] [PMC free article] [PubMed] [Google Scholar]
- [52].Wan Z, Zhang S, Fan Y, Liu K, Du F, Davey AM, Zhang H, Han W, Xiong C, Liu W, J. Immunol. 2013, 190, 4661–4675. [DOI] [PubMed] [Google Scholar]
- [53].Wang JC, Yim YI, Wu X, Jaumouille V, Cameron A, Waterman CM, Kehrl JH, Hammer JA, Elife 2022, 11, e72805. [DOI] [PMC free article] [PubMed] [Google Scholar]
- [54].Wan Z, Chen X, Chen H, Ji Q, Chen Y, Wang J, Cao Y, Wang F, Lou J, Tang Z, Liu W, Elife 2015, 4, e06925. [DOI] [PMC free article] [PubMed] [Google Scholar]
- [55].Li H, Zhang C, Hu Y, Liu P, Sun F, Chen W, Zhang X, Ma J, Wang W, Wang L, Wu P, Liu Z, Nat. Cell Biol. 2021, 23, 642–651. [DOI] [PubMed] [Google Scholar]
- [56].a Brockman JM, Su H, Blanchard AT, Duan Y, Meyer T, Quach ME, Glazier R, Bazrafshan A, Bender RL, Kellner AV, Ogasawara H, Ma R, Schueder F, Petrich BG, Jungmann R, Li R, Mattheyses AL, Ke Y, Salaita K, Nat. Methods 2020, 17, 1018–1024; [DOI] [PMC free article] [PubMed] [Google Scholar]; b Schlichthaerle T, Lindner C, Jungmann R, Nat. Commun. 2021, 12, 2510. [DOI] [PMC free article] [PubMed] [Google Scholar]
- [57].a Brockman JM, Blanchard AT, Pui-Yan VM, Derricotte WD, Zhang Y, Fay ME, Lam WA, Evangelista FA, Mattheyses AL, Salaita K, Nat. Methods 2018, 15, 115–118; [DOI] [PMC free article] [PubMed] [Google Scholar]; b Blanchard A, Combs JD, Brockman JM, Kellner AV, Glazier R, Su H, Bender RL, Bazrafshan AS, Chen W, Quach ME, Li R, Mattheyses AL, Salaita K, Nat. Commun. 2021, 12, 4693; [DOI] [PMC free article] [PubMed] [Google Scholar]; c Blanchard AT, Brockman JM, Salaita K, Mattheyses AL, Opt. Express 2020, 28, 10039–10061. [DOI] [PMC free article] [PubMed] [Google Scholar]
- [58].a Duan Y, Glazier R, Bazrafshan A, Hu Y, Rashid SA, Petrich BG, Ke Y, Salaita K, Angew Chem Int Ed Engl 2021, 60, 19974–19981; [DOI] [PMC free article] [PubMed] [Google Scholar]; b Duan Y, Szlam F, Hu Y, Chen W, Li R, Ke Y, Sniecinski R, Salaita K, bioRxiv 2022.doi: 10.1101/2022.10.26.513907 [DOI] [PMC free article] [PubMed] [Google Scholar]
- [59].Stejskalova A, Oliva N, England FJ, Almquist BD, Adv. Mater. 2019, 31, e1806380. [DOI] [PMC free article] [PubMed] [Google Scholar]
- [60].Lei K, Tang L, Materials Horizons 2020, 7, 3196–3200. [Google Scholar]