

Abstract
Aim:
Indirect treatment comparisons (ITCs) are anchored on a placebo comparator, and the placebo response may vary according to drug administration route. Migraine preventive treatment studies were used to evaluate ITCs and determine whether mode of administration influences placebo response and the overall study findings.
Materials & methods:
Change from baseline in monthly migraine days produced by monoclonal antibody treatments (subcutaneous, intravenous) was compared using fixed-effects Bayesian network meta-analysis (NMA), network meta-regression (NMR), and unanchored simulated treatment comparison (STC).
Results:
NMA and NMR provide mixed, rarely differentiated results between treatments, whereas unanchored STC strongly favors eptinezumab over other preventive treatments.
Conclusion:
Further investigations are needed to determine which ITC best reflects the impact of mode of administration on placebo.
Keywords: indirect treatment comparisons, intravenous, migraine, mode of administration, network meta-analysis, network meta-regression, placebo response, subcutaneous, unanchored simulated treatment comparison
Indirect treatment comparisons (ITCs) are a valuable tool for researchers and can be used to provide regulatory authorities, healthcare providers, and patients with comparative effectiveness evidence. Formal reports, such as health technology assessments (HTAs), systematically evaluate multiple aspects of medical interventions to examine the clinical, economic, ethical, and social dimensions, with the aim of informing decision making [1]; ITCs are commonly used in the context of HTAs where head-to-head studies are impractical or unavailable [2]. ITCs are generally conducted using a Bayesian network meta-analysis (NMA) technique, anchored on common study design elements such as a placebo comparator [3], or the Bucher technique [4].
However, it is well known that patient perceptions can influence the magnitude of the placebo response [5,6], and the route of drug administration is one factor that may affect the perception of treatment efficacy [7–10]. Thus, indirect comparison of different treatment agents is likely to be influenced by different means of administration, such as intravenous (IV), subcutaneous (SC), or intramuscular (IM) injection methods, and how these affected the placebo and active treatment responses. Evidence networks may not be connected (anchored) if the modes of drug administration are not identical, making it unfeasible to conduct anchored ITC. For disconnected networks, unanchored population-adjusted techniques (such as unanchored simulated treatment comparison [STC] or network meta-regression [NMR]) are more suitable for comparative calculations [11] (Supplementary Figure 1).
The mode of drug administration, and its impact on ITC evidence calculations, is particularly relevant when attempting to evaluate the safety and efficacy of newly developed treatments for the prevention of migraine. Following the discovery that calcitonin gene-related peptide (CGRP) plays a key role in migraine, several monoclonal antibodies and small-molecule inhibitors targeting CGRP or its receptor have been specifically developed, producing a major shift in the treatment landscape, including suggestions to use anti-CGRP monoclonal antibodies in critical settings and as preventive treatments [12–15]. Of the four anti-CGRP monoclonal antibodies approved to date, three (erenumab, galcanezumab and fremanezumab) are delivered via SC injection, and one (eptinezumab) is administered via IV infusion.
For clinicians and patients, making a treatment choice to prevent migraines is dependent on weighing the relative efficacies, tolerability profiles, and administration regimen for each potential therapeutic agent [16]. In two phase III studies (PROMISE-1 in patients with episodic migraine [EM] and PROMISE-2 in patients with chronic migraine [CM]), eptinezumab conferred statistically significant reductions in migraine frequency [17,18]. Given that no direct comparison trials have been conducted, the choice between IV eptinezumab or one of the three anti-CGRP monoclonal antibodies administered SC must be based on indirect comparisons. One recent review used data on response rates to inform side-by-side comparison of results from different studies [19]. Several other authors have conducted NMAs anchored on the placebo arms of the various clinical studies to generate ITC data [20–23]. Notably, recent meta-analyses of treatment administration for CM demonstrated that SC and IV administration routes result in different placebo responses [24,25]; thus, we cannot assume these modes of administration are equivalent across studies. However, to date, there have been no explorations of how heterogeneity between modes of drug administration might impact comparative effectiveness calculations.
In this study, we explored the impact of three ITC methods used (NMA, NMR and STC) on overall results (i.e., a specific migraine study outcome such as 12-week change from baseline in monthly migraine days [MMDs]), in the context of heterogeneous mode of administration and corresponding potential for placebo response differences among anti-CGRP monoclonal antibodies. The goal was to evaluate different ITC methodologies and to determine whether the influence of the mode of administration on placebo response can impact the outcome of the analysis with different methodologies.
Materials & methods
Data sources
For this analysis, the comparisons were limited to anti-CGRP monoclonal antibodies, based on their similar mechanisms of action and pharmacological properties, and the data were extracted from published reports of phase III clinical trials in EM [17,26–30] and phase II or III studies in CM [18,31–33]. The studies were identified via a systematic literature review; full details are provided in the Supplemental Methods. In brief, a search was conducted for publications of randomized, controlled trials of migraine-preventive treatments available on electronic databases and searchable collections (i.e., Embase, MEDLINE, and the Cochrane Library). The search encompassed articles from database inception to 22 June 2021. In addition, gray literature (2020/2021 headache/migraine congresses, the ClinicalTrials.gov website, and several HTA websites) was searched. Only those clinical studies conducted in humans and published in English were selected for data extraction [34].
Key details of the included studies are summarized in Table 1. It was not considered reasonable to merge data from disease populations with insufficient overlap, to prevent extrapolating outside of sample data and thus invalidating the regression models, similar to previous work on extrapolations with survival models [35]. Therefore, ITC methodologies were applied to datasets that were organized by migraine frequency (EM or CM).
Table 1. . Summary of key characteristics of the trials included in the analyses.
| Study (NCT no.) | Design | Countries | Active treatment(s) | Dosing schedule | Route of administration | Study visit schedule | Primary end point of change from baseline in MMDs | Ref. | |
|---|---|---|---|---|---|---|---|---|---|
| |
|
|
|
|
|
|
Active |
Placebo |
|
| Episodic migraine | |||||||||
| ARISE (NCT02483585) |
Randomized, double-blind, placebo-controlled, parallel-group |
8† |
Erenumab 70 mg (n = 286) |
Monthly |
Subcutaneous |
In-person |
Months 1–3 (Δ = -2.9) (p < 0.001) |
Months 1–3 (Δ = -1.8) |
[24] |
| EVOLVE-1 (NCT02614183) |
Randomized, double-blind, placebo-controlled, parallel-group |
3‡ |
Galcanezumab 120 mg (n = 213) |
Monthly |
Subcutaneous |
In-person |
Months 1–6 (Δ = -4.7) (p < 0.001) |
Months 1–6 (Δ = -2.8) |
[25] |
| EVOLVE-2 (NCT02614196) |
Randomized, double-blind, placebo-controlled, parallel-group |
12§ |
Galcanezumab 120 mg (n = 231) |
Monthly |
Subcutaneous |
In-person |
Months 1–6 (Δ = -4.3) (p < 0.001) |
Months 1–6 (Δ = -2.3) |
[26] |
| HALO-EM (NCT02629861) |
Randomized, double-blind, placebo-controlled, parallel-group |
9¶ |
Fremanezumab 225 mg (n = 290)# |
Monthly |
Subcutaneous |
In-person |
Weeks 1–12 (Δ = -3.7) (p < 0.001) |
Weeks 1–12 (Δ = -2.2) |
[27] |
| |
|
|
Fremanezumab 675 mg (n = 291)# |
Quarterly |
Subcutaneous |
In-person |
Weeks 1–12 (Δ = -3.4) (p < 0.001) |
Weeks 1–12 (Δ = -2.2) |
|
| PROMISE-1 (NCT02559895) |
Randomized, double-blind, placebo-controlled, parallel-group |
2†† |
Eptinezumab 100 mg (n = 225) |
Quarterly |
Intravenous |
In-person |
Weeks 1–12 (Δ = -3.9) (p = 0.0182) |
Weeks 1–12 (Δ = -3.2) |
[16] |
| |
|
|
Eptinezumab 300 mg (n = 224) |
Quarterly |
Intravenous |
In-person |
Weeks 1–12 (Δ = -4.3) (p = 0.0001) |
Weeks 1–12 (Δ = -3.2) |
|
| STRIVE (NCT02456740) |
Randomized, double-blind, placebo-controlled, parallel-group |
13‡‡ |
Erenumab 70 mg (n = 317) |
Monthly |
Subcutaneous |
In-person |
Months 1 to 4–6 (Δ = -3.2) (p < 0.001) |
Months 1 to 4–6 (Δ = -1.8) |
[28] |
| Erenumab 140 mg (n = 319) | Monthly | Subcutaneous | In-person | Months 1 to 4–6 (Δ = -3.7) (p < 0.001) |
Months 1 to 4–6 (Δ = -1.8) |
||||
| Chronic migraine | |||||||||
|---|---|---|---|---|---|---|---|---|---|
| HALO-CM (NCT02621931) |
Randomized, double-blind, placebo-controlled, parallel-group |
9§§ |
Fremanezumab 675/225/225 mg (n = 379)¶¶ |
Monthly |
Subcutaneous |
In-person |
Weeks 1–12 (Δ = -4.6) (p < 0.001) |
Weeks 1–12 (Δ = -2.5) |
[29] |
| |
|
|
Fremanezumab 675 mg (n = 376)¶¶ |
Quarterly |
Subcutaneous |
In-person |
Weeks 1–12 (Δ = -4.3) (p < 0.001) |
Weeks 1–12 (Δ = -2.5) |
|
| REGAIN (NCT02614261) |
Randomized, double-blind, placebo-controlled, parallel-group |
13## |
Galcanezumab 120 mg (n = 278)††† |
Monthly |
Subcutaneous |
In-person |
Months 1–3 (Δ = -4.8) (p < 0.001) |
Months 1–3 (Δ = -2.7) |
[30] |
| PROMISE-2 (NCT02974153) |
Randomized, double-blind, placebo-controlled, parallel-group |
13‡‡‡ |
Eptinezumab 100 mg (n = 356) |
Quarterly |
Intravenous |
In-person |
Weeks 1–12 (Δ = -7.7) (p < 0.0001) |
Weeks 1–12 (Δ = -5.6) |
[15] |
| |
|
|
Eptinezumab 300 mg (n = 350) |
Quarterly |
Intravenous |
In-person |
Weeks 1–12 (Δ = -8.2) (p < 0.0001) |
Weeks 1–12 (Δ = -5.6) |
|
|
NCT02066415 |
Randomized, double-blind, placebo-controlled, parallel-group |
10§§§ |
Erenumab 70 mg (n = 191) |
Monthly |
Subcutaneous |
In-person |
Weeks 1 to 9–12 (Δ = -6.6) (p < 0.0001) |
Weeks 1 to 9–12 (Δ = -4.2) |
[31] |
| Erenumab 140 mg (n = 190) | Monthly | Subcutaneous | In-person | Weeks 1 to 9–12 (Δ = -6.6) (p < 0.0001) |
Weeks 1 to 9–12 (Δ = -4.2) |
||||
USA, Denmark, France, Greece, Portugal, Russia, Spain, Switzerland.
USA, Canada, Puerto Rico.
USA, Argentina, Czechia, Germany, Israel, Republic of Korea, Mexico, The Netherlands, Puerto Rico, Spain, Taiwan, UK.
USA, Canada, Czechia, Finland, Israel, Japan, Poland, Russia, Spain.
Patients received either 225 mg in months 1, 2 and 3 or 675 mg in month 1, followed by placebo in months 2 and 3.
USA, Georgia.
USA, Austria, Belgium, Canada, Czechia, Finland, Germany, The Netherlands, Poland, Slovakia, Sweden, Turkey, UK.
USA, Canada, Czechia, Finland, Israel, Japan, Poland, Russia, Spain.
Patients received either 675 mg in month 1, followed by 225 mg in months 2 and 3 or 675 mg in month 1, followed by placebo in months 2 and 3.
USA, Argentina, Canada, Czechia, Germany, Israel, Italy, Mexico, The Netherlands, Puerto Rico, Spain, Taiwan, UK.
Patients received 2 injections per monthly dosing visit, with the number of galcanezumab 120-mg injections received depending on treatment group assignment.
USA, Belgium, Czechia, Denmark, Georgia, Germany, Hungary, Italy, Russia, Slovakia, Spain, Ukraine, UK.
USA, Canada, Czechia, Denmark, Finland, Germany, Norway, Poland, Sweden, UK.
MMD: Monthly migraine day; N/A: Not applicable.
ITC methodologies
The objective of the study was to explore the impact of the mode of administration on 12-week change from baseline in MMDs for ITCs of the available anti-CGRP monoclonal antibodies. Three methodologies were used to compare the 12-week change from baseline in MMDs across treatments: standard Bayesian NMA, assuming placebos were identical across administrations (SC and IV); NMR, regressing treatment effect on placebo response; and unanchored STC using only active arm data, assuming IV and SC placebo responses are not comparable (i.e., networks are disconnected). The assumptions for each type of analysis are reported in Table 2. The key difference between treatments in PROMISE-1 and PROMISE-2 versus comparator trials was the mode of treatment administration. However, while the authors hypothesized that placebo responses driven by different administration methods were the underlying cause of differences in MMDs between treatments, the analysis was not predicated on this assumption. Both unanchored STC and NMR can be used if other factors are involved; for example, differences in the quality and intensity of interactions between healthcare professionals and patients may also have an impact on the placebo response [36–38].
Table 2. . Assumptions made for each type of analysis methodology.
| NMA | NMR | STC |
|---|---|---|
| • Treatment effects are assumed to be additive and consistent, so that an indirect comparison gives the same effect as a direct comparison • The reference treatment (placebo) is assumed to be the same across administration routes (SC, IV, and IM) • In random effects models on trials with more than 2 arms, between-arm variance is assumed to be half the heterogeneity variance, and the relative effects are jointly normal • Baseline effects are considered nuisance parameters and are canceled out • Vague priors are assumed for treatment effects and heterogeneity variances in random effects models |
• Treatment effects are assumed to be additive and consistent, so that an indirect comparison gives the same effect as a direct comparison • The reference treatment (placebo) is assumed to be the same across administration routes (SC, IV, and IM) • All anti-CGRP treatments have a similar drug effect, which can be modeled with a class effect • The linear regression is modified to include an effect of baseline response (i.e., placebo response); relative treatment effect vs placebo is assumed to vary based on the placebo response • The coefficient in linear regression is assumed to be the same for all anti-CGRP treatments • Vague priors are assumed for the treatment effects, regression coefficients and class effects |
• Assumes that IV, SC, and IM placebos are not the same and that the evidence networks are disconnected • Assumes all possible prognostic variables and treatment effect modifiers are captured in the baseline characteristics data collected from the trial populations • Adjusts for differences in trial population baseline characteristics but assumes that extrapolations to comparator populations are valid • Uses evidence of a treatment arm to estimate absolute response in a population of any other single arm • 95% confidence intervals and one-sided p-values can be generated assuming normality |
CGRP: Calcitonin gene-related peptide; IM: Intramuscular; IV: Intravenous; NMA: Network meta-analysis; NMR: Network meta-regression; SC: Subcutaneous; STC: Simulated treatment comparison.
Standard Bayesian NMA
For the standard Bayesian NMA, a base case of fixed effects was prioritized over random effects due to the limited number of studies in the placebo response models for identifying regression coefficients, class effects, and heterogeneity variance. Full details of the equations of the three methodologies are provided in the Supplementary Methods.
As change from baseline in MMDs was a continuous outcome, a linear regression model with identity link and normal likelihood was used for the NMA. The measure of treatment effect was expressed as the mean difference in change from baseline. Results were summarized as means with Bayesian 95% credible intervals (CrI) and Bayesian one-sided probabilities of eptinezumab having greatest reduction in MMDs (Bayesian p-values).
NMR analysis
For the NMR, the identity link function was used as in the NMA, but the linear regression was modified to include an effect βk of baseline response (i.e., placebo response) μi. This allowed for the modeling of the impact of placebo response on total treatment effect (effect of drug and effect of administration route). A common fixed-effect β was used for the effects of baseline response for all active treatments as data were limited. A further assumption was made that all anti-CGRP monoclonal antibodies had a similar pharmacologic effect, which was modeled as a class effect. Results were again summarized with means, Bayesian 95% CrI, and Bayesian p-values.
STC analysis
For the STC, only the non-placebo arms from each included trial were used, resulting in an analysis with no common comparator. Based on the assumption that the placebo responses were not the same, only evidence from the treatment arms was used to generate an estimate of absolute response in the population of any other single arm.
To conduct the unanchored STC analysis, prognostic variables and treatment effect modifiers (i.e., baseline characteristics) were considered in patients with EM and CM, and data were adjusted for imbalance in these factors. To identify the variables used in the analysis, a survey of 10 clinicians was conducted, with a total of three clinicians completing the survey (Supplemental Methods). Prognostic variables were defined as variables that affect absolute outcomes regardless of treatment; effect modifiers were defined as variables impacting response to treatment. A total of nine variables were included in the regression models based on the expert survey results and likelihood of data availability in published reports of randomized controlled trials: age (prognostic and effect), female sex (prognostic and effect), race or ethnicity (prognostic and effect), disease duration (prognostic and effect), number of headache days in previous month (prognostic only), number of migraine days in previous month (prognostic only), frequency of migraines in previous month (prognostic and effect), days taking acute medication in previous month (prognostic and effect), and number of previously failed preventive treatments (prognostic and effect). The STC models prognostic factors and effect modifiers in an identical manner; thus, it was not necessary to identify which are effect modifying and which are only prognostic.
Baseline characteristics in the selected studies were found to have sufficient overlap for STC comparisons to be valid. Washout periods were generally comparable across the studies and included a period ranging from 1 to 2 months for acute medication or devices (EM studies) and a period ranging from 1 to 2 months for preventive medication or devices (CM studies). The minimal differences in pre-trial washout durations were not considered to have a meaningful impact on medication usage during the treatment period of each study. Notable between-study differences were that patients in PROMISE-1 (eptinezumab) had fewer days of acute medication use for EM, particularly compared with EVOLVE-1/2 (galcanezumab). Aligned with this finding was that patients in EVOLVE-1/2 also had much greater use of preventive medication at baseline. Variations in the definitions of medication days and purposed usage (for headache, migraine, or both) between studies was partially responsible for these differences. However, in all cases, uncertainty was large and overlap in the standard deviations was indicated, suggesting that the effects of this treatment divergence were limited.
The target population of the STC is implicitly that of the trials for which predictions of eptinezumab outcomes were made. These comparisons are not generalizable to other populations unless the shared effect modifier assumption is made [39].
The STC was a frequentist analysis and results were summarized as 95% confidence intervals (CIs) and one-sided p-values assuming normality on the treatment effects.
Statistical methods
All methods (traditional NMA, NMR and STC) were conducted following approved/published standards [4, 40–42].
For the standard Bayesian NMA and NMR, calculations used the OpenBUGS Bayesian software with modified code [4,43]. This uses Markov Chain Monte Carlo simulation to sample from the posterior distribution of NMA models. A total of 30,000 burn-in simulations and 30,000 sampling simulations, with 3 chains, was used. Convergence was assessed by visual inspection and the Brooks–Gelman–Rubin Rhat statistic [43]. Following the American Statistical Association's guidance, we avoided the use of strict ‘significance’ threshold when interpreting p-values [44]. Instead, the evidence of a difference in the change from baseline in MMDs was quantified as being strong (p < 0.001), moderate (0.001 ≤ p < 0.05), and weak (0.05 ≤ p < 0.10), with the former two aligned with classical ‘significance’ and published recommendations [45].
The STC was conducted using the R statistical programming language, as was data management for NMA and NMR [46]. The R2OpenBUGS package was used to conduct frequentist fixed effects meta-analysis on comparator trials [47].
Results
ITC using NMA methodology
In the standard Bayesian NMA, the most conservative analysis method that assumes that placebos are identical, eptinezumab performed better than placebo in reducing MMDs at 12 weeks in both EM (Table 3) and CM (Table 4) for only a few comparisons. The estimated differences in change from baseline in MMDs were -0.70 (eptinezumab 100 mg, EM), -1.10 (eptinezumab 300 mg, EM), -2.10 (eptinezumab 100 mg, CM), and -2.60 (eptinezumab 300 mg, CM), with values less than 0 showing preference for eptinezumab over placebo.
Table 3. . Estimated differences in change from baseline in MMDs at 12 weeks in episodic migraine.
| Intervention | Comparator | NMA | NMR | STC | |||
|---|---|---|---|---|---|---|---|
| Mean (95% credible interval) | Bayesian probability eptinezumab superior | Mean (95% credible interval) | Bayesian probability eptinezumab superior | Mean (95% confidence interval) | One-sided p-value | ||
| Eptinezumab 100 mg | Eptinezumab 300 mg | 0.40 (-0.17, 0.97) | 0.08 | 0.22 (-0.18, 0.76) | 0.16 | N/A | – |
| Erenumab 140 mg | 1.04 (0.25, 1.83)† | <0.000 | 0.28 (-0.27, 1.21) | 0.16 | -0.17 (-0.65, 0.31) | 0.48 | |
| Fremanezumab 675 mg/q | 0.50 (-0.39, 1.40) | 0.14 | 0.07 (-0.50, 0.80) | 0.38 | -0.51 (-1.12, 0.11) | 0.11 | |
| Fremanezumab 225 mg/m | 0.80 (-0.089, 1.70) | 0.04 | 0.21 (-0.30, 1.03) | 0.21 | -0.73 (-1.38, -0.074)† | 0.029 | |
| Galcanezumab 120 mg | 0.94 (0.13, 1.75)† | 0.01 | 0.34 (-0.14, 1.13) | 0.11 | -0.12 (-0.79, 0.54) | 0.72 | |
| Erenumab 70 mg | 0.47 (-0.23, 1.17) | 0.10 | -0.03 (-0.72, 0.70) | 0.56 | -1.20 (-1.69, -0.70)† | <0.0001 | |
| Placebo | -0.70 (-1.27, -0.13)† | 0.992 | -1.15 (-1.57, -0.55)† | >0.999 | N/A | – | |
| Eptinezumab 300 mg | Eptinezumab 100 mg | -0.40 (-0.97, 0.17) | 0.916 | -0.22 (-0.76, 0.18) | 0.84 | N/A | – |
| Erenumab 140 mg | 0.64 (-0.15, 1.42) | 0.06 | 0.065 (-0.57, 0.87) | 0.39 | -0.39 (-0.86, 0.081) | 0.10 | |
| Fremanezumab 675 mg/q | 0.098 (-0.80, 0.99) | 0.41 | -0.11 (-0.81, 0.49) | 0.68 | -0.77 (-1.40, -0.14)† | 0.017 | |
| Fremanezumab 225 mg/m | 0.40 (-0.49, 1.29) | 0.19 | 0.006 (-0.59, 0.71) | 0.49 | -1.24 (-1.89, -0.58)† | 0.00022 | |
| Galcanezumab 120 mg | 0.54 (-0.27, 1.36) | 0.10 | 0.10 (-0.38, 0.79) | 0.32 | -0.74 (-1.40, -0.08)† | 0.028 | |
| Erenumab 70 mg | 0.068 (-0.63, 0.77) | 0.43 | -0.24 (-1.04, 0.38) | 0.81 | -1.24 (-1.75, -0.74)† | <0.0001 | |
| Placebo | -1.10 (-1.66, -0.53)† | >0.999 | -1.36 (-1.85, -0.87)† | >0.999 | N/A | – | |
‘Significance’ at 0.05 threshold should be judged by 95% intervals not crossing 0.
Values <0 favor eptinezumab. Base case regression model included the following covariates, or those reported by comparator trials, identified by expert opinion: age, proportion female, proportion White, duration of disease at baseline, average prior headache days based on 1 month, average number of prior migraine days based on 1 month, average prior migraine attack days based on 1 month.
mg/m: Mg dose per month; mg/q: Mg dose per quarter (every 3 months); MMD: Monthly migraine day; N/A: Not applicable; NMA: Network meta-analysis; NMR: Network meta-regression; STC: Simulated treatment comparison.
Table 4. . Estimated differences in change from baseline in monthly migraine days at 12 weeks in chronic migraine.
| Intervention | Comparator | NMA | NMR | STC | |||
|---|---|---|---|---|---|---|---|
| Mean (95% credible interval) | Bayesian probability eptinezumab superior | Mean (95% credible interval) | Bayesian probability eptinezumab superior | Mean (95% confidence interval) | One-sided p-value | ||
| Eptinezumab 100 mg | Eptinezumab 300 mg | 0.50 (-0.38, 1.40) | 0.13 | 0.12 (-0.32, 0.98) | 0.28 | N/A | – |
| Erenumab 140 mg | 0.29 (-1.14, 1.73) | 0.34 | 0.06 (-0.61, 1.22) | 0.37 | -2.01 (-3.04, -0.98)† | 0.00013 | |
| Fremanezumab 675 mg/q | -1.00 (-2.36, 0.36) | 0.927 | -0.008 (-1.23, 0.83) | 0.53 | -2.56 (-3.54, -1.58)† | <0.0001 | |
| Fremanezumab 225 mg/m | -0.90 (-2.26, 0.45) | 0.903 | 0.001 (-1.16, 0.90) | 0.50 | -2.35 (-3.33, -1.37)† | <0.0001 | |
| Galcanezumab 120 mg | 0.031 (-1.44, 1.51) | 0.48 | 0.072 (-0.74, 1.59) | 0.36 | -4.14 (-5.27, -3.01)† | <0.0001 | |
| Erenumab 70 mg | 0.29 (-1.14, 1.72) | 0.34 | 0.061 (-0.60, 1.23) | 0.37 | -2.08 (-3.10, -1.06)† | <0.0001 | |
| Placebo | -2.10 (-3.01, -1.18)† | >0.999 | -1.98 (-2.70, -1.12)† | >0.999 | N/A | – | |
| Eptinezumab 300 mg | Eptinezumab 100 mg | -0.50 (-1.40, 0.38) | 0.87 | -0.12 (-0.98, 0.32) | 0.78 | N/A | – |
| Erenumab 140 mg | -0.21 (-1.64, 1.23) | 0.61 | -0.02 (-0.96, 0.84) | 0.56 | -2.42 (-3.46, -1.37)† | <0.0001 | |
| Fremanezumab 675 mg/q | -1.50 (-2.86, -0.14)† | 0.985 | -0.11 (-1.64, 0.50) | 0.70 | -3.34 (-4.31, -2.37)† | <0.0001 | |
| Fremanezumab 225 mg/m | -1.40 (-2.76, -0.041) | 0.978 | -0.09 (-1.57, 0.57) | 0.67 | -3.08 (-4.06, -2.11)† | <0.0001 | |
| Galcanezumab 120 mg | -0.47 (-1.95, 1.01) | 0.73 | -0.007 (-1.12, 1.17) | 0.53 | -4.47 (-5.59, -3.35)† | <0.0001 | |
| Erenumab 70 mg | -0.21 (-1.64, 1.21) | 0.61 | -0.02 (-0.97, 0.84) | 0.56 | -2.41 (-3.45, -1.38)† | <0.0001 | |
| Placebo | -2.60 (-3.51, -1.70)† | >0.999 | -2.15 (-3.02, -1.38)† | >0.999 | N/A | – | |
‘Significance’ at 0.05 threshold should be judged by 95% intervals not crossing 0.
Values <0 favor eptinezumab. Base case regression model included the following covariates, or those reported by comparator trials, identified by expert opinion: age, proportion female, proportion White, duration of disease at baseline, average prior headache days based on 1 month, average number of prior migraine days based on 1 month, average prior migraine attack days based on 1 month.
mg/m: Mg dose per month; mg/q: Mg dose per quarter (every 3 month); N/A: Not applicable; NMA: Network meta-analysis; NMR: Network meta-regression; STC: Simulated treatment comparison.
This analysis favored erenumab 140 mg and galcanezumab 120 mg over eptinezumab 100 mg in EM. However, NMA results favored eptinezumab 300 mg over fremanezumab (monthly or quarterly) in CM. In most other cases, no major differences were observed between eptinezumab and comparators (Figure 1).
Figure 1. . Forest plots of mean difference in change from baseline in monthly migraine days at 12 weeks for all treatments against eptinezumab, calculated using fixed effects network meta-analysis.

(A) difference versus eptinezumab 100 mg in episodic migraine (EM), (B) difference versus eptinezumab 300 mg in EM, (C) difference versus eptinezumab 100 mg in chronic migraine (CM), (D) difference versus eptinezumab 300 mg in CM.
Data are shown as mean difference (95% Bayesian credible interval; one-sided Bayesian p-value). Values <0 favor eptinezumab 100 mg (panels A and C) or eptinezumab 300 mg (panels B and D).
There was insufficient evidence to reliably estimate the heterogeneity variance in random effects models for either standard NMA or placebo response regression models. However, as there was no evidence of a difference in comparisons of eptinezumab with treatments other than placebo using either fixed or random effects analyses (Supplemental Results), the conclusions are the same.
ITC using NMR methodology
The NMR regressing treatment effect assumes no difference in placebos but does assume that the amplitude of the placebo response has an impact on incremental treatment effect. Using this technique, there was some evidence that eptinezumab performs better than other comparator treatments but no notable differences (Tables 3 & 4). The estimated differences in change from baseline (versus placebo) in MMDs were -1.15 (eptinezumab 100 mg, EM; 95% CrI [-1.57, -0.55], p < 0.05), -1.36 (eptinezumab 300 mg, EM; 95% CrI [-1.85, -0.87], p < 0.05), -1.98 (eptinezumab 100 mg, CM; 95% CrI [-2.70, -1.12], p < 0.05), and -2.15 (eptinezumab 300 mg, CM; 95% CrI [-3.02, -1.38], p < 0.05).
In EM, eptinezumab 300 mg was favorable compared with all treatments except erenumab 140 mg, fremanezumab 225 mg, and galcanezumab 120 mg. Eptinezumab 100 mg was only slightly favorable compared with erenumab 70 mg. In CM, eptinezumab 300 mg was more favorable than all comparator treatments, while eptinezumab 100 mg was only slightly favorable compared with fremanezumab (quarterly). Overall, results were comparable to those from the standard NMA, in which many values were close to zero, suggesting no clear preference for one treatment versus another (Figure 2). Notably, there was no evidence of a non-zero regression coefficient (eptinezumab, EM: -0.16, 95% CrI [-0.72, 0.55]; eptinezumab, CM: 0.23, 95% CrI [-0.30, 0.94]). The direction of effect was also inconsistent, with greater placebo response reducing treatment effects in EM and increasing treatment effects in CM.
Figure 2. . Forest plots of mean difference in change from baseline in monthly migraine days at 12 weeks for all treatments against eptinezumab, calculated using fixed effects network meta-regression.
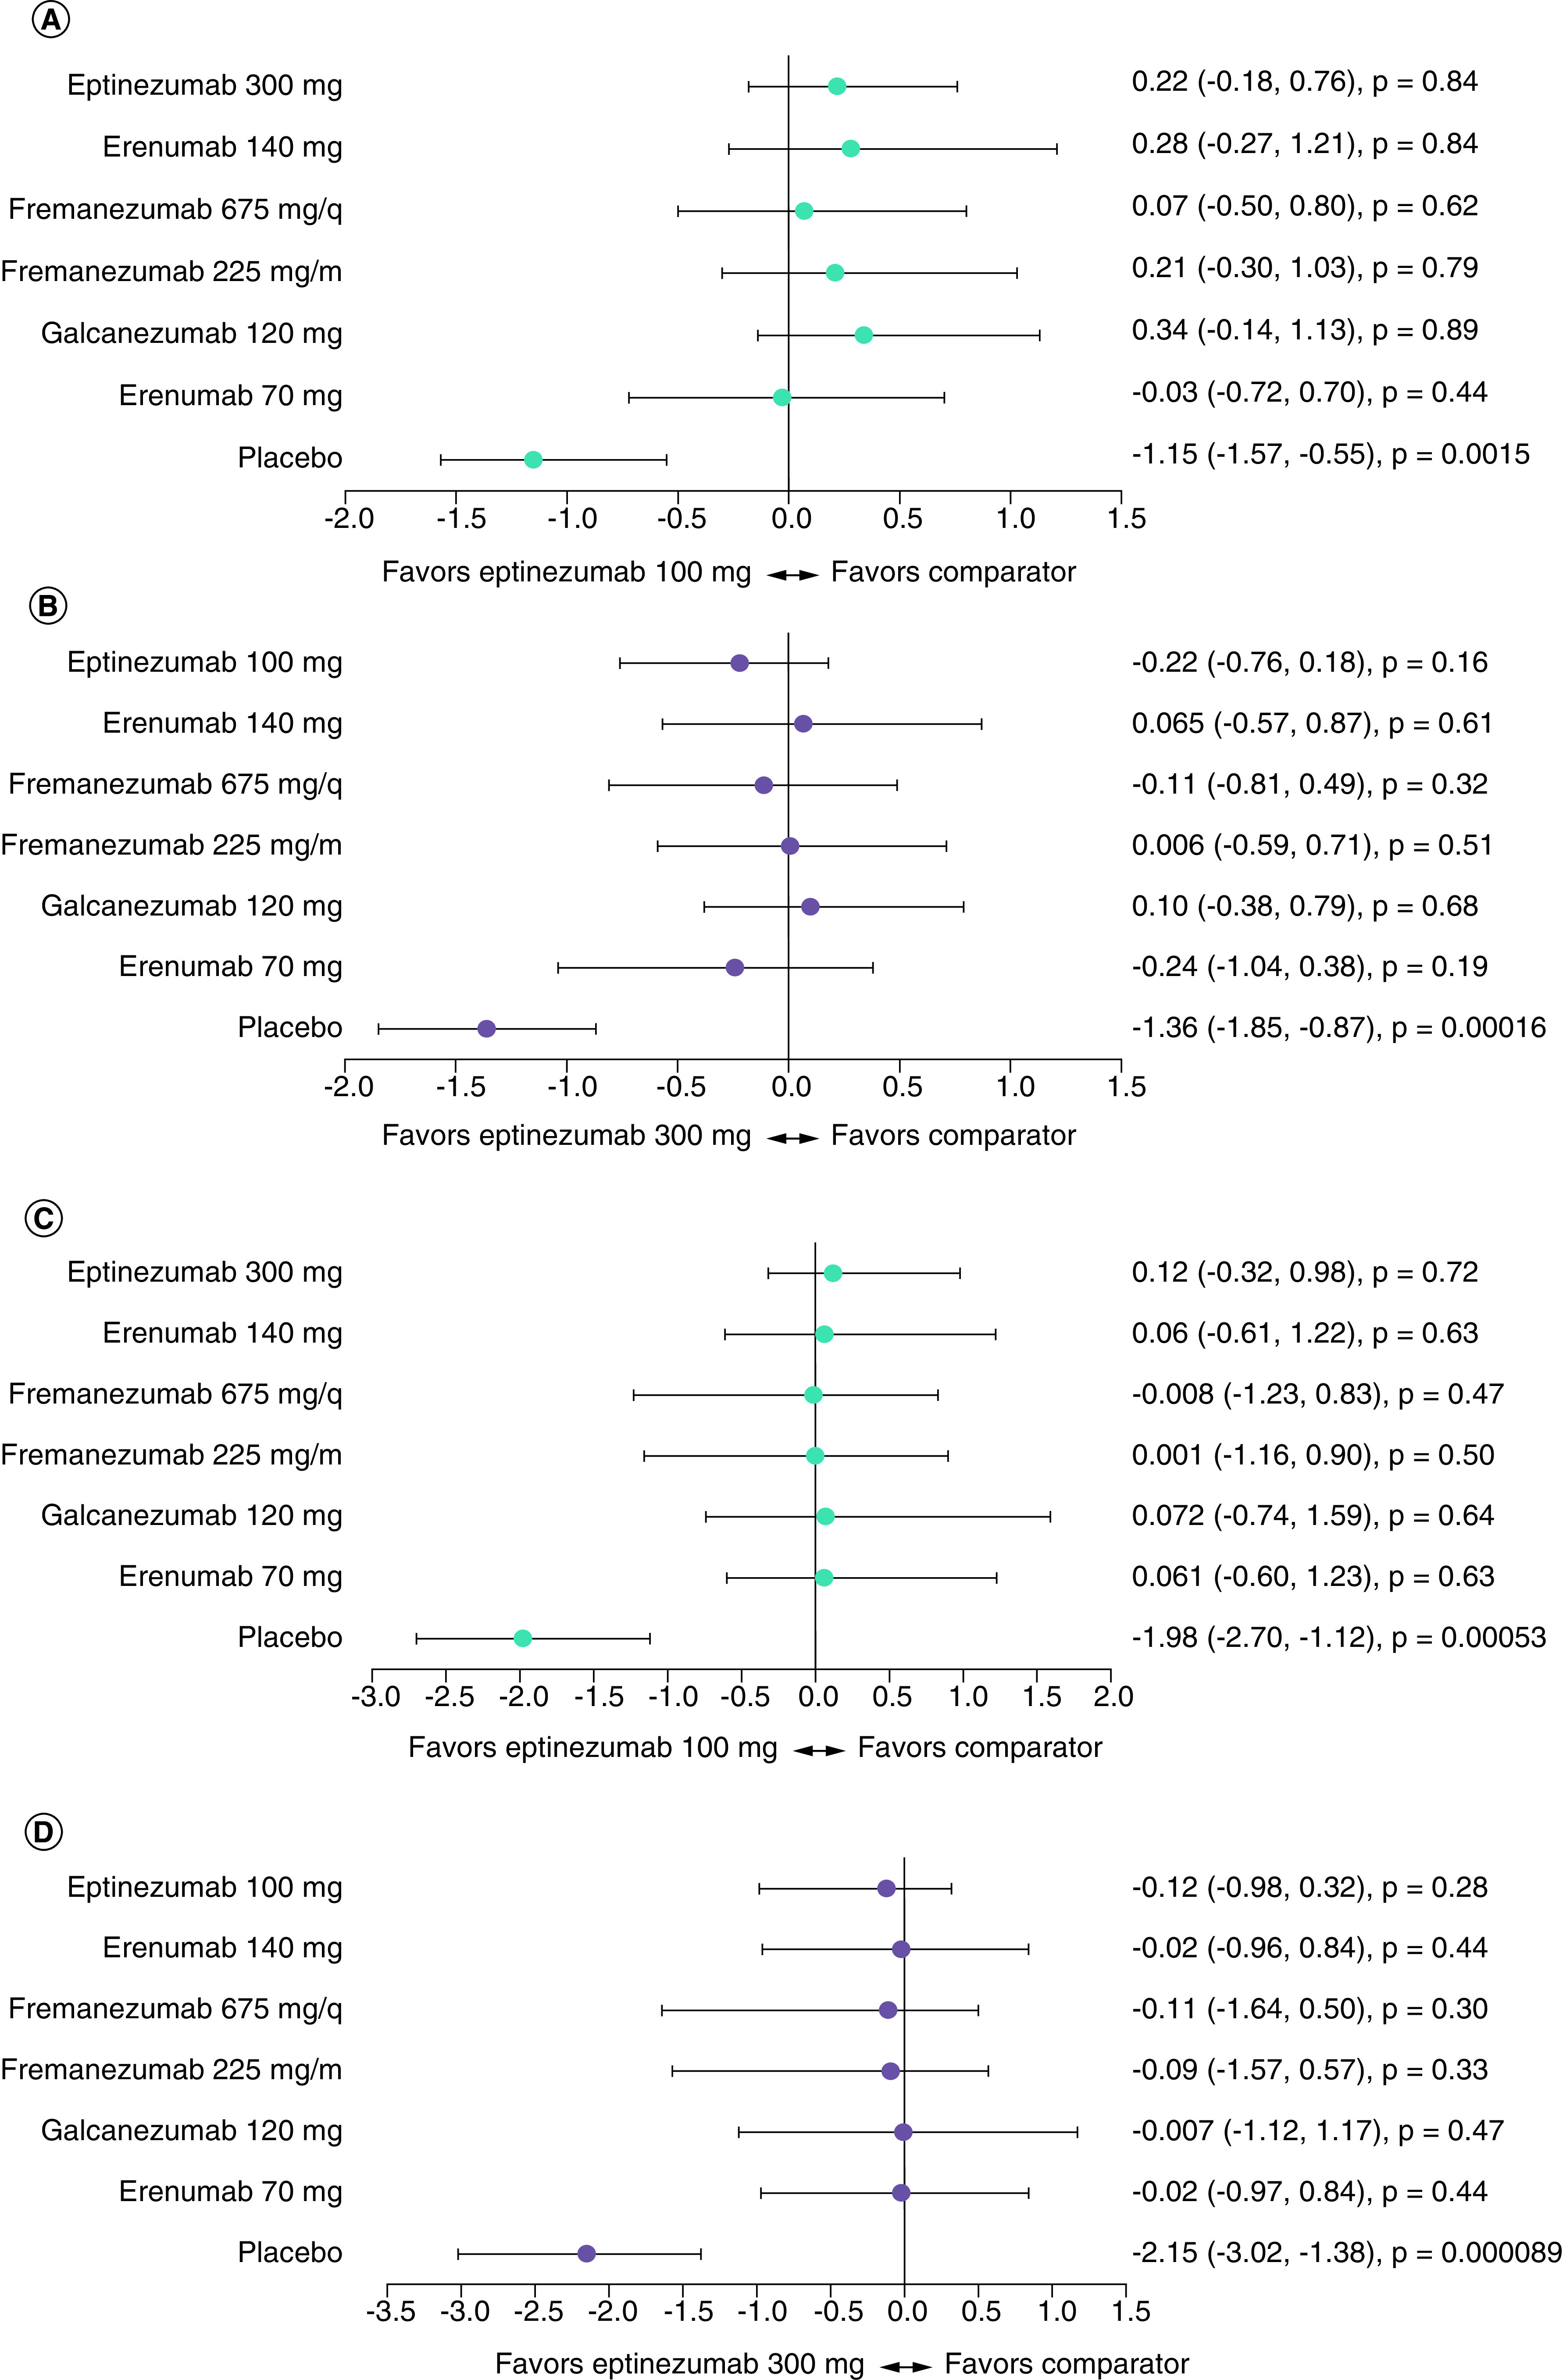
(A) Difference versus eptinezumab 100 mg in episodic migraine (EM), (B) difference versus eptinezumab 300 mg in EM, (C) difference versus eptinezumab 100 mg in chronic migraine (CM), (D) difference versus eptinezumab 300 mg in CM.
Data are shown as mean difference (95% Bayesian credible interval; one-sided Bayesian p-value). Values <0 favor eptinezumab 100 mg (panels A and C) or eptinezumab 300 mg (panels B and D).
ITC using STC methodology
Unanchored STC using only non-placebo arms is the least conservative methodology used; this assumes placebo is completely different between treatments requiring different modes of administration and assumes that the evidence networks are disconnected.
In EM, STC analysis favored eptinezumab (100 mg or 300 mg) for all comparisons (Table 3 & Figure 3), with the range across the treatments varying from -0.12 MMDs (eptinezumab 100 mg, 95% CI [-0.79, 0.54], p = 0.72) to -1.24 MMDs (eptinezumab 300 mg, 95% CI [-1.75, -0.74], p < 0.0001). All STC comparisons in CM (Table 4 & Figure 3) favored eptinezumab (100 or 300 mg), with the range across treatments varying from -2.01 MMDs (eptinezumab 100 mg, 95% CI [-3.04, -0.98], p = 0.00013) to -4.47 MMDs (eptinezumab 300 mg, 95% CI [-5.59, -3.35], p < 0.0001).
Figure 3. . Forest plots of mean difference in change from baseline in monthly migraine days at 12 weeks for all treatments against eptinezumab, calculated using fixed effects simulated treatment comparison.
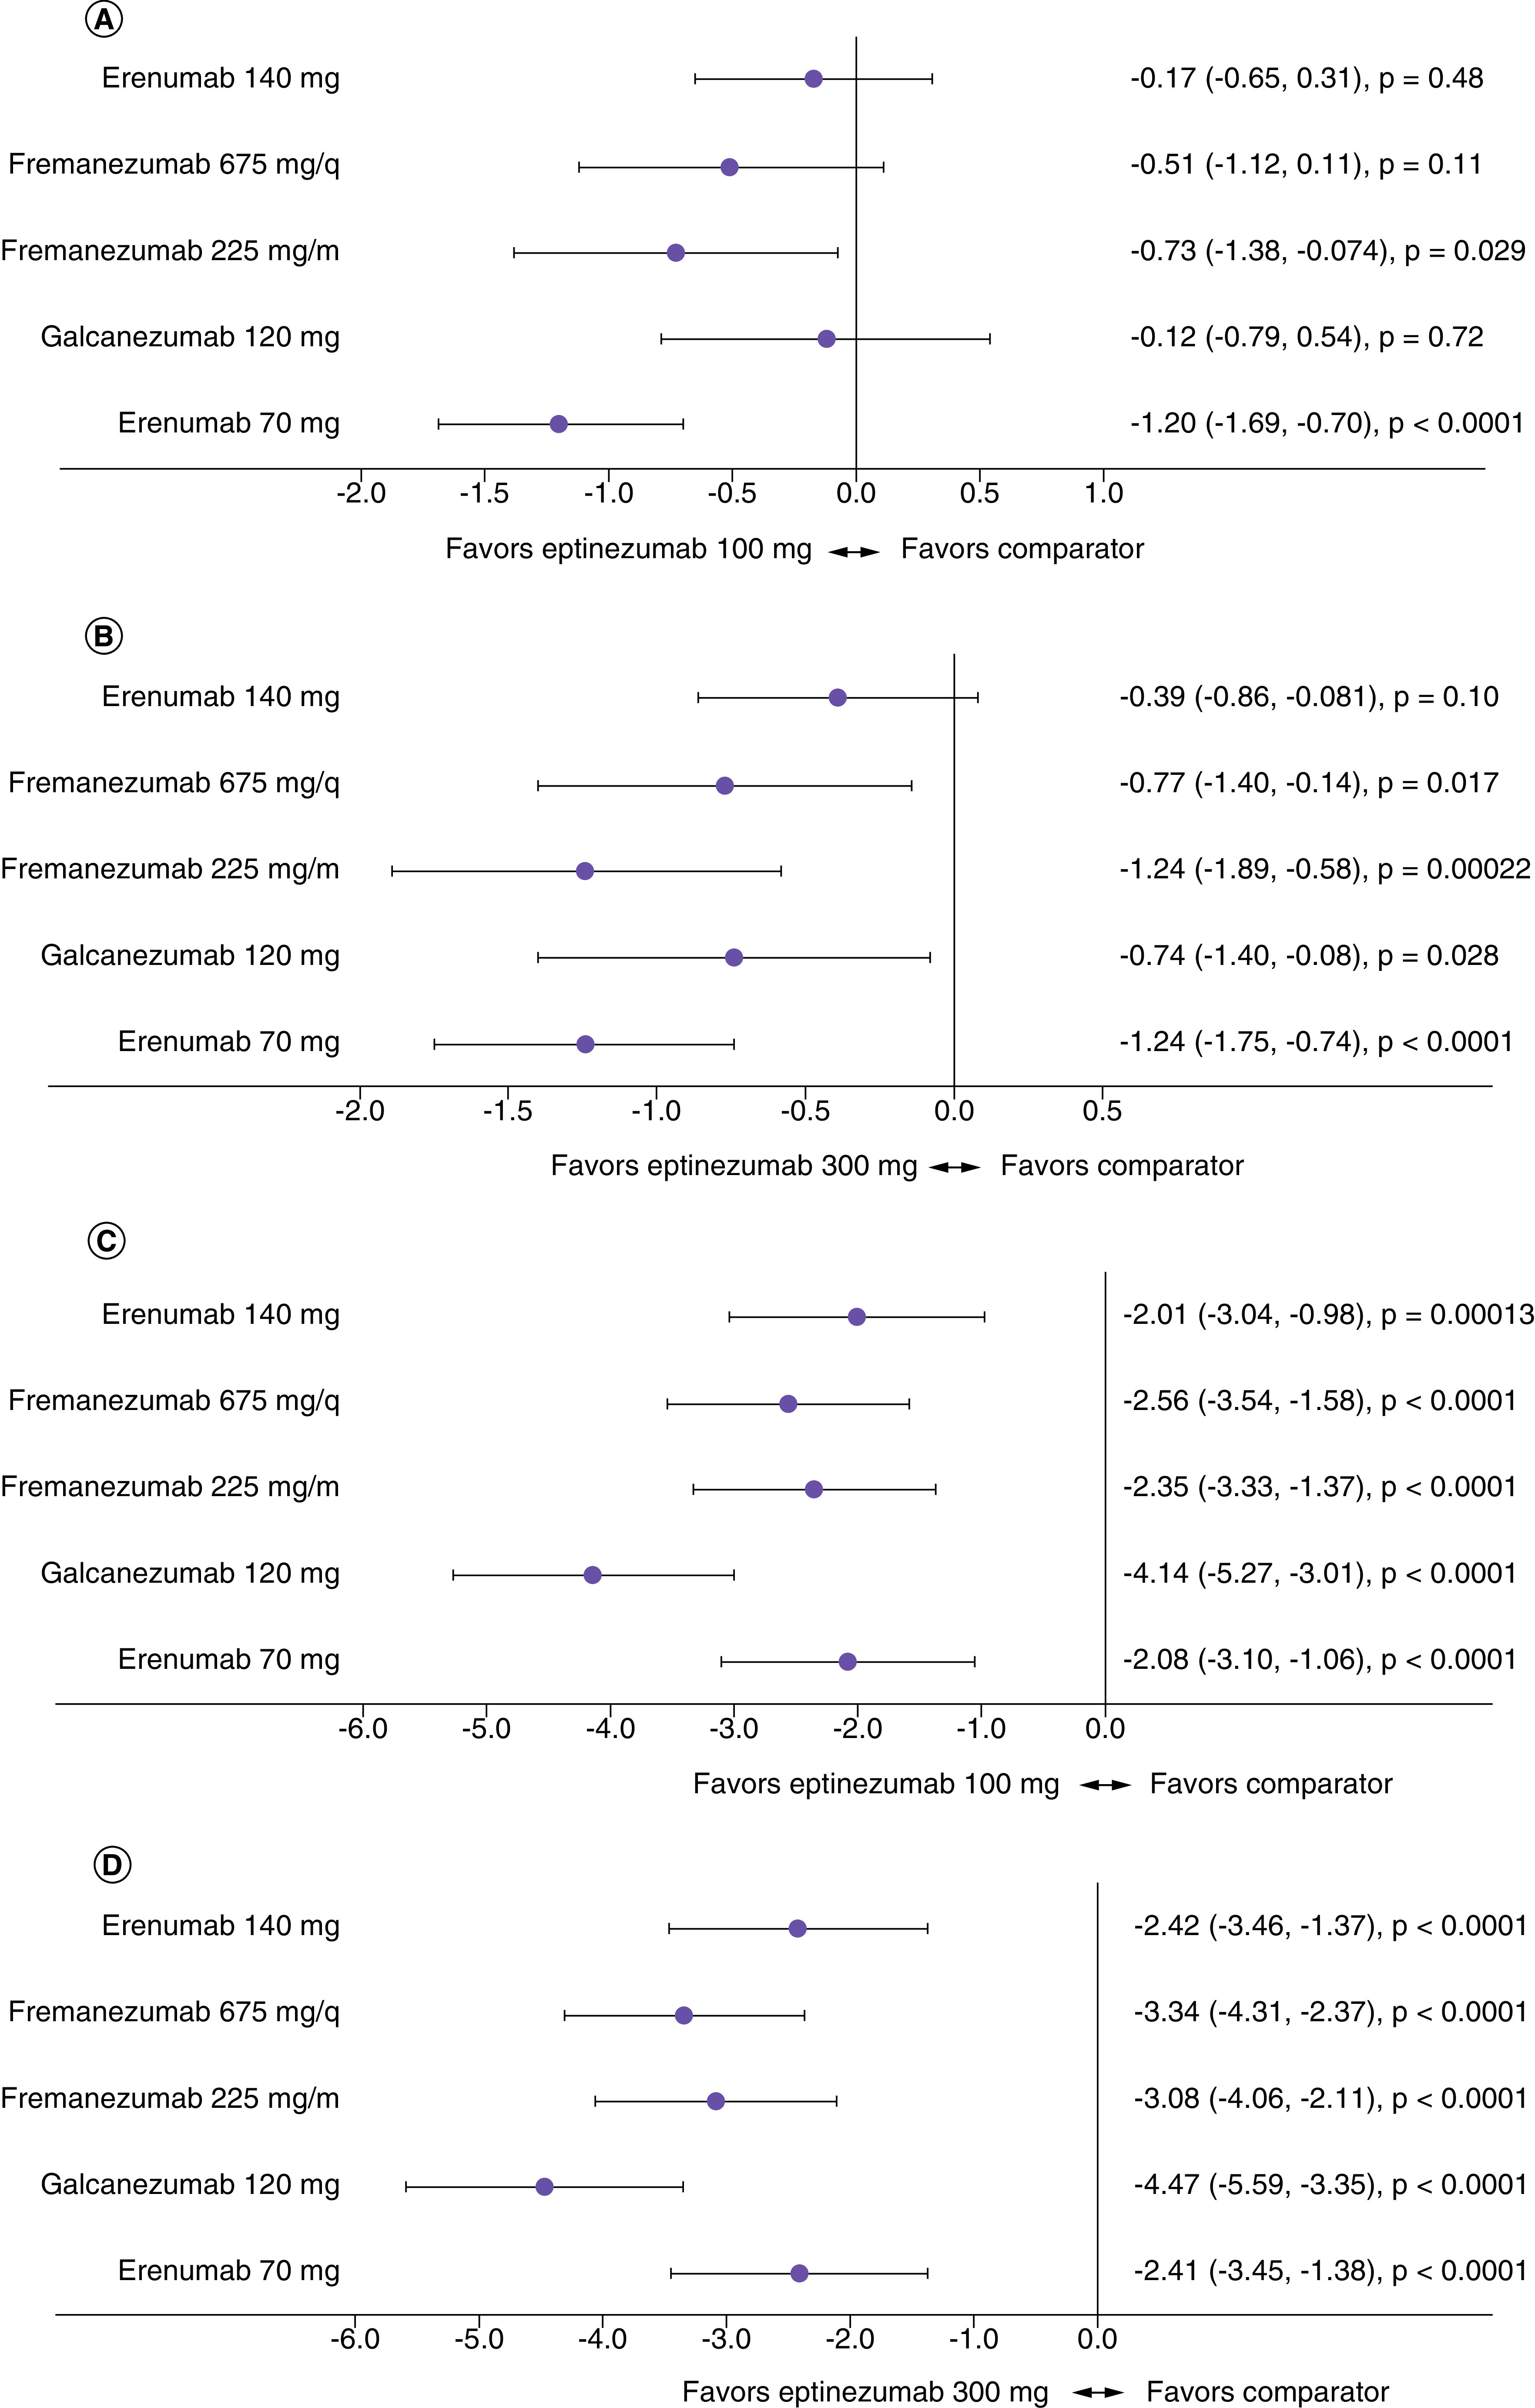
(A) Difference versus eptinezumab 100 mg in episodic migraine (EM), (B) difference versus eptinezumab 30 mg in EM, (C) difference versus eptinezumab 100 mg in chronic migraine (CM), (D) difference versus eptinezumab 300 mg in CM.
Discussion
Indirect comparisons of individual drugs and drug classes are commonly used and can provide important data to enable patients, clinicians, and payors to optimize the choice of treatment [48]. However, assumptions about modes of treatment administration and the equivalence of placebo arms in different studies can have a large impact on ITCs. Specifically, it is a central assumption of the classic ITC that placebos have equal effects; this is what allows ‘connection’ within the network. However, where there is reason to doubt that placebo responses are equal, the network becomes disconnected, and an alternative ITC methodology is likely to be more appropriate. The choice of calculation method should be driven by the belief in which assumptions are most realistic. However, there is a need for empirical data on which to base these decisions.
Anti-CGRP monoclonal antibodies to prevent migraine can be administered IV (eptinezumab) or SC (erenumab, galcanezumab and fremanezumab), and a recent meta-analysis suggested that two-thirds of the efficacy benefit is derived from contextual effects of treatment (such as mode of administration, patient expectations and beliefs, clinical environment, and physician attitude), rather than the biological effect of CGRP blockade [49]. In a recent survey, many patients preferred preventive treatments that demonstrated rapid efficacy (as soon as the first day post-dosing), but they also clearly pursued combinations of treatment options that were most meaningful to them [50]. In this analysis, we evaluated different ITC methodologies to explore how the assumptions and analysis method impacted the outcomes when attempting to compare different anti-CGRP monoclonal antibodies, trials and migraine indications.
Using a standard fixed-effects NMA, we found few differences between eptinezumab and other anti-CGRP monoclonal antibodies, and minor differences in terms of MMD reduction from baseline. We also found that with the use of NMR, which assumes a relationship between the magnitude of the placebo response versus treatment effect, minor differences between eptinezumab and the comparators were observed. However, NMR methodology produced more favorable point estimates for eptinezumab versus other anti-CGRP monoclonal antibodies in EM, although the converse was true for CM. Unanchored networks are mainly reserved for single-arm trials; however, if we assume that there is a distinct contextual effect arising from the differing modes of administration, then the network is disconnected. In this situation, STC is more suitable for analysis. We found that when using STC, the data were strongly in favor of eptinezumab, with an even higher impact of placebo response observed in chronic migraine versus episodic migraine.
The assumptions built into these three methodologies are very different and can lead to very different conclusions. As such, when undertaking ITCs, it is important to understand how this affects the magnitude of the placebo response. In this analysis, we have shown that any conclusions regarding the favorability of different antibodies would differ depending on which ITC methodology was used. Importantly, even when assuming a class effect of treatments and a common coefficient for the impact of placebo response, there was no evidence of a non-zero regression coefficient for the NMR as there were too few studies on each treatment comparison. For the STC method, randomization and placebo arms from randomized controlled trials are not preserved, which has the potential to introduce bias if baseline characteristics are skewed. Furthermore, the target population for the STC comparison is implicitly that of the non-eptinezumab trials, unless a shared effect modifier assumption is made. However, this assumption is difficult to justify in practice [39].
One major limitation of this study is that we conducted ITCs restricted to anti-CGRP monoclonal antibodies based on their similar mechanisms of action. Further analyses are warranted to evaluate the placebo-related impacts inherent within clinical trials of the gepants (oral administration, with intranasal formulations in development) [51], and onabotulinumtoxinA (IM administration for CM) [52]. It is worth noting that the data identification challenge that was found with anti-CGRP monoclonal antibodies will also be an issue for studies evaluating botulinum toxin as a preventive treatment for migraine. A high placebo response rate was recorded in both the PREEMPT 1 [53] and PREEMPT 2 [54] trials of onabotulinumtoxinA, which could be attributable to heightened expectations of potency associated with cost, media hype, attitude of the clinic staff, route of administration (needle-based rather than oral), and number of injections [55]. In addition, in studies of botulinum toxin, outcomes may be further confounded by the potential for unblinding based on the presence or absence of physical changes due to muscle relaxation [55,56]; this makes indirect comparisons with other agents extremely complex.
Other factors that can influence treatment and placebo responses also need to be investigated further. Differences in patient characteristics can result in high placebo responses, particularly in terms of treatment perception and outcome expectations [57]. State factors and trait factors can contribute to a complex placebo response that changes over time [58]. In our study, we attempted to adjust for such differences within the NMR and STC analyses, and we could primarily look at trait factors. However, small numbers of studies limited the power of NMR, giving no evidence of non-zero impact of placebo response. The STC was limited by small sample sizes, potentially unreported prognostic factors, and effect modifiers. Other contextual effects (e.g., patient expectations, the frequency of drug administration, length of drug administration, or the number of investigator–patient interactions during a clinical study) may contribute to the level of treatment and placebo responses observed [5,59]. Conversely, regression adjustment in STC made only a limited difference to treatment effects, and we observed overlap in patient populations (i.e., the standard deviations for baseline characteristics were wide). As a first indirect attempt to understand how these factors impact ITC assumptions and calculations, we were able to adjust only for baseline characteristics that were reported in the clinical trials of the anti-CGRP monoclonal antibodies. Population heterogeneity was minimized by the fact that studies with placebo-controlled periods completed prior to COVID-19 were included, and patients had similar demographics (i.e., were in Europe and the US). To expand on this work, empirical data are needed to enable us to understand the underlying effects to guide and support the assumptions made.
Finally, it is also important to note that ITCs cannot provide the whole story, regardless of which analysis method is selected. Decision makers relying on ITCs are seeking to understand the comparative effectiveness of treatments in the ‘real world’. While it can be argued that the active treatment effect (and not the placebo response) is the only relevant therapeutic outcome in clinical practice, real-world performance of these anti-CGRP treatments will be influenced by the contextual factors that contribute to placebo responses (mode of administration, patient expectations, etc.) [50]. Given that a method for empirical validation of the results is lacking, we cannot know which is the ‘correct’ result; instead, we are suggesting that decision makers should consider several different analytic options when evaluating results of ITCs and the assumptions underlying each, rather than relying solely on the most conservative method, which may or may not reflect what happens in real-world populations. Although the NMA and NMR were unable to adequately differentiate between treatments in this study, STC was able to differentiate between anti-CGRP treatments. As such, it is critical to consider the clinical, contextual, and demographic attributes of individual patients when choosing the best treatment and to have a range of treatment options with varying attributes available for use.
Conclusion
Assumptions about modes of treatment administration have a large impact on ITCs. This analysis was a first indirect attempt to understand these underlying factors, and we found that NMA and NMR results were mixed and rarely differentiated between treatments. The unanchored STC strongly and consistently favored eptinezumab over other migraine preventive treatments. However, it is clear that actual empirical data are needed to guide future investigations; in the real world, the placebo response contributes to the overall efficacy of the treatment, and it is important to understand how placebo and pharmacological responses interact. Consideration of which approach best reflects the contribution of the mode of administration to treatment effect, as well as real-world outcomes, would be beneficial to clinical and formulary decision makers.
Summary points.
Understanding the impact of drug administration routes (subcutaneous, intravenous, and intramuscular) on indirect treatment comparisons leads to improved understanding of the safety and efficacy of preventive migraine treatments.
Indirect treatment comparisons (ITCs) can fill in knowledge gaps that may exist from the lack of direct comparison trials between (intravenous) eptinezumab and other (notably, subcutaneous) monoclonal antibodies.
Using NMA and NMR methods, galcanezumab 120 mg and erenumab 140 mg had greater differences in change from baseline in monthly migraine days captured compared with the intravenously administered anti-CGRP treatment, eptinezumab, in episodic migraine (p < 0.05), but otherwise there was no other evidence of a difference between subcutaneous and intravenous treatments.
Using the STC method, the data generally favored intravenously administered anti-CGRP over subcutaneously administered anti-CGRP treatment.
For both episodic migraine and chronic migraine, STC analysis indicated that eptinezumab treatment was favorable over other anti-CGRP monoclonal antibodies in terms of reduction in monthly migraine days.
The chosen ITC methodology greatly impacts the conclusions drawn about the favorability of one preventive migraine treatment over another.
Decision makers should consider several analytical methods when evaluating ITC results, rather than the most conservative methods (i.e., NMA and NMR).
Future work should aim to better understand the degree of baseline overlap in migraine patient populations and how ITC results change with larger migraine population sampling.
Actual empirical data are needed to guide future investigations; in the real world, placebo response contributes to overall treatment efficacy, and thus it is important to determine interactions between placebo and pharmacological responses.
Supplementary Material
Footnotes
Supplementary data
To view the supplementary data that accompany this paper please visit the journal website at: https://bpl-prod.literatumonline.com/doi/10.57264/cer-2023-0021
Financial & competing interests disclosure
Funding and support for this manuscript was provided by H Lundbeck A/S, Copenhagen, Denmark. H Thom is an employee of Clifton Insight, which has received consulting fees from Lundbeck, Novartis Pharma AG, Roche, Bayer, Pfizer, Merck, BMS, Eisai, CSL Behring and Argenx. SA Regnier, S Kymes and XY Lee are employees of H. Lundbeck A/S, Copenhagen, Denmark. L Vase has received consulting fees from Lundbeck. The authors have no other relevant affiliations or financial involvement with any organization or entity with a financial interest in or financial conflict with the subject matter or materials discussed in the manuscript apart from those disclosed.
The authors thank S-A Mitchell and JA Weaver of The Medicine Group, LLC (New Hope, PA, USA) for providing medical writing support, which was funded by H Lundbeck A/S and in accordance with Good Publication Practice guidelines.
Data sharing statement
All data generated or analyzed during this study are included in this published article (and its supplemental digital content).
Further reading material
For further reading on migraine preventive treatment trials and how comparisons between them are made, the authors highlight the following references: 2, 22, 24, 39, 40 and 49. Decision makers utilize indirect treatment comparisons when comparing the efficacy of various types of preventive migraine treatments.
Open access
This work is licensed under the Attribution-NonCommercial-NoDerivatives 4.0 Unported License. To view a copy of this license, visit https://creativecommons.org/licenses/by-nc-nd/4.0/
References
- 1.O'Rourke B, Oortwijn W, Schuller T. The New Definition of Health Technology Assessment: a Milestone in International Collaboration. Cambridge University Press, Cambridge, UK: (2020). [DOI] [PubMed] [Google Scholar]
- 2.Es-Skali IJ, Spoors J. Analysis of indirect treatment comparisons in national health technology assessments and requirements for industry submissions. J. Comp. Eff. Res. 7(4), 397–409 (2018). [DOI] [PubMed] [Google Scholar]
- 3.Spiegelhalter DJ, Myles JP, Jones DR, Abrams KR. Bayesian methods in health technology assessment: a review. Health Technol. Assess (Rockv) 4(38), 1–130 (2000). [PubMed] [Google Scholar]
- 4.Dias S, Welton NJ, Sutton AJ, Ades AE. NICE DSU Technical Support Document 2: A Generalised Linear Modelling Framework for Pairwise and Network Meta-Analysis of Randomised Controlled Trials. National Institute for Health and Care Excellence ; Royston, UK: (2011). [PubMed] [Google Scholar]
- 5.Vase L, Vollert J, Finnerup NB et al. Predictors of the placebo analgesia response in randomized controlled trials of chronic pain: a meta-analysis of the individual data from nine industrially sponsored trials. Pain 156(9), 1795–1802 (2015). [DOI] [PubMed] [Google Scholar]
- 6.Vase L, Wartolowska K. Pain, placebo, and test of treatment efficacy: a narrative review. Br. J. Anaesth. 123(2), e254–e262 (2019). [DOI] [PMC free article] [PubMed] [Google Scholar]
- 7.Kaptchuk TJ, Stason WB, Davis RB et al. Sham device versus inert pill: randomised controlled trial of two placebo treatments. Br. Med. J. 332(7538), 391–394 (2006). [DOI] [PMC free article] [PubMed] [Google Scholar]
- 8.Bannuru RR, McAlindon TE, Sullivan MC, Wong JB, Kent DM, Schmid CH. Effectiveness and implications of alternative placebo treatments: a systematic review and network meta-analysis of osteoarthritis trials. Ann. Intern. Med. 163(5), 365–392 (2015). [DOI] [PubMed] [Google Scholar]
- 9.Macedo A, Farré M, Baños JE. A meta-analysis of the placebo response in acute migraine and how this response may be influenced by some of the characteristics of clinical trials. Eur. J. Clin. Pharmacol. 62(3), 161–172 (2006). [DOI] [PubMed] [Google Scholar]
- 10.de Craen AJ, Tijssen JG, de Gans J, Kleijnen J. Placebo effect in the acute treatment of migraine: subcutaneous placebos are better than oral placebos. J. Neurol. 247, 183–188 (2000). [DOI] [PubMed] [Google Scholar]
- 11.Phillippo DM, Dias S, Ades AE, Welton NJ. Assessing the performance of population adjustment methods for anchored indirect comparisons: a simulation study. Stat. Med. 39(30), 4885–4911 (2020). [DOI] [PMC free article] [PubMed] [Google Scholar]
- 12.Edvinsson L, Haanes KA, Warfvinge K, Krause DN. CGRP as the target of new migraine therapies — successful translation from bench to clinic. Nat. Rev. Neurol. 14(6), 338–350 (2018). [DOI] [PubMed] [Google Scholar]
- 13.Chiang CC, Schwedt TJ. Calcitonin gene-related peptide (CGRP)-targeted therapies as preventive and acute treatments for migraine — the monoclonal antibodies and gepants. Prog. Brain Res. 255, 143–170 (2020). [DOI] [PubMed] [Google Scholar]
- 14.Sacco S, Amin FM, Ashina M et al. European Headache Federation guideline on the use of monoclonal antibodies targeting the calcitonin gene related peptide pathway for migraine prevention – 2022 update. J. Headache Pain 23(67), 1–19 (2022). [DOI] [PMC free article] [PubMed] [Google Scholar]
- 15.Benemei S, Bentivegna E, Martelletti P. Positioning the new drugs for migraine. Expert Opin. Drug Metab. Toxicol. 18(1), 1–3 (2022). [DOI] [PubMed] [Google Scholar]
- 16.Lai T-H, Huang T-C. Update in migraine preventive treatment. Prog. Brain Res. 255, 1–27 (2020). [DOI] [PubMed] [Google Scholar]
- 17.Ashina M, Saper J, Cady R et al. Eptinezumab in episodic migraine: a randomized, double-blind, placebo-controlled study (PROMISE-1). Cephalalgia 40(3), 241–254 (2020). [DOI] [PMC free article] [PubMed] [Google Scholar]
- 18.Lipton RB, Goadsby PJ, Smith J et al. Efficacy and safety of eptinezumab in patients with chronic migraine: PROMISE-2. Neurology 94(13), e1365–e1377 (2020). [DOI] [PMC free article] [PubMed] [Google Scholar]
- 19.Ashina M. Migraine. N. Engl. J. Med. 383(19), 1866–1876 (2020). [DOI] [PubMed] [Google Scholar]
- 20.Masoud AT, Hasan MT, Sayed A et al. Efficacy of calcitonin gene-related peptide (CGRP) receptor blockers in reducing the number of monthly migraine headache days (MHDs): a network meta-analysis of randomized controlled trials. J. Neurol. Sci. 427, (2021). [DOI] [PubMed] [Google Scholar]
- 21.Fernández-Bravo-Rodrigo J, Pascual-Morena C, Flor-García A et al. The safety and efficacy of calcitonin gene-related peptide (CGRP) monoclonal antibodies for the preventive treatment of migraine: a protocol for multiple-treatment systematic review and meta-analysis. Int. J. Environ. Res. Public Health 19(3), 1753 (2022). [DOI] [PMC free article] [PubMed] [Google Scholar]
- 22.Chen Y-Y, Ye X-Q, Tang T-C, She T-W, Chen M, Zheng H. Calcitonin gene-related peptide monoclonal antibodies versus botulinum neurotoxin a in the preventive treatment of chronic migraine: an adjusted indirect treatment comparison meta-analysis. Front. Pharmacol. 12(671845), 1172 (2021). [DOI] [PMC free article] [PubMed] [Google Scholar]
- 23.Alasad YW, Asha MZ. Monoclonal antibodies as a preventive therapy for migraine: a meta-analysis. Clin. Neurol. Neurosurg. 195, (2020). [DOI] [PubMed] [Google Scholar]
- 24.Swerts DB, Benedetti F, Peres MFP. Different routes of administration in chronic migraine prevention lead to different placebo responses: a meta-analysis. Pain 163(3), 415–424 (2022). [DOI] [PubMed] [Google Scholar]
- 25.Australian Government Department of Health and Aged Care. 5.06 FREMANEZUMAB, Injection 225mg in 1.5mL pre-filled syringe, Ajovy®. Teva Pharma Australia Pty Ltd ; Ryde, Australia: (2019). [Google Scholar]
- 26.Dodick DW, Ashina M, Brandes JL et al. ARISE: a phase III randomized trial of erenumab for episodic migraine. Cephalalgia 38(6), 1026–1037 (2018). [DOI] [PubMed] [Google Scholar]
- 27.Stauffer VL, Dodick DW, Zhang Q, Carter JN, Ailani J, Conley RR. Evaluation of galcanezumab for the prevention of episodic migraine: the EVOLVE-1 randomized clinical trial. JAMA Neurol. 75(9), 1080–1088 (2018). [DOI] [PMC free article] [PubMed] [Google Scholar]
- 28.Skljarevski V, Matharu M, Millen BA, Ossipov MH, Kim BK, Yang JY. Efficacy and safety of galcanezumab for the prevention of episodic migraine: results of the EVOLVE-2 phase III randomized controlled clinical trial. Cephalalgia 38(8), 1442–1454 (2018). [DOI] [PubMed] [Google Scholar]
- 29.Dodick DW, Silberstein SD, Bigal ME et al. Effect of fremanezumab compared with placebo for prevention of episodic migraine: a randomized clinical trial. JAMA 319(19), 1999–2008 (2018). [DOI] [PMC free article] [PubMed] [Google Scholar]
- 30.Goadsby PJ, Reuter U, Hallström Y et al. A controlled trial of erenumab for episodic migraine. N. Engl. J. Med. 377(22), 2123–2132 (2017). [DOI] [PubMed] [Google Scholar]
- 31.Silberstein SD, Dodick DW, Bigal ME et al. Fremanezumab for the preventive treatment of chronic migraine. N. Engl. J. Med. 377(22), 2113–2122 (2017). [DOI] [PubMed] [Google Scholar]
- 32.Detke HC, Goadsby PJ, Wang S, Friedman DI, Selzler KJ, Aurora SK. Galcanezumab in chronic migraine: the randomized, double-blind, placebo-controlled REGAIN study. Neurology 91(24), e2211–e2221 (2018). [DOI] [PMC free article] [PubMed] [Google Scholar]
- 33.Tepper S, Ashina M, Reuter U et al. Safety and efficacy of erenumab for preventive treatment of chronic migraine: a randomised, double-blind, placebo-controlled phase II trial. Lancet Neurol. 16(6), 425–434 (2017). [DOI] [PubMed] [Google Scholar]
- 34.Costello Medical. Clinical Systematic Literature Review in Migraine Prevention. Cambridge, UK: (2021). [Google Scholar]
- 35.Latimer NR. Survival analysis for economic evaluations alongside clinical trials - Extrapolation with patient-level data: inconsistencies, limitations, and a practical guide. Med. Decision Making 33(6), 743–754 (2013). [DOI] [PubMed] [Google Scholar]
- 36.Fuentes J, Armijo-Olivo S, Funabashi M et al. Enhanced Therapeutic Alliance Modulates Pain Intensity and Muscle Pain Sensitivity in Patients With Chronic Low Back Pain: An Experimental Controlled Study. Phys. Ther. 94(4), 477–489 (2014). [DOI] [PubMed] [Google Scholar]
- 37.Howe LC, Goyer JP, Crum AJ. Harnessing the Placebo Effect: Exploring the Influence of Physician Characteristics on Placebo Response. Health Psychol. 36(11), 1074–1082 (2017). [DOI] [PMC free article] [PubMed] [Google Scholar]
- 38.Czerniak E, Biegon A, Ziv A et al. Manipulating the Placebo Response in Experimental Pain by Altering Doctor's Performance Style. Front. Psychol. 7, 1–10 (2016). [DOI] [PMC free article] [PubMed] [Google Scholar]
- 39.Phillippo DM, Ades AE, Dias S, Palmer S, Abrams KR, Welton NJ. Methods for Population-Adjusted Indirect Comparisons in Health Technology Appraisal. Med. Decision Making 38(2), 200–211 (2018). [DOI] [PMC free article] [PubMed] [Google Scholar]
- 40.Phillippo DM, Ades AE, Dias S, Palmer S, Abrams KR, Welton NJ. NICE DSU Technical Support Document 18: Methods for Population-Adjusted Indirect Comparisons in Submissions to NICE. National Institute for Health and Care Excellence (NICE) 1–82 (2016). [Google Scholar]
- 41.Hoaglin DC, Hawkins N, Jansen JP et al. Conducting indirect-treatment-comparison and network-meta-analysis studies: report of the ISPOR task force on indirect treatment comparisons good research practices: Part 2. Value Health 14(4), 429–437 (2011). [DOI] [PubMed] [Google Scholar]
- 42.Jansen JP, Fleurence R, Devine B et al. Interpreting indirect treatment comparisons and network meta-analysis for health-care decision making: report of the ISPOR task force on indirect treatment comparisons good research practices: Part 1. Value Health 14(4), 417–428 (2011). [DOI] [PubMed] [Google Scholar]
- 43.Lunn D, Jackson C, Best N, Thomas A, Spiegelhalter D. The BUGS Book: A Practical Introduction to Bayesian Analysis (1st Edition). Chapman and Hall/CRC ; FL, USA: (2012). [Google Scholar]
- 44.Wasserstein RL, Lazar NA. The ASA's Statement on p-Values: Context, Process, and Purpose. Am. Stat. 70(2), 129–133 (2016). [Google Scholar]
- 45.Sterne JA, Smith GD. Sifting the evidence-what's wrong with significance tests? BMJ 322, 226–231 (2001). [DOI] [PMC free article] [PubMed] [Google Scholar]
- 46.R Core Team. ‘R: a language and environment for statistical computing’ (2022). https://www.r-project.org/
- 47.Schwartzer G, Carpenter J R, Rücker G. Meta-Analysis with R. (2015). [Google Scholar]
- 48.Faltinsen EG, Storebø OJ, Jakobsen JC, Boesen K, Lange T, Gluud C. Network meta-analysis: the highest level of medical evidence? BMJ Evid. Based Med. 23(2), 56–59 (2018). [DOI] [PubMed] [Google Scholar]
- 49.Forbes RB, McCarron M, Cardwell CR. Efficacy and Contextual (Placebo) Effects of CGRP Antibodies for Migraine: Systematic Review and Meta-analysis. In: Headache: The Journal of Head and Face Pain. Blackwell Publishing Inc, MA, USA, 1542–1557 (2020). [DOI] [PubMed] [Google Scholar]
- 50.Ailani J, Winner P, Hartry A et al. Patient preference for early onset of efficacy of preventive migraine treatments. Headache 62(3), 374–382 (2022). [DOI] [PMC free article] [PubMed] [Google Scholar]
- 51.Moreno-Ajona D, Villar-Martínez MD, Goadsby PJ. New Generation Gepants: Migraine Acute and Preventive Medications. J. Clin. Med. 11(6), 1656 (2022). [DOI] [PMC free article] [PubMed] [Google Scholar]
- 52.Blumenfeld A, Silberstein SD, Dodick DW, Aurora SK, Turkel CC, Binder WJ. Method of Injection of OnabotulinumtoxinA for Chronic Migraine: A Safe, Well-Tolerated, and Effective Treatment Paradigm Based on the PREEMPT Clinical Program. Headache 50(9), 1406–1418 (2010). [DOI] [PubMed] [Google Scholar]
- 53.Aurora SK, Dodick DW, Turkel CC et al. OnabotulinumtoxinA for treatment of chronic migraine: results from the double-blind, randomized, placebo-controlled phase of the PREEMPT 1 trial. Cephalalgia 30(7), 793–803 (2010). [DOI] [PubMed] [Google Scholar]
- 54.Diener HC, Dodick DW, Aurora SK et al. OnabotulinumtoxinA for treatment of chronic migraine: results from the double-blind, randomized, placebo-controlled phase of the PREEMPT 2 trial. Cephalalgia 30(7), 804–814 (2010). [DOI] [PubMed] [Google Scholar]
- 55.Solomon S. Botulinum toxin for the treatment of chronic migraine: the placebo effect. Headache 51(6), 980–984 (2011). [DOI] [PubMed] [Google Scholar]
- 56.Meissner K, Fässler M, Rücker G et al. Differential effectiveness of placebo treatments: a systematic review of migraine prophylaxis. JAMA Intern. Med. 173(21), 1941–1951 (2013). [DOI] [PubMed] [Google Scholar]
- 57.Peciña M, Azhar H, Love TM et al. Personality trait predictors of placebo analgesia and neurobiological correlates. Neuropsychopharmacology 38(4), 639–646 (2013). [DOI] [PMC free article] [PubMed] [Google Scholar]
- 58.Rief W, Petrie KJ. Can psychological expectation models be adapted for placebo research? Front. Psychol. 7, 1876 (2016). [DOI] [PMC free article] [PubMed] [Google Scholar]
- 59.Vase L, Wartolowska K. Pain, placebo, and test of treatment efficacy: a narrative review. In: British Journal of Anaesthesia. Elsevier Ltd, Amsterdam, The Netherlands, e254–e262 (2019). [DOI] [PMC free article] [PubMed] [Google Scholar]
Associated Data
This section collects any data citations, data availability statements, or supplementary materials included in this article.