

This cohort study investigates the distribution of lipoprotein(a) levels among Hispanic or Latino individuals residing in the US.
Key Points
Question
What is the distribution of lipoprotein(a) levels among a contemporary sample of the diverse Hispanic or Latino community in the US?
Findings
In this analysis of 16 117 participants from the Hispanic Community Health Study/Study of Latinos cohort, the median lipoprotein(a) level varied by self-identified Hispanic or Latino background, likely related to differences seen in genetic ancestry.
Meaning
Study results suggest that there is significant heterogeneity in lipoprotein(a) levels across the diverse US Hispanic or Latino population.
Abstract
Importance
Lipoprotein(a) (Lp[a]) is a genetically determined risk-enhancing factor for atherosclerotic cardiovascular disease (ASCVD). The Lp(a) distribution among the diverse Hispanic or Latino community residing in the US has not been previously described, to the authors’ knowledge.
Objective
To determine the distribution of Lp(a) levels across a large cohort of diverse Hispanic or Latino adults living in the US and by key demographic groups.
Design, Setting, and Participants
The Hispanic Community Health Study/Study of Latinos (HCHS/SOL) is a prospective, population-based, cohort study of diverse Hispanic or Latino adults living in the US. At screening, participants aged 18 to 74 years were recruited between 2008 and 2011 from 4 US metropolitan areas (Bronx, New York; Chicago, Illinois; Miami, Florida; San Diego, California). HCHS/SOL included 16 415 noninstitutionalized adults recruited through probability sampling of randomly selected households. The study population represents Hispanic or Latino participants from diverse self-identified geographic and cultural backgrounds: Central American, Cuban, Dominican, Mexican, Puerto Rican, and South American. This study evaluated a subset of HCHS/SOL participants who underwent Lp(a) measurement. Sampling weights and surveys methods were used to account for HCHS/SOL sampling design. Data for this study were analyzed from April 2021 to April 2023.
Exposure
Lp(a) molar concentration was measured by a particle-enhanced turbidimetric assay with minimized sensitivity to apolipoprotein(a) size variation.
Main Outcome and Measure
Lp(a) quintiles were compared using analysis of variance among key demographic groups, including self-identified Hispanic or Latino background. Median percentage genetic ancestry (Amerindian, European, West African) were compared across Lp(a) quintiles.
Results
Lp(a) molar concentration was measured in 16 117 participants (mean [SD] age, 41 [14.8] years; 9680 female [52%]; 1704 Central American [7.7%], 2313 Cuban [21.1%], 1436 Dominican [10.3%], 6395 Mexican [39.1%], 2652 Puerto Rican [16.6%], 1051 South American [5.1%]). Median (IQR) Lp(a) level was 19.7 (7.4-59.7) nmol/L. Across Hispanic or Latino background groups, there was significant heterogeneity in median Lp(a) levels ranging from 12 to 41 nmol/L in those reporting a Mexican vs Dominican background. Median (IQR) West African genetic ancestry was lowest in the first quintile of Lp(a) level and highest in the fifth quintile (5.5% [3.4%-12.9%] and 12.1% [5.0%-32.5%]; respectively; P < .001), whereas the converse was seen for Amerindian ancestry (32.8% [9.9%-53.2%] and 10.7% [4.9%-30.7%], respectively; P < .001).
Conclusions and Relevance
Results of this cohort study suggest that differences in Lp(a) level distribution across the diverse US Hispanic or Latino population may carry important implications for the use of Lp(a) level in ASCVD risk assessment for this group. Cardiovascular outcomes data are needed to better understand the clinical impact of differences in Lp(a) levels by Hispanic or Latino background.
Introduction
Atherosclerotic cardiovascular disease (ASCVD) is a leading cause of mortality in the US Hispanic or Latino population.1 Lipoprotein(a) (Lp[a]) is an ASCVD risk-enhancing factor similar in composition to low-density lipoprotein (LDL) but defined by the unique presence of apolipoprotein(a).2 Lp(a) is predominantly monogenically determined and is a strong, independent ASCVD risk factor. There is significant heterogeneity across ancestral groups, with median Lp(a) levels ranging in order from highest to lowest among African, South Asian, White, Hispanic, and East Asian individuals.3
The distribution of Lp(a) levels among Hispanic or Latino individuals in the US is not well known,4 particularly considering their diverse geographic background and varying genetic admixture of European, Native American (Amerindian), and West African ancestries.1,5 We hypothesize that there is considerable heterogeneity in Lp(a) levels across individuals from various Hispanic or Latino backgrounds due to diversity in genetic admixture. We assessed the distribution of Lp(a) levels in the diverse, population-based Hispanic Community Health Study/Study of Latinos (HCHS/SOL).
Methods
HCHS/SOL Study
The HCHS/SOL study methods have been previously described.6,7 Participants aged 18 to 74 years were recruited between 2008 to 2011 from households across 4 metropolitan areas (Bronx, New York; Chicago, Illinois; Miami, Florida; San Diego, California). The HCHS/SOL represents 16 415 self-identified Hispanic or Latino participants from diverse geographic and cultural backgrounds: Central American, Cuban, Dominican, Mexican, Puerto Rican, and South American. All sites obtained institutional review board approval, and all participants provided written informed consent (eMethods in Supplement 1). This study followed the Strengthening the Reporting of Observational Studies in Epidemiology (STROBE) reporting guidelines.
Lp(a) Measurement and Genetic Ancestry Data
Lp(a) level was measured in nanomoles per liter by a validated latex-enhanced turbidimetric method (Tina-quant Lipoprotein[a] Gen2 kit [Roche]) on a c502 autoanalyzer (eMethods in Supplement 1). Genotyping was performed using the Omni 2.5M array (Illumina) in 12 803 participants who provided consent for genetic studies.5 After excluding related individuals, continental ancestry (Amerindian, East Asian, European, and West African) proportions were estimated using ADMIXTURE software and compared with reference samples for a supervised analysis in 9642 unrelated participants with Lp(a) data. The East Asian component was very low and, therefore, not reported.5
Statistical Analysis
All analyses are weighted using complex survey procedures. Study data were analyzed from April 2021 to April 2023 using SAS software, version 9.4 (SAS Institute). All P values were 2 sided, and statistical significance was set at a cutoff of P < .05 (eMethods in Supplement 1).
Results
After excluding 298 participants (1.8%) without laboratory data due to lack of consent or lack of stored blood, there were a total of 16 117 HCHS/SOL participants (mean [SD] age, 41 [14.8]; 9680 female [52%]; 6437 male [48%]) with an Lp(a) result included in this study. Participants self-identified with the following geographic and cultural backgrounds: 1704 Central American [7.7%], 2313 Cuban [21.1%], 1436 Dominican [10.3%], 6395 Mexican [39.1%], 2652 Puerto Rican [16.6%], and 1051 South American [5.1%].
Among the 16 117 individuals with Lp(a) data, the median Lp(a) (IQR) level was 19.7 (7.4-59.7) nmol/L (Figure 1). There were higher median Lp(a) values among older age groups and women (eTable 1 in Supplement 1). Median (IQR) Lp(a) level was higher in adults with prevalent clinical ASCVD vs those without prevalent clinical ASCVD (24.7 [8.5-75.6] nmol/L vs 19.3 [7.2-59.6] nmol/L; P < .001) (eTable 2 in Supplement 1). Total cholesterol, non–high-density lipoprotein cholesterol, and low-density lipoprotein cholesterol levels were higher with increasing Lp(a) quintiles (eTable 3 in Supplement 1).
Figure 1. Hispanic Community Health Study/Study of Latinos (HCHS/SOL) Lipoprotein(a) (Lp[a]) Distribution With Population Percentiles at Common Clinical Thresholds.

Lp(a) distribution in the HCHS/SOL population among 16 117 participants. All numbers are unweighted, and all descriptive analyses use weighted medians and percentages.
Lp(a) by Self-identified Hispanic or Latino Background
The highest median (IQR) Lp(a) values were seen in those self-identifying as Cuban (30.4 [9.2-78.6] nmol/L), Dominican (41 [13.8-89.7] nmol/L), or Puerto Rican (28 [9.4-73.6] nmol/L) background (Figure 2). Lower median (IQR) Lp(a) values were noted in those self-identifying as Central American (16.5 [6.8-44.5] nmol/L), Mexican (12.4 [5.7-38.2] nmol/L), or South American (15.1 [6.7-59.1] nmol/L) background (P < .001). A sensitivity analysis excluding statin users at baseline showed similar trends across background groups with lower Lp(a) values for the population (eTable 4 in the Supplement).
Figure 2. Hispanic Community Health Study/Study of Latinos (HCHS/SOL) Lipoprotein(a) Distribution by Self-identified Hispanic or Latino Background.
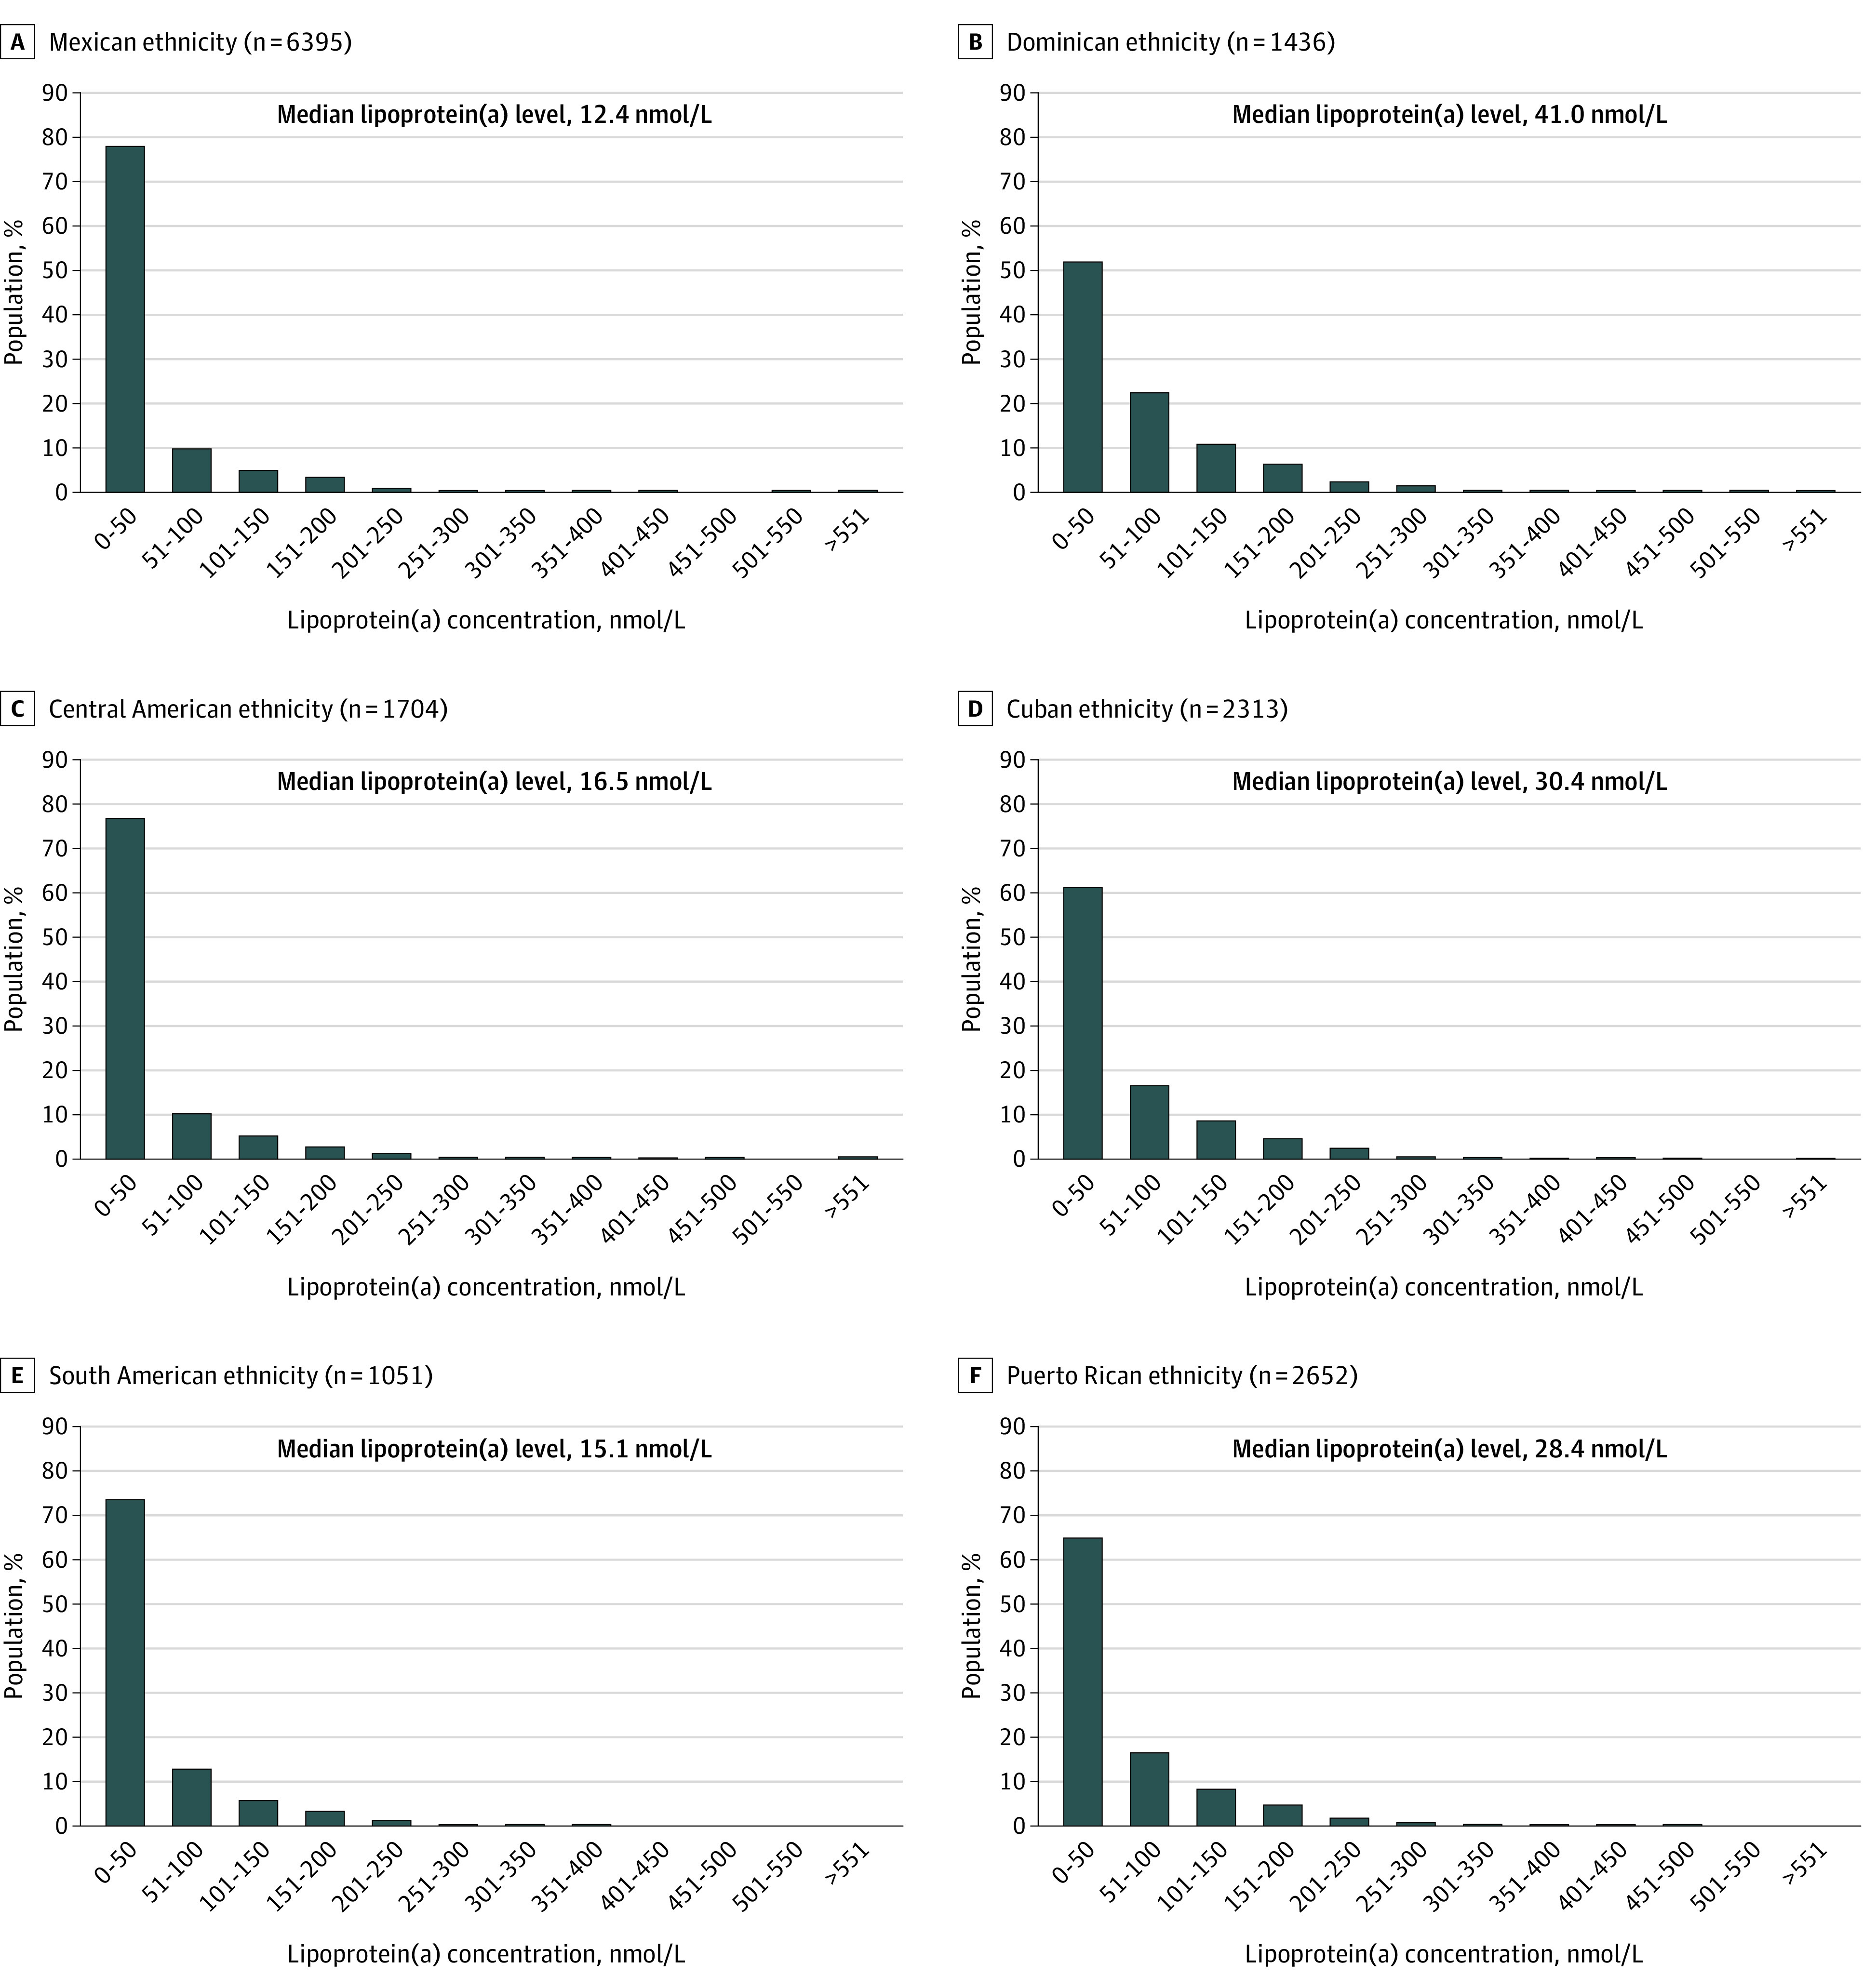
Lipoprotein(a) distribution among individuals from the following Hispanic or Latino ethnicities: Mexican (A), Dominican (B), Central American (C), Cuban (D), South American (E), and Puerto Rican (F) among a total of 15 551 individuals. Numbers are unweighted, and all descriptive analyses use weighted medians and percentages. Hispanic or Latino background group categorization was based on self-identification from the baseline HCHS/SOL visit interviewer-administered personal information questionnaire.
Lp(a) and Genetic Ancestry
The 9642 unrelated individuals in the ancestry analysis with Lp(a) results had median (IQR) ancestry of 16.7% (6.9%-46.5%) Amerindian, 55.9% (41.1%-73.3%) European, and 7% (4.1%-19.8%) West African (P < .001) (Table). Median (IQR) West African genetic ancestry was lowest in the first quintile of Lp(a) level and highest in the fifth quintile (5.5% [3.4%-12.9%] and 12.1% [5.0%-32.5%]; respectively; P < .001), whereas the converse was seen for Amerindian ancestry (32.8% [9.9%-53.2%] and 10.7% [4.9%-30.7%], respectively; P < .001). Similar findings were seen when excluding statin users and when evaluating median Lp(a) values across quintiles of ancestry (eTables 5 and 6 in Supplement 1). Significant associations of genetic ancestry with Lp(a) were seen in the overall HCHS/SOL population; however, the study was underpowered to detect the contribution of differences in genetic ancestry by self-identified background subgroups toward the differences seen in Lp(a) values (eTables 7 and 8 in Supplement 1).
Table. Median Percentage Ancestry Across Lipoprotein(a) Quintiles From the Hispanic Community Health Study/Study of Latinos (2008-2011).
| Ancestry | Median (IQR)a | ||||||
|---|---|---|---|---|---|---|---|
| Ancestry, % | Quintile 1, <6 nmol/L, % | Quintile 2, 6-13 nmol/L, % | Quintile 3, 13-32 nmol/L, % | Quintile 4, 32-77 nmol/L, % | Quintile 5, ≥77 nmol/L, % | P value | |
| Amerindian | 16.7 (6.9-46.5) | 32.8 (9.9-53.2) | 34.4 (11.4-52.1) | 19.6 (7.1-49.6) | 12.2 (5.4-40.4) | 10.7 (4.9-30.7) | <.001 |
| European | 55.9 (41.1-73.3) | 54.1 (39.9-71.3) | 53.7 (38.9-69.4) | 54.7 (40.2-73.2) | 57.0 (41.4-76.0) | 59.0 (44.5-75.7) | <.001 |
| West African | 7.0 (4.1-19.8) | 5.5 (3.4-12.9) | 5.8 (3.7-12.7) | 6.7 (3.8-18.1) | 9.7 (4.6-28.0) | 12.1 (5.0-32.5) | <.001 |
All descriptive analyses use weighted frequencies and percentages; n = 9642.
Discussion
We reported the heterogeneous distribution of Lp(a) levels in, to our knowledge, the largest population-based sample of diverse US Hispanic or Latino individuals. Most notably, the distribution of Lp(a) values significantly differed by self-identified Hispanic or Latino background. Furthermore, we found significant associations of genetic ancestry with Lp(a) values, which likely explain much of the heterogeneity in levels across background groups. Our findings may have significant implications for ASCVD risk assessment in the diverse US Hispanic or Latino population.
Among population-based studies using methods with Lp(a) concentration expressed in nanomole per liter, the median Lp(a) level for the overall HCHS/SOL population (19.7 nmol/L) is lower than that previously reported in Black and South Asian populations and similar to that of White populations.4,8 A large population-based UK Biobank study showed median Lp(a) levels of 75 nmol/L in Black participants and 31 nmol/L in South Asian participants. In comparison, median Lp(a) level was 19 nmol/L in White participants and 16 nmol/L in Chinese participants.8 Importantly, the same study showed similar linear associations of Lp(a) level with ASCVD risk by racial and ethnic group but did not include Hispanic or Latino individuals.
A novel finding of our study was the heterogeneity in Lp(a) values seen within the Hispanic or Latino population. Genetic ancestry among groups with Hispanic or Latino background is known to vary, with higher proportions of Amerindian ancestry among mainland Hispanic or Latino individuals (Central American, Mexican, and South American origin) than those with Caribbean origin (Cuban, Dominican Republic, and Puerto Rican origin), in whom African ancestry tends to prevail.1,5,9 This phenomenon is a result of historical differences in how the African slave trade was used in the Caribbean vs mainland Latin America.10 Median Lp(a) values ranged from 12.4 nmol/L among those reporting Mexican background to 41.0 nmol/L among those reporting Dominican background. This is not unexpected given the strong genetic influence of Lp(a) levels and is likely driven by genetic ancestry.11 The levels of African ancestry among the HCHS/SOL self-identified Caribbean-Hispanic population are lower than those seen among African American individuals, potentially explaining the higher Lp(a) levels reported among the African American population in the literature compared with Hispanic individuals reporting Dominican background in HCHS/SOL.5,12 Similarly, Amerindian ancestry has been associated with lower Lp(a) levels, and HCHS/SOL participants reporting Mexican background have the highest proportions of Amerindian genetic ancestry.5
We found several associations of Lp(a) with sociodemographic variables in HCHS/SOL including higher Lp(a) levels in women and among older age groups. The reasons for associations of Lp(a) with some socioeconomic/acculturation variables in our study are likely to be complex and may reflect gene-environment interactions modulating Lp(a) concentrations or confounding by age, sex, Hispanic or Latino background, or other unmeasured factors.
An important clinical implication of our findings concerns the association of race and ethnicity and ancestry with Lp(a) thresholds to identify increased ASCVD risk. Our findings of a broad range of Lp(a) levels in the HCHS/SOL population by self-identified background groups may lead to underclassification of ASCVD risk in individuals from some Hispanic or Latino backgrounds (ie, Central American, Mexican, and South American) compared with others (ie, Dominican, Cuban, and Puerto Rican) when using thresholds of Lp(a) level.8 Our findings of lower Lp(a) levels among the Hispanic or Latino population may have implications for the “Hispanic paradox,” which suggests that ASCVD event rates are lower than expected among Hispanic or Latino individuals based on their traditional risk factor burden, although this notion is controversial.13,14 Further, the paradox may not apply equally to every Hispanic or Latino background group as Lp(a) level varies significantly across the Hispanic or Latino population. The associations of Lp(a) level with ASCVD risk across Hispanic or Latino background groups can clarify these concepts and will be assessed in future HCHS/SOL analyses when sufficient ASCVD events have accumulated. Finally, our findings may have important implications for the representation of Hispanic or Latino individuals in clinical trials of therapeutics enrolling by absolute levels of Lp(a). Consideration should be given to enrolling a diverse representative sample of Hispanic or Latino individuals by background and genetic ancestry.
Limitations
Our study is limited by being cross-sectional, although analyses including incident cardiovascular events over prospective follow-up are planned as the study population matures. Although the HCHS/SOL target population is limited to 4 specific US geographic areas, the selected communities each have high concentrations of the major Hispanic or Latino background groups residing in the US.
Conclusions
In this population-based cohort study of diverse Hispanic or Latino adults living in the US, we found that Lp(a) levels varied significantly by heritage group and genetic ancestry. The heterogeneity in Lp(a) levels within the Hispanic or Latino population in the US may have important implications for ASCVD risk assessment in this undertreated group. A study of Lp(a) associations with ASCVD events in HCHS/SOL is planned.
eMethods.
eTable 1. Median Lp(a) by Baseline Characteristics From HCHS/SOL (2008-2011)
eTable 2. Median Lp(a) and Prevalence of Factors Across Quintiles From HCHS/SOL (2008-2011)
eTable 3. Lipid Values Across Lp(a) Quintiles From HCHS/SOL (2008-2011) and Excluding Statin Users From HCHS/SOL (2008-2011)
eTable 4. Median and 80th Percentile Lp(a) Values by Geographic Background Excluding Statin Users From HCHS/SOL (2008-2011)
eTable 5. Median Lp(a) Across Ancestry Quintiles From HCHS/SOL (2008-2011)
eTable 6. Median % Ancestry Across Lp(a) Quintiles Excluding Statin Users From HCHS/SOL (2008-2011)
eTable 7. Median Lp(a) and % Ancestry by Geographic Background From HCHS/SOL (2008-2011)
eTable 8. Regression Model of % Ancestry and Lp(a) by Geographic Background From HCHS/SOL (2008-2011)
eReferences
Data Sharing Statement
References
- 1.Rodriguez CJ, Allison M, Daviglus ML, et al. ; American Heart Association Council on Epidemiology and Prevention; American Heart Association Council on Clinical Cardiology; American Heart Association Council on Cardiovascular and Stroke Nursing . Status of cardiovascular disease and stroke in Hispanics/Latinos in the US: a science advisory from the American Heart Association. Circulation. 2014;130(7):593-625. doi: 10.1161/CIR.0000000000000071 [DOI] [PMC free article] [PubMed] [Google Scholar]
- 2.Reyes-Soffer G, Ginsberg HN, Berglund L, et al. ; American Heart Association Council on Arteriosclerosis, Thrombosis and Vascular Biology; Council on Cardiovascular Radiology and Intervention; and Council on Peripheral Vascular Disease . Lipoprotein(a): a genetically determined, causal, and prevalent risk factor for atherosclerotic cardiovascular disease: a scientific statement from the American Heart Association. Arterioscler Thromb Vasc Biol. 2022;42(1):e48-e60. doi: 10.1161/ATV.0000000000000147 [DOI] [PMC free article] [PubMed] [Google Scholar]
- 3.Tsimikas S, Marcovina SM. Ancestry, lipoprotein(a), and cardiovascular risk thresholds: JACC review topic of the week. J Am Coll Cardiol. 2022;80(9):934-946. doi: 10.1016/j.jacc.2022.06.019 [DOI] [PubMed] [Google Scholar]
- 4.Enkhmaa B, Anuurad E, Berglund L. Lipoprotein (a): impact by ethnicity and environmental and medical conditions. J Lipid Res. 2016;57(7):1111-1125. doi: 10.1194/jlr.R051904 [DOI] [PMC free article] [PubMed] [Google Scholar]
- 5.Conomos MP, Laurie CA, Stilp AM, et al. Genetic diversity and association studies in US Hispanic/Latino populations: applications in the Hispanic Community Health Study/Study of Latinos. Am J Hum Genet. 2016;98(1):165-184. doi: 10.1016/j.ajhg.2015.12.001 [DOI] [PMC free article] [PubMed] [Google Scholar]
- 6.Sorlie PD, Avilés-Santa LM, Wassertheil-Smoller S, et al. Design and implementation of the Hispanic Community Health Study/Study of Latinos. Ann Epidemiol. 2010;20(8):629-641. doi: 10.1016/j.annepidem.2010.03.015 [DOI] [PMC free article] [PubMed] [Google Scholar]
- 7.Lavange LM, Kalsbeek WD, Sorlie PD, et al. Sample design and cohort selection in the Hispanic Community Health Study/Study of Latinos. Ann Epidemiol. 2010;20(8):642-649. doi: 10.1016/j.annepidem.2010.05.006 [DOI] [PMC free article] [PubMed] [Google Scholar]
- 8.Patel AP, Wang M, Pirruccello JP, et al. Lp(a) (Lipoprotein[a]) concentrations and incident atherosclerotic cardiovascular disease: new insights from a large national biobank. Arterioscler Thromb Vasc Biol. 2021;41(1):465-474. [DOI] [PMC free article] [PubMed] [Google Scholar]
- 9.Manichaikul A, Palmas W, Rodriguez CJ, et al. Population structure of Hispanics in the US: the multiethnic study of atherosclerosis. PLoS Genet. 2012;8(4):e1002640. doi: 10.1371/journal.pgen.1002640 [DOI] [PMC free article] [PubMed] [Google Scholar]
- 10.Bonilla C, Shriver MD, Parra EJ, Jones A, Fernández JR. Ancestral proportions and their association with skin pigmentation and bone mineral density in Puerto Rican women from New York city. Hum Genet. 2004;115(1):57-68. doi: 10.1007/s00439-004-1125-7 [DOI] [PubMed] [Google Scholar]
- 11.Borrell LN, Elhawary JR, Fuentes-Afflick E, et al. Race and genetic ancestry in medicine—a time for reckoning with racism. N Engl J Med. 2021;384(5):474-480. doi: 10.1056/NEJMms2029562 [DOI] [PMC free article] [PubMed] [Google Scholar]
- 12.Gebreab SY, Riestra P, Khan RJ, et al. Genetic ancestry is associated with measures of subclinical atherosclerosis in African Americans: the Jackson Heart Study. Arterioscler Thromb Vasc Biol. 2015;35(5):1271-1278. doi: 10.1161/ATVBAHA.114.304855 [DOI] [PMC free article] [PubMed] [Google Scholar]
- 13.Khan SU, Lone AN, Yedlapati SH, et al. Cardiovascular disease mortality among Hispanic vs non-Hispanic White adults in the US, 1999 to 2018. J Am Heart Assoc. 2022;11(7):e022857. doi: 10.1161/JAHA.121.022857 [DOI] [PMC free article] [PubMed] [Google Scholar]
- 14.Montanez-Valverde R, McCauley J, Isasi R, Zuchner S, Carrasquillo O; SouthEast Enrollment Center Investigators and the All of Us Research Program Demonstration Projects Subcommittee . Revisiting the Latino epidemiologic paradox: an analysis of data from the All of Us Research Program. J Gen Intern Med. 2022;37(15):4013-4014. doi: 10.1007/s11606-022-07625-y [DOI] [PMC free article] [PubMed] [Google Scholar]
Associated Data
This section collects any data citations, data availability statements, or supplementary materials included in this article.
Supplementary Materials
eMethods.
eTable 1. Median Lp(a) by Baseline Characteristics From HCHS/SOL (2008-2011)
eTable 2. Median Lp(a) and Prevalence of Factors Across Quintiles From HCHS/SOL (2008-2011)
eTable 3. Lipid Values Across Lp(a) Quintiles From HCHS/SOL (2008-2011) and Excluding Statin Users From HCHS/SOL (2008-2011)
eTable 4. Median and 80th Percentile Lp(a) Values by Geographic Background Excluding Statin Users From HCHS/SOL (2008-2011)
eTable 5. Median Lp(a) Across Ancestry Quintiles From HCHS/SOL (2008-2011)
eTable 6. Median % Ancestry Across Lp(a) Quintiles Excluding Statin Users From HCHS/SOL (2008-2011)
eTable 7. Median Lp(a) and % Ancestry by Geographic Background From HCHS/SOL (2008-2011)
eTable 8. Regression Model of % Ancestry and Lp(a) by Geographic Background From HCHS/SOL (2008-2011)
eReferences
Data Sharing Statement