

Abstract
The endoplasmic reticulum (ER) forms a dynamic network that contacts other cellular membranes to regulate stress responses, calcium signaling, and lipid transfer. Using high-resolution volume electron microscopy, we find that the ER forms a previously unknown association with keratin intermediate filaments and desmosomal cell-cell junctions. Peripheral ER assembles into mirror image-like arrangements at desmosomes and exhibits nanometer proximity to keratin filaments and the desmosome cytoplasmic plaque. ER tubules exhibit stable associations with desmosomes, and perturbation of desmosomes or keratin filaments alters ER organization, mobility, and expression of ER stress transcripts. These findings indicate that desmosomes and the keratin cytoskeleton regulate the distribution, function, and dynamics of the ER network. Overall, this study reveals a previously unknown subcellular architecture defined by the structural integration of ER tubules with an epithelial intercellular junction.
One-Sentence Summary:
The desmosome adhesive junction regulates the organization and dynamics of the endoplasmic reticulum network.
The endoplasmic reticulum (ER) is the largest and perhaps most architecturally complex membranous organelle in eukaryotic cells (1). The ER participates in protein biosynthesis and turnover, organelle biogenesis, the transfer of lipids between membranous compartments, and regulation of calcium homeostasis (2, 3). These functions are often conducted at membrane contact sites between the ER and other organelles including endosomes, mitochondria, and the plasma membrane (PM) (1, 2). For these reasons, it is of particular interest to understand how the spatiotemporal behavior of ER membranes is regulated. The morphology and dynamics of the ER have been studied predominantly in individual mammalian cells, including fibroblasts and COS-7 (4, 5). However, little is known about how ER tubule organization and dynamics are coordinated between cells that form extensive cell-cell contacts.
Using cryo-fixation approaches to preserve near-native cell structure, in combination with high-resolution volume electron microscopy (6), we find that desmosomes, an adhesive cell-cell junction coupled to intermediate filament networks, organize the subcellular distribution and dynamics of ER tubules. Peripheral ER tubules follow keratin filament bundles to desmosomes where they are stabilized in mirror image-like arrangements at opposing cell-cell contacts. Disruption of desmosomes or expression of disease-causing keratin mutants alters ER morphology, dynamics, and stress responses. These findings reveal the architecture of a complex at intercellular contacts comprising desmosomes, intermediate filaments, and the ER. The identification of a role for desmosomes in regulating ER morphology, dynamics, and stress signaling provides insights into both fundamental organelle biology and into human disease states resulting from desmosome or keratin dysfunction.
Results
The endoplasmic reticulum associates with desmosomes
To assess the organization of ER in epithelial cells, we used A431 cell lines expressing desmoplakin (DP)-EGFP to visualize desmosomal cell-cell junctions (7) and stably transduced these cells with mApple-VAPB to visualize ER (8, 9). Confocal microscopy revealed that peripheral ER tubules associated with desmoplakin puncta on both sides of desmosomal cell-cell contacts (Extended Data Fig. 1A). Similar results were obtained using immortalized HaCaT keratinocytes and primary normal human epidermal keratinocytes (Extended Data Fig. 1B–C). Transmission electron microscopy of parental A431 cells lacking exogenously expressed VAPB and desmoplakin revealed that peripheral ER tubules extend toward the electron-dense desmosome plaque, often exhibiting a paired configuration on either side of the desmosomal junction. ER-desmosome associations were also readily visible in multiple epithelial tissues, including rat skin and colon (Extended Data Fig. 2).
We determined the nanoscale three-dimensional architecture of ER-desmosome associations using a cryo-structured illumination microscopy (Cryo-SIM) and focused ion beam scanning electron microscopy (FIB-SEM) workflow (6) (Supplementary Figure 1). The cytoplasmic zone of the desmosome comprises an electron-dense outer plaque subjacent to the plasma membrane and a less electron-dense inner plaque that functions as an attachment zone for keratin intermediate filaments (10, 11). Two-dimensional views and three-dimensional reconstructions of FIB-SEM datasets revealed that peripheral ER tubules were situated close to desmosomal plaques (Fig. 1; Supplementary Video 1). ER tubules and keratin filaments were arranged as paired structures on both sides of the desmosomal cell-cell junction (Fig. 1E–P). ER tubules were also present in the space between the keratin filament attachment zone (inner dense plaque) and the outer dense plaque of the desmosome (Extended Data Fig. 3 and Supplementary Video 2). ER tubules adjacent to desmosomes had fewer bound ribosomes relative to ER membranes further away from desmosomes (Extended Data Fig. 4). From a total of 33 desmosomes across the FIB-SEM datasets, ER tubules were found to be within 250nm of the outer dense plaques of 94% of desmosomes (n=31/33). At canonical ER-PM contact distances of 30nm, 42% of desmosome outer dense plaques (n=14/33) showed a presence of ER tubules. In 24% of desmosomes (n=8/33), ER tubules were found to be in physical contact with the outer dense plaque. These data indicate that peripheral ER tubules are a previously unrecognized component of the desmosomal adhesive complex.
Fig. 1. FIB-SEM reveals ER-desmosome associations.
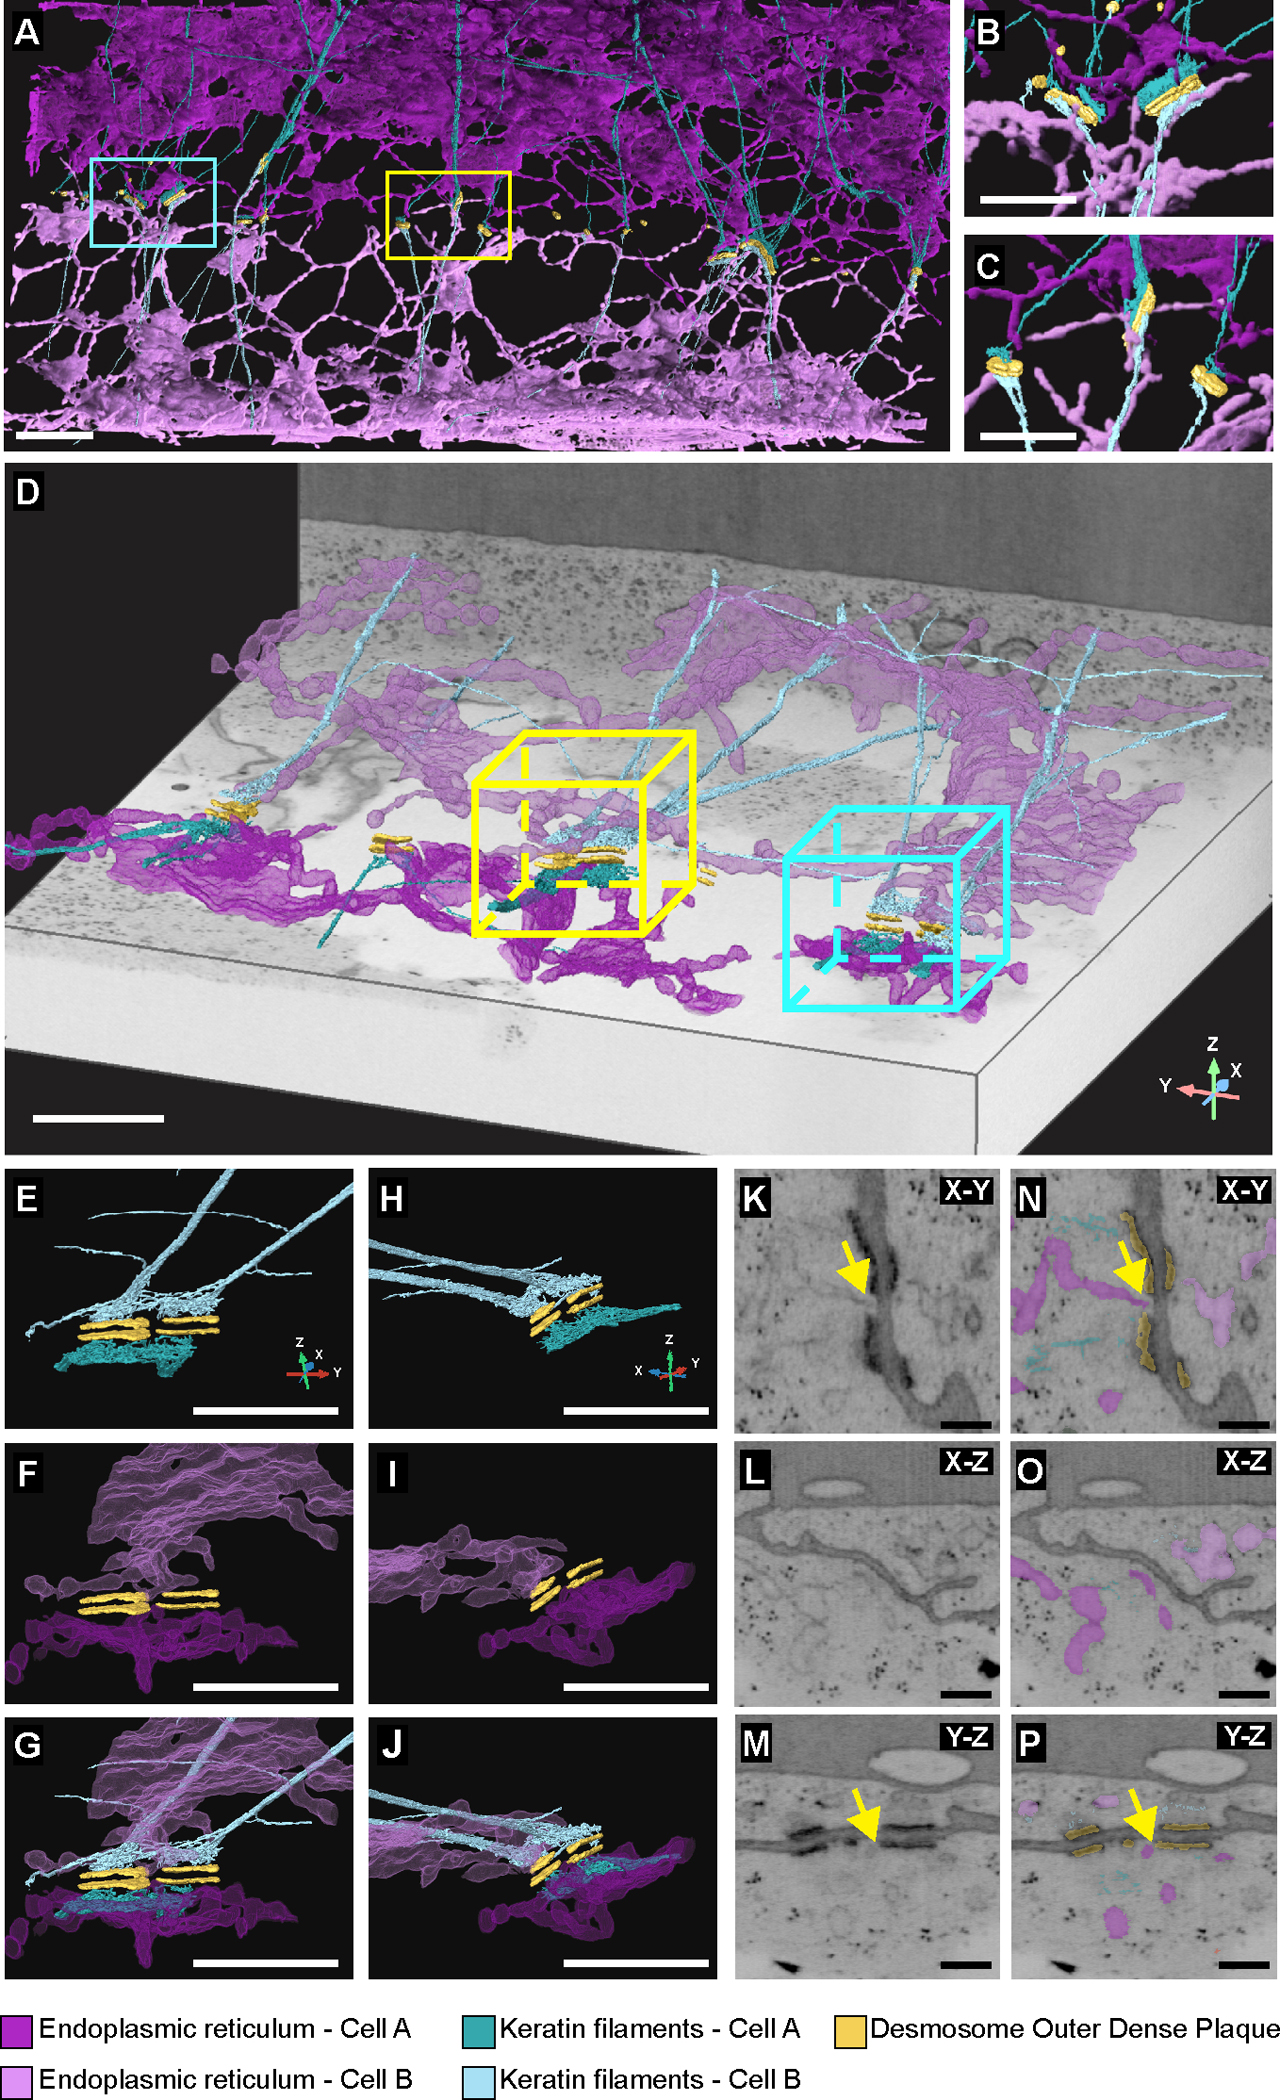
(A-C) FIB-SEM segmentations of a cell-cell contact in A431 cells acquired at 8nm isotropic voxel size showing desmosome outer dense plaques (yellow), keratin filaments (teal) and ER (magenta) (n=1 cell-cell contact at 8nm isotropic resolution). Different shades of teal and magenta distinguish keratin and ER in adjacent cells. Cyan and yellow boxes indicate regions with magnified views shown in insets B and C, respectively. Scale bar = 2μm (A), 1μm (B, C). (D) FIB-SEM segmentations of a cell-cell contact in A431 cells acquired at 4nm isotropic voxel size (n=1 cell-cell contact at 4nm isotropic resolution). Cyan box indicates region with magnified segmentations shown in E-J. Yellow box is magnified in Fig. 2. Scale bar = 1μm. (E-J) Rotated views of a desmosome outer dense plaque (yellow) showing mirror image-like organization of teal keratin filaments (E, H) and magenta ER (F, I). Panels G and J show rotated views of desmosome outer dense plaque, keratin filaments and ER. Scale bar = 1μm. (K-P) Orthoslices in XY (K, N), XZ (L, O), and YZ (M, P) without or with desmosome, ER, and keratin segmentations. Yellow arrows point to ER tubules proximal to desmosome outer dense plaque. Scale bar = 250nm.
The endoplasmic reticulum associates with keratin filaments
Since peripheral ER tubules were observed on either side of the desmosome, we investigated ER tubule localization relative to keratin filament bundles proximal (defined hereafter as ≤250nm) and distal (defined as >1000nm) to desmosomal cell-cell contacts. FIB-SEM datasets at 4×4×4nm3 voxel size revealed that peripheral ER tubules intertwined around keratin filaments that approached the desmosome plaque (Fig. 2A, B). In addition to frequent ER-keratin contacts, keratin filament bundles were often fully enveloped by ER membrane (Fig. 2C–H and Supplementary Video 3). Keratin filaments made similar contacts with sheet-like/planar ER structures located distal to cell borders (Extended Data Fig. 4C–H; Supplementary Video 3). These observations demonstrate an intimate physical association between the ER membrane and the intermediate filament cytoskeleton.
Fig. 2. FIB-SEM reveals ER-keratin filament associations in A431 cells.
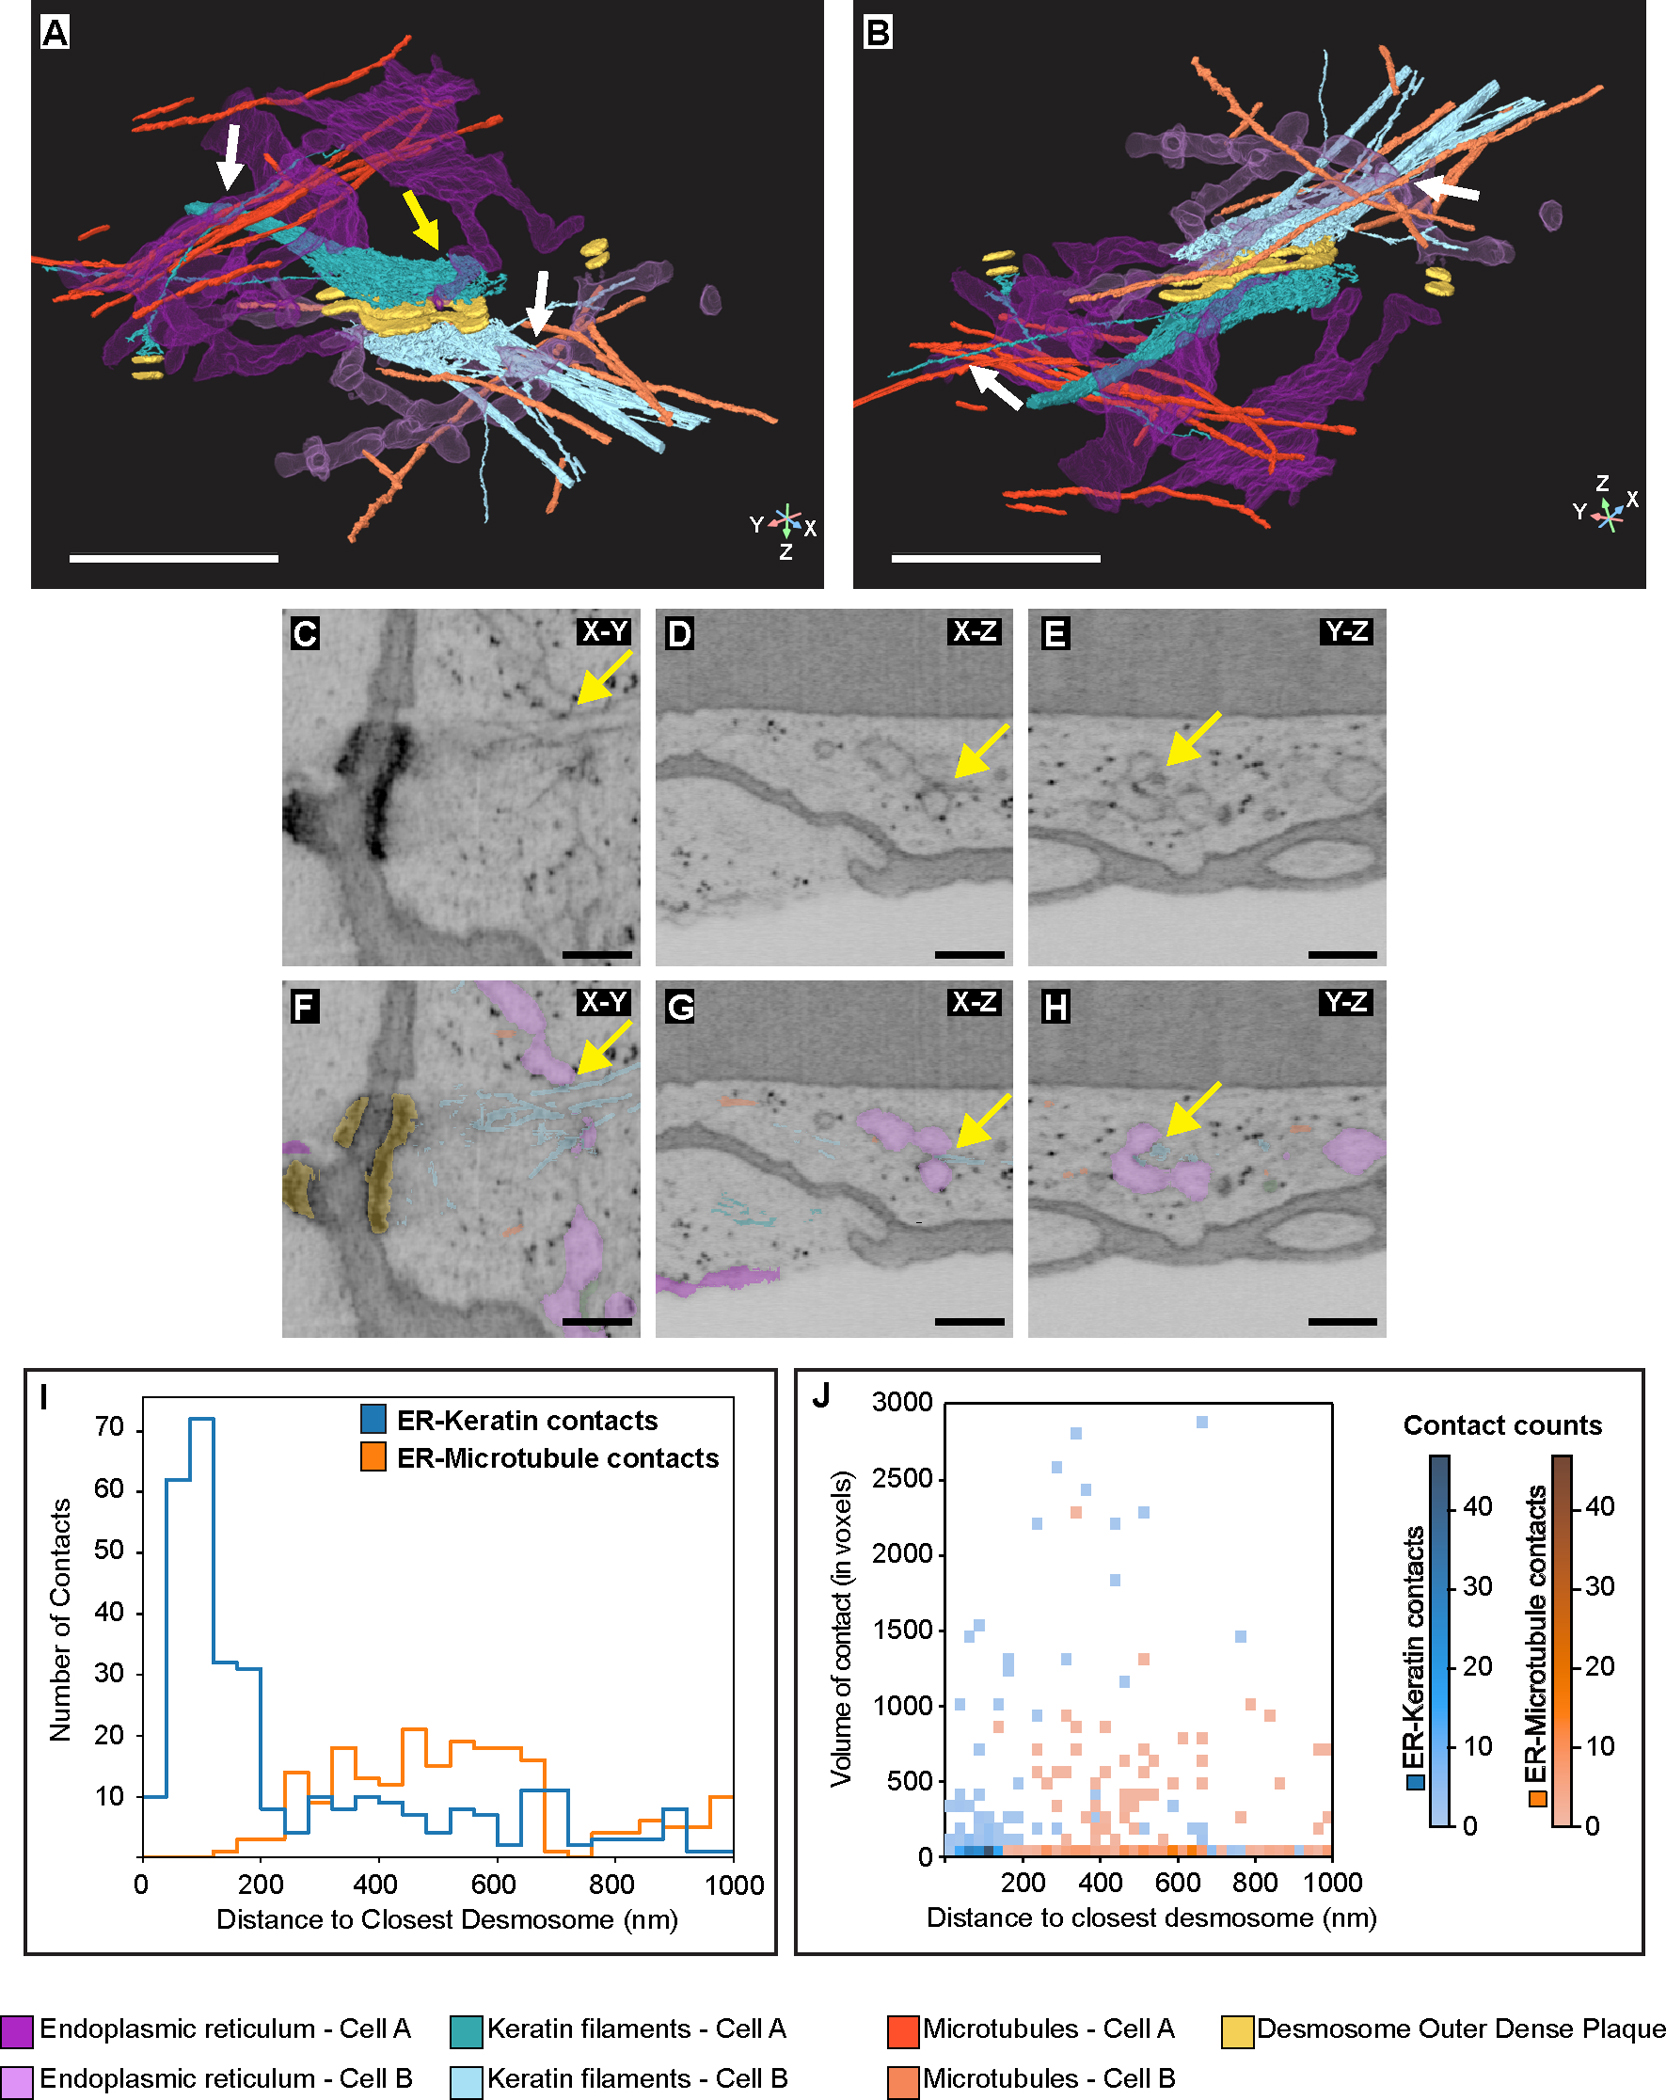
(A-B) Rotated views of the yellow box in Fig. 1D showing ER tubules (magenta) making contact with keratin filaments (teal) (white arrows) and with the desmosome plaque (yellow arrows). Microtubules (orange) are also shown. Scale bar = 1μm. (C-E) Orthoslices showing ER tubules making contact with electron-dense keratin filaments (yellow arrows). Scale bar = 250nm. (F-H) Same orthoslices as in E-G with ER, keratin, and microtubules segmentations. Scale bar = 250nm. (I) Histogram depicting the frequency of ER-keratin (blue line) and ER-microtubule (orange line) contacts to the nearest desmosome using a contact distance threshold of 16nm. (J) Histogram depicting the voxel sizes of ER-keratin (blue) and ER-microtubule (orange) contacts at x nm away from the closest desmosome, using a contact distance threshold of 16nm. Data in I and J represent measurements from n=33 desmosomes at two cell-cell contacts. Colorbars on the right illustrate the number of contacts of a specific size and at a specific distance from the closest desmosome. Source numerical data are available in source data.
Microtubule interactions with ER tubules have been studied extensively (12, 13). To compare ER-keratin and ER-microtubule interactions, we quantified the number and size of these contacts, defining “contact” as a maximum distance of 16nm between a voxel of ER and a voxel of keratin or microtubules (Extended Data Fig. 5). Within 1000nm of a desmosome, the ER made n=327 contacts with keratin filaments and n=215 contacts with microtubules (Fig. 2I). Within 250nm, we observed substantially more ER-keratin contacts (n=217) than ER-microtubule contacts (n=9). Interestingly, this preference was reversed at distances >1000nm from a desmosome, with ER membranes making more contacts with microtubules than with keratin filaments (Extended Data Fig. 5G). Further, ER membranes made larger contacts with keratin filaments than with microtubules (Fig. 2J). These findings indicate that ER associates with both keratin filaments and microtubules, but the frequency of contact with these cytoskeletal networks differs throughout the cell.
We next sought to determine if ER tubules, like keratin filaments, are present in mirror image-like arrangements at desmosomal junctions. We analyzed the distance between desmosomes and the closest voxel of ER membrane across two adjacent cells in the 4×4×4nm3 and 8×8×8nm3 FIB-SEM datasets, using microtubules and endosomes for comparison (Fig. 3A–D; Supplementary Video 4). We restricted our analysis to within 250nm on either side of desmosomes that displayed radial keratin filament bundles on both cytoplasmic faces. ER membrane pairs were present across ~89% (n=16/18) of desmosomes (Fig. 3E, F). In contrast, endosome pairs were present across ~22% (n=4/18) of desmosomes. Reliable identification and segmentation of microtubules was only possible in the 4×4×4nm3 data set, where we found no microtubule pairs within 250nm of any desmosome. These data demonstrate a symmetry in desmosome organization defined by the presence of both keratin filaments and ER tubules at desmosomal cell-cell contacts.
Fig. 3. Analysis of FIB-SEM data reveals a symmetrical organization of ER and keratin filaments proximal to desmosomes.

(A-D) Rotated views of 3D reconstructions of the 4×4×4nm3 dataset with either microtubules (orange) or endosomes (green) in addition to desmosomes (yellow), ER (magenta), and keratin (teal). Scale bar = 1μm. (E) Scatterplots representing the 4×4×4nm3 dataset showing the distance from individual desmosomes to the closest organelles in each cell (n=6 desmosomes at one cell-cell contact). (F) Scatterplots representing the 8×8×8nm3 dataset showing the distance from individual desmosomes to the closest organelles in each cell (n=27 desmosomes at one cell-cell contact). The marker size is proportional to desmosome volume, with color and shape showing whether a desmosome has radial keratins on both cytoplasmic faces (gray triangles), radial keratin on only one face, (blue square), or no radial keratin on either face (green circles). Bottom row shows a magnification of the plots in the top row. Source numerical data are available in source data.
Peripheral ER tubules stably anchor to desmosomes
ER association with various organelles influences ER tubule mobility (5, 14). To determine if desmosomes influence ER dynamics, we used spinning disk confocal microscopy of living A431 cell lines stably expressing desmoplakin-EGFP and mApple-VAPB. ER tubules were present at the cell periphery and closely associated with virtually all desmosomes (Fig. 4A; Supplementary Video 5). Kymographs revealed that these ER-desmosome associations were highly stable (Fig. 4B). Approximately 73% of desmosomes (n=113/154) colocalized with ER tubules for the entirety of a 2-minute time course, while the remaining ~27% of desmosomes (n=41/154) showed frequent but transient interactions with ER tubules (Fig. 4C; Extended Data Fig. 6).
Fig. 4. Desmosomes anchor ER tubules and stabilize ER membrane.

(A) Snapshot of a pair of A431 cells expressing Desmoplakin-EGFP (orange, desmosome marker) and mApple-VAPB (magenta, ER marker) showing ER tubules anchored on either side of desmoplakin puncta. Dashed white line indicates cell-cell border. Solid yellow line indicates position of kymograph in B (Images are representative of n=534 fields from three independent experiments). Scale bar = 1μm. (B) Kymograph of yellow line in A revealing stable ER-DP colocalization over a 2-minute time course. Scale bar = 500nm. (C) Histogram shows percentage of DP puncta that colocalize with ER for t timepoints over a 25 timepoint duration (n=154 puncta in 34 fields from three independent experiments). (D-E) Yellow boxes highlight representative regions analyzed by Membrane Displacement Analysis (MDA). Scale bar = 2μm. (D’-D’’’) ER (magenta), MDA-generated ER movement (green), ER at desmosomes (orange). White arrowheads in D’’ depict location of DP puncta. (E’-E’’) ER (magenta), MDA-generated ER movement (green) at non-desmosomal regions. Bright green pixels in D’’ and E’’ depict ER fraction that is mobile between time points. Note more bright green pixels in E’’ vs. D’’, indicating more mobile ER. Scale bar = 500nm (D, E). (F) Violin plot depicting fraction of mobile ER in desmosomal (n=229 ROIs in 34 fields) vs. non-desmosomal (cytoplasmic) (n=229 ROIs in 34 fields) regions. Exact P values are provided for each comparison (two-tailed Mann-Whitney test; n=3 independent experiments). Horizontal solid black lines in violin plots represent medians and dashed lines represent first (lower) and third (upper) quartiles. Dots are color-coded by replicate. Source numerical data are available in source data.
To assess further how ER membrane mobility is impacted by desmosome associations, we used a Membrane Displacement Analysis (MDA) macro in Fiji (14) to classify ER membrane into static and mobile fractions. If the ER membrane moved >2 pixels (>130nm) between timepoints, we classified it as mobile ER. We drew regions of interest (ROIs) that either encompassed ER tubules anchored to desmosomes (Desmosomal ER) (Fig. 4D) or ER tubules further away from cell-cell contacts (Non-desmosomal ER) (Fig. 4E). Membrane displacement analysis revealed that about 66% of ER membrane present at desmosomes was stable, whereas only 39% of non-desmosomal ER was stable (Fig. 4D–F). These results indicate that ER tubules associated with desmosomes are immobile relative to non-desmosomal ER tubules.
Microtubule depolymerization causes ER tubule collapse into sheets and ER retraction from the cell periphery (13). To determine if ER anchorage to desmosomes is affected by depolymerizing the microtubule cytoskeleton, we labelled microtubules in DP-EGFP/mApple-VAPB A431 cells with Tubulin Tracker Deep Red and imaged living cells treated with either DMSO or the microtubule-depolymerizing agent, nocodazole (30μM). As microtubules depolymerized, peripheral ER tubules collapsed into a sheet-like morphology both at cell-cell borders (Fig. 5A–E) and at cell edges not contacting adjacent cells (cell-free edges) (Fig. 5F–J). In DMSO-treated cells, peripheral ER remained tubular and did not retract from the cell-free edges (Extended Data Fig. 7A). In nocodazole-treated cells, ER remained anchored to desmosomes (blue arrows, Fig. 5D, E; Extended Data Fig. 7B) but retracted from both cell-free edges (Fig. 5G–J; Extended Data Fig. 7D; Supplementary Video 6) and from regions of cell-cell borders lacking desmosomes (yellow arrows, Fig. 5D, E; Extended Data Fig. 7B). Together with the data shown above (Fig. 4), these observations indicate that desmosomes function as peripheral ER-tethering sites.
Fig. 5. ER remains anchored to desmosomal junctions but retracts from cell-free edges when microtubules are depolymerized.

(A-E) Time course at cell-cell border of a pair of A431 cells expressing mApple-VAPB (ER marker, magenta) and DP-EGFP (desmosome marker, orange) treated with 30μM nocodazole (Images are representative of n=3 independent experiments). Microtubules are labelled with Tubulin Tracker Deep Red (white). Microtubules are seen near desmosomes and ER tubules (red arrows) (A). As microtubules depolymerize, peripheral tubular ER becomes more sheet-like and remains tethered to desmosomes (D, E, blue arrows), but retracts from desmosome-free regions (D, E, yellow arrows). Scale bar = 2μm. (F-J) Time course at cell-free edge of an A431 cell expressing mApple-VAPB and DP-EGFP treated with 30μM nocodazole (Images are representative of n=3 independent experiments; some time lapses of cell-free edges are in the same field of view as time lapses of cell-cell borders). Peripheral ER is extended towards the cell-free edge when microtubules are present (F). As microtubules depolymerize, ER sheets retract from the cell-free edge (H-J). Timestamps indicate duration after addition of nocodazole. Cell-free edge is depicted by a dashed red or white line in F-J. Gamma correction was applied to some grayscale images. Gamma (inverted) = 0.75 (A-E, VAPB channel), 1.75 (F-J, DP channel). Scale bar = 2μm.
ER tubules associate with remodeling desmosomes
We assessed ER-desmosome interactions as desmosomes underwent remodeling events, such as desmosomal fusion and desmosome assembly (7, 15). ER tubules remained in close association with desmosomes undergoing fusion (Extended Data Fig. 8A–F). Further analysis revealed that the tip of ER tubules always tracked with at least one of the desmoplakin puncta prior to fusion (n=67 fusion events analyzed) (Extended Data Fig. 8G–L) and remained associated with newly fused desmosomes (Extended Data Fig. 8G–L, bottom row). These ER-desmoplakin interactions persisted during successive fusion events (Supplementary Video 7). These findings indicate that ER tubules associate with desmosomes under steady-state conditions and during desmosome remodeling events.
To determine the spatiotemporal behavior of ER and desmosomes during de novo cell-cell contact formation, we grew cells in low calcium (~30μM) culture conditions for 18–24h to prevent desmosome formation. The calcium concentration was then raised to physiological levels (1.8–2.7 mM) to initiate formation of cell-cell contact (16). Immediately following the switch to normal calcium levels, we performed live-cell time-lapse imaging to track ER tubules as desmosome puncta form at cell-cell contacts. We observed that ER tubules extend towards the cell periphery a few minutes after cells initiate contact (Fig. 6A–E; Supplementary Figure 2). When two adjacent cells came into contact, peripheral ER tubules formed mirror image-like structures at contacts and no longer retracted from the periphery (n=12 pairs of contacting cells) (Fig. 6B; Supplementary Video 8). Additional examples are shown in Supplementary Figure 2 using fluorescently tagged wheat germ agglutinin to highlight cell membranes. In all 12 instances where we visualized new cell-cell contact formation, nascent desmoplakin puncta became visible precisely where ER tubules had formed paired structures (Fig. 6C, D). As cell contacts matured, additional ER mirror image-like arrangements emerged and immobilized at sites of newly forming desmosome puncta (Fig. 6E).
Fig. 6. ER tubules associate with desmosomes and keratin filaments during assembly.

(A-E) Snapshots of a live-cell time-course of desmoplakin (orange) and VAPB (magenta) in A431 cells as they form cell-cell contacts (Images are representative of n=12 pairs of contacting cells from a total of three independent experiments). ER tubules first extend in both cells (A, red arrow), followed by formation of an ER mirror image at the cell-cell contact (B, black arrow). Desmoplakin puncta appear at the exact position of an ER mirror image (C, D, blue arrows). Eventually, more desmoplakin puncta appear and ER mirror images form as contacts mature (E). Gamma correction was applied to grayscale images. Gamma (inverted) = 1.25 (DP), 1.5 (VAPB). Scale bar = 2μm. (F-J) Snapshots of a live-cell time-course of keratin filaments (blue) and VAPB (magenta) in A431 cells as they form cell-cell contacts (Images are representative of n=12 pairs of contacting cells from a total of five independent experiments). ER tubules sometimes extend alone (F, red arrowhead). ER tubules and keratin filaments extend toward cell-cell contacts simultaneously over several minutes (G, H, blue arrows). Keratin filaments and ER tubules form mirror images as contacts mature (I, J, black arrows). Scale bar = 2μm.
We also monitored keratin filament and ER tubule dynamics following a calcium switch using A431 cells stably expressing fluorescently tagged keratin-14 (mNeonGreen-KRT14) and mApple-VAPB. Following addition of calcium, peripheral ER tubules extend to and retract from the cell edge without any keratin filaments (Fig. 6F). Eventually, ER tubules and keratin filaments extended and retracted simultaneously (n=38/40 cells initiating contact) and in close spatial proximity (Supplementary Video 9). These ER-keratin associations persisted for several minutes (Fig. 6G, H). As the cells come into contact, both ER tubules and keratin filaments form stable mirror image-like structures on either side of the cell-cell contact (Fig. 6I, J). Collectively, these experiments indicate that desmoplakin puncta formation and keratin filament assembly are initiated at sites of ER tubule extensions at nascent epithelial cell-cell contacts.
A role for ER in desmosome assembly is suggested by autosomal dominant mutations in the ER-resident calcium pump, sarco/endoplasmic reticulum Ca2+-ATPase 2 (SERCA2). Mutations in SERCA2 cause Darier’s disease (DD), a skin disorder characterized by loss of desmosomal adhesion (17). Inhibition of SERCA2 function with thapsigargin impairs desmoplakin localization to cell-cell borders in cultured cells (18). Therefore, we used thapsigargin to determine if SERCA2 function is required for peripheral ER recruitment to nascent cell-cell contacts. We treated A431 cells expressing DP-EGFP and mApple-VAPB cultured in low calcium medium with either DMSO or 1μM thapsigargin for 30 minutes, followed by a switch to high calcium (~2.7mM) media (n=3 independent experiments). Similar to Fig. 6A–E, junctional desmoplakin puncta appeared following formation of ER tubule pairs at 100% (n=25/25) of cell-cell borders of DMSO-treated cells (Extended Data Fig. 9A–E). However, in thapsigargin-treated cells, desmoplakin puncta appeared at only 44.8% (n=13/29) of cell-cell borders. In those instances where no desmoplakin puncta appeared in thapsigargin-treated cells, ER tubules still extended toward the cell periphery (Extended Data Fig. 9F–J). These data indicate that ER tubule recruitment to nascent contacts precedes desmosome formation and suggest that ER tubule regulation of local calcium levels is required for desmosome assembly to proceed.
Desmosomes and Keratin regulate peripheral ER
To determine if desmosomes impact ER organization, we assessed ER and keratin distribution in wild type A431 cells and in A431 cells in which the desmosomal cadherin desmoglein-2 (DSG2) gene was ablated using CRISPR/Cas9. These DSG2-null cells exhibit aberrant localization of desmosomal proteins and weakened cell-cell adhesion strength, while still forming adherens junctions (19). We stably expressed mNeonGreen-KRT14 and mApple-VAPB in WT and DSG2-null cells and imaged these cells using spinning disk confocal microscopy. In WT cells, keratin filaments extended radially toward desmosomal junctions. These radial keratin filaments terminated at cell borders where they anchored to desmosomes (Fig. 7A; Supplementary Video 10, top row). Peripheral ER tubules exhibited similar organization in these cells, running parallel to the keratin filaments with both structures forming paired structures at cell-cell contacts (Fig. 7A, yellow arrows). In contrast, DSG2-null cells exhibited few radial keratin bundles. Instead, keratins in DSG2-null cells ran parallel to the plasma membrane in a subcortical localization (Fig. 7A; Supplementary Video 10, bottom row). Similarly, peripheral ER tubules were organized parallel to rather than orthogonally to cell-cell contacts (Fig. 7A, red arrows). These data indicate that loss of desmosomes alters peripheral ER organization.
Fig. 7. Desmosomes and keratin regulate peripheral ER organization and ER membrane stability.

(A) A431 WT cells (top row) or Desmoglein-2 knockout cells (bottom row) expressing mNeonGreen-KRT14 (first column, keratin marker) and mApple-VAPB (middle column, ER marker) (Images are representative of n=3 independent experiments). Wheat Germ Agglutinin (WGA) labels the plasma membrane (PM). Yellow arrows show radial keratin filaments and associated VAPB tubules orthogonal to the PM in WT cells. Red arrows show keratin filaments and ER tubules parallel to the PM in DSG2-null cells. Gamma correction was applied to grayscale images. Gamma (inverted) = 1.5 (KRT14 and VAPB channels). Scale bar = 4μm. (B) Representative light microscopy images of KRT14 (blue) and VAPB (magenta) in A431 WT and DSG2-null cells with regions analyzed by MDA in C (pink box), D (blue box), and E (yellow box) (Images are representative of n=3 independent experiments). Scale bar = 2μm. (C) ER (magenta), MDA-generated ER movement (green), ER at radial keratin filaments (merge) in WT cells. (D) ER (magenta), MDA-generated ER movement (green), ER at non-radial keratin filaments (merge) in WT cells. (E) ER (magenta), MDA-generated ER movement (green), ER at keratin filaments (merge) in DSG2-null cells. Bright green pixels depict ER fraction that is mobile between time points. Scale bar = 500nm (C-E). (F) Violin plot depicting fraction of mobile ER along radial keratin in WT cells (n=125 ROIs), non-radial keratin in WT cells (n=125 ROIs in 25 fields), and keratin filaments in DSG2-null cells (n=178 ROIs in 28 fields). Exact P values are provided for each comparison (two-tailed Mann-Whitney test; n=3 independent experiments). Horizontal solid black lines in violin plots represent medians and dashed lines represent first (lower) and third (upper) quartiles. Dots are color-coded by replicate. Source numerical data are available in source data.
We also assessed the influence of desmosomes on ER dynamics. Membrane displacement analysis was used to determine ER membrane mobility at: 1) ER tubules along radial keratin filaments in WT cells, 2) ER tubules not associated with radial filaments in WT cells, and 3) ER tubules located along keratin filaments in DSG2-null cells (Fig. 7B–E). Analysis revealed that 52% of ER membrane was stable along radial keratin filaments running to desmosomes, whereas only 42% of ER associated with non-radial keratin filaments was stable. These differences were even more stark when assessing ER mobility in DSG2-null cells, with only 36% of keratin filament-associated ER membrane being stable (Fig. 7F). Together, these results indicate that an association between ER tubules and radial keratin filament bundles suppresses ER tubule dynamics. The stabilization of ER tubules along radial keratin filament bundles explains the persistence of ER tubule positioning in mirror image-like arrangements at desmosomal cell-cell junctions.
Keratin and desmosomes regulate ER morphology and ER stress
Keratin mutations result in a wide range of human diseases, often affecting the skin and skin appendages (20). To determine if disease-causing mutations that disrupt keratin filaments also perturb ER morphology, we stably expressed a KRT14 point mutant, KRT14R125C (mNeonGreen-KRT14R125C), in A431 cells expressing mApple-VAPB. This KRT14 mutation results in the skin blistering disease epidermolysis bullosa simplex (EBS) by causing keratin filament aggregation (21). Similar to results shown in Fig. 7, KRT14WT formed radial filaments closely associated with ER tubules (Fig. 8A–D; Supplementary Video 11, top row). In cells expressing the KRT14R125C mutant, peripheral ER morphology was sheet-like or planar, especially when in contact with keratin aggregates (Fig. 8E–H). Time-lapse microscopy revealed that ER stably associated with both filamentous and aggregated keratin (Extended Data Fig. 10A–H; Supplementary Video 11, bottom row). Quantification indicated that ~75–79% of the keratin aggregates maintain contact with ER membranes over a 2-minute time course (Extended Data Fig. 10I). To verify that changes in ER morphology were not an artifact of differing levels of mApple-VAPB expression in different cells, we plated a mixture of KRT14WT and KRT14 R125C-expressing A431 cells (1:1 ratio) onto slides and imaged mixed cell clusters that had similar fluorescence intensities of mApple-VAPB. Again, peripheral ER domains appeared more sheet-like in the KRT14R125C- expressing A431 cells (Fig. 8I–K; Supplementary Video 12). These results indicate that a keratin mutation that causes an inherited epidermal blistering disease alters ER membrane morphology.
Fig. 8. Keratin aggregation perturbs ER membrane morphology and alterations in keratin or desmosome function cause ER stress.

(A-D) Light microscopy of KRT14WT, VAPB, and plasma membrane in A431 cells showing ER with tubular morphology (Images are representative of n=3 independent experiments). Scale bar = 4μm. (E-H) A431 expressing KRT14R125C aggregates showing ER with sheet-like morphology. PM is labelled with Wheat Germ Agglutinin (WGA) conjugated with a fluorescent dye (Images are representative of n=3 independent experiments). Scale bar = 4μm. (I-K) A431 cells expressing KRT14WT (top and left cells) or KRT14R125C (bottom right cell) showing tubular ER in KRT14WT-expressing cells and sheet-like ER membrane in KRT14R125C-expressing cells (Images are representative of n=3 independent experiments). Red dashed lines indicate PM. Gamma correction was applied to grayscale images. Gamma (inverted) = 1.5 (B, C, F, G, K). Scale bar = 4μm. (L) Fold change in mRNA expression levels of DDIT3, XBP1s, ATF3, and HSPA5 between A431 cells expressing KRT14WT or KRT14R125C. Data are presented as mean values ± s.e.m. Exact P values are provided for each comparison when statistically significant (two-tailed t-test; n=3 independent experiments). (M) Fold change in mRNA expression levels of DDIT3, XBP1s, ATF3, and HSPA5 between primary human keratinocytes treated with either Normal Human IgG or IgG isolated from two different pemphigus vulgaris (PV) patients to disrupt desmosomal adhesion. Data are presented as mean values ± s.e.m. Exact P values are provided for each comparison when statistically significant (two-tailed t-test; n=3 independent experiments). Source numerical data are available in source data.
Transfection of HaCaT keratinocytes with the KRT14R125C mutant has been shown to upregulate ER stress markers phospho-c-Jun and BiP (HSPA5) (22). Therefore, we examined KRT14WT- or KRT14R125C-expressing A431 cells for changes in mRNA transcripts of multiple ER stress genes including DDIT3 (also known as CHOP), XBP1s (spliced isoform of XBP1), ATF3, and HSPA5 (also known as BiP or GRP78). A qRT-PCR analysis of RNA isolated from these cells revealed no significant differences in expression levels of DDIT3, XBP1s, and HSPA5. However, there was a significant upregulation of ATF3 in KRT14R125C-expressing cells (Fig. 8L). To determine if disruption of desmosomes also induces expression of ER stress transcripts, primary human keratinocytes were treated with autoantibodies (IgG) isolated from plasma of pemphigus vulgaris (PV) patients. In this disorder, patients generate function-blocking autoantibodies directed against the desmosomal cadherin desmoglein-3 (23). These autoantibodies cause desmosome disruption, keratin filament retraction, and loss of adhesion strength (24, 25). Pemphigus patient IgG induced upregulation of XBP1s, HSPA5, and ATF3 expression compared to cells treated with normal human IgG (Fig. 8M). Together, these results indicate that perturbation of keratin organization or desmosome function is coupled to the upregulation of transcripts associated with ER stress responses.
Discussion
Our data reveal a previously unknown tripartite complex comprising desmosomes, keratin intermediate filaments, and peripheral ER tubules. We report that desmosomes regulate peripheral ER morphology by organizing radial keratin filament bundles that position ER tubules orthogonally to the plasma membranes of adjacent cells. These ER tubules exhibit frequent interactions with both keratin filament bundles and the substructure of the desmosome cytoplasmic plaque. This architectural arrangement, along with the characteristic mirror image organization of desmosomes, shapes the morphology and dynamic behavior of peripheral ER membranes at regions of epithelial cell-cell contact.
The ER makes close (<30nm) contacts with the plasma membrane (PM) that function as sites of lipid exchange and calcium homeostasis (1). Epithelial cells assemble an extensive array of intercellular contacts that could influence or be regulated by ER-PM associations. A serial electron microcopy study of hepatocytes and epithelial spheroids found extensive ER-PM contacts at lateral PM domains, a few microns from tight junctions (26). Another recent study suggested an association between ER and adherens junctions (27). Further, the ER is associated with highly specialized complexes between Sertoli cells and developing spermatids where it is thought to regulate calcium signaling and junction remodeling (28). We find that stable ER-desmosome associations occur at mature desmosomes, during desmosome fusion, and during initial stages of desmosome formation. When cell-cell contact is initiated, ER tubules extend to the cell periphery and desmoplakin puncta appear to coalesce de novo at the tips of ER tubular extensions. Thus, the ER appears to pattern specific plasma membrane regions for nascent desmosome formation, and reciprocally, newly forming desmosomes function as anchorage points that stabilize peripheral ER tubules. Additional studies will be needed to delineate the temporal hierarchy of ER recruitment to nascent cell-cell contacts in relation to other intercellular junctions and their associated cytoskeletal networks.
High-resolution FIB-SEM (resulting in 4nm and 8nm isotropic voxels) revealed that the ER membrane lies proximal to the desmosome plaque, often within distances observed at canonical ER-PM contacts (Fig. 1; Fig. 2; Supplementary Videos 1–3). In several instances, we observed ER tubules in physical contact with both the inner and outer dense plaque of the desmosome. In some desmosomes, tubules even penetrate the space between these electron dense structures (Extended Data Fig. 3). These observations strongly suggest molecular associations between proteins resident on the ER membrane and within the desmosomal substructure. This notion is supported further by optical imaging of living cells. ER tubules associated with desmosomes exhibit reduced mobility compared to non-desmosomal ER (Fig. 4). Knock out of the desmosomal cadherin DSG2 reduced desmosome formation and increased peripheral ER membrane mobility (Fig. 7). These observations indicate that desmosomes control both the organization and dynamics of peripheral ER membranes.
Three-dimensional reconstructions of FIB-SEM datasets also revealed interactions between ER tubules and keratin filaments running orthogonally toward desmosomal junctions (Fig. 2). ER membrane frequently surrounded keratin filament bundles (Fig. 2A, B). Consequently, ER tubules and keratin filaments displayed a coordinated spatial and temporal relationship in live cell systems. During cell-cell contact formation, keratin filaments extend along ER tubular extensions, resulting in a stabilized mirror image-like arrangement of tubules and keratin filaments terminating at sites of desmosome maturation (Fig. 6F–J; Fig. 7). Desmoglein-null cells exhibit a loss of keratin bundles extending out to the cell periphery and a loss of orthogonally organized ER at cell-cell contacts (Fig. 7). Likewise, keratin filament aggregation caused a dramatic reorganization of ER membranes (Fig. 8). In cells expressing wild type KRT14, peripheral ER was predominantly tubular. In contrast, expression of an EBS-causing K14 mutant that results in keratin aggregation reduced tubular ER in favor of planar ER membrane morphology. These findings indicate that desmosomes function to anchor keratin filament bundles which in turn act as filamentous guides that stabilize ER tubules into mirror image-like arrangements at epithelial cell-cell junctions. Disruption of either desmosomal or keratin organization profoundly impacts both ER dynamics and morphology.
The identification of an ER-desmosome complex provides a foundation for new ways to conceive of cellular stress signaling mechanisms. Cell stress signaling is a central function of the ER (29), and intermediate filaments provide cells and tissues with resistance to mechanical and chemical stresses (20, 30, 31). Keratin filaments interact with the nuclear envelope, an extension of the ER, and keratin 14 loss alters nuclear shape, further suggesting a link between ER-keratin associations and cell signaling (32, 33). ER stress has been implicated in epidermal fragility disorders caused by keratin mutations (34). Similarly, ER stress transcripts are increased when keratin or desmosome organization is perturbed (Fig. 8L, M). Conversely, loss-of-function mutations in the ER calcium pump SERCA2 cause desmosome defects in Darier’s disease, and pharmacological inhibition of SERCA2 in vitro prevents desmosome assembly (18, 35) (Extended Data Fig. 9). SERCA2 and the ER shaping protein reticulon-4 have recently been identified as putative desmoplakin binding partners (36), suggesting direct links between ER regulatory proteins and desmosome structural elements. These observations suggest that the ER-desmosome architecture reported here regulates desmosome assembly at nascent cell-cell contacts and mediates cellular stress signaling when desmosome or intermediate filament structure is compromised.
Methods
Approvals
Gut and skin samples were excised from Sprague Dawley rats used in the following two studies according to protocols approved by Animal Care Committees at the respective institutions: NIH/NIAAA R01 AA022460 to Joanne Weinberg et al.; Animal care protocol AUP 21–02-01 to Charlis Raineki, Brock University, Canada; RGPIN-2018–03727 to A. Wayne Vogl; Animal care protocol A20–0076 to AWV, University of British Columbia, Canada. Some experiments described in this manuscript involved the use of discarded and/ or deidentified human skin and pemphigus patient sera. These experiments were reviewed and determined to be “not human subjects research” by the institutional review board at the Pennsylvania State University Office for Research Protections (PSU IRB STUDY00021792).
Lentivirus generation
To generate a lentiviral construct expressing mApple-VAPB, the VAPB ORF (open reading frame) from mCherry-VAPB (8) was cloned into the C-terminus of mApple-C1 (37) using in vivo assembly (38). This step generates mApple-VAPB with a 15bp linker (5’-TCCGGACTCAGATCT-3’) in between the mApple and VAPB ORFs. A second round of in vivo assembly was performed to clone mApple-VAPB into the vector backbone of pLenti6-V5-DEST for lentivirus production. The remaining lentiviruses used in this study were generated by VectorBuilder. Vector IDs are specified in Supplementary Table 1 and can be used to retrieve detailed information about the vector on vectorbuilder.com. The sequences of plasmids we generated in house were confirmed by sequencing and with restriction enzyme digestion. The sequences of all plasmids obtained from VectorBuilder were validated with restriction enzyme digestion. Lentiviruses were made by co-transfection into human embryonic kidney-293FT cells with pMD2.G (encoding VSV-G) and psPAX2 (encoding Gag and Pol) and collection of culture supernatants 24‒72h after transfection. Lentivirus was concentrated either by high-speed centrifugation at 4°C for 1.5h at ~100,000g, or with the Lenti-X™ Concentrator kit (631231; Takara Bio) following the manufacturer’s protocol. The mCherry-VAPB (gift from Gerry Hammond, Plasmid #108126), mApple-C1 (gift from Michael Davidson, Plasmid #54631), pMD2.G and psPAX2 (gifts from Didier Trono, Plasmid #12259 and #12260, respectively) plasmids were obtained from Addgene. Plasmid sequences are available at (39).
Cell line generation, transfection, culture, and reagents
A431 epithelial cells and HaCaT keratinocytes were cultured in DMEM (Dulbecco’s Modified Eagle Medium) (10–013-CV; Corning) with 10% fetal bovine serum (TET Tested, S10350; R&D Systems) and 1X antibiotic-antimycotic solution (30–004-CI; Corning).
Primary Normal Human Epidermal Keratinocytes (NHEK) were isolated from neonatal foreskin as previously described (40, 41). NHEKs were cultured in KGM™ Gold Keratinocyte Growth Medium BulletKit™ (00192060; Lonza). For daily maintenance and subculturing of NHEKs, the final calcium concentration was adjusted to 50μM to prevent desmosome formation.
CRISPR/Cas9 was used to knockout DSG2 (Desmoglein-2) (DSG2 gRNA target sequence GTTACGCTTTGGATGCAAG) in A431 cells (19, 42). DP-EGFP expression in A431 cells stably expressing Tet-On Desmoplakin (DP)-EGFP was induced by culturing the cell lines in 4μg/mL Doxycycline (D3447; Sigma-Aldrich) for 18–24h (7). A431 cells were transduced with lentivirus by incubating cells with 8–10μg/mL polybrene (TR-1003-G; EMD Millipore) in cell culture media for 24–48h. Cells stably infected with lentiviruses were selected using either blasticidin (2.5–5μg/mL) (R21001; ThermoFisher Scientific) or puromycin (0.5μg/mL) (ABT-440; Boston BioProducts) or a combination of both, depending on the lentivirus used. Bulk sorting of cell lines expressing the various constructs was performed by fluorescence activated cell sorting to obtain populations with similar expression levels.
Cells were also transiently transfected with mCherry-VAPB and DP-EGFP plasmids (Extended Data Fig. 1A, B) using the Viromer RED transfection reagent (TT100302; OriGene Technologies). Briefly, cells were grown to 50% confluency. A mix of the Viromer RED transfection reagent, Viromer RED buffer, and plasmid DNA were added to the cells and incubated. Cells were then imaged 24h later. The Desmoplakin-GFP (gift from Kathleen Green, Plasmid #32227) was obtained from Addgene.
Antibodies
The following antibodies were used for western blot: 1:1000 rabbit anti-desmoplakin (A303–356A; Bethyl Laboratories), 1:1000 rabbit anti-VAPB (PA5–53023; Invitrogen) and 1:60,000 rabbit anti-GAPDH (10494–1-AP; Proteintech). Secondary antibodies used were: 1:3000 Goat Anti-Rabbit IgG (H+L) Horseradish peroxidase conjugate (170–6515; Bio-Rad).
Western blotting
Cells were grown to 90% confluence in 6-well plates and then incubated with either DMSO or 4μg/mL doxycycline 24h before harvest. When at 100% confluence, cells were rinsed 2X with cold 1X PBS+. Cells were then incubated in 2X Laemmli buffer (1610737; Bio-Rad) with β-Mercaptoethanol (M2650; Sigma-Aldrich) for 1min. on ice. Lysates were then scraped with a cell scraper and homogenized using a syringe and 25G 5/8 needle. Cell lysates were then incubated at 95°C for 5min. Proteins were then separated on a 7.5% Mini-PROTEAN TGX gel (4561025; Bio-Rad) along with a protein ladder (PI26634; Thermo Scientific) using Tris/glycine/SDS running buffer (161–0732; Bio-Rad) and run at 10mA for 7min., then 30mA for 7min., then 80mA for 10–15 min. Gels were then carefully transferred to 2X transfer buffer (161–0734; Bio-Rad) containing 20% methanol. Transfer to a nitrocellulose membrane (88018; Thermo Fisher Scientific) was performed overnight at 10V. Blocking was performed with 5% milk (in 1X PBS−Tween) for 1h. Membranes were incubated with primary antibodies (in 1XPBS−Tween) at 4°C overnight. Membranes were washed 3–6X with 1XPBS−Tween, followed by incubation in secondary antibody for 1h, followed by 3–6 washes again. When necessary, membranes were stripped with OneMinute Stripping Buffer (GM6001; GM Biosciences), followed by a 1h block. The above wash and incubation steps were then repeated for the next primary and secondary antibodies. Western blots were developed with chemiluminescence HRP substrate (RPN2106; GE Healthcare). The chemiluminescent blots were imaged with a ChemiDoc MP Imaging System (Bio-Rad). Densitometric analysis was performed using Fiji/ImageJ (v1.53t).
Levels of mApple-VAPB were quantified from lysates of DP-EGFP/mApple-VAPB A431 cells treated with either DMSO or 4μg/mL doxycycline and were found to be ~1.2X-1.5X that of endogenous VAPB (Supplementary Figure 3).
Wheat Germ Agglutinin (WGA) labelling
Cells were incubated with 2–4μg/mL WGA (29026; Biotium) in 1X HBSS+ or 1X HBSS− (for calcium switch experiments) at 37°C for 15min. Cells were then washed once with 1X HBSS+ or 1X HBSS− (for calcium switch experiments). Pre-warmed live-cell imaging media was added to the cells before imaging.
Tubulin Tracker Deep Red (TTDR) labelling and nocodazole treatment
Cells were incubated with a 1:1000 dilution of TTDR (T34076; Invitrogen) in 1X HBSS+ at 37°C for 30min. Cells were then washed once with 1X HBSS+. Pre-warmed live-cell imaging media containing 30μM nocodazole (in DMSO) (M-1404; Sigma) or an equivalent amount of DMSO only was added to the cells immediately before imaging.
DSG3 labelling in NHEK
Normal Human Epidermal Keratinocytes were seeded on 35mm #1.5 glass bottom dishes with 4 compartments (#627870; Greiner Bio-One). Cells were switched to medium containing 550μM calcium chloride for 18–24h prior to labelling. To label DSG3, we used an Alexa Fluor 488-conjugated pathogenic mouse monoclonal antibody against the extracellular domain of Dsg3, AK23 (43). Cells were incubated with 1:300 AF488-AK23 in ice-cold KGM™ Gold Keratinocyte Growth Medium at 4°C for 45min. Cells were then washed 3X with 1X HBSS. After the last wash, pre-warmed media was added to the cells before imaging.
Treatment of cells with pemphigus vulgaris IgG
Desmosome formation in NHEK (no later than passage 3) was first induced by switching to culture media containing 550μM calcium for 16–18h. Cells were treated with either normal human (NH) IgG or PV IgG at a final concentration of 400μg/mL for 24h at 37°C. PV sera were kind gifts from Dr. Masayuki Amagai (Keio University, Tokyo). PV sera used in this study were IgG preparations from two patients and predominately recognized Dsg3 (ELISA scores: PV1 - Dsg3 179.3, Dsg1 2.6; PV2 - Dsg3, 167.7; Dsg1, 4.1) (44, 45).
Transmission Electron Microscopy
Cells cultured to 100% confluence on 12mm, 0.4μm, polyester Transwells (CLS3460; Corning) were fixed in 1.5% paraformaldehyde (15713; Electron Microscopy Sciences)/1.5% glutaraldehyde (16320; EMS) in 0.1M sodium cacodylate buffer (pH 7.3) (12300; EMS) at room temperature for 30min. Rat skin and colon tissue from Sprague Dawley rats were also fixed as above. The membrane inserts were then cut out with a clean scalpel and incubated in room temperature fixative. Membranes were then washed 3X with 0.1M sodium cacodylate buffer for 10min each. Samples were then post-fixed on ice for 1h with 1% OsO4 (19100;EMS) (1:1 mix of 2% OsO4 and 0.2M sodium cacodylate buffer) and then washed 3X (10min each) with ddH2O. Membranes were stained with 1% aqueous uranyl acetate and washed again 3X (10min each) with ddH2O before being dehydrated in an ascending concentration series of ethanol solutions, treated with two changes of 100% propylene oxide (20401; EMS), and infiltrated with a 1:1 mix of propylene oxide and EMbed 812 resin (14120; EMS) and left overnight. After two 2h incubations in 100% EMbed 812 resin, the membranes were placed on a silicone platform with cells facing up and embedding capsules (filled with resin) were inverted onto the membranes. Finally, the samples were heated in a 60°C oven for 48h. Polymerized blocks with membranes attached were removed from the silicone platforms and trimmed. Thin sections were cut on a Leica Ultramicrotome and the sections collected on 200 mesh copper grids (G200-Cu; EMS). The sections were stained with uranyl acetate and lead citrate, and imaged on an FEI Tecnai G2 or Talos transmission electron microscope operated at 120kV.
Correlative Light and Electron Microscopy (CLEM)
CLEM was performed according to Hoffman et al., 2020 (6) and as described below.
Sapphire Disk Preparation
Optically flat sapphire disks (3mm diameter, 50–80μm thick; Nanjing Co-Energy Optical Crystal Co., Ltd.) were cleaned using basic Piranha solution (5:1:1 mixture of H2O : 50% H2O2 : NH3OH) for 4–6h at 80–90°C. Disks were then coated (Desk II sputter coater; Denton Vacuum Inc.) with a gold pattern around the outer 0.5mm edge to identify the direction the disk is facing. Disks were then placed in a 20mm MatTek disk, gold side facing down, submerged in 70% ethanol for 2–3min. Ethanol was discarded and disks were rinsed 3X in sterile water and left to dry. Disks were then coated with 0.1% gelatin in 1:1 H2O: growth media for 1h at 37°C and left to dry.
Cell Culture and Staining for CLEM
Cultured A431 cells stably expressing Desmoplakin-EGFP and mApple-VAPB at 70–80% confluency (maintained at 37°C/5% CO2 in 100mm tissue culture dishes) were trypsinized (0.25% Trypsin-EDTA) at 37°C, resuspended and re-cultured onto the non-gold bearing surface of the sapphire disks. After 24h, cells were incubated in 4μg/mL Doxycycline for DP-EGFP induction. After 24–48h, cells were stained with MitoTracker Deep Red FM (M22426; Molecular Probes; working conc. 25–500nM) at 50nM or MitoView 650 (70075; Biotium; working conc. 25–500nM) in a CO2 incubator for 15min and washed.
High-Pressure Freezing
Sapphire disks containing labeled cells were dipped 3X in freezing media containing Fluorobrite media (A1896702; ThermoFisher), 25% Dextran (Mr ~40,000, 31389–100G; Sigma), and 0.8pM TetraSpeck microspheres (0.2μm diameter, T7280; Invitrogen). They were then placed between aluminum planchettes and subjected to High Pressure Freezing (HPF Compact 01; Wohlwend GmbH) according to the manufacturer’s instructions. Samples were then stored in liquid N2.
Optical Imaging/ Cryo-SIM
Specimen fluorescence was imaged using the setup described previously (6). Briefly, residual ice on the non-cell bearing side of the sapphire disks was removed via scalpel scraping under liquid N2. Samples were then loaded into a custom-built cryostat with an imaging window that maintained sample temperature of ~77K for the duration of imaging. Cells were excited via 488nm (4 W, Genesis CX STM; Coherent), 561nm (5 W, 2RU-VFLP-5000–560-B1R; MPB Communications) and 642nm laser (2 W, 2RU-VFL-P-2000–642-B1R; MPB Communications) illumination and imaged via a 100x, 0.85NA objective lens (CFI L Plan EPI CRB; Nikon) onto an sCMOS camera detector (Orca Flash 4.0 v3; Hamamatsu Corp.).
After correction-collar optimization (using TetraSpeck beads), montage epi-fluorescence images were taken of each coverslip to identify regions of interest (ROIs). Following this, ROIs were imaged using 3D structured illumination microscopy (3D-SIM), with typical field of view (FOV) of 130×130μm (xy) and 8μm (z-depth). Images were processed using the SIM reconstruction algorithm reported previously (46), with the following typical reconstruction parameters: 0.007 Wiener Filter, 0.7 gamma apodization, 15-pixel radii of the singularity suppression at the OTF origins. Finally, chromatic shifts between each color channel were digitally corrected using the TetraSpeck beads as alignment fiducials.
Electron Microscopy Preparation
Samples were unloaded from the Cryo Fluorescence Microscope and again stored in liquid N2. They were then transferred to cryotubes containing 1–2% OsO4, 0.1% Uranyl Acetate, and 3% water in acetone under liquid N2. Freeze substitution was then performed, and sapphire disks embedded in Eponate 12 using the recipe reported previously (6). Following these manipulations, Epon resin was removed from the bottom side of the sapphire disk, and the disk removed from the resin block by repeated alternating immersion in warm water and liquid N2. The newly exposed Epon surface containing cells was then re-embedded in Durcupan resin.
X-ray Correlation and Trimming
Samples were then imaged using a micro X-ray CT system (XRadia 510, Carl Zeiss X-ray Microscopy, Inc.) to identify the positions of the cells of interest. Fluorescence images taken previously were overlayed onto X-ray images to ensure proper ROI location. Specimens were remounted on a copper stud and trimmed using an ultramicrotome (EM UC7, Leica Microsystems), with supplementary X-ray CT imaging to guide the trimming process, until the region to be imaged in EM was contained in a resin “tab” with typical dimensions of approx.100×100×65μm. Finally, samples were sputter-coated with 10nm gold and 100nm carbon (PECS 682; Gatan) to maintain sample conductivity for EM.
Focused Ion Beam Scanning Electron Microscopy (FIB-SEM)
Samples were loaded onto a custom FIB-SEM, consisting of a Zeiss Gemini 450 Field Emission SEM and a Zeiss Capella FIB column oriented at 90 degrees to the SEM beam (47). Samples were subjected to repeated FIB milling and SEM imaging to acquire 3D EM datasets. Images taken at 8×8×8nm pixel resolution were imaged at 500kHz readout rate, with 1.2kV landing energy at 2.0nA electron dose. Milling was performed using a 15nA gallium ion beam source at 30kV. Images taken at 4×4×4nm3 pixel resolution were imaged similarly but with 200kHz readout rate, 0.25nA electron dose, and 0.9KV landing energy. A pipeline based upon render web services (available at: github.com/saalfeldlab/render) was used to align and reconstruct the FIB-SEM images into 3D volumes for analysis. Point match correspondences were extracted using SIFT (48), and global optimization (49, 50) was employed to compute per-image affine transformations regularized with a rigid model for each entire volume. After alignment, the volumes were flattened using a spline along the z dimension based on key points that were interactively set in BigDataViewer (51).
CLEM Registration
Fluorescence and EM image data were co-registered as follows. The mitochondria fluorescence channel (MitoView650) was manually cropped to approximately match the field of view of the FIB-SEM image. Mitochondria predictions (see Automatic ER and mitochondria segmentation in FIB-SEM datasets section) were down-sampled to 64nm isotropic resolution and coarsely aligned to the cropped light image using BigDataViewer (51). Resampled predictions were then blurred with a 1×1×3 pixel Gaussian kernel using Fiji (52). Processed predictions were registered to the fluorescence image using elastix (53) using two steps. First, we used elastix to estimate an affine transformation between the two volumes. We then ran elastix again, initialized with the estimated affine to find a non-linear transformation. Parameters for both steps can be found at (39). In estimating the nonlinear transformation, we provided elastix an automatically-generated mask that was non-zero when the image fields of view overlapped. The inverse of the resulting transformation was estimated and applied to all fluorescence images, bringing them into spatial alignment with the FIB-SEM (using code from: https://github.com/saalfeldlab/template-building).
Spinning Disk Confocal Microscopy
Microscope
Fluorescence imaging was performed using a Nikon Ti2-E equipped with a Yokogawa CSU-X1 spinning disk unit, LUNF XL laser unit, Nikon Perfect Focus System, Z piezo stage, motorized XY stage, two sCMOS cameras (ORCA-Fusion BT, Hamamatsu Corp.), and two fast filter wheels with most elements controlled through hardware-triggering through Nikon’s National Instruments Breakout Box. The acquisition software was NIS-Elements (v5.30.02, v5.30.04, and v5.30.06). The polychroic mirror within the Yokogawa CSU-X1 unit is a Semrock Di01-T405/488/568/647. Single emission filters (Chroma ET525/36m, Chroma ET605/52m, and Chroma ET705/62m) were used with the 488nm, 561nm, and 640nm lasers.
Live-cell Imaging
For live-cell imaging, cells were seeded on either 8-well chambered #1.5H cover glass (#C8–1.5H-N; Cellvis) or 35mm #1.5 glass bottom dishes with 4 compartments (#627870; Greiner Bio-One). We used a Nikon 100x/1.49 NA Apo TIRF oil immersion objective with its correction collar optimized for our imaging at 37°C through a #1.5H glass coverslip. Images were taken in 12-bit with high gain (“12-bit Sensitive”) and with “Standard” readout mode. Rough alignment for simultaneous dual-channel imaging was accomplished using 0.1μm multicolor TetraSpeck beads to align the Cairn TwinCam unit (holding a Semrock Di02-R561 beamsplitter) until pixel-perfect overlap was achieved in the center of FOV for the two cameras. Temperature and CO2 control for maintaining physiological conditions were provided by a Tokai Hit stage top incubation system (Model STXF-WELSX-SET). Acquisition settings for figures/experiments are listed in Supplementary Table 2. To accommodate the addition of high calcium media during calcium switch experiments, holes were made in polystyrene lids using heated syringes and then sterilized with 70% ethanol.
Image processing
Automatic ER, mitochondria, and plasma membrane segmentation in FIB-SEM datasets
Segmentations for ER, mitochondria, and plasma membrane were generated using the 8nm and 4nm many-type networks described in (54) for DSM-2 and DSM-3, respectively. With a manual validation Fiji plugin (available at: https://github.com/janelia-cosem/Fiji_COSEM_Predictions_Evaluation), we found the optimal network iterations to be 800k for ER, 875k for mitochondria in DSM-2 (from range 800k-1000k) and 625k for ER, 750k for mitochondria in DSM-3 (from range 600k-800k). Voxels predicted to belong to organelles were used to segment the organelles into individual connected components (54). Components smaller than 20E6nm3 were removed. In the case of mitochondria, predictions were first smoothed by a Gaussian kernel (σ = 12nm) prior to connected component analysis.
FIB-SEM image processing (after COSEM predictions)
Predicted organelle segmentation results and raw EM data from COSEM/AIC were cropped to remove regions without biologically relevant voxels. Datasets were then resliced (rotated) to an orientation akin to typical light microscopy z-stacks. To reduce file sizes, the 4×4×4nm3 dataset (“DSM-3”) was chopped into twelve tiles of equal dimensions from which one tile containing part of a cell border was selected for segmentation touch-up and analysis. Similarly, “DSM-2”, the 8×8×8nm3 dataset, was cropped to include only one border. More details about FIB-SEM datasets can be found in Supplementary Table 3.
Keratin intermediate filaments, ribosomes, and desmosome outer dense plaque were segmented using the pixel classification workflow from ilastik (v1.3.3). The structure and strong electron density of the outer dense plaque and ribosomes permitted predictions from ilastik to be filtered based on size and intensity with minor manual corrections. If both sides of the outer dense plaque were not available due to sample tearing, these desmosomes were excluded from analysis. Endosomes were frequently misclassified as ER and were re-classified into a separate endosome class. Microscopy Image Browser v2.83 (MIB) (55) was used for proofreading segmentation results and manual annotation of microtubules.
Segmentation results were exported from MIB as 3D TIFs and imported into Dragonfly along with the corresponding cropped FIB-SEM dataset. Connected component analysis (26-connection) was done to generate objects of desmosomal outer dense plaque, keratin, microtubules, ER, endosomes, and ribosomes, and to classify certain organelles (ER, endosomes, keratin, and microtubules) by cell. Sample tearing (from the resin embedding step) resulted in disconnected ER within the same cell, but these objects were manually re-classified as one ER object per cell.
Three-dimensional renderings in Fig. 1, Fig. 2, Fig. 3, Extended Data Fig. 4, Extended Data Fig. 5, and Supplementary Figure 1 were generated using Dragonfly software, Version 2022.2 for Windows (56).
FIB-SEM image analysis (after COSEM predictions)
To assess the relative location of various organelles on both sides of a desmosome (Fig. 3), unsigned distance transform maps were generated for specific organelles which were split by cell to determine the closest voxel of each organelle to individual desmosomes. To distinguish between smooth and rough ER, we filtered ribosomes based on distance to ER to keep ribosome objects with voxels adjacent to ER. The statistics for the minimum intensity of the unsigned distance transform maps for each desmosome object were exported as comma separated value files. Desmosomes at locations of sample tearing were excluded from analysis and visualization except for Supplementary Figure 1.
To compare ER contacts between keratin and microtubules, we used the 4×4×4nm3 dataset (“DSM-3”) because the 8×8×8nm3 dataset (“DSM-2”) was insufficient for seeing the hollow tube structure of microtubules. Using Microscopy Image Browser, the ER class was dilated in 3D (by 1–5 voxels, corresponding to 4–20nm), and then an intermediate filament class was masked with the dilated ER class. Following connected components in 3D with a 26-connected neighborhood, the objects were exported as .csv files and plotted using seaborn (v0.12.0) and matplotlib (3.7.1) (57–60).
Fluorescence microscopy image processing
Images were split by channels and timepoints before denoising with either Noise2Void (61) or 3DRCAN (Supplementary Figure 4) (62). After re-combining to a hyperstack, all datasets were corrected for lateral chromatic aberration using NanoJ’s channel registration (63). If needed, images were then drift corrected using NanoJ’s drift correction. Fiji/ ImageJ macros are provided at (39).
3DRCAN
A431 cells stably expressing mApple-VAPB were grown on #1.5 glass coverslips and fixed using 2% PFA for 15min at 37°C before being mounted in ProLong Gold and left to cure for 72h. Acquisition settings for the low signal-to-noise ratio (SNR) images were chosen to match the SNR during live-cell imaging. The high SNR settings used higher laser power and higher exposure to compensate for the fixation-induced loss in fluorescence. “Ground truth” datasets were obtained after Richardson-Lucy deconvolution of the high SNR datasets. After excluding datasets that showed focal drift between the low/high SNR datasets, we had 37 (34 training and 3 validation) datasets. Training parameters can be found in Supplementary Table 4. A Windows 10 workstation with an NVIDIA RTX 3090 GPU was used.
Noise2Void and N2V2
Noise2Void v0.2.1 was used with TensorFlow-DirectML on a Windows 10 workstation with an NVIDIA RTX 3090 GPU (Graphics Processing Unit). Compared to Noise2Void, N2V2 yielded superior results in our FIB-SEM datasets by improving denoising quality and reducing checkerboard artifacts (64). N2V2 training and prediction was done through the napari-n2v plugin on napari (65). In some cases, N2V training and prediction used the N2V CSBDeep Fiji plugin on a Windows 10 workstation with an NVIDIA Quadro RTX 4000 GPU. Training parameters can be found in Supplementary Table 5 and Supplementary Table 6.
Image Analysis
Segmentation with ilastik and Generation of overlapping signals
To determine the extent of colocalization between DP or KRT14R125C aggregates and VAPB over time, we performed an analysis of overlapping signals (Fig. 4C, Extended Data Fig. 10I). We first generated binary masks of DP-EGFP, KRT14R125C aggregates, and mApple-VAPB channels using the Pixel Classification workflow in ilastik (66). Briefly, features were drawn to differentiate foreground from background pixels in denoised images. This step generates a binary image for each channel, with true signal value=1 and background value=0. Additionally, in ilastik-segmented KRT14R125C images, any keratin filamentous structures present were cleared using Fiji so that only keratin aggregates were analyzed.
To generate an overlap image, we used Fiji (52) to perform a “Multiply” calculation on ilastik-segmented binary masks of DP or KRT14R125C images and the corresponding VAPB images. Therefore, only non-zero pixels in both channels are kept. These resulting pixels suggest colocalization between DP puncta (desmosomes) or KRT14R125C aggregates and VAPB (ER) at the resolution limit of standard spinning disk confocal microscopy.
Analysis of DP-VAPB colocalization
Fiji macros were developed to determine whether DP puncta exhibited interactions with ER membrane over a 2min duration with image acquisition every 5sec (25 timepoints) (Fig. 4C). Briefly, we drew ROIs around individual ilastik-segmented DP puncta to obtain information about puncta position and area. Only DP puncta that remained in focus for all 25 timepoints and that were equal to or larger than 4 pixels were selected for analysis. These ROI positions were then applied to the corresponding “Multiplied” image file (see Segmentation with ilastik and Generation of overlapping signals section) to acquire area measurements at each timepoint. An area value of <4 pixels meant no overlap between a DP ROI and ER membrane for that timepoint.
Analysis of colocalization between KRT14R125C aggregates and VAPB
Fiji macros were developed to determine whether KRT14R125C aggregates colocalized with ER membrane over a 2min duration with image acquisition every 5sec (25 timepoints) (Extended Data Fig. 10I). Briefly, we used the “Analyze Particles” function in Fiji to generate ROIs of ilastik-segmented KRT14R125C aggregates to obtain information about puncta position and area. Only KRT14R125C aggregates that were at least 4 pixels were selected for analysis. These ROI positions were then applied to the corresponding “Multiplied” image file (see Segmentation with ilastik and Generation of overlapping signals section) to acquire area measurements for each ROI at each timepoint. An area value of <4 pixels meant no overlap between a KRT14R125C aggregate ROI and ER membrane for that timepoint.
Membrane Displacement Analysis (MDA)
To quantify the displacement of ER membranes at various cellular locations and between conditions, we calculated optical flow fields and classified membrane movement as either static or mobile using a modified version of a previously published Fiji macro (14). We performed MDA on ROIs of 35px × 35px (2.275μm × 2.275μm) with the following parameters for MSEGaussianFlow: (sigma=4, maximal_distance=10). The extent of membrane movement was depicted by the pixel intensity, with higher movement between frames corresponding to higher intensity values. ER membrane movement was classified into two categories based on the amount of movement in pixels: “Static ER” (0–2 pixels) or “Mobile ER” (3–9 pixels). Masking of the mApple-VAPB channel was performed using the “Percentile” thresholding in Fiji. The MSEGaussianFlow plugin was authored by Stephan Saalfeld and Pavel Tomancak.
Quantitative RT-PCR Analysis
RNA was isolated from cells using TRIzol (Invitrogen) and purified by chloroform extraction. RNA concentration and purity were assessed by spectrophotometry. A total of 200–400ng of RNA was reverse transcribed using the iScript cDNA Synthesis Kit (1708891; Bio-Rad Laboratories). Two technical replicates were performed for all samples.
For expression analysis of K14WT- and K14R125C-expressing A431 cells, qRT-PCR was performed using TaqMan Fast Advanced Master Mix (4444557; Applied Biosystems) and Light Cycler 480 (Roche). TaqMan MGB probes labelled with fluorescent dyes were used. Reaction was performed according to the following protocol: 50°C for 2min, 95°C for 20sec, and (50 cycles of 95°C for 3sec and 60°C for 30sec). Probes against specific genes were labelled with the FAM dye. TBP was labelled with the VIC dye and used as the reference gene within the same tube as the gene of interest. Normalized expression was calculated using Microsoft Excel (version 2303) by subtracting the cycle threshold (Ct) values of the internal control gene from the Ct value of the gene of interest, followed by averaging this value across all technical replicates. Fold change relative to K14WT cells was then calculated by the 2−ΔΔCt method. More details about TaqMan probes are provided in Supplementary Table 7.
For expression analysis of cells treated with Normal Human IgG or pemphigus vulgaris IgGs, qRT-PCR was performed using the PerfeCta SYBR Green (101414–272; Quanta Biosciences) and Light Cycler 480 (Roche). Reaction was performed according to the following protocol: 95°C for 3min, and 45 cycles of (95°C for 5sec and 60°C for 30sec). RPLP0 and TBP were used as reference genes. Normalized expression was calculated in Microsoft Excel by averaging the Ct values across all technical replicates and then normalizing to the geometric mean of the average Ct values of RPLP0 and TBP. Fold change relative to NH IgG control was then calculated by the 2−ΔΔCt method. Primer sequences are provided in Supplementary Table 8.
Normalized expression for each target gene was determined from at least three biological replicates. Error bars represent s.e.m. of ΔΔCt values.
Statistics and Reproducibility
Sample sizes were chosen based on past experience in the lab and previous studies. No predetermined tests were performed to calculate sample size. The cells used for live-cell experiments were stable immortalized/ transformed cell lines that were not clonally selected and therefore represented a population. All experiments were repeated at least three times, unless specified otherwise in the legends, and similar results were obtained in all replicates. DMSO control for thapsigargin and nocodazole treatment experiments (Fig. 5, Extended Data Fig. 7, Extended Data Fig. 9) were performed at least twice. TEM was performed on cultured human cells and two different rat organ systems (skin and gut tissue). Western blot was repeated twice and similar results were obtained. Samples sizes for FIB-SEM datasets were limited by long acquisition times and sample preparation, and the need for accurate segmentation in these large datasets. Therefore, measurements were obtained for one cell-cell contact each from the DSM-2 (8nm) and DSM-3 (4nm) datasets.
Some desmosomes in the FIB-SEM datasets were excluded because of sample tearing or because only part of the desmosome was contained within the cropped datasets. Live-cell datasets were excluded if there was significant sample drift. For calcium switch experiments, datasets were excluded if two or more cells did not form cell-cell contacts. The Investigators were not blinded to allocation during experiments and outcome assessment.
For live-cell imaging experiments, cells expressing fluorescent constructs were seeded into wells and image fields were selected based on 2 criteria: 1. Two or more adjacent cells expressing the fluorescent constructs were in the same field, and 2. adjacent cells had similar fluorescence intensity levels. Covariates were controlled by maintaining all samples in the same growth conditions on the same dish (in different wells), until addition of drug or DMSO. For the CLEM experiments, regions were chosen for FIB-SEM acquisition using the results of Cryo-SIM imaging with the following conditions for all cells within the regions of interest: 1. Similar expression levels of mApple-VAPB and DP-EGFP, and 2. Healthy/normal morphology. Further cropping of FIB-SEM datasets was necessary for analysis due to computer hardware constraints and segmentation requirements. The cropped regions for analysis were chosen because they contained desmosomes without being greatly impacted by sample tearing.
Statistical testing was performed using R (version 4.2.3) (Fig. 4F and Fig. 7F) or Prism 8 (GraphPad Software) (Fig. 8L, M). Exact P values are provided. Normality testing was first performed with the D’Agostino-Pearson omnibus (K2) test. When normality tests failed, statistical significance was calculated using the nonparametric Mann-Whitney test.
Extended Data
Extended Data Fig. 1. ER tubules are proximal to desmosomal junctions in various epithelial cell culture models.

(A-C) Representative light microscopy images of a pair of A431 cells (A), HaCaT immortalized keratinocytes (B), and primary Normal Human Epidermal Keratinocytes (C) expressing mCherry-VAPB (magenta, ER marker) showing ER tubule and desmosomal junction (orange) proximity (red or white arrowheads). Desmosomes are labelled with DP-EGFP in A and B, or with an AF488-conjugated anti-DSG3 mAb (AK23) in C. Images are representative of n=3 independent experiments (A, B) and 2 independent experiments (C). Scale bar = 2μm.
Extended Data Fig. 2. ER tubules are proximal to the desmosomal plaque in epithelial cell culture models and various tissues.
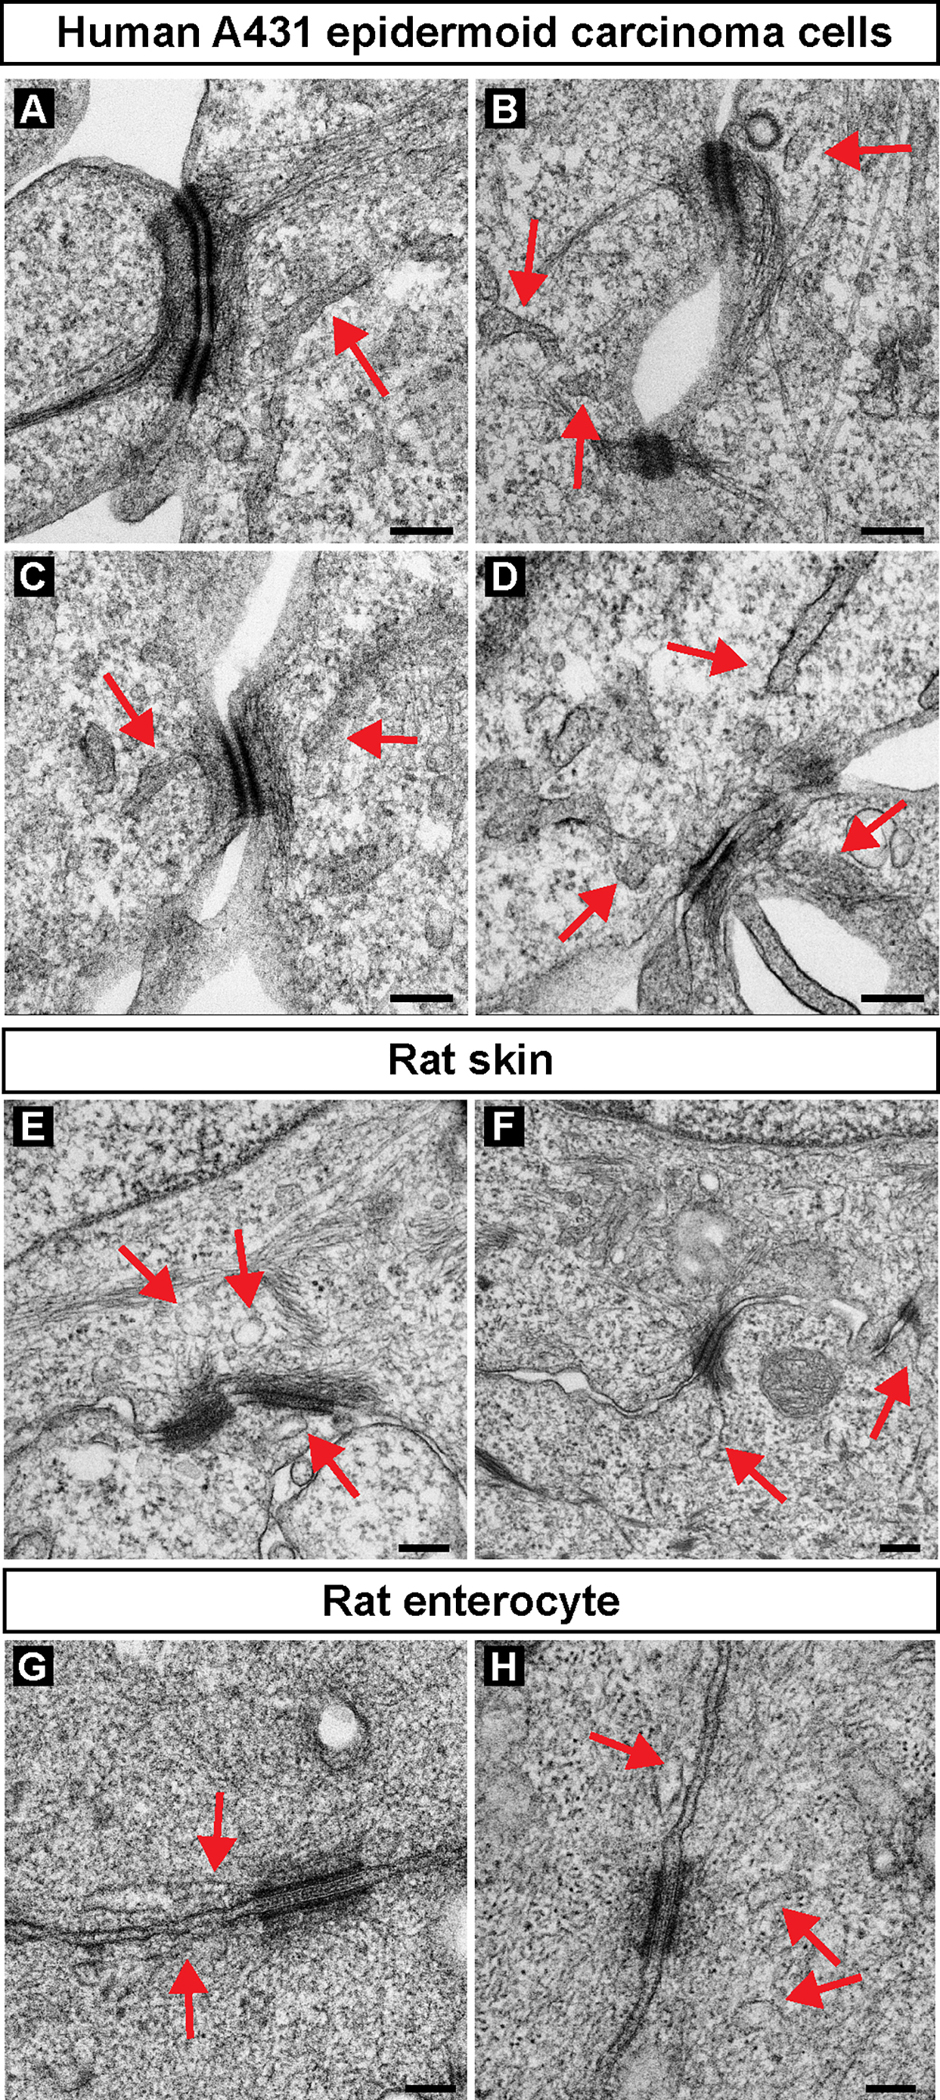
(A-H) Transmission electron micrographs of A431 epithelial cells (A-D), rat skin (E, F), and rat enterocytes (G, H) show ER tubules (red arrows) proximal to the electron-dense desmosomal plaque. Images are representative of n=1 replicate for each cell or tissue type. Scale bar = 200nm (A-F), 100nm (G, H).
Extended Data Fig. 3. FIB-SEM reveals ER tubules in physical contact with the desmosome outer dense plaque.

(A-C) Orthoslices in XY (A), XZ (B), and YZ (C) showing ER tubules making physical contact with desmosome outer dense plaque. (D-F) Same orthoslices as in A-C with ER, keratin, and desmosome segmentations. Yellow arrows point to physical contact between ER tubules and the desmosome outer dense plaque in all 3 views. Images are representative of n=1 cell-cell contact. Scale bar = 250nm.
Extended Data Fig. 4. Ribosomes are less prominent on desmosome-adjacent ER than planar ER.

(A-B) Rotated views showing that ER structures (magenta) have fewer bound ribosomes (white) at desmosome (yellow)-adjacent regions (white arrows) than at regions further away from the desmosome (blue arrows) in both top and bottom cells. Images are representative of n=1 cell-cell contact. Scale bar = 1μm. (C-E) Three-dimensional reconstructions of segmentations in 4×4×4nm3 FIB-SEM data reveal keratin filaments (teal) contacting and penetrating planar ER sheets (magenta). Microtubules (orange) are also present in the vicinity of planar ER, and ribosomes (white) decorate the surface of ER sheets. (F-H) Rotated views of the same region in C-E. Images are representative of n=1 cell. Scale bar = 500nm (C-H).
Extended Data Fig. 5. The ER makes more contacts with keratin filaments compared to microtubules proximal to the desmosome.

(A-B) FIB-SEM segmentations showing keratin filaments (teal), desmosomes (yellow), microtubules (orange), and ER (magenta) (A). Panel (B) displays ER-keratin (teal) and ER-microtubule (orange) contacts at a distance threshold of 16nm. Scale bar = 1μm. (C-F) Close-up of keratin filaments, microtubules, and ER adjacent to a desmosome (C-E) revealing larger and more numerous ER-keratin contacts (blue arrowheads) compared to ER-microtubule contacts (orange arrowheads) (F). Images in A-F are representative of n=1 cell-cell contact. Scale bar = 500nm. (G) Violin plots of ER-keratin (blue) and ER-microtubule (orange) contacts at x nm away from the closest desmosome. Individual contacts are represented by black vertical lines. Setting various contact site distance thresholds between 0nm to 16nm (y-axis) demonstrates that ER-keratin contacts preferentially occur proximal to desmosomes. Source numerical data are available in source data.
Extended Data Fig. 6. ER tubules closely associate with desmosomes in live cells.

(A-E) Snapshots of a live-cell time-course of desmoplakin (top row, orange in bottom row) and VAPB (middle row, magenta in bottom row) in A431 cells at the cell-cell contact over 2 minutes (Images are representative of n=3 independent experiments). Gamma correction was applied to grayscale images. Gamma (inverted) = 1.5 (VAPB). Scale bar = 2μm. (F-J) ilastik-rendered segmentations of DP (top row) and VAPB (middle row) channels in A-E. Bottom row indicates only overlapping pixels (white) between DP and VAPB channels. Overlap indicates that tips of ER tubules colocalize with DP puncta. Scale bar = 2μm.
Extended Data Fig. 7. ER retracts from cell-free edges only in cells where microtubules are depolymerized.

(A, B) Representative images of A431 cells treated with either DMSO or 30μM nocodazole reveal that ER (VAPB, magenta) tubules are converted to sheets with nocodazole treatment. The ER remains tethered to desmosomes (DP, orange) at cell-cell contacts under both treatment conditions. Images are representative of at least n=2 independent experiments. Scale bar = 2μm. (C, D) Representative images of A431 cells treated with either DMSO or 30μM nocodazole reveal that ER (VAPB, magenta) remains close to the periphery of a cell-free edge in DMSO-treated cells (C) but retracts in nocodazole-treated cells (D). Tubulin Tracker Deep Red labelling reveals a lack of microtubules in nocodazole-treated cells but not in DMSO-treated cells. Cell-free edge is depicted by a dashed red or white line. Images are representative of at least n=2 independent experiments. Scale bar = 2μm. Gamma correction was applied to some grayscale images. Gamma (inverted) = 1.75 (D, DP channel), 0.75 (A, Tubulin Tracker channel), 1.5 (C, Tubulin Tracker channel).
Extended Data Fig. 8. ER tubules associate with desmosomes during fusion events.

(A-F) Snapshots of a live-cell time-course of desmoplakin (top row, orange in bottom row) and VAPB (middle row, magenta in bottom row) in A431 cells during the fusion of DP puncta at the cell-cell contact (Images are representative of n=4 independent experiments). Three DP puncta (A) fuse to form two puncta (B). Eventually, these puncta fuse to form one DP puncta (F). Gamma correction was applied to grayscale images. Gamma = 0.7 (DP/ VAPB merge), Gamma (inverted) = 1.5 (VAPB). Scale bar = 1μm. (G-L) ilastik-rendered segmentations of DP (top row) and VAPB (middle row) channels in A-F. Bottom row indicates only overlapping pixels (white) between DP and VAPB channels. Overlap indicates that tips of ER tubules colocalize with DP puncta during fusion. Scale bar = 1μm.
Extended Data Fig. 9. ER tubules remain at the cell-cell border even when desmoplakin translocation to the border is inhibited.

(A-E) Representative time-lapse of A431 cells expressing DP-EGFP (orange) and mApple-VAPB (magenta) pre-treated with DMSO for 30 minutes, followed by a switch to high calcium media. ER tubules extend toward the cell periphery, sometimes forming paired structures across adjacent cells (red arrows, B). Desmosomes form at the exact position of ER paired structures (blue arrows in E). Images are representative of n=2 independent experiments. Scale bar = 2μm. (F-J) Representative time-lapse of A431 cells expressing DP-EGFP (orange) and mApple-VAPB (magenta) pre-treated with 1μM thapsigargin (TG) for 30 minutes, followed by a switch to high calcium media. ER tubules extend toward the cell periphery, sometimes forming paired structures across adjacent cells (red arrows, F, G). ER tubules eventually remain at the periphery in adjacent cells, but no desmosomes form (J). Timestamps indicate time after DMSO/ thapsigargin wash-out and switch to high calcium media. Images are representative of n=3 independent experiments. Scale bar = 2μm.
Extended Data Fig. 10. Keratin filaments and aggregates are stably tethered to ER membranes.

(A) Snapshot of an A431 cell expressing mNeonGreen-KRT14WT (blue) and mApple-VAPB (magenta) showing ER tubules along keratin filaments (Images are representative of n=3 independent experiments). Solid yellow line indicates position of kymograph in B-D. Scale bar = 1μm. (B-D) Kymograph of yellow line in A revealing stable ER-keratin interaction over a 2-minute time course. Scale bar = 500nm. (E) Snapshot of an A431 cell expressing mNeonGreen-KRT14R125C (blue) and mApple-VAPB (magenta) showing ER sheets surrounding KRT14R125C aggregates (Images are representative of n=3 independent experiments). Solid yellow line indicates position of kymograph in F-H. Scale bar = 1μm. (F-H) Kymograph of yellow line in E revealing stable ER-keratin interactions over a 2-minute time course. Scale bar = 500nm. (I) Graph depicting the fraction of KRT14R125C aggregates colocalizing with ER at each timepoint during a 25 timepoint/2-minute time course. Data are represented as mean ± s.d.; n indicates total number of KRT14R125C aggregates analyzed from three independent experiments. Source numerical data are available in source data.
Supplementary Material
Acknowledgments:
The authors are grateful to Drs. Dorothy Lerit (Emory University), Kathleen Green and Lisa Godsel (Northwestern University), Thomas Magin (University of Leipzig), Masayuki Amagai (Keio University, Tokyo), and Amanda Nelson and Ryan Hobbs (Penn State College of Medicine) for instrument use, reagents, and advice. We thank Nate Sheaffer and Joseph Bednarczyk from Penn State College of Medicine’s Flow Cytometry Core for assistance with cell sorting. This research project was supported in part by the Emory University Integrated Cellular Imaging Core.
Funding:
This work was supported by:
National Institutes of Health grant R01AR048266 (APK).
Natural Sciences and Engineering Research Council of Canada Discovery Grant RGPIN-2018-14 03727 (AWV).
CryoSIM and FIB-SEM imaging were done in collaboration with the Advanced Imaging Center at Janelia Research Campus, a facility jointly supported by the Gordon and Betty Moore Foundation and the Howard Hughes Medical Institute.
Consortia
COSEM Project Team, Janelia Research Campus, Howard Hughes Medical Institute, Ashburn, VA 20146, USA
Stephan Preibisch, Eric T. Trautman, Larissa Heinrich, John Bogovic, Davis Bennett, David Ackerman, Woohyun Park, Alyson Petruncio, Stephan Saalfeld, & Aubrey V. Weigel.
Footnotes
Competing interests:
The authors declare that they have no competing interests.
Code availability: All code and macros are available at: https://doi.org/10.5281/zenodo.6800360.
Data availability:
All macros and plasmid maps are available at https://doi.org/10.5281/zenodo.6800360 (39). FIB-SEM datasets are hosted on: https://www.openorganelle.org/datasets/aic_desmosome-2 and https://www.openorganelle.org/datasets/aic_desmosome-3. Other imaging source data, including spinning disk confocal microscopy data, is hosted on ScholarSphere (doi:10.26207/53vq-g344). Source data for graphs and western blots are provided with this paper. All other data supporting the findings of this study are available from the corresponding author on reasonable request.
References and Notes
- 1.Wu H, Carvalho P, Voeltz GK, Here, there, and everywhere: The importance of ER membrane contact sites. Science (1979) 361, eaan5835 (2018). [DOI] [PMC free article] [PubMed] [Google Scholar]
- 2.Schwarz DS, Blower MD, The endoplasmic reticulum: structure, function and response to cellular signaling. Cell Mol Life Sci 73, 79–94 (2016). [DOI] [PMC free article] [PubMed] [Google Scholar]
- 3.Prinz WA, Toulmay A, Balla T, The functional universe of membrane contact sites. Nat Rev Mol Cell Biol 21, 7–24 (2020). [DOI] [PMC free article] [PubMed] [Google Scholar]
- 4.Cohen S, Valm AM, Lippincott-Schwartz J, Interacting organelles. Curr Opin Cell Biol 53, 84–91 (2018). [DOI] [PMC free article] [PubMed] [Google Scholar]
- 5.Perkins HT, Allan V, Intertwined and Finely Balanced: Endoplasmic Reticulum Morphology, Dynamics, Function, and Diseases. Cells 10 (2021), doi: 10.3390/cells10092341. [DOI] [PMC free article] [PubMed] [Google Scholar]
- 6.Hoffman DP, Shtengel G, Xu CS, Campbell KR, Freeman M, Wang L, Milkie DE, Pasolli HA, Iyer N, Bogovic JA, Stabley DR, Shirinifard A, Pang S, Peale D, Schaefer K, Pomp W, Chang CL, Lippincott-Schwartz J, Kirchhausen T, Solecki DJ, Betzig E, Hess HF, Correlative three-dimensional super-resolution and block-face electron microscopy of whole vitreously frozen cells. Science (1979) 367 (2020), doi: 10.1126/science.aaz5357. [DOI] [PMC free article] [PubMed] [Google Scholar]
- 7.Godsel LM, Hsieh SN, V Amargo E, Bass AE, Pascoe-Mcgillicuddy LT, Huen AC, Thorne ME, Gaudry CA, Park JK, Myung K, Goldman RD, Chew T-L, Green KJ, Desmoplakin assembly dynamics in four dimensions. Journal of Cell Biology 171, 1045–1059 (2005). [DOI] [PMC free article] [PubMed] [Google Scholar]
- 8.Zewe JP, Wills RC, Sangappa S, Goulden BD, Hammond GR, SAC1 degrades its lipid substrate PtdIns4P in the endoplasmic reticulum to maintain a steep chemical gradient with donor membranes. Elife 7 (2018), doi: 10.7554/elife.35588. [DOI] [PMC free article] [PubMed] [Google Scholar]
- 9.Johnson B, Leek AN, Solé L, Maverick EE, Levine TP, Tamkun MM, Kv2 potassium channels form endoplasmic reticulum/plasma membrane junctions via interaction with VAPA and VAPB. Proceedings of the National Academy of Sciences 115, E7331–E7340 (2018). [DOI] [PMC free article] [PubMed] [Google Scholar]
- 10.Stahley SN, Bartle EI, Atkinson CE, Kowalczyk AP, Mattheyses AL, Molecular organization of the desmosome as revealed by direct stochastic optical reconstruction microscopy. J Cell Sci 129, 2897–2904 (2016). [DOI] [PMC free article] [PubMed] [Google Scholar]
- 11.North AJ, Bardsley WG, Hyam J, Bornslaeger EA, Cordingley HC, Trinnaman B, Hatzfeld M, Green KJ, Magee AI, Garrod DR, Molecular map of the desmosomal plaque. J Cell Sci 112, 4325–4336 (1999). [DOI] [PubMed] [Google Scholar]
- 12.Waterman-Storer CM, Salmon ED, Endoplasmic reticulum membrane tubules are distributed by microtubules in living cells using three distinct mechanisms. Current Biology 8, 798–807 (1998). [DOI] [PubMed] [Google Scholar]
- 13.Terasaki M, Chen LB, Fujiwara K, Microtubules and the endoplasmic reticulum are highly interdependent structures. Journal of Cell Biology 103, 1557–1568 (1986). [DOI] [PMC free article] [PubMed] [Google Scholar]
- 14.Spits M, Heesterbeek IT, Voortman LM, Akkermans JJ, Wijdeven RH, Cabukusta B, Neefjes J, Mobile late endosomes modulate peripheral endoplasmic reticulum network architecture. EMBO Rep 22 (2021), doi: 10.15252/embr.202050815. [DOI] [PMC free article] [PubMed] [Google Scholar]
- 15.Gloushankova NA, Wakatsuki T, Troyanovsky RB, Elson E, Troyanovsky SM, Continual assembly of desmosomes within stable intercellular contacts of epithelial A-431 cells. Cell Tissue Res 314, 399–410 (2003). [DOI] [PubMed] [Google Scholar]
- 16.Hennings H, Holbrook KA, Calcium regulation of cell-cell contact and differentiation of epidermal cells in culture. An ultrastructural study. Exp Cell Res 143, 127–142 (1983). [DOI] [PubMed] [Google Scholar]
- 17.Cooper SM, Burge SM, Darier’s disease: Epidemiology, pathophysiology, and managementAm J Clin Dermatol 4, 97–105 (2003). [DOI] [PubMed] [Google Scholar]
- 18.Hobbs RP, Amargo E. v., Somasundaram A, Simpson CL, Prakriya M, Denning MF, Green KJ, The calcium ATPase SERCA2 regulates desmoplakin dynamics and intercellular adhesive strength through modulation of PKCα signaling. The FASEB Journal 25, 990–1001 (2011). [DOI] [PMC free article] [PubMed] [Google Scholar]
- 19.Zimmer SE, Takeichi T, Conway DE, Kubo A, Suga Y, Akiyama M, Kowalczyk AP, Differential Pathomechanisms of Desmoglein 1 Transmembrane Domain Mutations in Skin Disease. J Invest Dermatol 142, 323–332.e8 (2022). [DOI] [PMC free article] [PubMed] [Google Scholar]
- 20.Jacob JT, Coulombe PA, Kwan R, Omary MB, Types I and II Keratin Intermediate Filaments. Cold Spring Harb Perspect Biol 10, a018275 (2018). [DOI] [PMC free article] [PubMed] [Google Scholar]
- 21.Coulombe PA, Hutton ME, Letal A, Hebert A, Paller AS, Fuchs E, Point mutations in human keratin 14 genes of epidermolysis bullosa simplex patients: Genetic and functional analyses. Cell 66, 1301–1311 (1991). [DOI] [PubMed] [Google Scholar]
- 22.Yoneda K, Furukawa T, Zheng Y-J, Momoi T, Izawa I, Inagaki M, Manabe M, Inagaki N, An Autocrine/Paracrine Loop Linking Keratin 14 Aggregates to Tumor Necrosis Factor α-mediated Cytotoxicity in a Keratinocyte Model of Epidermolysis Bullosa Simplex *. Journal of Biological Chemistry 279, 7296–7303 (2004). [DOI] [PubMed] [Google Scholar]
- 23.Amagai M, Stanley JR, Desmoglein as a target in skin disease and beyond Journal of Investigative Dermatology 132, 776–784 (2012). [DOI] [PMC free article] [PubMed] [Google Scholar]
- 24.Stahley SN, Kowalczyk AP, Desmosomes in acquired disease Cell Tissue Res 360, 439–456 (2015). [DOI] [PMC free article] [PubMed] [Google Scholar]
- 25.Ellebrecht CT, Maseda D, Payne AS, Pemphigus and Pemphigoid: From Disease Mechanisms to Druggable Pathways Journal of Investigative Dermatology 142, 907–914 (2022). [DOI] [PMC free article] [PubMed] [Google Scholar]
- 26.Chung GHC, Lorvellec M, Gissen P, Pichaud F, Burden JJ, Stefan CJ, The ultrastructural organization of endoplasmic reticulum-plasma membrane contacts is conserved in epithelial cells. Mol Biol Cell 33, ar113 (2022). [DOI] [PMC free article] [PubMed] [Google Scholar]
- 27.Joy-Immediato M, Ramirez MJ, Cerda M, Toyama Y, Ravasio A, Kanchanawong P, Bertocchi C, Junctional ER Organization Affects Mechanotransduction at Cadherin-Mediated Adhesions. Front Cell Dev Biol 9, 669086 (2021). [DOI] [PMC free article] [PubMed] [Google Scholar]
- 28.Vogl AW, Lyon K, Adams A, Piva M, Nassour V, The endoplasmic reticulum, calcium signaling and junction turnover in Sertoli cells. Reproduction 155 (2018), doi: 10.1530/rep-17-0281. [DOI] [PubMed] [Google Scholar]
- 29.Hetz C, Zhang K, Kaufman RJ, Mechanisms, regulation and functions of the unfolded protein response. Nat Rev Mol Cell Biol 21, 421–438 (2020). [DOI] [PMC free article] [PubMed] [Google Scholar]
- 30.van Bodegraven EJ, Etienne-Manneville S, Intermediate Filaments from Tissue Integrity to Single Molecule Mechanics. Cells 10, 1905 (2021). [DOI] [PMC free article] [PubMed] [Google Scholar]
- 31.Redmond CJ, Coulombe PA, Intermediate filaments as effectors of differentiation. Curr Opin Cell Biol 68, 155–162 (2021). [DOI] [PMC free article] [PubMed] [Google Scholar]
- 32.Lee CH, Kim MS, Chung BM, Leahy DJ, Coulombe PA, Structural basis for heteromeric assembly and perinuclear organization of keratin filaments. Nat Struct Mol Biol 19, 707–715 (2012). [DOI] [PMC free article] [PubMed] [Google Scholar]
- 33.Jorgens DM, Inman JL, Wojcik M, Robertson C, Palsdottir H, Tsai WT, Huang H, Bruni-Cardoso A, López CS, Bissell MJ, Xu K, Auer M, Deep nuclear invaginations are linked to cytoskeletal filaments - integrated bioimaging of epithelial cells in 3D culture. J Cell Sci 130, 177–189 (2017). [DOI] [PMC free article] [PubMed] [Google Scholar]
- 34.Evtushenko NA, Beilin AK, v Kosykh A, Vorotelyak EA, Gurskaya NG, Keratins as an Inflammation Trigger Point in Epidermolysis Bullosa Simplex. Int J Mol Sci 22, 12446 (2021). [DOI] [PMC free article] [PubMed] [Google Scholar]
- 35.Savignac M, Simon M, Edir A, Guibbal L, Hovnanian A, SERCA2 Dysfunction in Darier Disease Causes Endoplasmic Reticulum Stress and Impaired Cell-to-Cell Adhesion Strength: Rescue by Miglustat. Journal of Investigative Dermatology 134, 1961–1970 (2014). [DOI] [PubMed] [Google Scholar]
- 36.Badu-Nkansah KA, Lechler T, Proteomic analysis of desmosomes reveals novel components required for epidermal integrity. Mol Biol Cell 31, 1140–1153 (2020). [DOI] [PMC free article] [PubMed] [Google Scholar]
- 37.Kremers G-J, Hazelwood KL, Murphy CS, Davidson MW, Piston DW, Photoconversion in orange and red fluorescent proteins. Nat Methods 6, 355–358 (2009). [DOI] [PMC free article] [PubMed] [Google Scholar]
- 38.García-Nafría J, Watson JF, Greger IH, IVA cloning: A single-tube universal cloning system exploiting bacterial In Vivo Assembly. Sci Rep 6, 27459 (2016). [DOI] [PMC free article] [PubMed] [Google Scholar]
- 39.KowalczykLab/Desmosome-ER/ (2023), doi: 10.5281/zenodo.6800360. [DOI] [Google Scholar]
- 40.Calkins CC, Setzer S. v., Jennings JM, Summers S, Tsunoda K, Amagai M, Kowalczyk AP, Desmoglein Endocytosis and Desmosome Disassembly Are Coordinated Responses to Pemphigus Autoantibodies *. Journal of Biological Chemistry 281, 7623–7634 (2006). [DOI] [PubMed] [Google Scholar]
- 41.Schell SL, Cong Z, Sennett ML, Gettle SL, Longenecker AL, Goldberg SR, Kirby JS, Helm MF, Nelson AM, Keratinocytes and immune cells in the epidermis are key drivers of inflammation in hidradenitis suppurativa providing a rationale for novel topical therapies. British Journal of Dermatology 00, 1–13 (2022). [DOI] [PubMed] [Google Scholar]
- 42.Baddam S, Arsenovic P, Narayanan V, Duggan N, Mayer C, Newman S, Abutaleb D, Mohan A, Kowalczyk A, Conway D, The Desmosomal Cadherin Desmoglein-2 Experiences Mechanical Tension as Demonstrated by a FRET-Based Tension Biosensor Expressed in Living Cells. Cells 7, 66 (2018). [DOI] [PMC free article] [PubMed] [Google Scholar]
- 43.Tsunoda K, Ota T, Aoki M, Yamada T, Nagai T, Nakagawa T, Koyasu S, Nishikawa T, Amagai M, Induction of Pemphigus Phenotype by a Mouse Monoclonal Antibody Against the Amino-Terminal Adhesive Interface of Desmoglein 3. The Journal of Immunology 170, 2170–2178 (2003). [DOI] [PubMed] [Google Scholar]
- 44.Saito M, Stahley SN, Caughman CY, Mao X, Tucker DK, Payne AS, Amagai M, Kowalczyk AP, Signaling Dependent and Independent Mechanisms in Pemphigus Vulgaris Blister Formation. PLoS One 7, 50696 (2012). [DOI] [PMC free article] [PubMed] [Google Scholar]
- 45.Stahley SN, Warren MF, Feldman RJ, Swerlick RA, Mattheyses AL, Kowalczyk AP, Super-Resolution Microscopy Reveals Altered Desmosomal Protein Organization in Tissue from Patients with Pemphigus Vulgaris. Journal of Investigative Dermatology 136, 59–66 (2016). [DOI] [PMC free article] [PubMed] [Google Scholar]
- 46.Gustafsson MG, Shao L, Carlton PM, Wang CJ, Golubovskaya IN, Cande WZ, Agard DA, Sedat JW, Three-dimensional resolution doubling in wide-field fluorescence microscopy by structured illumination. Biophys J 94, 4957–4970 (2008). [DOI] [PMC free article] [PubMed] [Google Scholar]
- 47.Xu CS, Hayworth KJ, Lu Z, Grob P, Hassan AM, García-Cerdán JG, Niyogi KK, Nogales E, Weinberg RJ, Hess HF, Enhanced FIB-SEM systems for large-volume 3D imaging. Elife 6 (2017), doi: 10.7554/elife.25916. [DOI] [PMC free article] [PubMed] [Google Scholar]
- 48.Lowe DG, Distinctive image features from scale-invariant keypoints. Int J Comput Vis 60, 91–110 (2004). [Google Scholar]
- 49.Saalfeld S, Fetter R, Cardona A, Tomancak P, Elastic volume reconstruction from series of ultra-thin microscopy sections. Nature Methods 2012 9:7 9, 717–720 (2012). [DOI] [PubMed] [Google Scholar]
- 50.Preibisch S, Saalfeld S, Tomancak P, Globally optimal stitching of tiled 3D microscopic image acquisitions. Bioinformatics 25, 1463 (2009). [DOI] [PMC free article] [PubMed] [Google Scholar]
- 51.Pietzsch T, Saalfeld S, Preibisch S, Tomancak P, BigDataViewer: visualization and processing for large image data sets. Nature Methods 2015 12:6 12, 481–483 (2015). [DOI] [PubMed] [Google Scholar]
- 52.Schindelin J, Arganda-Carreras I, Frise E, Kaynig V, Longair M, Pietzsch T, Preibisch S, Rueden C, Saalfeld S, Schmid B, Tinevez J-Y, White DJ, Hartenstein V, Eliceiri K, Tomancak P, Cardona A, Fiji: an open-source platform for biological-image analysis. Nat Methods 9, 676–682 (2012). [DOI] [PMC free article] [PubMed] [Google Scholar]
- 53.Klein S, Staring M, Murphy K, Viergever MA, Pluim JPW, Elastix: A toolbox for intensity-based medical image registration. IEEE Trans Med Imaging 29, 196–205 (2010). [DOI] [PubMed] [Google Scholar]
- 54.Heinrich L, Bennett D, Ackerman D, Park W, Bogovic J, Eckstein N, Petruncio A, Clements J, Pang S, Xu CS, Funke J, Korff W, Hess HF, Lippincott-Schwartz J, Saalfeld S, v Weigel A, Ali R, Arruda R, Bahtra R, Nguyen D, Whole-cell organelle segmentation in volume electron microscopy. Nature 599, 141–146 (2021). [DOI] [PubMed] [Google Scholar]
- 55.Belevich I, Joensuu M, Kumar D, Vihinen H, Jokitalo E, Microscopy Image Browser: A Platform for Segmentation and Analysis of Multidimensional Datasets. PLoS Biol 14, e1002340 (2016). [DOI] [PMC free article] [PubMed] [Google Scholar]
- 56.Dragonfly 2020.2 [Computer software] Object Research Systems (ORS) Inc, Montreal, Canada (2020) (available at http://www.theobjects.com/dragonfly).
- 57.Waskom ML, seaborn: statistical data visualization. J Open Source Softw 6, 3021 (2021). [Google Scholar]
- 58.T. pandas development Team, pandas-dev/pandas: Pandas. (v1.5.3) (2023), doi: 10.5281/ZENODO.7549438. [DOI] [Google Scholar]
- 59.Mckinney W, Data Structures for Statistical Computing in Python. Proceedings of the 9th Python in Science Conference, 56–61 (2010). [Google Scholar]
- 60.Hunter JD, Matplotlib: A 2D graphics environment. Comput Sci Eng 9, 90–95 (2007). [Google Scholar]
- 61.Krull A, Buchholz TO, Jug F, Noise2void-Learning denoising from single noisy images. Proceedings of the IEEE Computer Society Conference on Computer Vision and Pattern Recognition 2019-June, 2124–2132 (2019). [Google Scholar]
- 62.Chen J, Sasaki H, Lai H, Su Y, Liu J, Wu Y, Zhovmer A, Combs CA, Rey-Suarez I, Chang H-Y, Huang CC, Li X, Guo M, Nizambad S, Upadhyaya A, Lee S-JJ, Lucas LAG, Shroff H, Three-dimensional residual channel attention networks denoise and sharpen fluorescence microscopy image volumes. Nat Methods 18, 678–687 (2021). [DOI] [PubMed] [Google Scholar]
- 63.Laine RF, Tosheva KL, Gustafsson N, Gray RDM, Almada P, Albrecht D, Risa GT, Hurtig F, Lindås A-C, Baum B, Mercer J, Leterrier C, Pereira PM, Culley S, Henriques R, NanoJ: a high-performance open-source super-resolution microscopy toolbox. J Phys D Appl Phys 52, 163001 (2019). [DOI] [PMC free article] [PubMed] [Google Scholar]
- 64.Eva Höck AF, Tim-Oliver Buchholz, Anselm Brachmann, Florian Jug, N2V2 - Fixing Noise2Void Checkerboard Artifacts with Modified Sampling Strategies and a Tweaked Network Architecture (2022). [Google Scholar]
- 65.Sofroniew N, Lambert T, Evans K, Nunez-Iglesias J, Bokota G, Winston P, Peña-Castellanos G, Yamauchi K, Bussonnier M, Doncila Pop D, Can Solak A, Liu Z, Wadhwa P, Burt A, Buckley G, Sweet A, Migas L, Hilsenstein V, Gaifas L, Bragantini J, Rodríguez-Guerra J, Muñoz H, Freeman J, Boone P, Lowe A, Gohlke C, Royer L, PIERRÉ A, Har-Gil H, McGovern A, napari: a multi-dimensional image viewer for Python (v0.4.16) (2022), doi: 10.5281/ZENODO.7276432. [DOI] [Google Scholar]
- 66.Berg S, Kutra D, Kroeger T, Straehle CN, Kausler BX, Haubold C, Schiegg M, Ales J, Beier T, Rudy M, Eren K, Cervantes JI, Xu B, Beuttenmueller F, Wolny A, Zhang C, Koethe U, Hamprecht FA, Kreshuk A, ilastik: interactive machine learning for (bio)image analysis. Nat Methods 16, 1226–1232 (2019). [DOI] [PubMed] [Google Scholar]
Associated Data
This section collects any data citations, data availability statements, or supplementary materials included in this article.
Supplementary Materials
Data Availability Statement
All macros and plasmid maps are available at https://doi.org/10.5281/zenodo.6800360 (39). FIB-SEM datasets are hosted on: https://www.openorganelle.org/datasets/aic_desmosome-2 and https://www.openorganelle.org/datasets/aic_desmosome-3. Other imaging source data, including spinning disk confocal microscopy data, is hosted on ScholarSphere (doi:10.26207/53vq-g344). Source data for graphs and western blots are provided with this paper. All other data supporting the findings of this study are available from the corresponding author on reasonable request.