

Abstract
Multimodal optical techniques are useful for comprehensive characterization of material properties. In this work, we developed a new multimodal technology that can simultaneously measure a subset of mechanical, optical, and acoustical properties of the sample, which is based on the integration of Brillouin (Br) and photoacoustic (PA) microscopy. The proposed technique can acquire co-registered Br and PA signals of the sample. Importantly, using synergistic measurements of sound speed and Brillouin shift, the modality offers a new approach to quantifying the optical refractive index, which is a fundamental property of material and is not accessible by either technique individually. As a proof-of-concept, we demonstrated the feasibility of integrating the two modalities and acquired the colocalized Br and time-resolved PA signals in a synthetic phantom made out of kerosene and CuSO4 aqueous solution. In addition, we measured the refractive index of saline solutions and validated the result. The comparison with previously reported data showed a relative error of 0.3 %. This further allows us to directly quantify longitudinal modulus of the sample with the colocalized Brillouin shift. While the scope of current work is limited to introducing the combined Br-PA setup for the first time, we envision this multimodal modality could open a new way for multi-parametric analysis of material properties.
Photoacoustic (PA) microscopy is a rapidly growing modality with the ability to acquire high-contrast functional and molecular images of samples at relatively large depths compared to conventional optical techniques [1–3]. In PA microscopy, the absorption of light energy in the form of short laser pulses generates acoustic waves caused by rapid thermoelastic expansion [1]. The consequent acoustic waves can be collected by acoustic detectors such as an ultrasound transducer or a hydrophone to form PA images. The amplitude of the detected PA signal represents the optical absorption and scattering properties of the material. In addition, using PA microscopy, an important acoustic property of the material, namely the speed of sound (SOS), can be obtained by calculating the time-of-flight (TOF) of the PA signal, with prior knowledge of the physical distance between the detector and the location of the excitation beam.
Confocal Brillouin microscopy is an emerging optical modality for quantifying the mechanical properties of materials with a diffraction-limit resolution [4–7]. The principle of Brillouin microscopy is based on spontaneous Brillouin scattering, where the interaction of incident light and the inherent acoustic wave from thermal fluctuation within the sample introduces a frequency shift (i.e., Brillouin shift ) to the scattered light. The Brillouin shift at 90° geometry is physically determined by , where is the laser wavelength, is the refractive index, is the sample’s density, and is the elastic longitudinal modulus. With a known refractive index and density, the sample’s mechanical properties can be directly quantified with the Brillouin shift measured by a Brillouin spectrometer [8].
Currently, Brillouin microscope mainly use the Brillouin shift to estimate the relative change of longitudinal modulus, with the assumption that the ratio of refractive index and density is approximately constant [5, 9–13]. However, for benchmarking and comparison across studies, direct quantification of the absolute value of longitudinal modulus is needed, which requires the colocalized measurement of refractive index and/or mass density of the material. Recently, two methods, including a dual-geometry Brillouin microscopy [14] and a multimodal modality that combines Brillouin microscopy with optical diffraction tomography [15], have been demonstrated for this purpose.
In this work, we report for the first time a proof-of-concept multimodal optical modality by combining PA and Brillouin microscopy. In this hybrid modality, two laser beams were coupled into a common optical path for collecting the Brillouin and time-resolved PA signals from the same spot simultaneously. Therefore, this new modality allows us to acquire the colocalized mechanical, optical, and acoustic properties of the material for comprehensive characterization. Intriguingly, using the SOS () derived from the PA signal, we can directly quantify the refractive index from the measured Brillouin shift based on the relationship of , which further allows us to quantify the longitudinal modulus based on the two-substance mixture model [16–18]. It is worth highlighting that the quantitative measurement of longitudinal modulus can only be achieved by the integrated system rather than by Brillouin or PA modality individually.
Figure 1 shows the schematic of the multimodal PA-Brillouin microscopic system. A 780-nm continuous-wave (CW) laser (DL pro, Toptica) was used as the light source for Brillouin scattering. The laser beam first went through an isolator to avoid possible back-reflection. A variable ND filter was used to adjust the output power of the laser, and a half-wave plate (HWP1) was used to adjust the polarization state of the beam to be p-polarized. Using a pair of lenses (L1, f = 30 mm and L2, f = 150 mm), the diameter of the laser beam was expanded from 2.38 mm to 11.90 mm. After passing through the second polarized beam splitter (PBS2), the mirror M1, and a half-wave plate (HWP3), the laser beam was focused into the sample cell (1-cm square cuvette) by lens L3 (f = 75 mm), with a focused spot of 6.26 μm. An in-house-built Brillouin spectrometer was used to collect the Brillouin signal at 90° geometry. The light source for PA excitation, emitted from a tunable nanosecond pulsed laser (OPOTEK, Phocus Mobile), was tuned to the wavelength of 780 nm and had a beam diameter of ~8 mm. Since the emitted light from the pulsed laser is randomly polarized, a polarized beam splitter (PBS1) was used first to obtain a linearly p-polarized beam. After adjusting the polarization orientation of the PA beam to s-polarized with a half-wave plate (HWP2), the PA beam was coupled into the optical path of the Brillouin beam using PBS2 and focused into the sample cell with a spot size of 9.31 μm in diameter. The half-wave plate (HWP3) was used to further adjust the Brillouin beam and PA beam to s-polarized and p-polarized, respectively. Since 90° scattering geometry is sensitive to s-polarized light but has no response to p-polarized light [19], our design can generate a strong Brillouin signal while avoiding any crosstalk from the PA excitation beam.
Fig. 1.
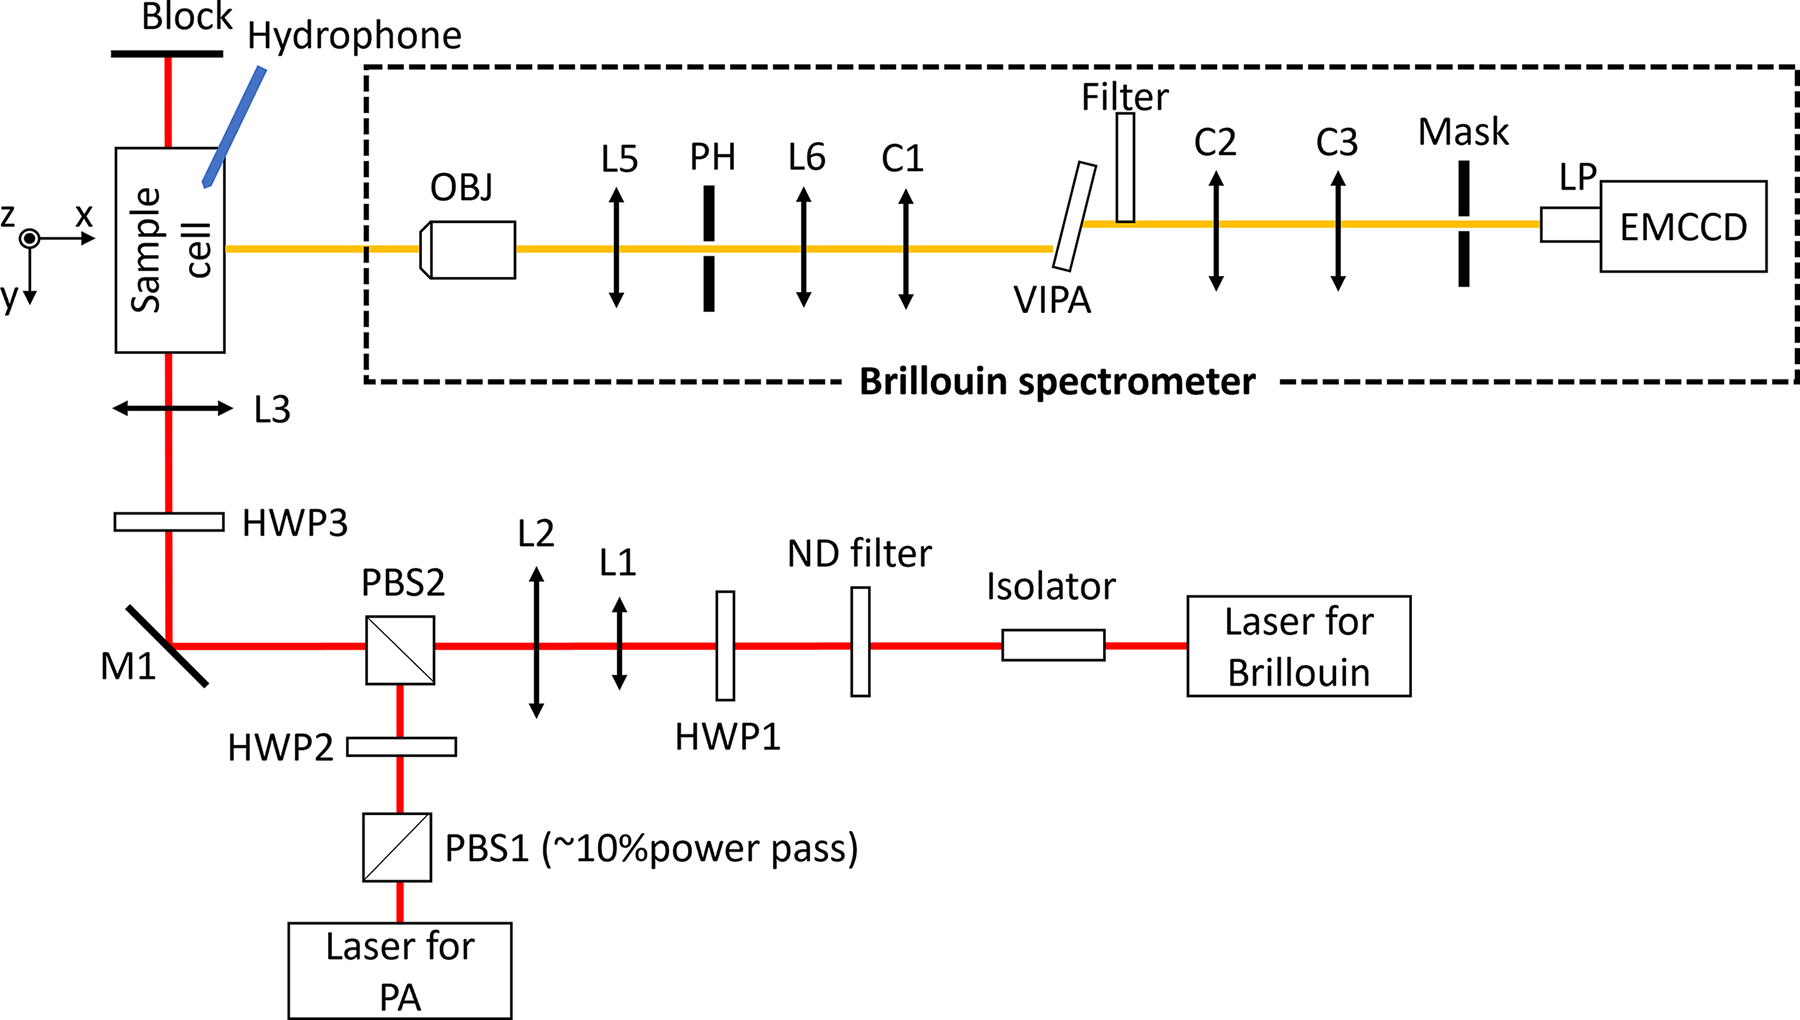
Schematic of the multimodal modality based on Brillouin and PA techniques. HWP1-HWP3: half-wave plates; PBS1-PBS2: polarized beam splitter; L1-L5: lenses; OBJ: objective; PH: pin hole; C1-C3: cylindrical lenses; LP: lens pair; EMCCD: electron multiplying charge-coupled devices.
The generated PA signal was detected by a needle hydrophone (Onda, HNP-0400, 1 – 20 MHz) that was inserted into the sample cell and closely distanced from the focal point (~ 4 mm). Meanwhile, the Brillouin signal was measured by a virtually imaged phased array (VIPA)-based Brillouin spectrometer. Upon being collected by an objective (OBJ, 4x/0.1), the Brillouin signal passed through a confocal unit consisting of two lenses and an adjustable pinhole (L5, f = 19 mm; L6, f = 80; and PH: adjustable pinhole), through which the Brillouin signal out of the focal plane will be rejected. A cylindrical lens (C1, f = 200 mm) was used to couple the Brillouin beam into the VIPA etalon (FSR=15 GHz, LightMachinery). A Filter (continuous ND filter, Thorlabs) was used for apodization. The output beam of the VIPA was reshaped by the cylindrical lenses C2 (f = 150 mm) and C3 (f = 75 mm) and then projected onto the mask. A lens pair (LP, 1:1, f = 30.0 mm) was used to image the Brillouin spectrum onto an electron-multiplying charge-coupled devices (EMCCD) camera (iXon, Andor). Before experiments, the spectrometer was calibrated using standard materials (i.e., water and methanol) based on established protocol [7]. For accurate alignment of two laser beams, several tunable iris diaphragms were placed into the beam path to check the beam location. This ensures the overlap of two beam spots at the focal plane, which can be confirmed by imaging from the side.
To evaluate the colocalization of the multimodal PA and Brillouin signals, we conducted an experiment in which a synthetic phantom (Fig. 2(a)) made of 1% copper sulfate solution (CuSO4) and kerosene was scanned to acquire both PA and Brillouin profiles across the sample. For the Brillouin measurement, the laser power was 27 mW at the focal plane, and the acquisition time of the spectrometer was 50 ms. For PA measurement, the average energy of the laser pulse was 1.4 mJ at a repetition rate of 10 Hz. Fig. 2 (b) and (c) show the representative Brillouin shift and PA amplitude for CuSO4 solution and kerosene, respectively. The sample cell was carried by a translation stage and was scanned manually along the z-direction with a total travel range of 1.75 mm and a step size of 0.25 mm. At each position, 100 frames of Brillouin and PA signal were collected for calculating the average Brillouin shift and PA peak-to-peak amplitude. Fig. 3 shows the colocalized Brillouin and PA signals across the interface of two materials. The co-registered trend for Brillouin and PA curves confirms that both the Brillouin beam and PA beam share the same focal point of the setup. At the transition zone, the decrease of PA signal amplitude as well as the Brillouin shift is mainly due to the beam distortion caused by the curved interface of two liquids (Fig. 2(a)). The step size is limited by the resolution of the manual translational stage.
Fig. 2.
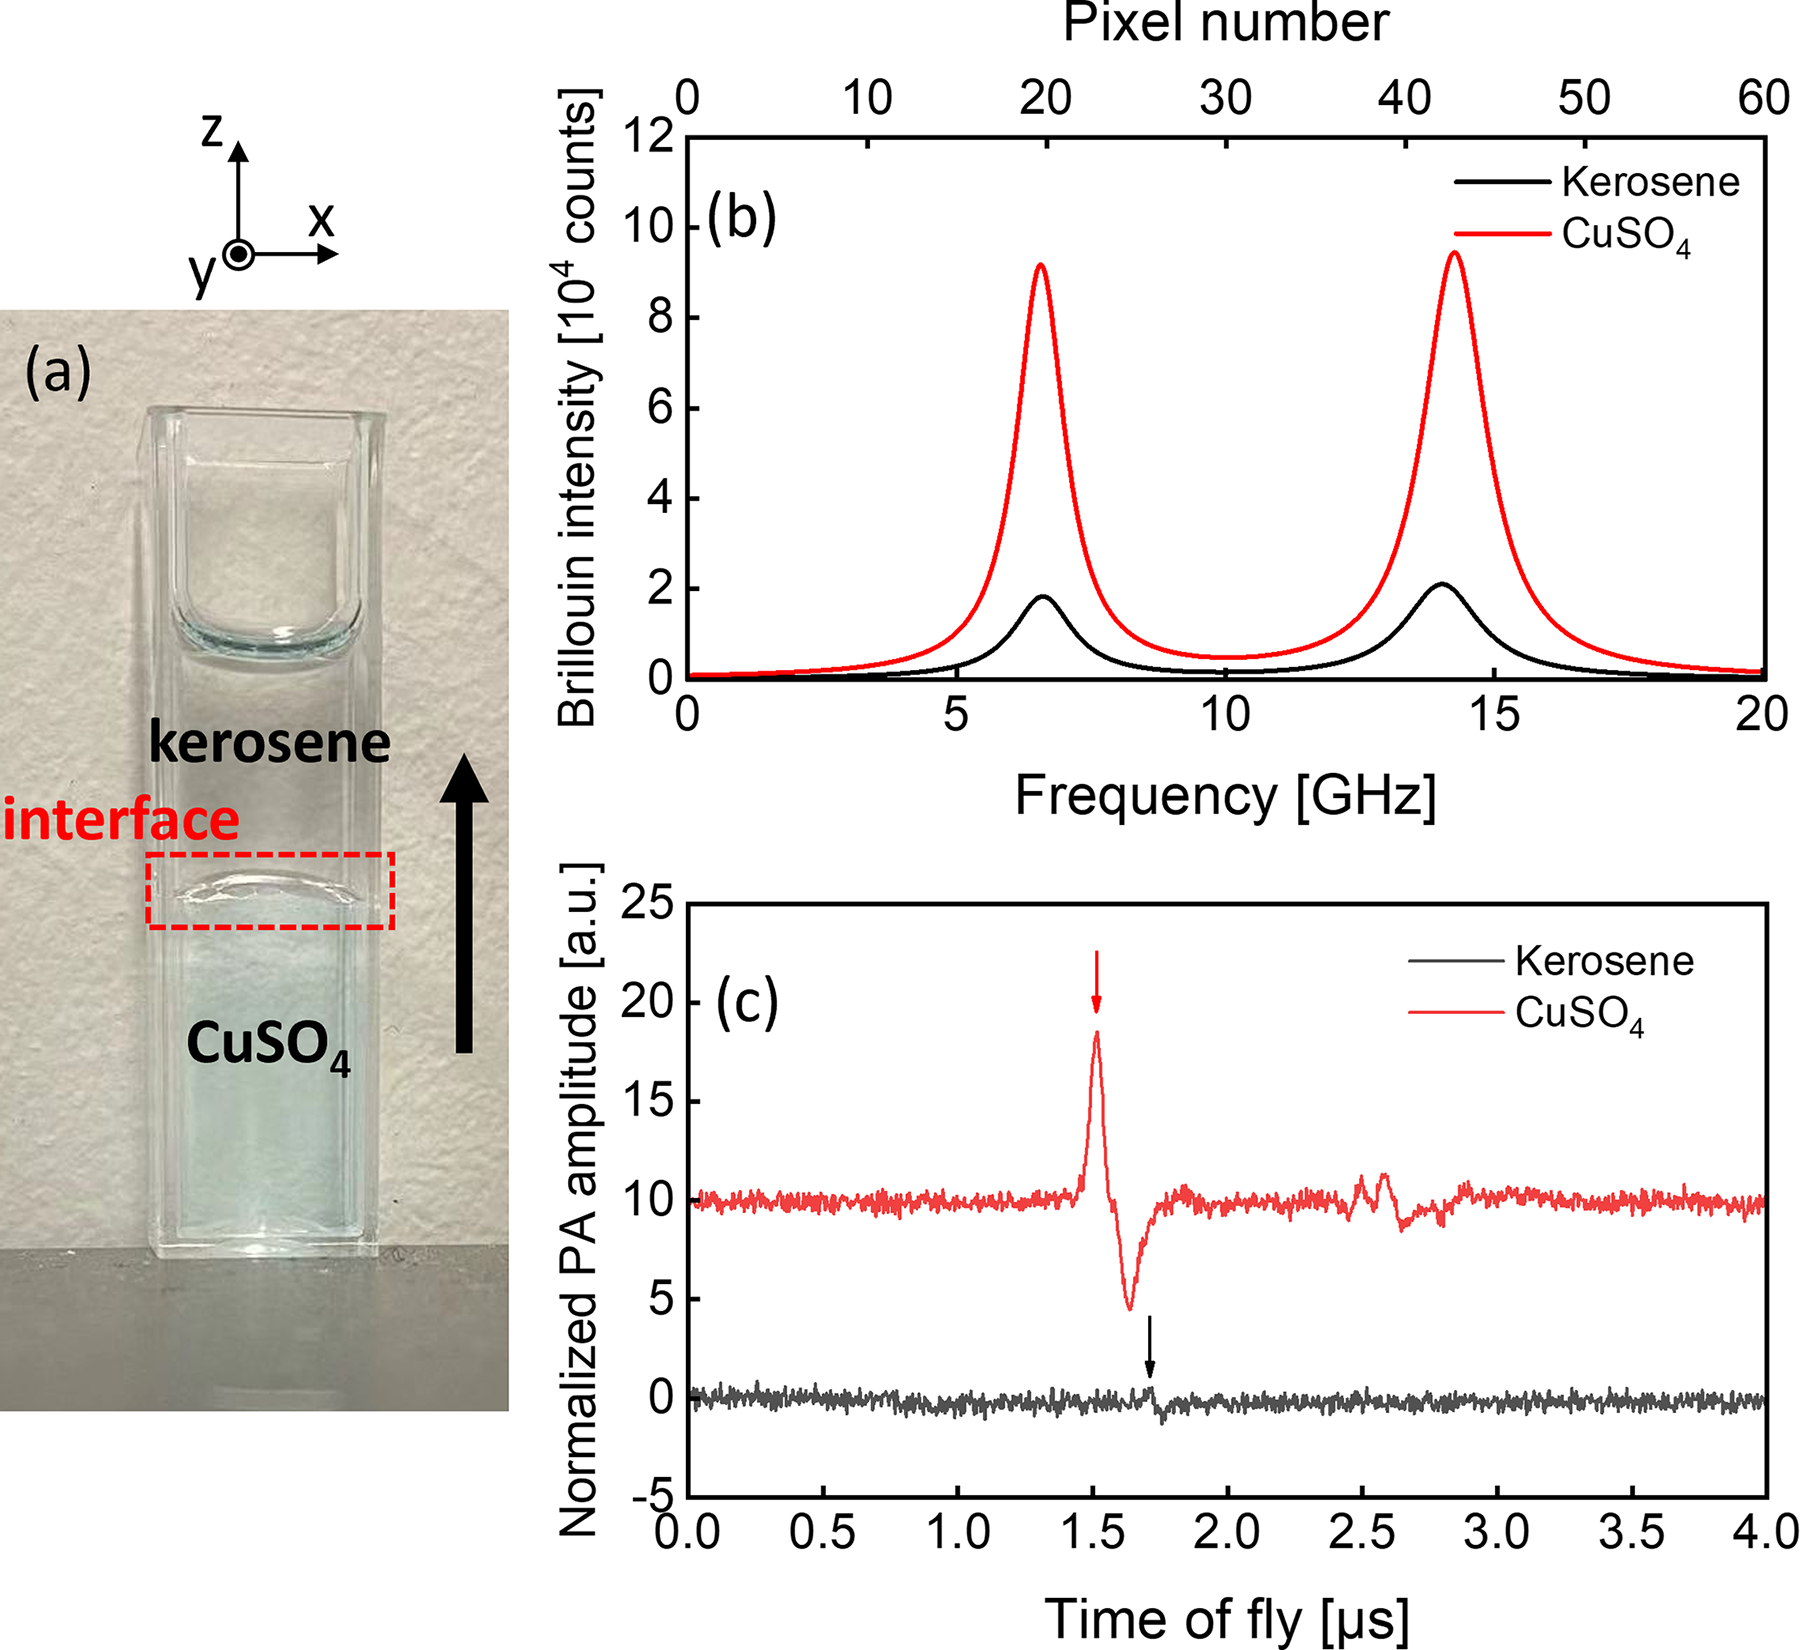
Experimental sample and signals. (a) Photo of the stratified sample with the scan direction. (b) Raw Brillouin and (c) PA signal (single measurement) of CuSO4 and kerosene. Arrows indicate the PA signal peak.
Fig. 3.
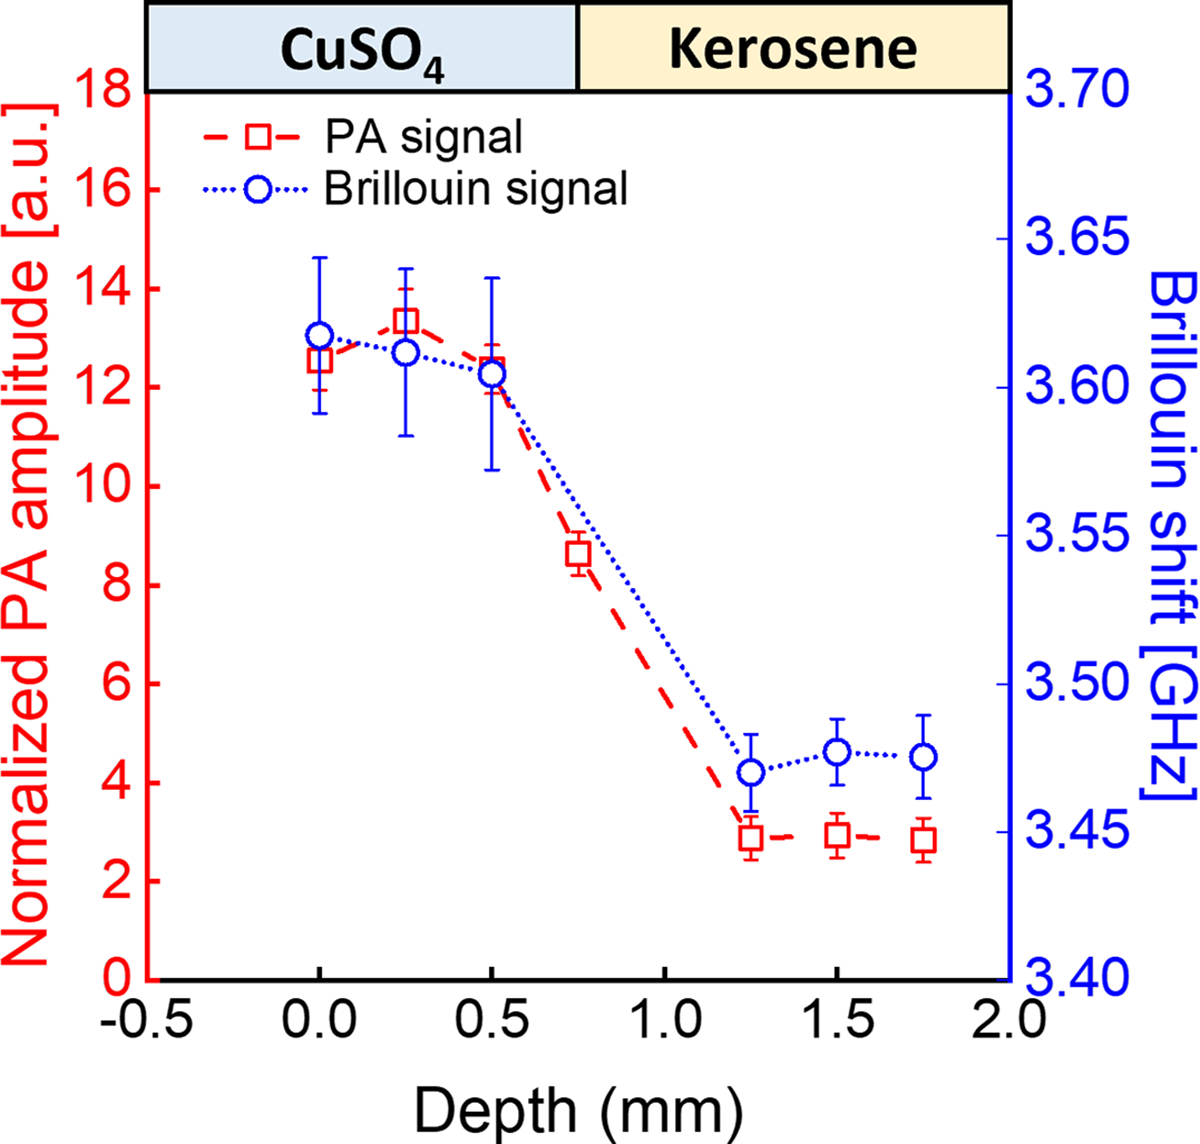
Result of 1D scanning. Vertical 1-D profiling of the stratified CuSO4-kerosene sample based on Brillouin shift and PA amplitude. Error bars are standard deviation for 100 times measurement.
We further explored the ability of the developed multimodal modality to directly measure the refractive index. To do so, we prepared three saline solutions: the weight/weight concentrations are 0% (deionized water), 4.76%, and 16.67%, respectively. The SOS is directly measured through consecutive PA acquisitions, where the distance between the detecting hydrophone and the beam spot was changed with the pre-set value of . The time delay between the TOFs of these two consecutive PA acquisitions was measured as (Fig. 4(a)), allowing sound speed calculation through . For each sample, the transducer was moved to four positions in sequence, with a distance of 0.25 mm in each movement (moving accuracy: ±0.02 mm). At each position, the PA signal was averaged 100 times, and the primary positive peak was used to quantify the arrival time. The value of was then calculated from all datasets by linear regression using the least squares method (Fig. 4 (b)). Simultaneously, Brillouin shift of the sample was calculated as described earlier. Therefore, the refractive index of the sample can be calculated by
| (1) |
with For each sample, we repeated the measurements three times for both PA and Brillouin, and the averaged values of the refractive index with the standard error of the mean were shown in Fig. 5. The measured refractive index was compared with the results from Fiore et al. using dual-geometry Brillouin spectroscopy at 532 nm [14] and from Esteban et al. using a fiber-optic sensor at 780 nm [20]. Taking the average of the literature data (Fiore’s data were corrected based on water’s refractive index at 780 nm and 20.7°C) as a reference, our results show a discrepancy of 0.0041 (0.31%), 0.0029 (0.22%), and 0.0042 (0.31%), respectively, suggesting a good agreement. Based on the colocalized measurement of Brillouin shift and refractive index, we also derived the longitudinal modulus of the sample (Fig. 5).
Fig. 4.
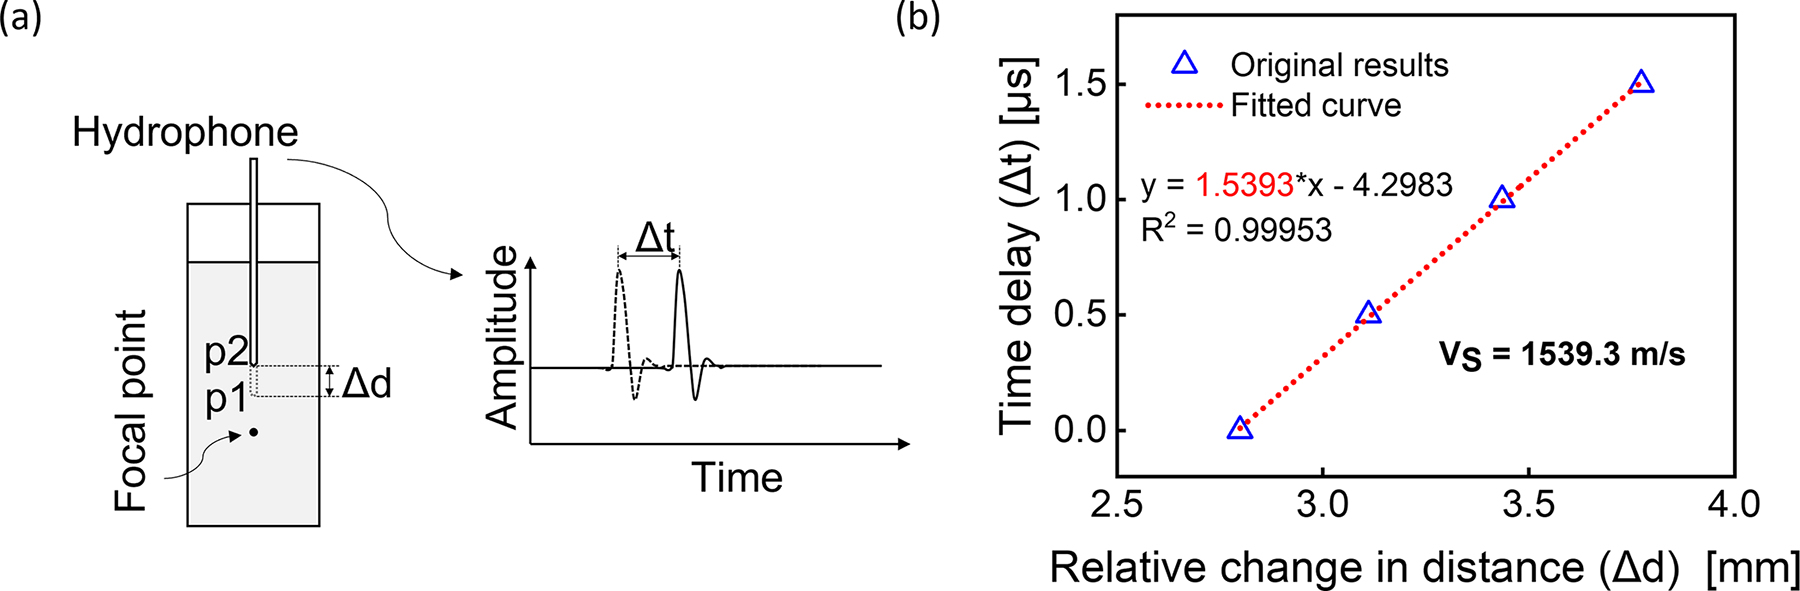
Speed of sound measurement. (a) the schematic for measuring SOS; (b) the regression result from the measurement on 4.76% saline.
Fig. 5.
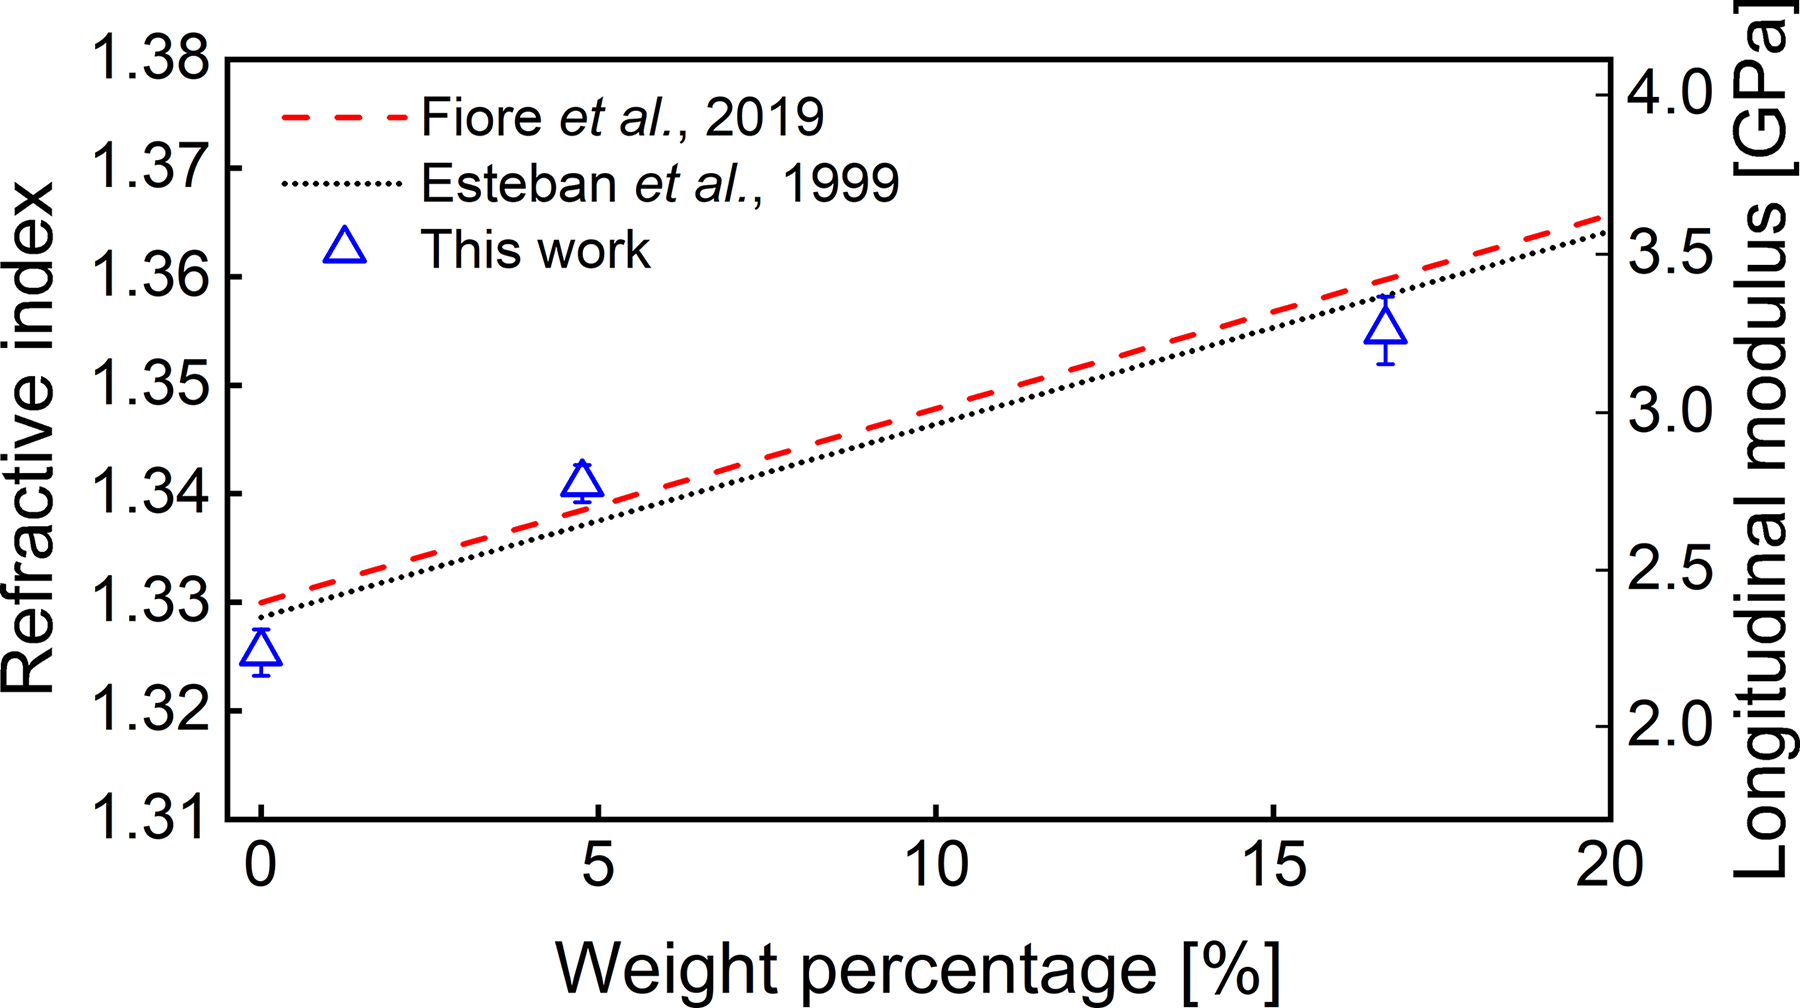
Measured refractive index and longitudinal modulus of saline solutions. Error bar represents standard error of the mean.
Since Brillouin microscopy probes the acoustic phonon at the GHz frequency band while the PA signal is in the MHz band, the possible acoustic dispersion of the sample may introduce an artifact to the measured refractive index. To estimate the acoustic dispersion, we calculated the phonon velocity at GHz derived from the Brillouin measurements using the reported value of the refractive index [20] and compared it with PA measurements at MHz. The result is summarized in Table 1, where the relative discrepancy between the two datasets is within 0.4%, indicating that the acoustic dispersion in our samples is negligible. This is also consistent with several previously reported studies in which the SOS in pure water and saline has a variety of less than 0.3% as the frequency spans from 0.5 MHz to 1.5 GHz [21–25]. In addition, a linear behavior (i.e., no dispersion) of the sound wave has been found in many (bio)polymers [14], indicating the potential application of our multimodal modality in biomaterials and biological samples. For materials in which acoustic dispersion is prominent, prior knowledge of dispersion behavior is needed for accurate measurement of the refractive index.
Table 1.
Comparison of SOS results calculated by Brillouin and PA (with standard errors).
| Weight percentage | Brillouin results [m/s] @3.6 GHz | PA fitting results [m/s] @1–20 MHz |
|---|---|---|
|
| ||
| 0% | 1484.02±2.33 | 1480.80±0.54 |
| 4.76% | 1541.02±0.60 | 1534.84±1.87 |
| 16.67% | 1675.13±3.40 | 1669.95±1.81 |
Here we used a homogenous sample to demonstrate the ability of the proof-of-concept prototype and to validate the feasibility and accuracy of refractive index measurement. In fact, the developed multi-modal modality can also be used for inhomogeneous conditions such as multi-layered samples. In this case, the thickness of each layer can be first obtained from Brillouin’s results. While keeping the PA detector still, the movement of the beam spot into different layers will introduce the time delay to the PA signal, which is a function of SOS for each layer. Therefore, the SOS of each layer can be derived by solving a set of multivariate equations. Together with the Brillouin signals, the refractive index of each layer can be measured.
While the current prototype utilized two separate laser sources for generating Brillouin and PA signals, a single laser source could be used for both BA and Br microscopy in case a pulse laser with narrow linewidth and nanosecond pulse width is available. In the present work, PA measurement was conducted in transmission mode, and Brillouin signal was collected at 90° geometry. This configuration needs a cuvette to hold the sample, and the sample preparation can be adapted from existing protocols used in light-sheet microscopy. Alternatively, the setup can be modified into a reflection mode (i.e., 180° geometry) by integrating with the existing designs of inverted confocal Brillouin microscopy and PA microscopy [26], which will allow easy access to biological samples prepared in a standard petri dish. Furthermore, since the density of many biological materials can be calculated from the refractive index based on a two-substance mixture model [16–18], colocalized measurement of refractive index and Brillouin shift will allow the direct quantification of longitudinal modulus.
Colocalized Brillouin-PA measurement offers unique advantage for accurate and reliable characterization of complicated biomedical processes. For instance, it potentially can simultaneously acquire the biomechanical information and the metabolic activities during tumorigenesis and metastasis [27], allowing the comprehensive understanding of the heterogeneity of tumor microenvironment. Broadly, the multimodal modality can provide complementary (i.e., biomechanical and optical) contrast mechanisms, which can improve the sensitivity and specificity in material and tissue characterization, leading to more accurate diagnosis [28–31].
In summary, we proposed a versatile multimodal modality based on the combination of Brillouin microscopy and PA system. The integrated system with a common focal point for both Brillouin and PA beam was designed to simultaneously obtain samples’ mechanical, optical, and acoustical properties. Importantly, the integrated system provides a new way to probe the sample’s refractive index, which is not accessible by each individual technique. Together, the proposed multimodal Brillouin and PA system can provide multi-parametric analysis for comprehensive material characterization.
Acknowledgments.
The authors would like to thank Dr. Matthew O’Donnell from the University of Washington for discussions and valuable feedback on sound speed measurement studies presented in this work. We also want to thank Dr. Antonio Fiore from HHMI Janelia Research Campus for providing raw data of refractive index measurements with dual-geometry Brillouin microscopy.
Funding.
National Institutes of Health (K25HD097288); National Institutes of Health (R01EB030058), University Research Grant of Wayne State University; Richard Barber Interdisciplinary Research Program.
Footnotes
Disclosures. A provisional patent application related to this research has been filed by Wayne State University patent office for J.Z., C.S., Y.Y., and M. M.
Data availability.
Data underlying the results presented in this paper are not publicly available at this time but may be obtained from the authors upon reasonable request.
References
- 1.Bell AG, “The photophone,” Science, 130–134 (1880). [DOI] [PubMed] [Google Scholar]
- 2.Xu M, and Wang LV, “Photoacoustic imaging in biomedicine,” Rev. Sci. Instrum. 77, 041101 (2006). [Google Scholar]
- 3.Mehrmohammadi M, Joon Yoon S, Yeager D, and Y Emelianov S, “Photoacoustic imaging for cancer detection and staging,” Curr. Mol. Imaging 2, 89–105 (2013). [DOI] [PMC free article] [PubMed] [Google Scholar]
- 4.Scarcelli G, and Yun SH, “Confocal Brillouin microscopy for three-dimensional mechanical imaging,” Nat. Photonics 2, 39–43 (2008). [DOI] [PMC free article] [PubMed] [Google Scholar]
- 5.Scarcelli G, Polacheck WJ, Nia HT, Patel K, Grodzinsky AJ, Kamm RD, and Yun SH, “Noncontact three-dimensional mapping of intracellular hydromechanical properties by Brillouin microscopy,” Nat. methods 12, 1132–1134 (2015). [DOI] [PMC free article] [PubMed] [Google Scholar]
- 6.Prevedel R, Diz-Muñoz A, Ruocco G, and Antonacci G, “Brillouin microscopy: an emerging tool for mechanobiology,” Nat. methods 16, 969–977 (2019). [DOI] [PubMed] [Google Scholar]
- 7.Zhang J, and Scarcelli G, “Mapping mechanical properties of biological materials via an add-on Brillouin module to confocal microscopes,” Nat. Protoc. 16, 1251–1275 (2021). [DOI] [PMC free article] [PubMed] [Google Scholar]
- 8.Dil JG, “Brillouin scattering in condensed matter,” Rep. Prog. Phys. 45, 285 (1982). [Google Scholar]
- 9.Scarcelli G, Kim P, and Yun SH, “In vivo measurement of age-related stiffening in the crystalline lens by Brillouin optical microscopy,” Biophys. J. 101, 1539–1545 (2011). [DOI] [PMC free article] [PubMed] [Google Scholar]
- 10.Scarcelli G, Pineda R, and Yun SH, “Brillouin optical microscopy for corneal biomechanics,” Invest. Ophthalmol. Vis. Sci. 53, 185–190 (2012). [DOI] [PMC free article] [PubMed] [Google Scholar]
- 11.Antonacci G, and Braakman S, “Biomechanics of subcellular structures by non-invasive Brillouin microscopy,” Sci. Rep. 6, 37217 (2016). [DOI] [PMC free article] [PubMed] [Google Scholar]
- 12.Zhang J, Raghunathan R, Rippy J, Wu C, Finnell RH, Larin KV, and Scarcelli G, “Tissue biomechanics during cranial neural tube closure measured by Brillouin microscopy and optical coherence tomography,” Birth Defects Res. 111, 991–998 (2019). [DOI] [PMC free article] [PubMed] [Google Scholar]
- 13.Zhang J, Alisafaei F, Nikolić M, Nou XA, Kim H, Shenoy VB, and Scarcelli G, “Nuclear mechanics within intact cells is regulated by cytoskeletal network and internal nanostructures,” Small 16, 1907688 (2020). [DOI] [PMC free article] [PubMed] [Google Scholar]
- 14.Fiore A, Bevilacqua C, and Scarcelli G, “Direct three-dimensional measurement of refractive index via dual photon-phonon scattering,” Phys. Rev. Lett. 122, 103901 (2019). [DOI] [PMC free article] [PubMed] [Google Scholar]
- 15.Schlüßler R, Kim K, Nötzel M, Taubenberger A, Abuhattum S, Beck T, Müller P, Maharana S, Cojoc G, and Girardo S, “Correlative all-optical quantification of mass density and mechanics of subcellular compartments with fluorescence specificity,” Elife 11, e68490 (2022). [DOI] [PMC free article] [PubMed] [Google Scholar]
- 16.Barer R, Ross KFA, and Tkaczyk S, “Refractometry of living cells,”Nature 171, 720–724 (1953). [DOI] [PubMed] [Google Scholar]
- 17.Schürmann M, Scholze J, Müller P, Guck J, and Chan CJ, “Cell nuclei have lower refractive index and mass density than cytoplasm,” J. Biophotonics 9, 1068–1076 (2016). [DOI] [PubMed] [Google Scholar]
- 18.Bailey M, Alunni-Cardinali M, Correa N, Caponi S, Holsgrove T, Barr H, Stone N, Winlove CP, Fioretto D, and Palombo F, “Viscoelastic properties of biopolymer hydrogels determined by Brillouin spectroscopy: A probe of tissue micromechanics,” Sci. Adv. 6, eabc1937 (2020). [DOI] [PMC free article] [PubMed] [Google Scholar]
- 19.Boyd RW, Nonlinear optics (Academic press, 2020). [Google Scholar]
- 20.Esteban O, Cruz-Navarrete M, González-Cano A, and Bernabeu E, “Measurement of the degree of salinity of water with a fiber-optic sensor,” Appl. Opt. 38, 5267–5271 (1999). [DOI] [PubMed] [Google Scholar]
- 21.O’Connor CL, and Schlupf JP, “Brillouin scattering in water: the Landau—Placzek ratio,” J. Chem. Phys. 47, 31–38 (1967). [Google Scholar]
- 22.Del Grosso VA, and Mader CW, “Speed of sound in pure water,” J. Acoust. Soc. Am. 52, 1442–1446 (1972). [Google Scholar]
- 23.Choi P-K, and Takagi K, “Ultrasonic velocity and absorption in water up to 1.5 GHz,” Jpn. J. Appl. Phys. 22, 890 (1983). [Google Scholar]
- 24.Fujii K. i., and Masui R, “Accurate measurements of the sound velocity in pure water by combining a coherent phase-detection technique and a variable path-length interferometer,” J. Acoust. Soc. Am. 93, 276–282 (1993). [Google Scholar]
- 25.Liu D, Xu J, Li R, Dai R, and Gong W, “Measurements of sound speed in the water by Brillouin scattering using pulsed Nd: YAG laser,” Opt. Commun. 203, 335–340 (2002). [Google Scholar]
- 26.Yao J, and Wang LV, “Photoacoustic microscopy,” Laser Photon. Rev. 7, 758–778 (2013). [DOI] [PMC free article] [PubMed] [Google Scholar]
- 27.Hanahan D, and Weinberg RA, “Hallmarks of cancer: the next generation,” Cell 144, 646–674 (2011). [DOI] [PubMed] [Google Scholar]
- 28.Yan Y, Gomez-Lopez N, Basij M, Shahvari AV, Vadillo-Ortega F, Hernandez-Andrade E, Hassan SS, Romero R, and MehrMohammadi M, “Photoacoustic imaging of the uterine cervix to assess collagen and water content changes in murine pregnancy,” Biomed. Opt. Express 10, 4643–4655 (2019). [DOI] [PMC free article] [PubMed] [Google Scholar]
- 29.Samani A, Bishop J, Luginbuhl C, and Plewes DB, “Measuring the elastic modulus of ex vivo small tissue samples,” Phys. Med. Biol. 48, 2183 (2003). [DOI] [PubMed] [Google Scholar]
- 30.Dias J, Diakonis VF, Kankariya VP, Yoo SH, and Ziebarth NM, “Anterior and posterior corneal stroma elasticity after corneal collagen crosslinking treatment,” Exp. Eye. Res. 116, 58–62 (2013). [DOI] [PMC free article] [PubMed] [Google Scholar]
- 31.McAlinden C, “Corneal refractive surgery: past to present,” Clin. Exp. Optom. 95, 386–398 (2012). [DOI] [PubMed] [Google Scholar]
Associated Data
This section collects any data citations, data availability statements, or supplementary materials included in this article.
Data Availability Statement
Data underlying the results presented in this paper are not publicly available at this time but may be obtained from the authors upon reasonable request.