

Abstract
The ability of cells to reorganize in response to external stimuli is important in areas ranging from morphogenesis to tissue engineering. While nematic order is common in biological tissues, it typically only extends to small regions of cells interacting via steric repulsion. On isotropic substrates, elongated cells can co-align due to steric effects, forming ordered but randomly oriented finite-size domains. However, we have discovered that flat substrates with nematic order can induce global nematic alignment of dense, spindle-like cells, thereby influencing cell organization and collective motion and driving alignment on the scale of the entire tissue. Remarkably, single cells are not sensitive to the substrate’s anisotropy. Rather, the emergence of global nematic order is a collective phenomenon that requires both steric effects and molecular-scale anisotropy of the substrate. To quantify the rich set of behaviours afforded by this system, we analyse velocity, positional and orientational correlations for several thousand cells over days. The establishment of global order is facilitated by enhanced cell division along the substrate’s nematic axis, and associated extensile stresses that restructure the cells’ actomyosin networks. Our work provides a new understanding of the dynamics of cellular remodelling and organization among weakly interacting cells.
Keywords: active nematics, cell migration, anisotropy
1. Introduction
Active matter consists of agents that individually consume energy from the environment to generate motion and forces, and collectively organize in emergent structures on scales much larger than the individual [1,2]. In particular, active nematics [3,4] are collections of elongated, apolar active particles that organize in states of orientational order. Nematic order has been observed ubiquitously in active and living systems, from reconstituted suspensions of cytoskeletal filaments and associated motor proteins [5–7] to cell monolayers [8–11], bacterial colonies [12] and even on the scale of entire organisms [13].
The nematic arrangement of cells in biological systems appears to serve key biological functions, such as driving the expansion of bacterial colonies [14], controlling cell extrusions and multi-layer formation in confluent tissue [10,11,15], and providing an underlying organizational structure for morphogenetic processes [13]. This realization has motivated efforts to develop in vitro techniques to direct cell organization, which are important both as platforms for controlled fundamental studies as well as for tissue engineering. Established methods include patterning of the topography [16], stiffness [17] and mechanical stretching [18] of the substrate. These methods control the orientation at the level of individual cells, such that even isolated cells can be sufficiently polarized to follow a preferred direction. They do not, however, allow the study of the role of steric effects or other collective aligning mechanisms in tuning the onset of nematic order in the whole tissue.
Recent work [19] showed that myoblasts cultured on liquid crystal elastomers (LCEs) developed nematic order, but only at the collective level. Although this result hinted at a density-driven, isotropic-nematic transition in cell monolayers, the mechanisms through which the substrate structure and cell proliferation jointly drive alignment remain largely unclear. This is in part because of a lack of quantitative, time-resolved analysis of dynamical trajectories for a statistically meaningful number of cells that would inform such mechanistic insights.
In this work, we study the organization of weakly interacting spindle-shaped human dermal fibroblasts (hdFs) on LCE substrates that are topographically flat, but nematically ordered at the molecular scale. Our work reveals that molecular-level guidance from the nematic substrate does not affect the orientation of isolated cells, but has profound consequences on the collective organization of the tissue monolayer above a critical cell density, including: (i) the preference of cells to divide along the direction of substrate alignment, (ii) the establishment of orientational order at the tissue (millimetre) scale, and (iii) the role of the anisotropic dynamics of topological defects in enhancing nematic order.
In contrast, when the substrate is isotropic, steric effects alone establish locally aligned but randomly oriented domains, and the orientational order averages to zero on the scale of the entire tissue, in agreement with earlier works [9,11,20–22].
We show that the establishment of global nematic order occurs in a three-step process with increasing density as the system transitions from (i) a disordered state where individual cell trajectories are unaffected by substrate alignment, to (ii) an intermediate state where tortuous bands of aligned cells coexist with disordered regions, while the system remains isotropic at the global scale, and finally (iii) an ordered nematic state where the tissue exhibits orientational order on millimetre scales. This behaviour is reminiscent of that of ‘dry’ active nematics [23], where ‘dry’ refers to the situation where the dominant dissipation mechanism is frictional coupling to a substrate, while viscous dissipation from cell–cell interaction and hydrodynamic couplings mediated by the surrounding medium are negligible [2].
On nematic substrates, we identify a strong correlation between the axis of cell division and the direction of substrate alignment, which suggests that directed cell division may play a role in the establishment of order on the tissue scale. We further demonstrate that even on a nematic substrate the emergence of large-scale orientational order can be frustrated by seeding cells at higher densities. By tracking the movement of defects, which are regions of frustrated order in the monolayer, we find that the direction of motion of defects suggests that extensile stresses generated by cell division along the substrate alignment direction enhance nematic order.
Here, we generate large experimental datasets and develop statistical analyses, to quantitatively capture the disorder-to-order transition of a cell monolayer on a nematically ordered LCE substrate. Our study not only sheds light on the mechanisms driving cellular organization, but also provides dynamical information at the single-cell level that is required for the calibration and refinement of physical and machine learning models by data inversion in future works.
2. Methods
2.1. Substrate fabrication
Substrates were fabricated following previous protocols [19] using a mixture of monoacrylates (RM23), diacrylates (RM82) and trace amounts of photo-initiator (figure 1a). The ratio of RM82 : RM23 = 1 : 1 (mol/mol), was tuned to produce substrates with appropriate mechanical properties and alignment capability. The polymer mixture was heated above its melting temperature and introduced into a thin chamber consisting of two glass slides pre-coated with a polyvinyl alcohol solution, separated by thin spacers. In cases where uniform nematic alignment of the LCE film was desired, the slides were rubbed unidirectionally with a velvet cloth to impose uniform alignment. Solid films (figure 1b) of uniform nematic or isotropic molecular order were obtained by cross-linking the polymer at a temperature either below or above the isotropic-nematic transition point of the RM82/RM23 mixture (TNI ∼ 95°C, determined by differential scanning calorimetry, electronic supplementary material, figure S11a; for full details, see electronic supplementary material, notes 3.1 and 3.2). Substrates were cleaned with ethanol and used without further chemical modifications. To make an isotropic film, an identical procedure was followed except that the glass slides forming the chamber were not rubbed and the UV illumination was carried out above the TNI. Thereafter, the chamber was immersed in Milli-Q water overnight to dissolve the PVA and release the film. Alignment was confirmed by examining the substrates between crossed polarizers (electronic supplementary material, figure S11b,c). The film substrate was cleaned with isopropanol and glued using a coverslip sealant CoverGrip (Biotium) to the bottom of a 35 mm Petri dish with no. 1.5 coverslip bottom (MatTek Corporation).
Figure 1.

Experimental approach. (a) Chemical structures of the crosslinker (RM82), monoacrylate (RM23) and a photoinitiator. The full chemical details and substrate characterization data are provided in the Methods section. (b) Schematics of the cell (not to scale) placed on a substrate with nematic or isotropic molecular structure. Cells are labelled in both the cytoplasm (CellTracker, red) and nucleus (Hoechst, blue) channels. (c,d) A high-throughput automated microscope stage acquires 10 s of images at every time point, which are stitched together (dotted rectangles) to allow reconstruction of 103 cell trajectories over the time span of days. The scale bar is . The dotted rectangle represents one field of view (FOV) captured by a 20× objective. (e) A close-up image of a single cell, with nucleus orientation θi labelled in grey, referring to the angle between the orientation of the cell nucleus and the horizontal direction or the direction of liquid crystal alignment. The velocity vector (with x- and y-components) is shown in yellow (red and blue), and the angle β denotes the velocity orientation with respect to the substrate. The scale bar is . The substrate alignment direction is parallel to unless otherwise specified.
2.2. Characterization
The degree of orientational order within the LCE substrate was determined by two-dimensional wide-angle X-ray diffraction (WAXD, electronic supplementary material, figure S12). The substrate mechanical properties were characterized by dynamic mechanical analysis (DMA, electronic supplementary material, figure S13), which showed an approximately threefold increase in elastic modulus parallel to the alignment direction relative to the perpendicular direction, whereas the elastic modulus of the isotropic substrate was uniform and had an intermediate value between the two. Importantly, the film processing method assured that the substrates were flat and smooth, which in turn ensured that at low cell density, there were no significant topographical cues to drive the alignment of individual cells. This was experimentally confirmed by the small (less than 2 nm) root-mean-squared roughness measured using atomic force microscopy, and this result was insensitive to the direction of probing (parallel or perpendicular to the LCE alignment direction) (electronic supplementary material, figure S14a). We further confirmed the flatness by mapping the surface topography using scanning electron microscopy (electronic supplementary material, figure S14b).
2.3. Cell culturing and seeding
hdFs (PCS-201-010) were purchased from the American Type Culture Collection, and were cultured in cells consisting of Dulbecco's modified eagle medium (DMEM 1× + GlutaMAX, Gibco) supplemented with 10% fetal bovine serum (FBS, Gibco) and 1% Pen-Strep (Gibco) by volume, at 37°C and 5% CO2, and the media were exchanged every 2 days. More details can be found in electronic supplementary material, note 4.1. Substrates were aligned to the imaging chamber such that the substrate alignment direction was along . Cells were seeded at volumetric density approximately 2.5 × 10⁴ ml−1, unless otherwise noted. Given the Petri dish diameter of 35 mm, this corresponds to an initial cell density of ρs ≈ 50 mm−2. Before imaging, the cytoplasm and nuclei were stained with fluorescent markers CellTracker Deep Red and Hoechst 33342, respectively, following standard protocols (electronic supplementary material, note 4.2).
2.4. Imaging and tracking
A high-throughput imaging workflow was developed to enable quantitative analysis of cellular dynamics over large length and time scales. Using a precision motorized stage and automated image collection routines, we acquired scans of tens of fields-of-view (figure 1c), which were stitched together in post-processing to obtain a composite image such as figure 1d. At every time point, the stitched image takes less than 2 min to scan. Then, nucleus position and orientation, which were used to indicate cell position and orientation, were determined for each image frame using a custom analysis scheme that enabled thresholding on a per image basis to account for bleaching and spatial variations (electronic supplementary material, figure S1), and by fitting an ellipse to the detected nucleus region. We represent the nucleus orientation of cell i by the angle θi with respect to , which for the nematic LCE substrates represents the direction of nematic alignment (figure 1e). The positions of the nuclei at subsequent times were then linked to form trajectories (electronic supplementary material, figure S4). We then determined the cell velocity by computing the cell displacement and dividing it by the time interval. Each experiment records the trajectories of a few thousand cells, including cell position, orientation, major and minor axes, velocity, and ID number for each cell at over 100 time points, which can be post-processed and analysed in minutes. This method allows for precise and robust quantification of cell orientation, density, and motility over long times and large fields of view.
3. Results
3.1. Nematic order within the liquid crystal elastomer directs cell alignment
To investigate the emergence of nematic order in a model cell monolayer, we cultured hdF cells on LCE substrates with either nematic or isotropic molecular structures (figure 1), both having identical chemical compositions. The reasons for choosing hdFs are twofold. First, skin tissue alignment is known to possess inherent order [24]. Second, the adherent, motile cells have a highly elongated body shape, with aspect ratios of approximately 4−6, and nuclei that are also anisotropic, with an aspect ratio that varies from 1.5 to 2.5. The high aspect ratio eliminates ambiguity when trying to determine the orientation of individual cells based on fitting the nuclei. Nucleus orientation is highly correlated with cell body orientation (figure 1e), having a correlation coefficient of 0.81 (electronic supplementary material, figure S3). Fluorescence signals from the nuclei are well-separated and easier to track than the cytoplasmic ones, particularly at high cell density, and are therefore used to indicate the local orientation of the cell. The cell orientation is then defined by the angle θi between the long axis of the nucleus of cell i and a fixed direction . For nematic substrates, coincides with the direction of LCE alignment, whereas for isotropic substrates represents an arbitrary direction. Finally, cells typically follow the boundary [25,26], which we have observed in our system as well (electronic supplementary material, figure S2). To minimize the effect of the boundary, we take care to only image cells 10 s of cell widths from the boundary.
We observed a markedly different organization of cells on isotropic and nematic LCE substrates, indicating that hdF cells are sensitive to the molecular alignment of the polymer film at the nanoscale, and that they use this molecular information to control their orientation within the cell monolayer. Use of a nematic substrate does not result in a preferred orientation of individual cells (electronic supplementary material, figure S15). Snapshots of cell orientation on isotropic (figure 2a) and nematic (figure 2b,c) substrates illustrate the role of both substrate alignment and cell density in controlling cell ordering. The angles θis are colour-coded in the images. The corresponding angular distributions are shown as polar histograms in figure 2d–f. At high enough density, cells cultured on an isotropic substrate form locally aligned domains (figure 2a), with a nearly uniform distribution of θi across the entire monolayer (figure 2d). By contrast, cells cultured on nematic substrates at similar density preferentially align with the substrate nematic orientation (figure 2b), with a strongly anisotropic distribution of θi peaked at 0 or π (figure 2e). At higher cell density on isotropic substrates, the angle distributions become more asymmetric and the domain size increases (figure 2c).
Figure 2.
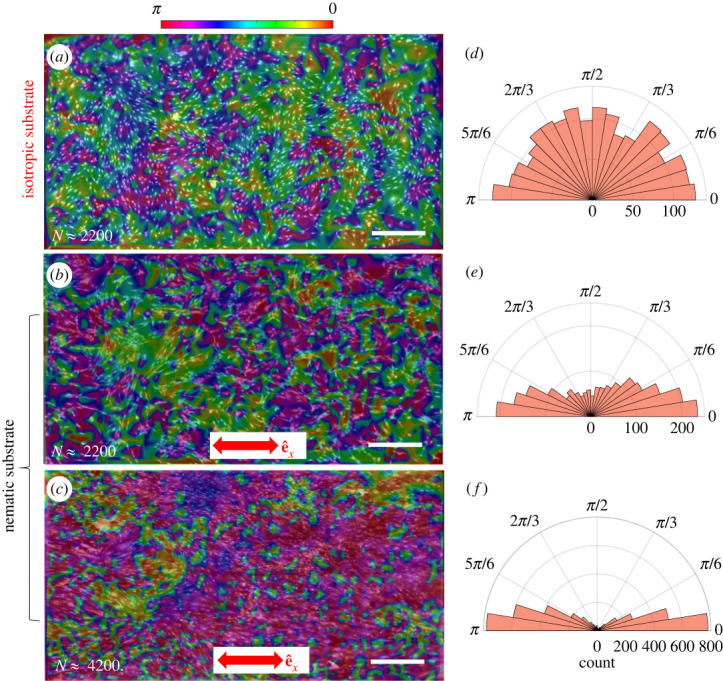
Snapshots of cell configurations on (a) an isotropic substrate with approximately 2200 cells and nematic substrates with (b) approximately 2200 cells and (c) approximately 4200 cells. The images are obtained by merging the nucleus and cytoplasm channels. The colour scale denotes the nucleus orientation. Panels (d–f) show the corresponding polar histograms of the nucleus orientations θi with respect to the direction of nematic order of the substrate . The scale bars are .
To quantify the spontaneous nematic order of the cells and nematic order induced by the substrate, we introduce two order parameters: the cell-substrate order parameter, Scs, generalized from the Landau–de Gennes theory of liquid crystals [16,19,27] and the cell–cell order parameter, Scc. These are given by
| 3.1 |
and
| 3.2 |
where θij = θi − θj is the angle between the orientation of cell i and cell j. The brackets denote an average over the entire system. A value of Scs = 0 indicates no preferential alignment of the cells with respect to , whereas a value of Scs = 1 indicates perfect alignment. Similarly, a substantially larger than zero value of Scc denotes nematic alignment due to cell–cell interactions along a direction of spontaneously broken symmetry. Large systems are needed to distinguish between local and global alignment. To accurately determine Scs and Scc, a system size much bigger than the typical domain size (), is needed (electronic supplementary material, figure S9). This highlights the need for the large-scale imaging used in the present experiments. When using the full composite image size of 2 × 4 mm, we found Scs = 0, 0.4 and 0.68 for the images shown figure 2a–c, respectively, in agreement with our qualitative observations of orientational order.
3.2. The isotropic-nematic transition of the cell monolayer is density-dependent
To mimic the course of cell proliferation, we seeded hdF cells at ρs ≈ 50 mm−2, maintained them at optimal culturing conditions (electronic supplementary material, note 4.1), then stained and imaged cells after waiting different numbers of days after seeding to achieve different densities. In practice, each experiment lasted about 40 h. Significantly longer experiments were inaccessible owing to the adverse effect of fluorescent imaging, causing cells to divide much more slowly. Moreover, bleaching complicates tracking at long times, since we usually expose cells to a diluted solution of Hoechst (0.5 μg ml−1) during incubation, to minimize the toxicity. Figure 3a shows the evolution of the cell-substrate order parameter Scs with cell density, with each density value represented by a different colour. Over the acquisition time, cell proliferation also leads to an increase in cell density. Our system exhibits a range of collective behaviours, with three key stages described below:
-
(i)
At low cell density () cells rarely interact with each other (figure 3b) and the monolayer is orientationally disordered. On both nematic and isotropic substrates individual cells move back and forth in place along their long axis with no preferential orientation relative to the direction of substrate alignment, travelling less than their body length before changing direction (electronic supplementary material, figure S8, movie S1). With increasing cell density, cells begin to co-localize and one observes the emergence of locally aligned cell clusters, although again there is no correlation between the orientation of the clusters and the alignment of nematic substrates. The spatial fluctuations in cell number ΔN for given system size 〈N〉 are greater than those in an equilibrium system (electronic supplementary material, figure S10), consistent with so-called giant number fluctuations [28], indicating that cell activity contributes to local clustering. These clusters nucleate local orientational order and eventually grow into aligned domains.
-
(ii)
At intermediate densities (ρ ≈ 200−300 mm−2), the monolayer exhibits locally aligned domains, but no global order (figure 3a, green data; electronic supplementary material, movie S2). Cell–cell interactions cause individual cells to co-align, which has previously been attributed to steric effects [29] and contact-induced inhibition of locomotion [30]. Upon further investigation, we have observed that cells exhibit a similar back-and-forth movement along trails on both nematic and isotropic substrates. However, while cell velocities are oriented along lanes, we did not detect any correlations between the direction of the velocity of a cell and its adjacent leading or trailing cell (electronic supplementary material, figure S7a). This is attributed to the nematic rather than polar nature of the cell movement, which results in velocity correlations that average to zero. In other words, the pattern of movement results in the emergence of thin bidirectional highways composed of moving cells, which are typically 1–2 cells wide and do not intersect. These highways spontaneously organize into swirling patterns (figure 3c). Notably, we have found that the alignment of the substrate influences the orientation of these ‘highways’, thereby contributing to their directional control.
-
(iii)
At even higher densities (ρ ≈ 300−500 mm−2), the collective cell behaviour is strongly affected by the properties of the substrate. On isotropic substrates, we observe nematically ordered domains of about 10–15 cells, but there is no global nematic order at the tissue scale. This is evident from measurements of the cell–cell order parameter Scc shown in electronic supplementary material, figure S5b,c, as well as from the correlation function of cell orientation shown in figure 4a. The cell-substrate order parameter Scs remains zero at all densities as the system has no preferred orientation (figure 3a). The onset of order is estimated to occur at density ρc = 320 mm−1, the density at which Ssc significantly departs from baseline value at lower cell densities. We note that this value is an estimate that may shift depending on the areal spread of the cells, but it serves as a useful threshold in distinguishing types of cellular behaviour.
Figure 3.

(a) Evolution of the cell-substrate order parameter Scs with cell density ρ. Each colour corresponds to a different density obtained at different times after seeding. Solid lines serve as guides to the eye. Shaded regions denote the typical uncertainty in estimating Scs (electronic supplementary material, figure S9). Errors in ρ (estimated to be approx. ) are not shown. A red asterisk in the legend denotes an experiment with a different initial seeding density. (b) At the lowest densities, cells are isolated and their orientations are random. (c) At low and moderate densities, cells display spontaneous swirling motion. (d) At intermediate to high densities, lanes of cells of coherent velocities form. (e) These lanes widen, and eventually, (f) structural arrest takes place due to jamming. Panels (b–f) are taken on nematic substrates. The scale bars are in (b,f) and in (c–e).
Figure 4.

Analysis of spatial correlations of cell–cell orientation. The cell–cell orientational correlation function is plotted as a function of the separation between cell pairs for (a) isotropic and (c) nematic substrates. The insets show the corresponding semilog and log-log plots in (a,c), respectively. The correlation length ξθθ extracted either by fitting equation (3.4) or equation (3.5) is shown in (b) where red and black symbols denote data obtained using isotropic or nematic substrates, respectively. The black vertical line indicates the cell density at the onset of order, ρc. Long-range order is observed for cells on nematic substrates for ρ > ρc, as demonstrated by the decreasing power law exponent γ in (d) and increasing plateau value in (e).
The transition to nematic order through the three-step process described above is reminiscent of that observed in simulations of so-called ‘dry’ active nematics [23]. These are collections of self-propelled rod-like active units that align with nematic interactions, i.e. align with each other along the orientation of their long axis, regardless of the direction of motion. The word 'dry' refers to the fact that the dynamics are overdamped and interactions of the active agent with a surrounding fluid are simply replaced by frictional damping. Dry active nematic system has been studied extensively via large-scale simulations [31,32]. An important distinction, however, is that while in numerical models nematic order appears spontaneously, here order is externally biased by the direction of substrate alignment, which is essential for the establishment of global order. In this system, the onset of nematic order occurs through a phase separation scenario, with a region of coexisting disordered regions and ordered lanes intervening between the disordered and ordered phases.
3.3. Cell crowding leads to larger aligned domains, but large-scale order only develops for nematic substrates
The degree of local versus large-scale ordering is further elucidated by examining the spatial cell–cell pair orientational correlation function, defined as
| 3.3 |
where r is the centre-to-centre distance between cell i and j (i ≠ j). In practice, we average all pairs with separations within [r, r + dr] (). The behaviour of Cθθ(r) at large r depends qualitatively on whether or not the substrate is aligned.
On isotropic substrates, Cθθ decays exponentially to 0 at all densities (figure 4a), demonstrating that in this case cells only have short-range orientational order [21,33]. A fit to an exponential
| 3.4 |
allows us to extract the orientational correlation length ξθθ that represents the average size of an aligned domain (figure 4b).
On nematic substrates, by contrast, Cθθ plateaus to a non-zero value at large r for ρ > ρc, suggesting long-range order on the scale of the system (figure 4c). Note that in the absence of the external symmetry-breaking field provided by the aligned substrate, active nematics in two dimensions are expected to show at most quasi-long-range order [34]. Here, the substrate acts like an external field and drives the system to a state of global order. Figure 4e shows the value of Cθθ at the largest scale probed in the experiments, averaged over the last 15 values, revealing a clear increase with density.
At intermediate length scales the slow decay of Cθθ is well described by a power-law fit, as expected for quasi-ordered phases in two dimensions [35,36]
| 3.5 |
where Ap is a normalizing constant to ensure Cθθ(r) ≤ 1 for nearest cell pairs, typically located at from each other, and γ is the power-law exponent. We found that γ decreased with increasing ρ, reaching a value of 0.1 at the highest density, consistent with the development of long-range order. In this case, we define the correlation length as the distance where Cθθ(r) decays to 1/e of its value at r = rmin,
| 3.6 |
The detailed fitting procedure and parameter estimates are shown in electronic supplementary material, figure S6.
The fitting reveals that Cθθ(rmin) is of order 1 and relatively insensitive to ρ (electronic supplementary material, figure S6). This suggests that cells are well-aligned with their nearest neighbours, and their interaction is driving short-range order. For ρ < ρc, ξθθ is approximately on both substrates (figure 4b). For ρ > ρc, ξθθ increases dramatically when nematic substrates are used, while it remains constant on isotropic substrates. Together, these results quantitatively support the conclusion that cells form small aligned domains due to steric repulsion and organize into a state of long-range nematic order when cultured on nematic substrates.
3.4. Nematic order is driven by both steric interactions and substrate alignment
Nematic order has been studied extensively in confluent monolayers of epithelial cells in previous works [10,21], where the anisotropy of individual cells is very small and nematic order is believed to arise not from steric effects, but from the anisotropy of forces transmitted through strong cell–cell interactions [37–39]. In our system, by contrast, cells are highly anisotropic even when isolated and weakly interacting, and alignment is driven by crowding and steric repulsion.
Further evidence that nematic order is driven by steric effects as opposed to correlations in cell velocity, as observed in epithelia, is provided by the computation of spatial velocity correlation functions (see electronic supplementary material, note 2.3), which are found to decay to zero within 1–2 cell widths at all densities on both isotropic and nematic substrates (electronic supplementary material, figure S7a). The distribution of the angle between velocities of cell pairs is, however, distinctly different. The distribution is isotropic on isotropic substrates, supporting the randomness of cell motion; and bimodal on nematic substrates, with peaks at pair angles of 0 and π, confirming the observation of cells’ antiparallel motion along aligned lanes (electronic supplementary material, figure S7c,d). We also observe a strong anisotropy of cell speed on nematic substrates, with cells typically moving almost twice as fast in the direction of nematic alignment than in the transverse direction (electronic supplementary material, figure S7f,g).
The key role of steric repulsion in driving alignment is also demonstrated by the fact that the experimentally obtained transition cell number density ρc, corresponding to a packing fraction of ϕ ≈ 0.5−0.6, agrees favourably with the transition density for a system of ellipses of aspect ratio 6 (similar to the aspect ratio of hdF cells) [40,41].
Finally, to test that alignment can be attributed to cell–substrate interaction, we added a small amount (1 μM) of focal adhesion kinase inhibitor (FAKi) to the growth media right before imaging cells on a nematic substrate (electronic supplementary material, figure S19). We found that as a result of this perturbation cell trajectories became more tortuous, the cell density ceased to grow (electronic supplementary material, figure S19b) and Scs only increased slowly (electronic supplementary material, figure S19c), similar to what was obtained on an isotropic substrate. These observations confirm that molecular-level cell-substrate interactions indeed play a significant role in controlling cell alignment.
3.5. Alignment is induced by dynamic reordering and crowding
To further examine these effects, we mapped velocities (displacements) between a pair of frames close to the jamming densities, as shown in figure 5, where each cell displacement is represented by a vector (arrow) whose length represents its magnitude, and that points in the direction of instantaneous cell motility. The arrows are colour-coded by binning along the four cardinal directions. The polar histograms in figure 5b,d further demonstrate that while the velocity direction is nearly evenly distributed over all angles for cells moving on isotropic substrates (figure 5b), cells moving on substrates with nematic order preferentially orient along the substrate alignment direction, here given by (figure 5d). Taken together, these observations demonstrate that both steric effects and substrate alignment, which steers cells to move back and forth along bidirectional ‘highways’ (electronic supplementary material, figure S5), are responsible for global nematic order.
Figure 5.

Asymmetric dynamics of cell motion. Spatial maps of the cell velocity field, colour-coded by the instantaneous direction of each velocity vector, for cells moving on (a) isotropic and (c) nematic substrates. For clarity, the velocities are plotted at 20% density in the full field of view (FOV), whereas the data of 100% density is plotted in the zoomed-in figure. The angular distribution of velocity with respect to is shown for (b) isotropic and (d) nematic substrates.
Similar behaviour has been observed in surface-dwelling bacteria Myxococcus xanthus [12], and attributed in part to the slime trail they secrete as they glide across a surface. Fibroblasts are also known to deposit extracellular matrix (ECM) proteins [42]. In the current experiments, we confirmed the release of fibronectin by cells using anti-fibronectin staining (electronic supplementary material, figure S17). We observed that regions with few or no cells also had little fluorescent intensity from the staining, which lends support to the idea that cells might sense and follow gradients of surface-attached fibronectin, (i.e. via haptotaxis) [43]. Furthermore, we present an analysis of fibronectin deposition patterns using the directionality analysis tool in ImageJ (electronic supplementary material, figure S18). It appears that the directional distribution of fibronectin deposition is peaked along the substrate alignment direction in the case of the nematic substrate, even though some fluctuation for the isotropic substrate is also observed. Cells interact with the extracellular matrix and reinforce their tracks. The reinforcement may contribute to the amplification of the subtle substrate guidance over time.
On nematic substrates, these ‘highways’ tend to stretch in the direction of substrate nematic order with increasing cell density, and begin to resemble ordered lanes of aligned cells that travel in both directions along the long axis of the lane (electronic supplementary material, movie S3), as observed in simulations of dry active nematics [44]. By contrast, on isotropic substrates, these swirling patterns persist over time until the cells eventually jam. Nonetheless, the origin of extensible stress within the cell monolayer on nematic substrates remains largely unclear.
One hint to the potential mechanism is that, on isotropic substrates, or when cells are incubated with FAKi, their proliferation becomes arrested and the cell density saturates to a lower value than on nematic substrates. On nematic substrates, by contrast, systematic reordering allows packing in more cells: first single-cell files merge to form multi-cell lanes, which align with the direction of substrate nematic order. The enhancement of packing is noted by an increase in aspect ratio with alignment Ssc, as shown in electronic supplementary material, figure S5a. Lanes of aligned cells moving in both directions coexist with disordered regions, suggesting a phase separation scenario as observed in simulations of dry active nematics [23]. Upon further increase of the density, both Scc and Scs increase rapidly, tracking each other (see electronic supplementary material, figure S5b,c), and the system transitions to a state of global nematic order on the scale of the entire substrate. This is also evident from the spatial correlation functions of cellular orientation shown in figure 4a.
3.6. Oriented cell proliferation promotes cell-substrate alignment
Cell proliferation appears to play an important role in enhancing cell alignment. To quantify this, we tracked cell division events at different ρ (figure 6) and calculated the cell division axis order parameter , where denotes the orientation of the line joining the nuclei of a dividing mother–daughter cell pair at the first time point after division relative to (figure 6a). For ρ < ρc, Scd ≈ 0 on both isotropic (figure 6e) and nematic (figure 6a) substrates.
Figure 6.

Angular distribution of the cell division axis. (a) The time sequence of images captures a cell-division event. Here, denotes the cell–cell orientation at the first time point after the division occurs. (b–e) The polar histograms denote the distribution of for a nematic substrate in (b–d) and isotropic substrate in (e). n is the number of observations.
On nematic substrates at ρ ≈ ρc, Scd ≈ 0.52 (figure 6c). These results indicate that on nematic substrates cells divide more readily along the substrate orientation direction. Similarly oriented cells tend to co-localize into larger aligned domains, widening the lanes and straightening them in the alignment direction (figure 3e). Cell proliferation may contribute to increased cell-substrate alignment Scs by (i) adding more aligned cells, but also indirectly by (ii) creating more space than what would have been allowed in a disordered cell monolayer, which could in turn suppress contact inhibition, and potentially also by (iii) setting up extensile dipolar stresses that serve to align nearby cells [45]. Anisotropic proliferation patterns appear to result from weak cell sensing of the substrate’s molecular anisotropy. In fact, cell alignment and proliferation appear to reinforce each other until jamming (figure 3f) occurs, as also seen in growing bacteria colonies [46,47].
To directly test the hypothesis that cell alignment is driven by cell proliferation, we seeded cells at different initial densities ρs and fixed them after one week for analysis. For ρs ≈ 50, 100 and 200 mm−2, similar values of Scs ≈ 0.68, 0.55 and 0.6 were obtained upon jamming. By contrast, seeding cells at densities larger than ρc only leads to partial alignment. For instance, when seeding cells at ρs ≈ 250, 300, 350 mm−2, the monolayers achieved Scs ≈ 0.25, 0.45 and 0.13. The degree of the final order is probably correlated with the configuration of the cells when first attached. The dependence of cell density and motility on initial seeding cell density has been noted previously in other experiments, e.g. scratch assays [48]. We hypothesize that for sufficiently high seeding densities the orientational order can become frustrated because cells cannot efficiently rearrange; as cells become contact inhibited, they cannot divide preferentially along the alignment direction (figure 6) to promote further alignment. Our system appears to serve as a rudimentary model where proliferation and organization must proceed in methodical sequences, or else misordering occurs, which may have relevance to investigations of pattern formation or morphogenesis, for example during embryonic development.
These phenomena on nematic substrates stand in stark contrast to those of cells on isotropic substrates, where Scs ≈ 0 for all densities. In this case, cells fail to create long-range order even at high densities and instead become contact inhibited near ρc, which leads to the arrest of both proliferation and motion. Experimentally, we measured the cell density at jamming to be approximately 300−450 mm−2 for isotropic substrates, as compared with approximately 600 mm−2 for cells on nematic substrates. Persistent cell motion contributes to local alignment as it effectively enhances the aspect ratio of the cells (electronic supplementary material, figure S5a), and contributes to more efficient packing in the aligned case. While it is possible to seed cells onto an isotropic substrate at higher densities, at ρs ≈ 300−400 mm−2, we found that in the 42 h of imaging, cell growth remained limited (cyan data in figure 3a), compared with the case of a nematic substrate during the same amount of time (purple data in figure 3a), despite the cells remaining attached and motile.
3.7. Defect movement hints at the nature of intercellular forces
Topological defects are regions in a system where the order is frustrated, and they are characterized by a topological ‘charge’ or winding number that measures the angle by which the order parameter rotates as one encircles the defect. In this manner, a set of radiating lines outwards from the centre point undergoes a +2π rotation over +2π, producing a defect with a winding number of +1. In passive systems, they arise when the system transitions from a disordered state to an ordered state, or when order is hindered by curvature, external fields, or boundary conditions [49,50]. In active systems, they can spontaneously appear in pairs of opposite ‘charges’. For biological systems that exhibit nematic order, such as cell monolayers or even entire organisms, defects appear to serve important functions, such as regulating cell extrusion and death [10], and act as precursors for morphological features [13]. Their movements in cell monolayers provide information on stress generation and transmission [10,11]. Defects are point-like objects in two dimensions. In nematic liquid crystals, the lowest energy defects have winding numbers of . These defects have a trefoil structure (figure 7a) for ‘charge’ , or a comet structure (figure 7b) for ‘charge’ . In equilibrium, pairs of opposite-sign defects attract each other through a Coulomb-like interaction that accounts for the elastic deformation energy of the liquid crystal, and eventually annihilate.
Figure 7.

Panels (a,b) show the (a) trefoil and (b) comet defects. Local director fields are overlaid on the cytoplasm channel. Tracking defects on a (c) isotropic, and on (d,e) nematic substrate, when the comet is (d) perpendicular or (e) parallel to the alignment direction. Red double-sided arrows denote the director field of the substrate. Left and top panels: orientation overlaid on the nucleus channel, which provides information about the location and orientation of the cell nuclei. Yellow dotted lines denote the approximate outline of the comet and the defect. Right and bottom panels: precise local orientation was determined from the orientation of cell nuclei. The black dots and corresponding arrows denote the location and direction of movement of the defects. Dashed lines are added to guide the detection of defect movement. The scale bars are in (a,b), and in (c,e).
In our system, on both isotropic and nematic substrates, we observed topological defects, as seen in [8,11]. On nematic substrates, opposite-sign defects tend to annihilate due to cell motility and tissue remodelling, whereas defects become trapped on isotropic substrates as the system jams, resulting in an arrested glassy state [51].
In active monolayers, the defect is generally stationary, while the is motile [39,52]. The direction of migration of defects is controlled by the nature of dipolar active forces in the monolayer: contractile active stresses drive the comet-like defect to move towards its tail, while extensile stresses drive it to move in the direction of the head of the comet [52,53].
To examine the possible presence and behaviour of such defects, we examined high-magnification images of cells at ρ > ρc and manually identified and tracked defects within the hdF monolayer, where the orientation of nematic order is determined by the orientation of the cell nucleus. We found that on isotropic substrates (figure 7; electronic supplementary material, movie S4) defects migrated towards their tail, consistent with contractile forces and as previously reported for NIH3T3 fibroblasts [20]. By contrast, on nematic substrates, the direction of defect motion depended on the defects’ orientation with respect to the axis of substrate alignment . Defects oriented perpendicular to retracted in time, and tended to rotate to align their axis with , suggesting that their motion is again controlled by local contractile forces (figure 7d; electronic supplementary material, movie S5). On the other hand, defects oriented parallel to moved in the direction of the head of the comet, indicating that their motion was driven by the extensile stresses arising from oriented cell division (figure 7e; electronic supplementary material, movie S3). Positive defects moving along the boundaries of aligned lanes tended to annihilate their negative counterparts, enhancing order. These observations further support the notion that cell division plays an important role in driving nematic order. Overall, defects are rare on nematic substrates, and we were only able to verify a small number of instances of defect motion.
4. Discussion
We have shown that the growth and structural organization of hdF cells is controlled by the interplay of spontaneous alignment due to steric cell–cell interactions and the molecular structure of the substrate. By developing the ability to collect and analyse the dynamics of thousands of cells at high space and time resolution, we established the dynamics of how the cell layer evolves as a function of time as cells proliferate and organize in a nematic state. On isotropic substrates, cells align with increasing cell density due to crowding, forming locally oriented domains. The system remains, however, disordered at the global scale, with exponential decay of orientational correlation functions. By contrast, molecular alignment of the LCE substrate provides a preferred alignment direction that allows the monolayer to achieve global nematic order at the tissue scale.
By computing the correlations between cell number, position, velocity and orientation, we identified a sequence of regimes of increasingly rich structure: first the formation of locally oriented domains due to steric effects, then the emergence of bidirectional lanes where cells travel unobstructed, and finally global orientational order of the entire millimetre-scale tissue.
Our experimental approach is distinct from other approaches to direct cell monolayer ordering that use surface undulations to drive cellular alignment [16,27,54], where such undulations provide strong guidance. Although the molecular mechanisms by which cells sense the substrate molecular alignment remain elusive, we find evidence that cell division occurs preferentially along the direction of substrate alignment and that cell proliferation is enhanced on ordered substrates. It is then tempting to speculate that directed division provides extensile active stresses and an effective anisotropic noise that anneals the monolayers, allowing defects that are essentially jammed on disordered substrates to move and annihilate, resulting in the global order. Although individual cells do not respond strongly to the weak alignment cues imposed by the substrate (figure 3b), once multi-cellular lanes form (figure 3e), their response to the alignment is enhanced.
This enhancement may be influenced by anisotropic tracks of extracellular matrix proteins deposited by other cells, possibly reinforced over time [22], not unlike what is observed in myxobacteria [12]. Microscopically, cells are enclosed with biological membranes composed of lipid bilayers with embedded membrane-bound receptor proteins. It is well recognized that specific binding events occurring at the interface can drive the reorganization of lipids [55], and that liquid crystals can serve to orient biological molecules with liquid crystalline phases such as lipids [56] and DNA [57]. Therefore, it is conceivable that cells can perceive the order within the substrate through these specific binding events and polarize along the substrate direction without the need for mechanical coupling to substrate deformations.
Earlier works [58,59] have suggested that cells organize and migrate collectively along the direction of maximum principal stress as a result of a mechanical feedback between active cytoskeletal contractility and cell polarization. This could provide a mechanism through which the stiffness anisotropy in the aligned substrate stiffness may be enhanced to direct cell alignment at the collective level, but more work will be needed to quantify correlations between the stress field in the cell layer and the nematic order of the substrate. Durotaxis—cell migration guided by rigidity gradients—is well-documented [60], but generally more effective on substrates softer than the ones used here [61]. The anisotropy in substrate rigidity resulting from alignment seems too weak to bias the orientation of individual cells, but collective alignment could occur through a mechanism similar to the one driving collective durotaxis, where cell groups sense and are guided by weak substrate stiffness gradients that do not affect individual cells [62]. Collective durotaxis has been observed in cells with relatively strong cell–cell contacts, which are able to transmit forces over many cells. For fibroblasts where cell–cell contacts are weak, the same role may be played by steric repulsion, which is controlled by density. More work will, however, be needed to establish the origin of the substrate-induced alignment. The anisotropic mechanical properties of our substrate make it challenging to use techniques such as traction force microscopy or monolayer stress microscopy to measure stress, as the analysis of these measurements typically requires isotropic mechanical properties. Furthermore, with moduli of the order of hundreds of MPa, the substrate is too stiff for cells to be able to induce measurable deformations as this generally requires moduli approx. 2−10 kPa. Liquid crystal hydrogels such as those shown in [63] may have the potential to overcome these obstacles.
By tracking the movement of spontaneously generated defects, we determined that active stresses in the monolayer appear to be contractile for defects oriented perpendicular to the substrate alignment direction (figure 7d), but extensile when the defect is oriented parallel to the direction of substrate alignment (figure 7e). Such extensive stresses are likely to arise from oriented cell division along the direction of substrate alignment. In epithelial layers, a uniaxial stretch of the substrate can drive preferentially oriented cell division along the stretch direction, though E-cadherin seems to be critical in transducing the stress and regulating cell-division orientation [64]. Our study suggests that hdFs not only sense the local substrate orientation and align their long axes to the substrate alignment direction but also actively remodel the cell monolayer at the tissue level [65]. This sensitivity and behaviour may play an important role in the organization of newly deposited ECM proteins in connective tissue, or in the development of multi-cellular aggregates in biological contexts. Taken together, these observations suggest new avenues for the development of guiding surfaces to direct wound healing or tissue regeneration in biomedical engineering applications.
The development of methods to reliably control and programme collective cellular alignment and motility is essential for use in tissue engineering and medical applications, especially when combined with photopatterning techniques [16,66]. Our work shows that a nematically ordered, but topologically flat substrate can serve as an external field to drive global order. It additionally uncovers the evolution of spatial and temporal correlations during the transition to the ordered state, revealing a remarkable connection to well-studied models of dry active nematics. Finally, it demonstrates new techniques for rapid collection and analysis of large datasets of tissue-scale structure and dynamics, which inform mechanistic insights and lay the experimental groundwork for future theoretical and data science studies aimed at elucidating the molecular mechanisms of cell-substrate interaction that drive collective alignment.
Acknowledgements
The authors thank Jen Smith for training on cell tissue culture preparation and acknowledge the use of the Biological Nanostructures Laboratory and Microfluidics Laboratory within the California NanoSystems Institute, supported by the University of California, Santa Barbara and the University of California, Office of the President. The authors also acknowledge the use of the UC Santa Barbara MRL Shared Experimental Facilities that are supported by the MRSEC Program of the NSF under Award no. DMR-1720256; a member of the NSF-funded Materials Research Facilities Network (www.mrfn.org).
Ethics
The manuscript in part or in full has not been submitted or published anywhere.
Data accessibility
Datasets are available from the Dryad Digital Repository: https://doi.org/10.25349/D96W58 [67].
The data are provided in electronic supplementary material [68].
Authors' contributions
Y.L.: conceptualization, data curation, formal analysis, funding acquisition, investigation, methodology, software, validation, visualization, writing—original draft; M.G.: conceptualization, formal analysis, investigation, methodology, software, validation, writing—review and editing; M.P.: investigation, writing—review and editing; X.F.: formal analysis, software, writing—review and editing; Y.K.: investigation, writing—review and editing; J.M.U.: investigation, writing—review and editing; J.R.A.: funding acquisition, resources, writing—review and editing; M.E.H.: conceptualization, funding acquisition, investigation, methodology, resources, supervision, writing—review and editing; C.M.M.: conceptualization, investigation, methodology, resources, writing—review and editing; M.T.V.: conceptualization, funding acquisition, investigation, methodology, project administration, resources, supervision, writing—review and editing.
All authors gave final approval for publication and agreed to be held accountable for the work performed therein.
Conflict of interest declaration
We declare we have no competing interests.
Funding
This work was supported by the Otis Williams Postdoctoral Fellowship from the Division of Mathematical, Life, & Physical Sciences in the College of Letter & Science, with partial support from the BioPACIFIC Materials Innovation Platform of the National Science Foundation under Award no. DMR-1933487 (NSF BioPACIFIC MIP), by the MRSEC Program of the NSF under Award no. DMR-1720256 (IRG-3) and by the US Army Research Office under Cooperative Agreement W911NF-19-2-0026 for the Institute for Collaborative Biotechnologies. C.M.M. acknowledges partial support from the National Science Foundation under Award no. DMR-2041459. M.G. acknowledges partial support from the National Science Foundation under Award no. 2053423 and by Hellman Family Faculty Fellowship from the University of California. X.F. acknowledges the partial support from UCSB academic senate faculty research grant programme.
Disclaimer
Views and conclusions are those of the authors and should not be interpreted as representing official policies, either expressed or implied, of the US Government.
References
- 1.Ramaswamy S. 2017. Active matter. J. Stat. Mech.: Theory Exp. 2017, 054002. ( 10.1088/1742-5468/aa6bc5) [DOI] [Google Scholar]
- 2.Marchetti MC, Joanny JF, Ramaswamy S, Liverpool TB, Prost J, Rao M, Simha RA. 2013. Hydrodynamics of soft active matter. Rev. Mod. Phys. 85, 1143-1189. ( 10.1103/RevModPhys.85.1143) [DOI] [Google Scholar]
- 3.Doostmohammadi A, Ignés-Mullol J, Yeomans JM, Sagués F. 2018. Active nematics. Nat. Commun. 9, 1-13. ( 10.1038/s41467-018-05666-8) [DOI] [PMC free article] [PubMed] [Google Scholar]
- 4.Giomi L, Bowick MJ, Mishra P, Sknepnek R, Cristina Marchetti M. 2014. Defect dynamics in active nematics. Phil. Trans. R. Soc. A 372, 20130365. ( 10.1098/rsta.2013.0365) [DOI] [PMC free article] [PubMed] [Google Scholar]
- 5.Sanchez T, Chen DTN, DeCamp SJ, Heymann M, Dogic Z. 2012. Spontaneous motion in hierarchically assembled active matter. Nature 491, 431-434. ( 10.1038/nature11591) [DOI] [PMC free article] [PubMed] [Google Scholar]
- 6.DeCamp SJ, Redner GS, Baskaran A, Hagan MF, Dogic Z. 2015. Orientational order of motile defects in active nematics. Nat. Mater. 14, 1110-1115. ( 10.1038/nmat4387) [DOI] [PMC free article] [PubMed] [Google Scholar]
- 7.Kumar N, Zhang R, De Pablo JJ, Gardel ML. 2018. Tunable structure and dynamics of active liquid crystals. Sci. Adv. 4, eaat7779. ( 10.1126/sciadv.aat7779) [DOI] [PMC free article] [PubMed] [Google Scholar]
- 8.Kemkemer R, Kling D, Kaufmann D, Gruler H. 2000. Elastic properties of nematoid arrangements formed by amoeboid cells. Eur. Phys. J. E 1, 215-225. ( 10.1007/s101890050024) [DOI] [Google Scholar]
- 9.Duclos G, Garcia S, Yevick H, Silberzan P. 2014. Perfect nematic order in confined monolayers of spindle-shaped cells. Soft Matter 10, 2346-2353. ( 10.1039/C3SM52323C) [DOI] [PubMed] [Google Scholar]
- 10.Saw TB, et al. 2017. Topological defects in epithelia govern cell death and extrusion. Nature 544, 212-216. ( 10.1038/nature21718) [DOI] [PMC free article] [PubMed] [Google Scholar]
- 11.Kawaguchi K, Kageyama R, Sano M. 2017. Topological defects control collective dynamics in neural progenitor cell cultures. Nature 545, 327-331. ( 10.1038/nature22321) [DOI] [PubMed] [Google Scholar]
- 12.Thutupalli S, Sun M, Bunyak F, Palaniappan K, Shaevitz JW. 2015. Directional reversals enable Myxococcus xanthus cells to produce collective one-dimensional streams during fruiting-body formation. J. R. Soc. Interface 12, 20150049. ( 10.1098/rsif.2015.0049) [DOI] [PMC free article] [PubMed] [Google Scholar]
- 13.Maroudas-Sacks Y, Garion L, Shani-Zerbib L, Livshits A, Braun E, Keren K. 2021. Topological defects in the nematic order of actin fibres as organization centres of Hydra morphogenesis. Nat. Phys. 17, 251-259. ( 10.1038/s41567-020-01083-1) [DOI] [Google Scholar]
- 14.Basaran M, Yaman YI, Yüce TC, Vetter R, Kocabas A. 2022. Large-scale orientational order in bacterial colonies during inward growth. Elife 11, e72187. ( 10.7554/eLife.72187) [DOI] [PMC free article] [PubMed] [Google Scholar]
- 15.Copenhagen K, Alert R, Wingreen NS, Shaevitz JW. 2021. Topological defects promote layer formation in Myxococcus xanthus colonies. Nat. Phys. 17, 211-215. ( 10.1038/s41567-020-01056-4) [DOI] [Google Scholar]
- 16.Turiv T, Krieger J, Babakhanova G, Yu H, Shiyanovskii SV, Wei QH, Kim MH, Lavrentovich OD. 2020. Topology control of human fibroblast cells monolayer by liquid crystal elastomer. Sci. Adv. 6, eaaz6485. ( 10.1126/sciadv.aaz6485) [DOI] [PMC free article] [PubMed] [Google Scholar]
- 17.Islam A, Younesi M, Mbimba T, Akkus O. 2016. Collagen substrate stiffness anisotropy affects cellular elongation, nuclear shape, and stem cell fate toward anisotropic tissue lineage. Adv. Healthcare Mater. 5, 2237-2247. ( 10.1002/adhm.201600284) [DOI] [PMC free article] [PubMed] [Google Scholar]
- 18.Chen K, Vigliotti A, Bacca M, McMeeking RM, Deshpande VS, Holmes JW. 2018. Role of boundary conditions in determining cell alignment in response to stretch. Proc. Natl Acad. Sci. USA 115, 986-991. ( 10.1073/pnas.1715059115) [DOI] [PMC free article] [PubMed] [Google Scholar]
- 19.Martella D, Pattelli L, Matassini C, Ridi F, Bonini M, Paoli P, Baglioni P, Wiersma DS, Parmeggiani C. 2019. Liquid crystal-induced myoblast alignment. Adv. Healthcare Mater. 8, 1801489. ( 10.1002/adhm.201801489) [DOI] [PubMed] [Google Scholar]
- 20.Duclos G, Erlenkämper C, Joanny JF, Silberzan P. 2017. Topological defects in confined populations of spindle-shaped cells. Nat. Phys. 13, 58-62. ( 10.1038/nphys3876) [DOI] [Google Scholar]
- 21.Garcia S, Hannezo E, Elgeti J, Joanny JF, Silberzan P, Gov NS. 2015. Physics of active jamming during collective cellular motion in a monolayer. Proc. Natl Acad. Sci. USA 112, 15 314-15 319. ( 10.1073/pnas.1510973112) [DOI] [PMC free article] [PubMed] [Google Scholar]
- 22.Li X, Balagam R, He TF, Lee PP, Igoshin OA, Levine H. 2017. On the mechanism of long-range orientational order of fibroblasts. Proc. Natl Acad. Sci. USA 114, 8974-8979. ( 10.1073/pnas.1707210114) [DOI] [PMC free article] [PubMed] [Google Scholar]
- 23.Chaté H. 2020. Dry aligning dilute active matter. Annu. Rev. Condens. Matter Phys. 11, 189-212. ( 10.1146/annurev-conmatphys-031119-050752) [DOI] [Google Scholar]
- 24.Bonvallet PP, Schultz MJ, Mitchell EH, Bain JL, Culpepper BK, Thomas SJ, Bellis SL. 2015. Microporous dermal-mimetic electrospun scaffolds pre-seeded with fibroblasts promote tissue regeneration in full-thickness skin wounds. PLoS ONE 10, e0122359. ( 10.1371/journal.pone.0122359) [DOI] [PMC free article] [PubMed] [Google Scholar]
- 25.Théry M. 2010. Micropatterning as a tool to decipher cell morphogenesis and functions. J. Cell Sci. 123, 4201-4213. ( 10.1242/jcs.075150) [DOI] [PubMed] [Google Scholar]
- 26.Luo W, Jones SR, Yousaf MN. 2008. Geometric control of stem cell differentiation rate on surfaces. Langmuir 24, 12 129-12 133. ( 10.1021/la802836g) [DOI] [PubMed] [Google Scholar]
- 27.Babakhanova G, Krieger J, Li BX, Turiv T, Kim MH, Lavrentovich OD. 2020. Cell alignment by smectic liquid crystal elastomer coatings with nanogrooves. J. Biomed. Mater. Res. A 108, 1223-1230. ( 10.1002/jbm.a.36896) [DOI] [PubMed] [Google Scholar]
- 28.Chaté H, Ginelli F, Montagne R. 2006. Simple model for active nematics: quasi-long-range order and giant fluctuations. Phys. Rev. Lett. 96, 180602. ( 10.1103/PhysRevLett.96.180602) [DOI] [PubMed] [Google Scholar]
- 29.Löber J, Ziebert F, Aranson IS. 2015. Collisions of deformable cells lead to collective migration. Sci. Rep. 5, 1-7. ( 10.1038/srep09172) [DOI] [PMC free article] [PubMed] [Google Scholar]
- 30.Desai RA, Gopal SB, Chen S, Chen CS. 2013. Contact inhibition of locomotion probabilities drive solitary versus collective cell migration. J. R. Soc. Interface 10, 20130717. ( 10.1098/rsif.2013.0717) [DOI] [PMC free article] [PubMed] [Google Scholar]
- 31.Peruani F, Deutsch A, Bär M. 2006. Nonequilibrium clustering of self-propelled rods. Phys. Rev. E 74, 030904. ( 10.1103/PhysRevE.74.030904) [DOI] [PubMed] [Google Scholar]
- 32.Baskaran A, Marchetti MC. 2008. Enhanced diffusion and ordering of self-propelled rods. Phys. Rev. Lett. 101, 268101. ( 10.1103/PhysRevLett.101.268101) [DOI] [PubMed] [Google Scholar]
- 33.Yu YK, Taylor P, Terentjev E. 1998. Exponential decay of correlations in a model for strongly disordered 2D nematic elastomers. Phys. Rev. Lett. 81, 128-131. ( 10.1103/PhysRevLett.81.128) [DOI] [Google Scholar]
- 34.Shankar S, Ramaswamy S, Marchetti MC. 2018. Low-noise phase of a two-dimensional active nematic system. Phys. Rev. E 97, 012707. ( 10.1103/PhysRevE.97.012707) [DOI] [PubMed] [Google Scholar]
- 35.Kosterlitz JM, Thouless DJ. 1973. Ordering, metastability and phase transitions in two-dimensional systems. J. Phys. C: Solid State Phys. 6, 1181-1203. ( 10.1088/0022-3719/6/7/010) [DOI] [PubMed] [Google Scholar]
- 36.Berezinskii V. 1971. Destruction of long-range order in one-dimensional and two-dimensional systems having a continuous symmetry group I. Classical systems. Sov. Phys. JETP 32, 493-500. [Google Scholar]
- 37.Trepat X, Wasserman MR, Angelini TE, Millet E, Weitz DA, Butler JP, Fredberg JJ. 2009. Physical forces during collective cell migration. Nat. Phys. 5, 426-430. ( 10.1038/nphys1269) [DOI] [Google Scholar]
- 38.Brugués A, et al. 2014. Forces driving epithelial wound healing. Nat. Phys. 10, 683-690. ( 10.1038/nphys3040) [DOI] [PMC free article] [PubMed] [Google Scholar]
- 39.Balasubramaniam L, et al. 2021. Investigating the nature of active forces in tissues reveals how contractile cells can form extensile monolayers. Nat. Mater. 20, 1156-1166. ( 10.1038/s41563-021-00919-2) [DOI] [PMC free article] [PubMed] [Google Scholar]
- 40.Cuesta J, Frenkel D. 1990. Monte Carlo simulation of two-dimensional hard ellipses. Phys. Rev. A 42, 2126-2136. ( 10.1103/PhysRevA.42.2126) [DOI] [PubMed] [Google Scholar]
- 41.Tan X, Chen Y, Wang H, Zhang Z, Ling XS. 2021. 2D isotropic–nematic transition in colloidal suspensions of ellipsoids. Soft Matter 17, 6001-6005. ( 10.1039/D1SM00367D) [DOI] [PubMed] [Google Scholar]
- 42.Malakpour-Permlid A, Buzzi I, Hegardt C, Johansson F, Oredsson S. 2021. Identification of extracellular matrix proteins secreted by human dermal fibroblasts cultured in 3D electrospun scaffolds. Sci. Rep. 11, 1-18. ( 10.1038/s41598-021-85742-0) [DOI] [PMC free article] [PubMed] [Google Scholar]
- 43.Carter SB. 1967. Haptotaxis and the mechanism of cell motility. Nature 213, 256-260. ( 10.1038/213256a0) [DOI] [PubMed] [Google Scholar]
- 44.Ngo S, Peshkov A, Aranson IS, Bertin E, Ginelli F, Chaté H. 2014. Large-scale chaos and fluctuations in active nematics. Phys. Rev. Lett. 113, 038302. ( 10.1103/PhysRevLett.113.038302) [DOI] [PubMed] [Google Scholar]
- 45.Doostmohammadi A, Thampi SP, Saw TB, Lim CT, Ladoux B, Yeomans JM. 2015. Celebrating Soft Matter’s 10th Anniversary: cell division: a source of active stress in cellular monolayers. Soft Matter 11, 7328-7336. ( 10.1039/C5SM01382H) [DOI] [PubMed] [Google Scholar]
- 46.Volfson D, Cookson S, Hasty J, Tsimring LS. 2008. Biomechanical ordering of dense cell populations. Proc. Natl Acad. Sci. USA 105, 15 346-15 351. ( 10.1073/pnas.0706805105) [DOI] [PMC free article] [PubMed] [Google Scholar]
- 47.Dell’Arciprete D, Blow M, Brown A, Farrell F, Lintuvuori JS, McVey A, Marenduzzo D, Poon WC. 2018. A growing bacterial colony in two dimensions as an active nematic. Nat. Commun. 9, 1-9. ( 10.1038/s41467-018-06370-3) [DOI] [PMC free article] [PubMed] [Google Scholar]
- 48.Jin W, Shah ET, Penington CJ, McCue SW, Chopin LK, Simpson MJ. 2016. Reproducibility of scratch assays is affected by the initial degree of confluence: experiments, modelling and model selection. J. Theor. Biol. 390, 136-145. ( 10.1016/j.jtbi.2015.10.040) [DOI] [PubMed] [Google Scholar]
- 49.Bade ND, Kamien RD, Assoian RK, Stebe KJ. 2018. Edges impose planar alignment in nematic monolayers by directing cell elongation and enhancing migration. Soft Matter 14, 6867-6874. ( 10.1039/C8SM00612A) [DOI] [PMC free article] [PubMed] [Google Scholar]
- 50.Endresen KD, Kim M, Pittman M, Chen Y, Serra F. 2021. Topological defects of integer charge in cell monolayers. Soft Matter 17, 5878-5887. ( 10.1039/D1SM00100K) [DOI] [PMC free article] [PubMed] [Google Scholar]
- 51.Angelini TE, Hannezo E, Trepat X, Marquez M, Fredberg JJ, Weitz DA. 2011. Glass-like dynamics of collective cell migration. Proc. Natl Acad. Sci. USA 108, 4714-4719. ( 10.1073/pnas.1010059108) [DOI] [PMC free article] [PubMed] [Google Scholar]
- 52.Giomi L, Bowick MJ, Ma X, Marchetti MC. 2013. Defect annihilation and proliferation in active nematics. Phys. Rev. Lett. 110, 228101. ( 10.1103/PhysRevLett.110.228101) [DOI] [PubMed] [Google Scholar]
- 53.Pismen L. 2013. Dynamics of defects in an active nematic layer. Phys. Rev. E 88, 050502. ( 10.1103/PhysRevE.88.050502) [DOI] [PubMed] [Google Scholar]
- 54.Shin MJ, Im SH, Kim W, Ahn H, Shin TJ, Chung HJ, Yoon DK. 2022. Recyclable periodic nanostructure formed by sublimable liquid crystals for robust cell alignment. Langmuir 38, 3765-3774. ( 10.1021/acs.langmuir.1c03359) [DOI] [PubMed] [Google Scholar]
- 55.Brake JM, Daschner MK, Luk YY, Abbott NL. 2003. Biomolecular interactions at phospholipid-decorated surfaces of liquid crystals. Science 302, 2094-2097. ( 10.1126/science.1091749) [DOI] [PubMed] [Google Scholar]
- 56.Kim EB, Lockwood N, Chopra M, Guzmán O, Abbott NL, de Pablo JJ. 2005. Interactions of liquid crystal-forming molecules with phospholipid bilayers studied by molecular dynamics simulations. Biophys. J. 89, 3141-3158. ( 10.1529/biophysj.105.065193) [DOI] [PMC free article] [PubMed] [Google Scholar]
- 57.Dhakal NP, Jiang J, Guo Y, Peng C. 2020. Photopatterning DNA structures with topological defects and arbitrary patterns through multiple length scales. Phys. Rev. Appl. 13, 014026. ( 10.1103/PhysRevApplied.13.014026) [DOI] [Google Scholar]
- 58.He S, Li X, Ji B. 2019. Mechanical force drives the polarization and orientation of cells. Acta Mech. Sin. 35, 275-288. ( 10.1007/s10409-019-00864-z) [DOI] [Google Scholar]
- 59.He S, Green Y, Saeidi N, Li X, Fredberg JJ, Ji B, Pismen LM. 2020. A theoretical model of collective cell polarization and alignment. J. Mech. Phys. Solids 137, 103860. ( 10.1016/j.jmps.2019.103860) [DOI] [PMC free article] [PubMed] [Google Scholar]
- 60.Janmey PA, Fletcher DA, Reinhart-King CA. 2020. Stiffness sensing by cells. Physiol. Rev. 100, 695-724. ( 10.1152/physrev.00013.2019) [DOI] [PMC free article] [PubMed] [Google Scholar]
- 61.DuChez BJ, Doyle AD, Dimitriadis EK, Yamada KM. 2019. Durotaxis by human cancer cells. Biophys. J. 116, 670-683. ( 10.1016/j.bpj.2019.01.009) [DOI] [PMC free article] [PubMed] [Google Scholar]
- 62.Sunyer R, et al. 2016. Collective cell durotaxis emerges from long-range intercellular force transmission. Science 353, 1157-1161. ( 10.1126/science.aaf7119) [DOI] [PubMed] [Google Scholar]
- 63.Wang Y, McKinstry AH, Burke KA. 2020. Main-chain liquid crystalline hydrogels that support 3D stem cell culture. Biomacromolecules 21, 2365-2375. ( 10.1021/acs.biomac.0c00316) [DOI] [PubMed] [Google Scholar]
- 64.Hart KC, Tan J, Siemers KA, Sim JY, Pruitt BL, Nelson WJ, Gloerich M. 2017. E-cadherin and LGN align epithelial cell divisions with tissue tension independently of cell shape. Proc. Natl Acad. Sci. USA 114, E5845-E5853. ( 10.1073/pnas.1701703114) [DOI] [PMC free article] [PubMed] [Google Scholar]
- 65.Saraswathibhatla A, Notbohm J. 2020. Tractions and stress fibers control cell shape and rearrangements in collective cell migration. Phys. Rev. X 10, 011016. ( 10.1103/PhysRevX.10.011016) [DOI] [Google Scholar]
- 66.Jiang J, Dhakal NP, Guo Y, Andre C, Thompson L, Skalli O, Peng C. 2020. Controlled dynamics of neural tumor cells by templated liquid crystalline polymer networks. Adv. Healthcare Mater. 9, 2000487. ( 10.1002/adhm.202000487) [DOI] [PubMed] [Google Scholar]
- 67.Luo Y, et al. 2023. Data from: Molecular-scale substrate anisotropy, crowding, and division drive collective behaviors in cell monolayers. Dryad Digital Repository. ( 10.25349/D96W58) [DOI] [PMC free article] [PubMed]
- 68.Luo Y, et al. 2023. Molecular-scale substrate anisotropy, crowding, and division drive collective behaviors in cell monolayers. Figshare. ( 10.6084/m9.figshare.c.6707598) [DOI] [PMC free article] [PubMed]
Associated Data
This section collects any data citations, data availability statements, or supplementary materials included in this article.
Data Citations
- Luo Y, et al. 2023. Data from: Molecular-scale substrate anisotropy, crowding, and division drive collective behaviors in cell monolayers. Dryad Digital Repository. ( 10.25349/D96W58) [DOI] [PMC free article] [PubMed]
- Luo Y, et al. 2023. Molecular-scale substrate anisotropy, crowding, and division drive collective behaviors in cell monolayers. Figshare. ( 10.6084/m9.figshare.c.6707598) [DOI] [PMC free article] [PubMed]
Data Availability Statement
Datasets are available from the Dryad Digital Repository: https://doi.org/10.25349/D96W58 [67].
The data are provided in electronic supplementary material [68].