

Abstract
Individuals with chronic heart failure (CHF) have an increased risk of ventricular arrhythmias, which has been linked to pathological cellular remodeling and may also be mediated by changes in heart rate. Heart rate typically fluctuates on a timescale ranging from seconds to hours, termed heart rate variability (HRV). This variability is reduced in CHF, and this HRV reduction is associated with a greater risk for arrhythmias. Furthermore, variations in heart rate influence the formation of proarrhythmic alternans, a beat-to-beat alternation in the action potential duration (APD), or intracellular calcium (Ca). In this study, we investigate how long-term changes in heart rate and electrical remodeling associated with CHF influence alternans formation. We measure key statistical properties of the RR-interval sequences from ECGs of individuals with normal sinus rhythm (NSR) and CHF. Patient-specific RR-interval sequences and synthetic sequences (randomly generated to mimicking these statistical properties) are used as the pacing protocol for a discrete time-coupled map model that governs APD and intracellular Ca handling of a single cardiac myocyte, modified to account for pathological electrical remodeling in CHF. Patient-specific simulations show that beat-to-beat differences in APD vary temporally in both populations, with alternans formation more prevalent in CHF. Parameter studies using synthetic sequences demonstrate that increasing the autocorrelation time or mean RR-interval reduces APD alternations, whereas increasing the RR-interval standard deviation leads to higher alternans magnitudes. Importantly, we find that although both the CHF-associated changes in heart rate and electrical remodeling influence alternans formation, variations in heart rate may be more influential.
NEW & NOTEWORTHY Using patient-specific data, we show that both the changes in heart rate and electrical remodeling associated with chronic heart failure influence the formation of proarrhythmic alternans in the heart.
Keywords: alternans, computational model, electrical remodeling, heart failure, heart rate variability
INTRODUCTION
Chronic heart failure (CHF) is a clinical syndrome occurring when the heart cannot adequately fill with or eject blood and thus cannot meet the body’s metabolic needs. This pathology arises because of functional or structural changes, such as in coronary artery disease or after an acute myocardial infarction (1). In the United States, individuals with CHF have a 5-yr mortality rate of 52.6%, for which sudden cardiac death, often mediated by ventricular arrhythmias, is a common cause of mortality (2–4). The increased arrhythmic risk in CHF is linked to pathological remodeling, including fibrosis, altered conduction, prolongation of the cardiac action potential, and modified autonomic tone. At the cellular level, these alterations occur in part because of altered ionic currents, including an increased late sodium current, and dysfunctional Ca handling, including increased Ca leak from the sarcoplasmic reticulum (SR) and reduced SR filling (4–6).
Changes in heart rate may also play a role in the increased arrhythmic propensity associated with CHF. Heart rate constantly varies from beat to beat on a time scale ranging from seconds to hours under physiological conditions, a phenomenon termed heart rate variability (HRV). Individuals with CHF have reduced HRV and increased heart rates, which indicates a greater risk for sudden cardiac death and overall mortality (7–12). Studies have shown that heart rate can be a strong contributor to the prognostic value of HRV, and heart rate is correlated with HRV, with faster heart rates associated with reduced HRV (13, 14). Clinical studies have also shown that heart rate reduction via pharmacological agents such as β-blockers or ivabradine correlates with improved cardiovascular outcomes and reduced mortality in CHF (11, 12, 15). Because of the medley of symptoms and concurrent pathological alterations that occur in CHF, at present it is not possible to determine the relative contribution of CHF-related remodeling versus variations in heart rate to increased arrhythmic propensity in a clinical setting.
Fluctuations in heart rate also impact the formation of proarrhythmic alternans, a beat-to-beat alternation in the action potential duration (APD), or intracellular Ca levels (16). Alternans formation is electromechanically concordant (discordant) when APD is in phase (out of phase) with Ca, such that a long APD corresponds to a large (small) Ca transient. Clinically, repolarization alternans at the cellular level manifests as T-wave alternans in an electrocardiogram (ECG) (17). The resulting beat-to-beat variability of repolarization further indicates increased arrhythmogenic risk, which can arise from atypical Ca handling and ion channel stochasticity (18). Although previous investigations have studied how HRV influences alternans formation, there is no consensus as to the effect of HRV. The Tolkacheva laboratory demonstrated that greater HRV promotes the formation of cardiac alternans in whole heart mouse experiments and single-cell simulations (19–21). In contrast, Dvir and Zlochiver showed that increasing HRV reduced the likelihood of APD alternans formation and decreases spatial APD heterogeneity in simulations of one and two-dimensional ventricular tissue (22, 23). Similarly, we previously showed that high HRV dampened APD alternans at shorter cycle lengths (for which alternans does form in the absence of HRV), while promoting APD alternans at longer cycle lengths (for which alternans is not present in the absence of HRV) (24). Other studies have also shown that variable pacing reduces APD oscillations and inhibits the formation of spatially discordant alternans with single-cell and tissue simulations, respectively (25–28). Note that these investigations are conducted at different spatial scales and importantly, results from isolated cardiac myocytes may not directly translate to the same behavior at the tissue/organ level or vice versa.
In many of these studies, HRV is emulated by adding Gaussian noise to a constant pacing period, where the standard deviation determines the level of HRV. Although this method provides precise experimental control, it is not representative of physiological HRV. Changes in heart rate are not random, but instead depend on a variety of factors including circadian rhythm, autonomic function, and stochastic pacemaking. These simulations and experiments are also typically conducted on a short time scale, corresponding to seconds or minutes of real time. Thus, the effect of long-term changes in heart rate on alternans formation has not been previously studied.
Ionic models are a common tool used to study cardiac electrophysiological dynamics, such as alternans formation, as systems of nonlinear differential equations can be used to simulate detailed ion channel biophysical function. These models have also been extended to incorporate ionic homeostasis, hormone regulation, metabolism, and anatomical heterogeneity (29, 30). Recently, a novel research paradigm has emerged, in which ionic models are paired with structural data in a patient-specific manner to investigate arrhythmic propensity. For example, patient-based ionic model simulations integrating magnetic resonant imaging-based structure have supported clinical decision-making in patients undergoing ablation for atrial fibrillation (31–33). In comparison, there is a dearth of studies that incorporate patient-specific changes in heart rate, which is easily measured noninvasively using ECG and calculated based on successive R-wave intervals (i.e., RR sequences). It is computationally infeasible, however, to simulate changes in heart rate and the resulting electrophysiology on long time scales using ionic models, because of their level of detail and associated computational cost.
Discrete-time models are an alternative, computationally efficient method that simplifies complex cardiac systems based on the overarching phenomena. For example, an iterative model was used by Guevara et al. to develop the novel restitution hypothesis, which predicts that APD alternans form when the slope of the restitution curve [APD plotted against the preceding diastolic interval (DI)] is greater than 1 (34). These models have also been used to investigate the validity of the restitution hypothesis, conduction block formation, and elucidate the role of Ca signaling in alternans formation (35–38). Furthermore, Qu et al. developed an innovative discrete-time map model that includes a more representative formulation of excitation-contraction coupling, i.e., coupling between the APD and Ca, and studied the emergent nonlinear dynamics, including alternans formation and quasiperiodicity (39). We previously used this model to study the short-term effects of changes in heart rate in the presence of homogeneous and heterogeneous Ca signaling, by employing the Gaussian noise method (24, 40). Our studies predicted that increasing HRV has antiarrhythmic effects, including disrupting alternations in APD and peak Ca, weakening the relationship between APD and peak Ca, and reducing the proarrhythmic impact of subcellular Ca heterogeneity.
Here, we extend this work and study how changes in heart rate influence electromechanical properties at different time scales in normal sinus rhythm (NSR) and CHF and investigate the distinct contribution of CHF-related electrophysiological remodeling and changes in heart rate to alternans formation. To generate patient-specific simulations, we create and combine phenotype-specific (i.e., NSR and CHF) parameter combinations for the Qu et al. model with RR sequences of varying durations from individuals with NSR and CHF. We also characterize the RR sequences and calculate three statistical measurements: the mean RR interval, RR-interval standard deviation, and autocorrelation time, which are used to generate synthetic RR sequences. Simulations using synthetic sequences show that varying each statistical property influences APD beat-to-beat variability in NSR and CHF in a similar manner, i.e., similar trends are observed in both populations as a specific statistical property is varied. The synthetic sequences also generate electrical activity similar to that resulting from the patient sequences, particularly at shorter time scales. In addition, the magnitude of APD alternations vary temporally in both populations, though the overall magnitude is higher in CHF, suggesting that APD alternans are more prevalent. Finally, we demonstrate that both the specific changes in heart rate and CHF-associated remodeling influence arrhythmic propensity and indeed suggest that changes in heart rate may be more impactful.
METHODS
Patient Data
We obtained 24-h sequences of RR intervals, where an RR interval is the time between successive R waves in an ECG, from 54 individuals with NSR and 29 with CHF from a Physionet database (41). The database consists of RR sequences that were previously derived from ECGs digitized using a sampling rate of 128 samples per second, for which the beat annotations were determined using automated analysis that was manually reviewed and corrected. Subjects missing more than 10% of their RR intervals were excluded from analysis, resulting in NSR and CHF populations of 53 and 25 subjects, respectively. The NSR population consists of 23 female (43%) and 30 male (57%) subjects, aged 28.5 to 76 yr old (mean, 61 ± 11.7 yr). The age of individuals in the CHF population ranges from 34 to 72 yr (mean age, 54 ± 10.8 yr) and includes two females (8%), seven males (28%), and sex not known for the remaining 16 subjects (64%). Individuals in the CHF population were categorized with New York Heart Association heart failure class I (8%), II (28%), or III (64%).
To characterize the RR sequences from each subject, we calculate three statistical measurements: the mean RR interval (μ), RR-interval standard deviation (σ), and autocorrelation time (τ): each 24-h RR sequence is divided into segments of a specified duration, denoted as the time window, which ranged from 3 min to 24 h. This range was selected based on durations of ECG recordings frequently used in HRV analysis (42, 43). For each segment, μ and σ were measured by calculating the mean and standard deviation of the RR intervals, respectively, within that segment. The autocorrelation time τ is a measure of the level of self-similarity in the RR sequence. We measure τ by first calculating the autocorrelation function, which is the correlation between a signal and a time-shifted version of itself, known as the delay. The autocorrelation function is implemented using the autocorr MATLAB function and is given by the following equation for a time series yn:
| (1) |
where k is the delay, is the time series mean, s2 is the time series variance, and N is the time series length. By definition, a delay of 0 corresponds with a perfect correlation of 1. The value of τ represents the delay (here, corresponding to the number of beats), for which the autocorrelation function first falls below a threshold of (1/e) (44), a threshold used in a wide range of fields (45, 46). Note that although τ is measured in terms of beats, a given τ can be converted to units of time by multiplying by the mean RR interval over that segment. These metrics are calculated for each segment of the 24-h RR sequence for a specific time window, and summary measures are presented as the mean across all segments for a given subject.
NSR and CHF Discrete-Time Map Models
To investigate the effects of physiological and pathological changes in heart rate at different time scales on electromechanical properties, we use a discrete-time coupled map model of a cardiac myocyte to simulate beat-to-beat changes in APD and Ca handling dynamics. The model equations are described below, with the complete model equations and parameters listed in Supplemental Methods and Table S1, respectively (https://github.com/SHWeinberg/Phadumdeo-HRV-CHF). Further details of the model formulation be found in prior studies (24, 39, 47). In this cardiac myocyte model, the APD depends on both Ca-dependent properties and voltage-based recovery kinetics and is given by:
| (2) |
where APDn+1 is the APD of the (n + 1)th beat, is the peak intracellular Ca on the (n + 1)th beat, γ defines Ca-APD coupling, DIn is the diastolic interval of the nth beat, and f(DIn) is the APD restitution function. The pacing period on the nth beat, tn, relates APDn and DIn on the nth beat, such that tn = APDn + DIn. The peak intracellular Ca () is given by:
| (3) |
the sum of all Ca released by the SR on the (n + 1)th beat (Jrel,n+1) and the diastolic Ca concentration within the cell on the nth beat (). The diastolic Ca concentration on the nth beat is defined as:
| (4) |
the difference between the total Ca concentration within the cell ([Catot]n) and the SR Ca load at the end of the nth beat ([CaSR]n), which incorporates SR leak. The SR Ca load on the (n + 1)th beat,
| (5) |
is the sum of the SR load of the previous beat ([CaSR]n) and SR Ca uptake (Jup, n+1), less the SR Ca release (Jrel, n+1) and leak (Jleak, n+1). The SR Ca release on the (n + 1)th beat is defined as
| (6) |
where q(DIn) describes the SR Ca release restitution properties with respect to the prior diastolic interval, g([CaSR]n) expresses the SR Ca release dependency on the current SR load, and λ defines the release magnitude. Ca uptake through the SERCA pumps to the SR on the (n + 1)th beat is represented by:
| (7) |
where u(tn+1) describes the SR Ca uptake dependence on the stimulus period, expresses dependence on the peak Ca concentration, and v is the SR Ca uptake rate. The total Ca within the cell on the (n + 1)th beat ([Catot]n+1) is the sum of the total Ca on the nth beat ([Catot]n) and the net Ca efflux or influx on the current beat:
| (8) |
where η describes APD-Ca coupling, the Ca accumulation rate is expressed by κ, as total Ca approaches a steady-state stimulus period-dependence intracellular Ca concentration, c(tn+1). Overall, total Ca increases for shorter stimulus periods. If APD varies for consecutive beats, a net Ca influx or efflux occurs, depending on positive or negative APD-Ca coupling.
We augmented the original model by adding a term for Ca leak from the SR (Jleak), with the Ca leak on the (n + 1)th beat (Jleak,n+1), described similar to SR Ca release, with magnitude δ:
| (9) |
Model functions describing key restitution, rate-, and calcium-dependent relationships are shown in Supplemental Fig. S1. We note that the map model Ca concentrations ([Catot]n, , [CaSR]n, and ) do not account for volumes in the cellular or subcellular compartments, nor Ca buffering, which leads to differences between the model and experimental measurements (47). The map model phenomenological relationships do not represent detailed cellular processes, such as ion channel function or Ca buffering, as this simplicity is necessary given the large computational burden of simulating long-term changes of HRV.
The original discrete time map model was developed as a general model to represent small mammal electrophysiology, and is thus based on heart rates faster than that of humans. To account for these differences in time scale between small mammals and humans and also differences in NSR and CHF electrophysiology, we performed several systematic steps to modify model parameters. We first scaled the parameters in the pacing rate-dependent processes [q(DIn), u(tn+1), and c(tn+1)] to account for a twofold slower time scale in humans (see Supplemental Table S1). To fit differences in NSR and CHF electrophysiology, we first fit the restitution curve [f(dn)] to that of a healthy and CHF ventricular myocyte model, respectively. Specifically, we simulated the O’Hara-Rudy healthy human ventricular myocyte model [ORd (48)] for pacing periods (or cycle lengths) ranging from 240 to 2,000 ms, to obtain a APD versus diastolic interval relationship, which was then fit to obtain the parameters (a0, d0, and τ0) in the APD restitution equation (Eq. S1) using the fminsearch MATLAB function. We then incorporated CHF-associated model parameters into the ORd model, as described by Gomez et al. (49), and repeated this process to obtain the CHF APD restitution parameters. The best fit NSR and CHF ADP restitution curves are shown in Supplemental Fig. S2B (lines), with simulated NSR and CHF ORd values (open circles).
To account for Ca handling-related differences in NSR and CHF electrophysiology, we identified values for four key parameters, β, ν, λ, and δ, which correspond with the steepness of the SR Ca release versus load curve, SERCA Ca uptake rate, SR Ca release rate, and SR Ca leak rate, respectively, in a systematic manner, as follows. Specifically, we performed a broad parameter study to identify parameters that qualitatively recapitulated experimental differences between NSR and CHF conditions. We assumed δ = 0 for the NSR model, i.e., no SR Ca leak; thus, we had to fit the remaining seven values for the NSR and CHF model parameters. We randomly sampled values for each parameter over empirically determined ranges (β = [0.5, 15], ν = [0.04, 1.6], λ = [0.1, 4], and δ = [0.016, 0.98]), and identified combinations that resulted in APDs and Ca concentrations meeting the following criteria: 1) the NSR pacing period onset of APD alternans of 300 ± 40 ms (48); 2) the NSR maximum APD alternans magnitude of at least 4 ms (to select for parameter regimes for which alternans form); 3–6) the CHF SR Ca load, release, and uptake, and peak Ca concentrations reduced compared with NSR (50–54); 7) the CHF APD prolonged compared with NSR (55, 56); 8) the CHF APD alternans onset pacing period that is 140 ± 40 ms longer than the NSR APD alternans onset (50, 57, 58); and 9, 10) the maximum of the CHF APD and peak Ca alternans magnitude greater than NSR (we assume larger APD alternans magnitude will correspond to larger peak Ca alternans magnitude because of bidirectional coupling) (50, 57, 58). Specifically, we initially generated 106 parameter sets from uniform distributions over the specified ranges for the NSR-related parameters and performed simulations to identify sets meeting criteria (1) and (2), leading to the identification of 24,354 parameter sets for the NSR parameters. For each NSR parameter set, we then generated four different CHF parameter sets (for each CHF-related parameter), thus testing 97,416 parameter combinations to also meet criteria (3–10). Interestingly, a single parameter set was identified through this process, which was then used as the initial set for parameter optimization, using the fminsearch MATLAB function and cost function (based on the above criteria) given in Eq. S7, to identify the parameter combination that reproduces differences between NSR and CHF electrophysiology and Ca handling.
The final parameter values are listed in Supplemental Table S1, and plots of steady-state APD and Ca values for NSR and CHF parameters as functions of the pacing period T0 (in the absence of HRV) are shown in Supplemental Fig. S2. Consistent with the previously enumerated investigations, the CHF model exhibits reduced peak Ca concentrations, longer APDs, alternans formation at slower cycle lengths, and larger APD alternans amplitude. Additionally, the Ca dynamics in the CHF model are altered such that there is reduced SR load, release, and uptake. Although the etiology of remodeling in CHF is varied, studies suggest that these changes may be caused because of an increased late sodium current, reduced depolarizing currents, increased NCX expression, and dysfunctional Ca signaling. This altered Ca signaling cycle is mediated by reduced SERCA expression, spontaneous Ca release due to a leaky SR, and elevated diastolic Ca levels (5). Unlike experimental trends, our CHF model was not able to recapitulate increased diastolic Ca levels in CHF.
Patient-Specific and Synthetic Pacing Protocols
The RR interval is analogous to the pacing period (tn) in the discrete time map model; thus, to simulate the patient-specific heart rate in individual myocyte simulations, we use the patient-derived RR sequences as the pacing period sequence (i.e., the pacing period on the nth beat). We simulate 24 h of electrical activity for each subject by segmenting the 24-h RR sequence into segments of a given duration or time window. For example, a 5-min time window results in 288 sequences, which in turn define the pacing period for the discrete time map model simulations and associated APD and Ca beat-to-beat dynamics.
In addition to directly using patient-specific RR sequences as the model pacing period, we also generate and use synthetic sequences, based on the three statistical measurements of the mean RR-interval μ, RR-interval standard deviation σ, and autocorrelation time τ (described in more detail in the Patient Data). This allows us to directly assess the individual impact of each of these three pacing period properties on electromechanical dynamics, which would not be possible using only the patient-specific sequences as all three measures vary simultaneously. Note that our prior work (24, 47) investigated the impact of varying μ and σ in the baseline discrete-time map model (i.e., without human and NSR/CHF associated changes), also assuming heart rate followed a Gaussian distribution (corresponding with τ = 0). However, analysis of the patient-specific RR intervals and the evidence of self-similarity in the intervals motivated the generation of synthetic sequences with nonzero τ values. For a subset of conditions, we also define a corresponding Gaussian RR sequence for a given combination of statistical properties by selecting a series of RR intervals from a normal distribution scaled to a specific mean RR interval (μ) and RR-interval standard deviation (σ), as done previously (24, 47), for comparison.
For a given set of μ, σ, and τ values, a synthetic sequence is created by first filtering a normally distributed sequence (mean 0 and standard deviation of 1) using the Yule-Walker equations. Since RR intervals are a time-varying signal, a given RR sequence can be represented using an autoregressive model, for which each RR interval depends linearly on the previous RR intervals with some noise. The Yule-Walker equations are used to derive the weights of the previous terms, which depend on a specific autocorrelation time (τ). The filtered sequence is then scaled to have a specific mean (μ) and standard deviation (σ). To ensure the synthetic sequence autocorrelation time is accurate, the synthetic sequence autocorrelation function is calculated and constrained to be within a 5% threshold of an idealized autocorrelation function with the specific τ for a given number of beats (∼2.3τ). If this constraint is not met, the process is repeated until a synthetic sequence is identified or the algorithm reaches 100,000 iterations, in which case the threshold is then increased to 10%. Note that a given synthetic sequence is not unique, i.e., the same combination of statistical properties can generate multiple, different synthetic sequences. Thus, in assessing the role of a given RR-sequence statistical property, multiple synthetic sequences are generated and compared. For nearly all combinations of μ, σ, and τ values, this methodology was able to generate multiple synthetic sequences; however, the approach failed for a small subset of combinations of statistical measurements.
To identify the influence of each statistical metric on electromechanical properties, parameter studies of the μ, σ, and τ values, based on the ranges identified in the patient RR-interval sequences, are conducted, in which synthetic sequences are generated and used as the pacing period in the discrete-time map model. We also directly compare simulation measurements between the pacing period defined from the patient-specific RR interval versus synthetic sequences with the same corresponding statistical properties. This allows us to directly compare how accurate the synthetic sequences reproduce simulations of patient-specific RR-interval dynamics. Throughout the manuscript, we refer to sequences of patient RR intervals as “patient-specific sequences” and RR sequences randomly generated for a given combination of statistical measurements as “synthetic sequences.”
Simulation Measurements of APD and Ca Dynamics
From each simulation, we perform several measurements of the APD and Ca dynamics to quantify the beat-to-beat changes. We characterize the formation of alternans by calculating the mean magnitude of the beat-to-beat differences in APD (ΔAPD) and peak Ca (), which under constant pacing corresponds to the alternans magnitude:
| (10) |
where y is either APD or .
Alternations in APD and peak Ca are measured by quantifying the Pearson correlation coefficient between successive beats of APD (ρa, APDn+1 vs. APDn) and peak Ca (, vs. ), respectively, where a correlation of –1 indicates alternans formation, a value of 0 corresponds to a nonalternating pattern, and a value of +1 indicates a stable pattern. We quantify the APD-peak Ca relationship by calculating the Pearson correlation coefficient between APD and peak Ca on the same beat (APDn vs. ), where a value of +1 (–1) indicates that APD and peak Ca are electromechanically concordant (discordant) or in phase (out of phase). The final 90% of each simulation is analyzed to avoid initial transient effects. In addition, the correlation coefficients (, , and ) are not calculated if the coefficient of variation of either variable is less than 1%. Statistical significance of differences in summary measurements is conducted using unpaired and paired t tests, as appropriate.
RESULTS
Differences in RR-Sequence Statistical Properties between NSR and CHF Subjects
In Fig. 1, we plot sequences of RR intervals, i.e., the time between successive R waves in the ECG, from 24-h recordings for subjects with NSR (black, NSR subject 1) and CHF (red, CHF subject 1). The NSR subject RR sequence exhibited greater modulations in the RR interval, further characterized by the broader RR-interval distribution in gray (Fig. 1A, right). For a given RR sequence, we quantify three key measurements: the mean RR interval (μ), RR-interval standard deviation (σ), and autocorrelation time (τ), which measures the self-similarity within a sequence. These metrics are calculated over a 5-min time window, i.e., measured for each 5-min segment within the 24-h RR sequence. Note that these metrics calculated over the 5-min time window are time varying over the 24 h for a given subject (Supplemental Fig. S3). The corresponding distributions for these two NSF and CHF subject RR-interval sequence metrics are shown in Fig. 1B. The NSR subject exhibits a wider distribution of mean RR intervals and a tendency for higher RR-interval standard deviations, indicating increased levels of HRV. The NSR subject RR-interval sequence also tends to exhibit slightly greater self-similarity, demonstrated by the increased autocorrelation time (Fig. 1B). Across all time windows, the individuals exhibit significant differences in RR interval, mean RR interval, and RR-interval standard deviation distributions (Fig. 1).
Figure 1.

Properties of an RR sequence vary temporally over 24 h and differ between an individual with normal sinus rhythm (NSR) and chronic heart failure (CHF). A: sequences of RR intervals from 24-h recordings for NSR subject 1 (black) and CHF subject 1 (red) are shown with the resulting RR-interval distributions. B: NSR and CHF subject distributions of the mean RR interval (μ), RR-interval standard deviation (σ), and autocorrelation time (τ), calculated from each 5-min time window (TW) of the 24-h sequences are displayed. The individuals’ RR interval, mean RR interval, and RR-interval standard deviation distributions are significantly different. *P < 10−3, unpaired t test.
We summarize these metrics by plotting the mean measurement for all NSR (gray, 53) and CHF (light red, 25) subjects, and the population-specific median (black and red for NSR and CHF, respectively), as a function of the time window (Fig. 2). The mean of the mean RR interval does not depend on the time window in either population (Fig. 2A). In contrast, the RR-interval standard deviation and autocorrelation time both increase with longer time windows, demonstrating that the level of variability and self-similarity within the RR sequence increases with longer analysis durations (Fig. 2, B and C). The CHF population has statistically significant shorter mean RR intervals (i.e., faster heart rates), and reduced RR-interval standard deviations (i.e., lower HRV), compared with the NSR population across all time windows. The autocorrelation time tends to be longer in NSR than CHF, with the difference between the two populations generally larger and statistically significant for longer time windows (Fig. 2C). Note that despite the differences at the population level, there is also substantial interperson variability (thin lines), such that some individuals in the NSR population have RR-sequence properties similar to the CHF population, and vice versa.
Figure 2.

RR-sequence statistical properties for the normal sinus rhythm (NSR; 53 subjects) and chronic heart failure (CHF; 25 subjects) populations. The CHF population tends to have a decreased mean of mean RR interval (i.e., faster rate), RR-interval standard deviation, and autocorrelation time, compared with the NSR population. The mean of each subject’s mean RR interval (μ, A), RR-interval standard deviation (σ, B), and autocorrelation time (τ, C) are plotted as a function of the time window (TW). Population-specific medians are denoted in red (CHF) and black (NSR). The mean of mean RR interval and RR-interval standard deviation are significantly shorter at all time windows (*P < 10−3), whereas the mean of autocorrelation time is significantly shorter at long time windows (*P < 10−2, right of the blue dashed line) in CHF, based on unpaired t tests.
Patient-Specific NSR and CHF Electrical Dynamics
We next performed simulations of the electrical dynamics for a 5-min time window, using patient-specific model parameters and RR-interval sequences. We plot the patient RR-interval sequence (top) and resulting APD (middle) and peak Ca (bottom), as a function of beat number for a subject with NSR (Fig. 3A) and CHF (Fig. 3B). The NSR subject’s pacing sequence and corresponding APD and peak Ca are variable and slowly drift over time. In contrast, there are more dramatic beat-to-beat changes in the CHF subject’s pacing sequence, and thus APD and peak Ca alternans form transiently in both APD and peak Ca, such as near beat 300. In addition, these simulations recapitulate several experimental trends, such as APD prolongation and reduction in peak Ca in CHF.
Figure 3.

RR intervals, action potential duration (APD), and peak Ca for normal sinus rhythm (NSR) and chronic heart failure (CHF) subjects. APD and peak Ca drift slowly in the NSR subject, whereas there are more dramatic beat-to-beat changes and transient alternans formation in the CHF subject. Traces of a 5-min RR sequence (top) and the corresponding APD (middle) and peak Ca (bottom) beat-to-beat values are depicted from NSR subject 1 (A) and CHF subject 12 (B). Time window (TW) = 5 min.
To further characterize the relationship between APD and peak Ca for the NSF and CHF subject, we show scatter plots of APD against the corresponding peak Ca concentration (left), successive APD values (APDn+1 vs. APDn, middle), and successive peak Ca values ( vs. , right) for each subject’s 5-min simulation (Fig. 4). For the NSR subject, we find a moderately negative relationship between APD and peak Ca, such that a longer APD corresponds to a smaller peak Ca concentration (Fig. 4A, left), and vice versa. There is also positive trend between successive APD values (middle) and similarly between successive peak Ca values (right), demonstrating minimal beat-to-beat variation.
Figure 4.

Chronic heart failure (CHF)-related remodeling and RR sequences alter the interplay between action potential duration (APD) and peak Ca, and the correlations between consecutive APD and peak Ca values. Scatter plots of APD vs. peak Ca (left), successive APD values (middle), and successive peak Ca values (right) are shown for the normal sinus rhythm (NSR) subject 1 (A) and CHF subject 12 (B) simulations depicted in Fig. 3. Blue dashed line is the line of equality. Time window (TW) = 5 min.
In contrast, for the CHF subject, APD and peak Ca concentration are weakly correlated (Fig. 4B, left). In addition, in the plot of successive APDs (middle), the cluster of points in the center indicates beat pairs for which APD is similar from beat-to-beat, whereas the points along the negative diagonal denote beat pairs for which APD varies from short to long and long to short. Similar trends are shown in peak Ca, albeit with more loosely scattered points (right). The clustering and negative relationship between APD and peak Ca on successive beats signify transient alternans formation in this CHF patient-specific simulation.
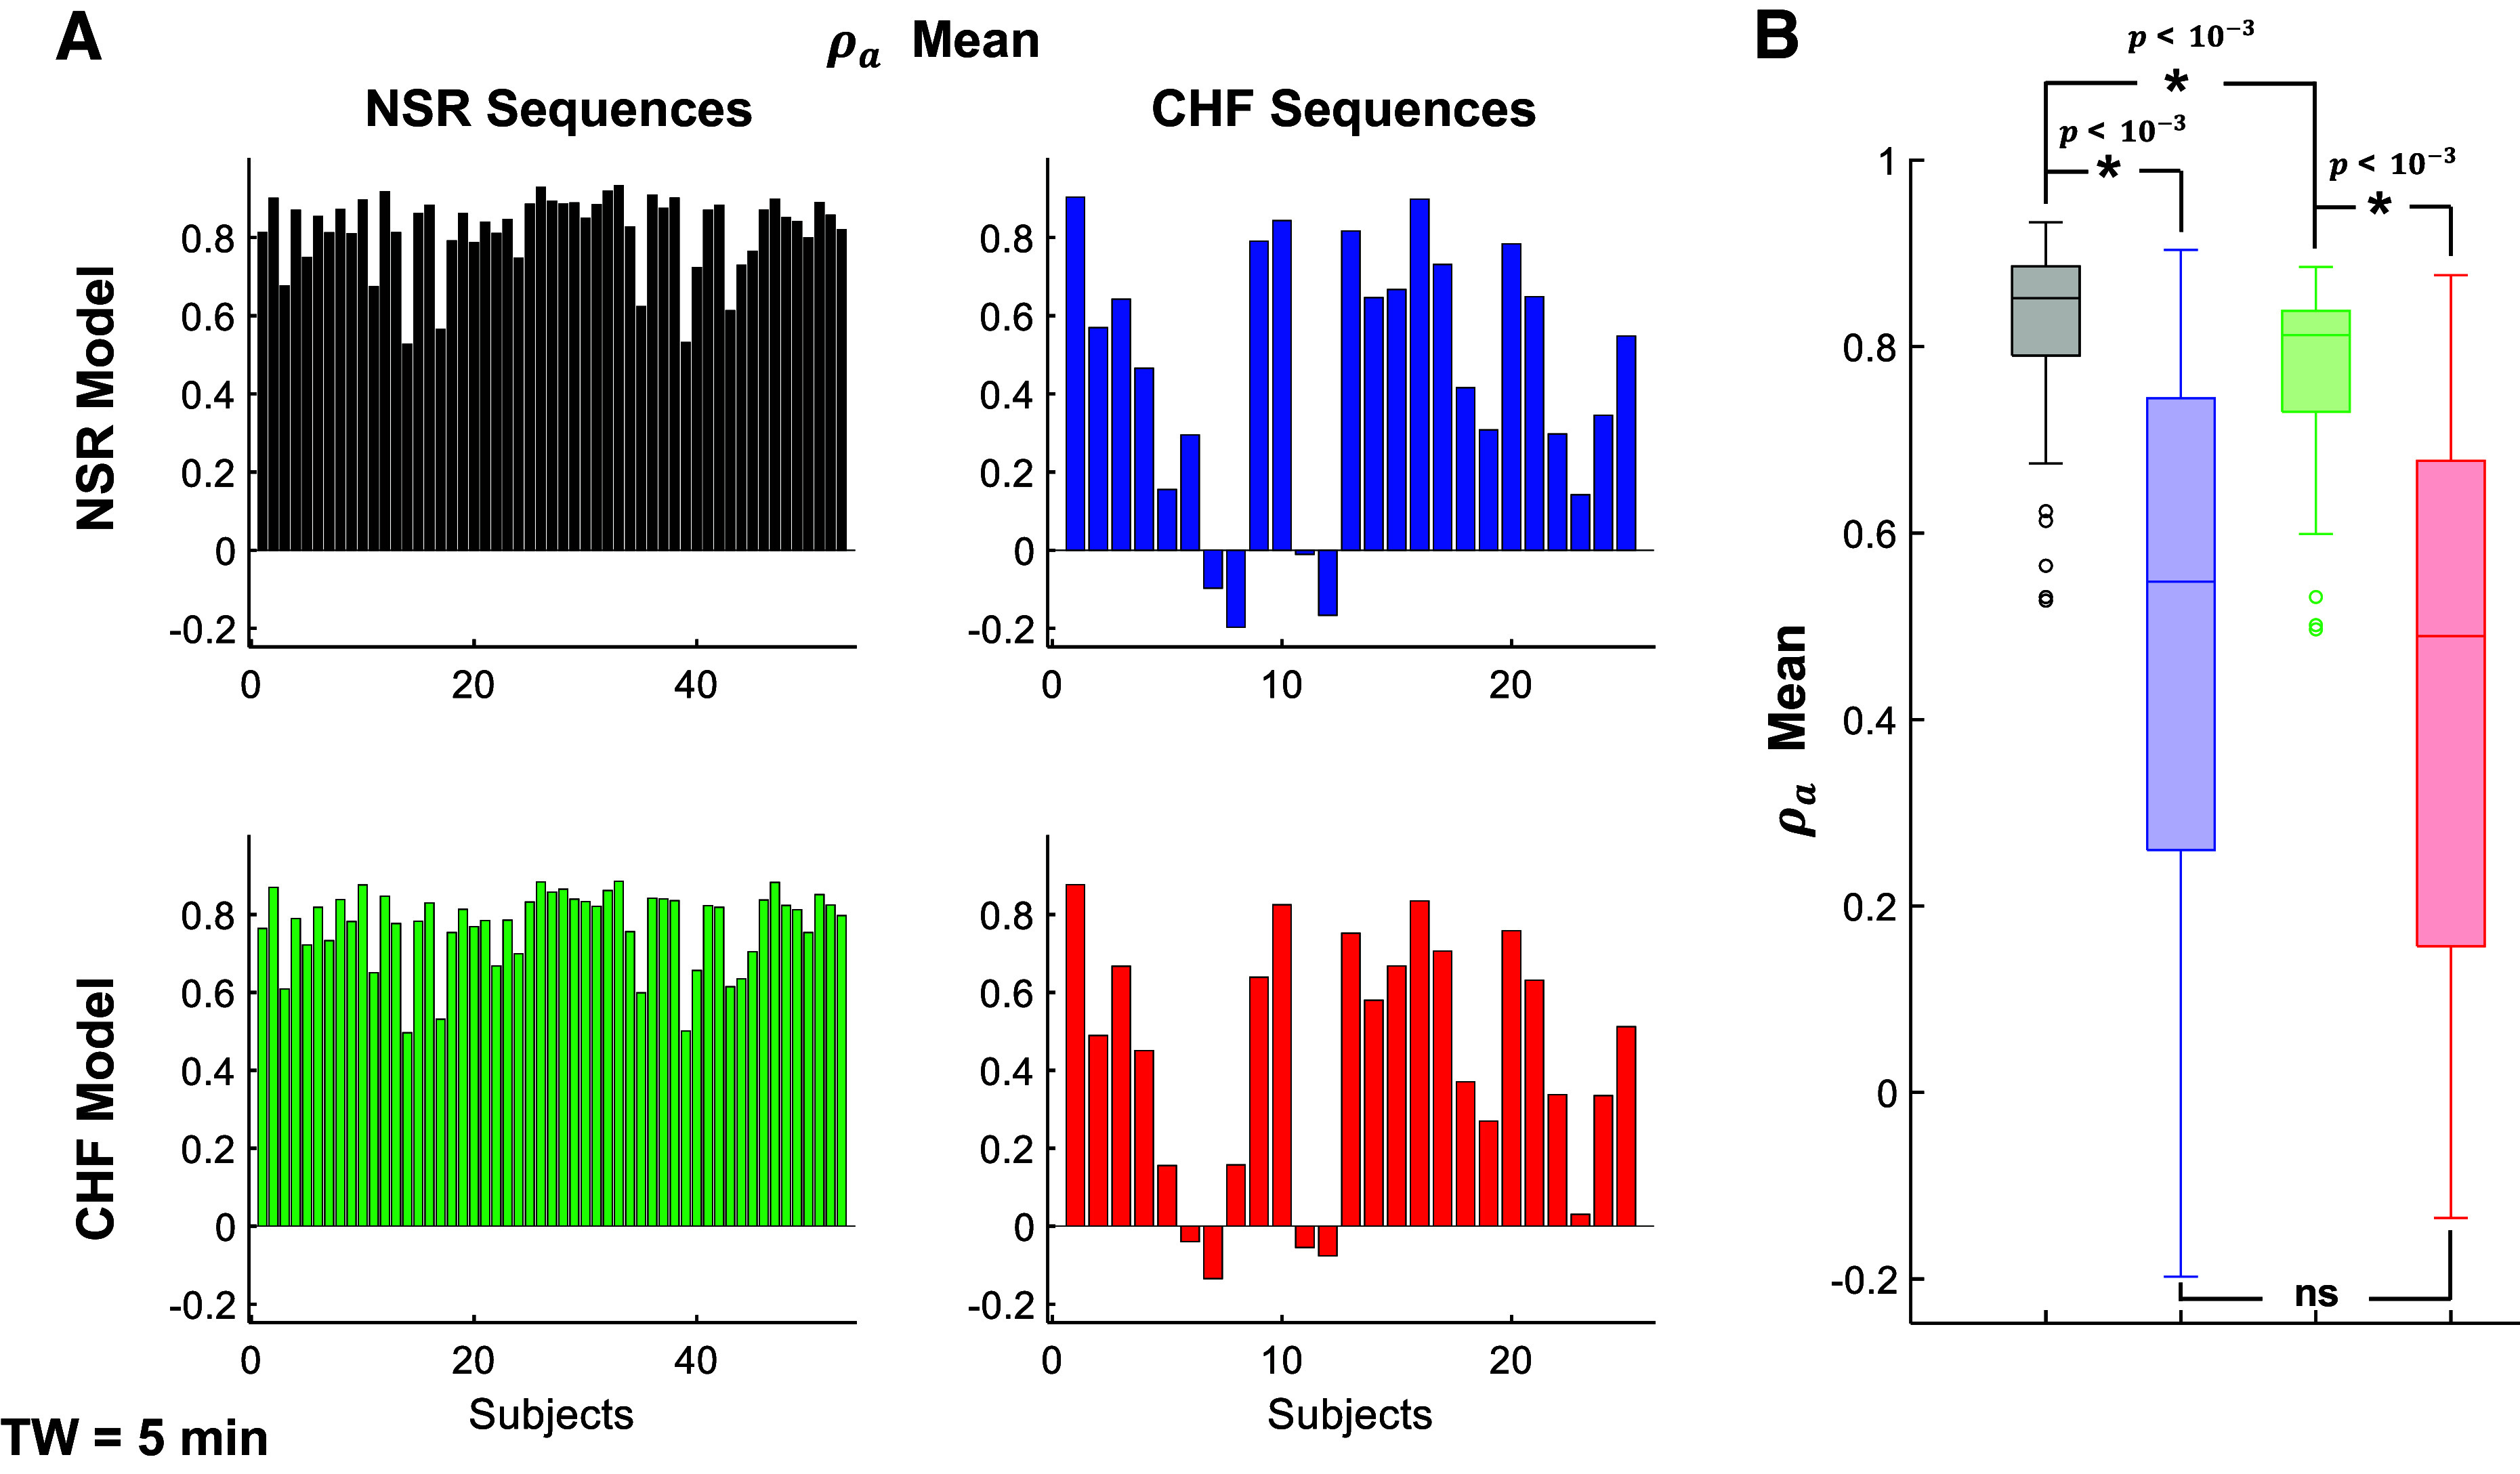
We next simulate the full 24 h of electrical activity for all subjects, for a 5-min time window, i.e., segmenting each 24-h RR sequence into 5-min sections and quantifying the resulting simulations using the following metrics for each segment: mean magnitude of the beat-to-beat difference in APD (ΔAPD), mean magnitude of the beat-to-beat difference in peak Ca (), and correlation coefficients between APD and peak Ca (), APD on successive beats (ρa), and peak Ca on successive beats (). These results are summarized by plotting ΔAPD as a function of time interval and subject number (Fig. 5A), and the mean of all intervals for both ΔAPD and ρa for each subject (Fig. 5B). For a specific subject, we find that ΔAPD varies in time, such that there are intervals with both small and large alternations for individuals in both populations. There is also intersubject variability in both ΔAPD and ρa within each population. In the NSR population, the overall magnitude of ΔAPD is typically smaller, and ρa is closer to +1, suggesting that APD alternans rarely form. In contrast, the CHF population exhibits statistically significantly larger ΔAPD and reduced ρa values, indicating that APD alternans are more prevalent (Fig. 5, right). Similar trends are also seen in peak Ca dynamics (Supplemental Fig. S4).
Figure 5.

Action potential duration (APD) alternans formation is more prevalent in chronic heart failure (CHF). A: ΔAPD is shown for each 5-min segment of every 24-h RR sequence in both populations. B: temporal mean of ΔAPD and ρa is depicted for each subject in the normal sinus rhythm (NSR; black) and CHF (red) populations. The populations have a significantly different mean of ΔAPD and ρa (*P < 10−3, unpaired t tests). Time window (TW) = 5 min. ΔAPD, mean magnitude of the beat-to-beat difference in APD; ρa, correlation coefficient between successive beats of APD.
We additionally plot the mean of for each subject (Supplemental Fig. S5A). In the NSR population, APD and peak Ca on average exhibit a negative correlation. We note that this negative correlation does not indicate a negative coupling between APD and peak Ca, as indeed the model defines a positive coupling. However, this negative correlation occurs because faster pacing influences APD and peak Ca differently, such that faster pacing leads to both shorter APD and larger peak Ca concentration. This trend is also prevalent in the CHF population indicated by the lack of significant difference between the two populations, although some subjects exhibit on average a less negative and even positive correlation between APD and peak Ca.
To investigate how these trends depend on the time window duration, we also simulated NSR and CHF subject-based dynamics for a 1-h time window. Over this longer duration, the pacing sequence, APD, and peak Ca beat-to-beat traces continue to drift for the NSR subject (Supplemental Fig. S6A). There is less overall variability in the CHF subject’s beat-to-beat dynamics, though there are periods with similar properties to the 5-min simulation (beat 5,000, Supplemental Fig. S6B). On this longer time scale, there is a clearer negative relationship between APD and peak Ca and a positive correlation between APD and peak Ca on successive beats for the NSR subject, while these trends are a bit weaker for the CHF subject (Supplemental Fig. S7). Consistent with trends for the 5-min time window, the CHF population exhibits larger alternations in both APD and peak Ca and a less positive ρa and , compared with the NSR population (Supplemental Figs. S8 and S9). The population differences in all five measurements are statistically significant at a longer time window. Interestingly, collectively the CHF population demonstrates trends more similar to the NSR population for a longer time window, suggesting that although simulations of the CHF population exhibit more proarrhythmic phenomena at short and long-time scales, characterization of these properties is time-scale dependent.
Synthetic Heart Rate Sequences-Based Electrical Dynamics
Although the above simulations using patient-specific RR-interval sequences demonstrate differences in electrical dynamics between NSR and CHF subjects, the key properties of the RR-interval sequences also differ between these two populations (as characterized in Fig. 2), such that it is unclear how electrical dynamics depend on the individual RR-interval sequence properties. Therefore, we next generate synthetic heart rate sequences and systematically vary the three key statistical properties of a given RR sequence: the mean RR interval (μ), RR-interval standard deviation (σ), and autocorrelation time (τ). We first illustrate how varying the statistical properties alter the characteristics of the synthetic sequences. Sample RR-interval synthetic sequences are plotted as a function of beat number for three 5-min sequences for different combinations of statistical properties (Fig. 6). In each column, two properties are fixed as the mean of the mean NSR and CHF population values, and the third property is defined as 50%, 100%, and 150% of its corresponding mean. Note that a longer mean RR interval or a larger μ (left) reduces the number of beats in a 5-min sequence. As expected, increasing the RR-interval standard deviation (σ, middle) generates a more variable RR-interval sequence. In contrast, increasing the autocorrelation time (τ, right) tends to reduce the beat-to-beat variability in the RR interval, consistent with enhanced self-similarity in the RR intervals (Supplemental Fig. S10). These trends are consistent for a 1-h time window, as the influence of each statistical property on the RR sequence is independent of duration (Fig. 6B). Similar trends are observed when the RR-interval statistical properties are varied in a population-specific manner (Supplemental Fig. S11).
Figure 6.

Varying the RR-sequence statistical properties leads to distinctly different synthetic sequences. RR-interval synthetic sequences are plotted as a function of beat number for different combinations of statistical properties, where two properties are the mean of the normal sinus rhythm (NSR) and chronic heart failure (CHF) population values and the third property is 50, 100, and 150% of its corresponding mean. Plots are shown for time windows (TWs) of 5 min (A) and 60 min (B).
We next explored how variations in each statistical property influence electrical dynamics by plotting ΔAPD for five generated synthetic sequences with different combination of μ, σ, and τ, where two properties are the population-specific mean, and the third is varied. Since multiple synthetic sequences can be created for a specific combination of statistical measurements, ΔAPD is shown for five synthetic sequences (represented by five bars) for each parameter combination (Fig. 7). Note that for each population (NSR or CHF), we use the corresponding population model parameters. For both the NSR and CHF models and synthetic sequence properties, we find similar trends. Increasing either the RR-interval autocorrelation time τ (left) or the mean RR interval μ (right) reduced ΔAPD, whereas increasing the RR-interval variability (middle) increased ΔAPD (although the magnitude of the changes is small). Trends are similar for a longer time window (Supplemental Fig. S12). We also find that increasing τ increases ρa, whereas increasing σ and μ had minimal influence on ρa (Supplemental Fig. S13).
Figure 7.

Increasing μ and τ decreases action potential duration (APD) alternation, while increasing σ increases alternations in APD. ΔAPD is shown for five synthetic sequences (each bar) for different combinations of statistical properties, where τ (left), σ (middle), and μ (right) are broadly varied and the remaining two parameters are the population mean. The third normal sinus rhythm (NSR) and chronic heart failure (CHF) mean parameter value is shown in black and red, respectively. Results are shown for both the NSR (A) and CHF (B) models. Time window (TW) = 5 min.
Furthermore, we investigated to what extent the model parameters (i.e., NSR or CHF based) influence the electrical activity underlying synthetic sequences. Figure 8 depicts ΔAPD for different values of μ (x-axis) and σ (y-axis), for different values of τ (Fig. 8, A and B). The NSR and CHF model parameters are used for the left and middle columns, respectively, whereas the right column denotes the CHF-NSR ΔAPD ratio. As in Fig. 7, reducing μ (i.e., faster pacing) and larger σ (i.e., higher variability) leads to increased alternations in APD, while increasing τ reduces ΔAPD. These trends are consistent for both NSR and CHF model parameters (left and middle): ΔAPD is largest for short μ, high σ, and low τ in both populations. For the same synthetic sequences, ΔAPD is larger in CHF model, i.e., the CHF-NSR ΔAPD ratio is always greater than 1, with the greatest difference between NSR and CHF occurring at short μ, low σ, and high τ (Fig. 8, right).
Figure 8.

The chronic heart failure (CHF) model leads to greater action potential duration (APD) alternations than the normal sinus rhythm (NSR) model for a specific synthetic sequence. A: ΔAPD value is plotted for different values of μ (x-axis), σ (y-axis), and τ (row) using the NSR (left) and CHF (middle) models. The mean NSR and CHF μ and σ are depicted in black and red circles, respectively. B: corresponding ratio of CHF to NSR ΔAPD is also shown. Time window (TW) = 5 min.
Varying these statistical properties has similar effects on , except at short μ for which increasing σ reduces (Supplemental Fig. S14). We similarly depict the correlation coefficients between APD and peak Ca in Supplemental Fig. S15. ρa and are negative at shorter μ (faster pacing rates) due to more prominent alternans formation. Increasing σ has little effect on the correlation coefficients in NSR, but promotes consistency in APD and peak Ca, i.e., a more positive correlation at short μ. The negative APD-peak Ca relationship has a biphasic dependence on μ, where the correlation is less negative at long and short μ. These trends are also consistent at a 1-h time window (Supplemental Figs. S15 and S16).
Although the above simulations illustrate the dependence of the distinct RR-interval sequence statistical properties separately, it is not clear how directly these simulations compare with the patient-specific RR-interval sequences. Therefore, we compared ΔAPD from the patient-specific RR sequences to ΔAPD values generated from the corresponding synthetic and Gaussian sequences, where the Gaussian sequences have the same μ and σ as the corresponding patient sequence but τ = 0 (Fig. 9). We divide the 24-h RR sequences into either 5-min or 1-h segments from two subjects (NSR subject 30 and CHF subject 7). We then plot ΔAPD for each patient segment (P), five corresponding synthetic sequences (S), and a Gaussian sequence (G) (Fig. 9, A and B, top). In general, ΔAPD values from the synthetic sequences are more similar to the patient-specific sequences than the Gaussian sequences, which tend to generate larger APD alternations in both individuals. The ΔAPD values from synthetic sequences qualitatively mimic the original patient-specific sequence with some variability, i.e., have a similar ΔAPD, for some segments, while differing for others, for both time windows. Overall, accuracy between the patient and synthetic sequences is comprehensively assessed by calculating the percent error between the patient-specific RR sequence and mean ΔAPD from the synthetic sequences for each subject in both populations, with the subject median shown for different time windows (Fig. 9, A and B, bottom). We find that the synthetic sequences are consistently more representative of the patient-specific ΔAPD measures for shorter time windows in both NSR and CHF, with generally minimal differences between NSR and CHF populations.
Figure 9.

The synthetic sequences are more representative of the patient-specific change in action potential duration (ΔAPD) measurements than the Gaussian sequence, particularly at shorter time windows (TWs). For normal sinus rhythm (NSR) subject 30 (A, top) and chronic heart failure (CHF) subject 7 (B, top), ΔAPD is shown for each patient (P) sequence and five corresponding synthetic (S) and one Gaussian (G) sequences at a time window of 5 and 60 min. The median percent error between the patient ΔAPD and synthetic sequence ΔAPD mean is shown for each subject in both populations at different time windows (bottom).
Comparison of the Influence of Variation in Heart Rate and Remodeling
The above results demonstrate that electrical activity depends on both the properties of patient-specific RR-interval sequences and population-based model parameters. Finally, we directly investigate the extent to which electrical activity depends on CHF-related changes in heart rate or modeling. We compare the patient-specific NSR and CHF simulations with the opposite population sequence and model parameters. That is, we simulate the NSR model parameters with CHF-subject RR-interval sequences and similarly the CHF model parameters with the NSR-subject RR-interval sequences. Example beat-to-beat traces of the RR interval, APD, and peak Ca are shown for either an NSR (Fig. 10, A and B) or CHF (Fig. 10, C and D) 5-min RR sequence as the pacing protocol for both NSR and CHF models. Consistent with the above results, the NSR RR-interval sequences exhibit more variability and self-similarity, whereas the CHF RR-interval sequence exhibits a shorter interval values (i.e., faster rate). For the same RR-interval sequence, the CHF model exhibits prolonged APD and smaller peak Ca, compared with the NSR model. For both NSR and CHF interval sequences, the overall beat-to-beat trends of APD and peak Ca tend to follow the RR intervals, suggesting the RR sequence primarily determines the trends in beat-to-beat changes, and the specific model phenotype influences the magnitude of the changes.
Figure 10.

The beat-to-beat changes in action potential duration (APD) and peak Ca primarily depend on the RR sequence, whereas the model phenotype influences the magnitude. A 5-min RR sequence from normal sinus rhythm (NSR) subject 1 (A and B) and chronic heart failure (CHF) subject 1 (C and D) are the pacing protocol for the NSR (A and C) and CHF (B and D) model. The RR interval and resulting APD and peak Ca are plotted as a function of beat number. Time window (TW) = 5 min.
We summarize simulations of the four combinations of model phenotype and RR-interval sequence populations by plotting the ΔAPD and ρa mean value for each subject for a 5-min time window (Figs. 11 and 12). We find that the sequences resulting in larger ΔAPD in the NSR model similarly lead to larger ΔAPD in the CHF model, demonstrating that the relative magnitude of ΔAPD is sequence specific. Furthermore, for a given subject, ΔAPD tends to be larger in the CHF model combinations (green and red), compared with the NSR model (black and blue), consistent with larger magnitude beat-to-beat alternation (Fig. 11). When comparing across the full distributions of all subjects, we find that the population-based model phenotype is the primary determinant of ΔAPD values, i.e., ΔAPD was significantly larger for the CHF model compared with the NSR model for both patient populations of RR-interval sequences, in contrast with small differences between ΔAPD for both models with the NSR and CHF RR-interval sequences (Fig. 11B).
Figure 11.

Change in action potential duration (ΔAPD) primarily depends on the model phenotype, though the specific sequence leads to small differences in the alternation magnitudes. A: temporal mean of ΔAPD is shown for each subject in all four combination of population RR sequences and model phenotype: NSR sequences/normal sinus rhythm (NSR) model (black), chronic heart failure (CHF) sequences/NSR model (blue), NSR sequences/CHF model (green), and CHF sequences/CHF model (red). B: distribution of mean values for each simulated population is also shown. The model phenotype leads to significantly different mean ΔAPD values (*P < 10−3, paired t tests), whereas population RR sequences do not lead to significantly different mean values (ns, unpaired t tests). Time window (TW) = 5 min.
Figure 12.
ρa mainly depends on the RR-interval populations, with moderate model phenotype influence. A: temporal mean of ρa is shown for each subject in all four combination of population RR sequences and model phenotype: normal sinus rhythm (NSR) sequences/NSR model (black), chronic heart failure (CHF) sequences/NSR model (blue), NSR sequences/CHF model (green), and CHF sequences/CHF model (red). B: distribution of mean values for each simulated population is also shown. The model phenotype leads to significantly different mean ρa values for the NSR sequences (*P < 10−3, paired t test), but not the CHF sequences (ns, paired t test), whereas the population RR sequence leads to statistically significant different mean ρa values for both NSR and CHF models (*P < 10−3, unpaired t tests). Time window (TW) = 5 min.
In contrast, ρa exhibits larger differences depending on the RR-interval population (Fig. 12). We find that for a given subject RR-interval sequence, the CHF model exhibits moderately reduced values for ρa, compared with the NSR model (comparing black to green, and blue to red). However, for a given model, the CHF subject RR-interval sequences exhibit ρa values much closer to 0 (comparing black to blue, and green to red). Collectively, these results suggest that both CHF-associated remodeling and changes in heart rate influence the proarrhythmic phenomena in CHF, as the RR-interval characteristics and model independently influence ΔAPD and ρa. That is, the model phenotype leads to significantly different ρa values for the NSR sequences, whereas the phenotype results in no differences for the CHF sequences. Thus, simulations suggest that changes in heart rate may be more influential, since both measurements of APD alternans formation depend on the specific RR-interval sequence.
DISCUSSION
Summary of Main Findings
Previously, we used a discrete-time coupled map model to investigate the effects of changes in heart rate on the electromechanical properties of a cardiac myocyte (24, 40). These studies focused on the short-term effects of HRV, as modeled using the Gaussian noise method, in the presence of homogeneous and heterogeneous intracellular Ca signaling. Our results showed that high HRV had various antiarrhythmic effects, including disruption of APD and peak Ca alternations, weakened coupling between APD and peak Ca, and mitigation of the proarrhythmic effects of subcellular Ca heterogeneity (24, 40).
Here, we extend our previous work and examine the long-term effects of modulations in heart rate on electrical activity in NSR and CHF populations. We obtained 24-h RR sequences from individuals with NSR and CHF and characterized the RR sequences using three statistical properties: the mean RR interval, RR-interval standard deviation, and autocorrelation time for a range of time windows. Furthermore, we developed a method to generate synthetic RR sequences with identical statistical properties of a patient RR sequence. The patient-specific and synthetic RR sequences are used to pace our anthropomorphized NSR and CHF models, developed by accounting for the heart rate difference between humans and small animals and by mimicking experimental differences between NSR and CHF.
Analysis of the RR sequences demonstrates that RR-sequence statistical measurements vary temporally and depend on the duration of analysis. In both populations, the mean autocorrelation time and mean RR-interval standard deviation both increase as the time window increases, whereas the mean of mean RR interval does not depend on the analysis duration. In addition, the CHF population typically has both reduced mean RR-interval standard deviations and mean autocorrelation times, and lower mean of mean RR intervals, indicating reduced HRV, decreased RR-sequence self-similarity, and higher heart rates. The patient-specific simulations show that for a given individual, the magnitude of APD alternations varies throughout a 24-h period, whereas measurements of electrical activity indicate that APD alternans formation is more prevalent in the CHF population.
To determine the dependency of electromechanical properties on the RR-interval sequence, we also generate simulations using synthetic RR sequences, for which each statistical property is systematically varied. For both short and long-time windows, increasing the autocorrelation time or mean RR interval reduces APD alternation, whereas increasing the RR-interval standard deviation leads to higher alternation magnitudes. Furthermore, the synthetic sequences generate electrical activity representative of that resulting from the patient sequences at shorter time windows. Importantly, we also investigate the contribution of changes in heart rate versus electrophysiological remodeling in CHF on APD alternation and find that both the specific changes in heart rate and remodeling influence arrhythmic propensity, though variations in heart rate may be more influential. These results are qualitatively similar at both a short and long time window.
Physiological Implications
It is well established that a higher resting heart rate is associated with negative outcomes, such as cardiovascular death and all-cause mortality in healthy and diseased populations (42, 59, 60). In addition, clinical studies have shown that decreased HRV correlates with a greater risk for cardiac disease, sudden cardiac death, and mortality (7–9, 61, 62). Our analysis of the RR-sequence statistical properties shows that the CHF population has faster heart rates and diminished HRV compared with the NSR population. This reduction is consistent with reports of depressed HRV in patients with CHF (9, 42). Although the Physionet databases lack patient outcome information needed for validation, the RR-sequence properties alone suggest that the CHF population has an increased risk for cardiac arrhythmias and sudden cardiac death.
Alternans are a proarrhythmic beat-to-beat alternation in the APD or intracellular Ca levels. The formation of alternans can be driven by voltage or Ca, though alternations in one system leads to alternation in the other because of bidirectional coupling. Cellular alternans can form under a multitude of conditions, such as fast pacing, steep APD restitution, changes in ionic current kinetics or conductances, and altered SR Ca load or release properties (63). Alternans can also form in tissue and be spatially concordant (discordant), where neighboring areas of tissue are in phase (out of phase). Spatially discordant alternans are more proarrhythmic due to the large repolarization gradients generated by the presence of both a short and long APD on a given beat, which promote conduction block and reentry (16).
Pathological remodeling in CHF leads to changes in cardiac electromechanical properties known to independently influence alternans formation, including a prolonged APD, reduced SR filling, and increased SR Ca leak (64). Previous studies have also shown that APD and Ca alternans form at slower heart rates in CHF, which may be mediated by abnormal Ca signaling (50, 65). Similarly, our patient-specific simulations illustrate an increased prevalence of alternans formation in CHF. In addition, we demonstrate that both CHF-related remodeling and changes in heart rate play a role in APD alternans formation and suggest that modulations in heart rate may be more influential. Future work will investigate the role of changes in heart rate on more direct arrhythmia precursors, including spatial gradients and spatial alternans formation.
Here, we show that pathological changes in heart rate and HRV are not only a concurrent symptom of disease, but are also predicted to play a role in the increased arrhythmia risk associated with CHF. Importantly, our results indicate that the effects of variations in heart rate should be investigated over a longer time period than is often considered. Although the 24-h RR sequences are divided into segments of different durations, we still simulate 24 h of electrical activity for each individual. For shorter time windows, such as 5 min, there is much variation between the segments throughout the 24-h period, highlighting that longer duration analysis is critical and that a 5-min “snapshot” may not be representative of the average dynamics over the entire day.
Comparison with Previous Work
Although many studies have investigated the influence of HRV on cardiac electrophysiology, there are conflicting results (19–26, 40). Stochastic pacing has been shown to inhibit the formation of both spatially discordant and concordant alternans and reduce APD heterogeneity in one and two-dimensional cardiac tissue simulations (23, 26). Our results similarly depict an inverse correlation between HRV and arrhythmic propensity, since the CHF population has reduced HRV and an increased propensity for alternans formation. The NSR sequences also had higher HRV and were associated with a more positive ρa indicating a nonalternating APD in simulations with both model phenotypes. We also demonstrate that the specific changes in heart rate play a role in the increased arrhythmic propensity in CHF, since the RR sequences influence both ρa and ΔAPD.
In contrast, prior work has found that HRV can promote the formation of APD alternans in both Langendorff-perfused healthy hearts and numerical simulations (21). The discrepancy between our results and this prior study may arise because of differences in model species and the method of modeling HRV. HRV is typically modeled by adding Gaussian noise with a specific standard deviation to a constant pacing period, where the standard deviation dictates the level of HRV. Although this methodology gives precise experimental control, it is a simplification of physiological (pathological) changes in heart rate, which are influenced by a multitude of factors such as autonomic regulation, circadian rhythms, and metabolism (66). Our current investigation circumvents the limitations of the Gaussian noise method by employing RR sequences from individuals with NSR and CHF as the pacing protocol, which inherently contain physiological or pathological fluctuations in heart rate. In addition, we generated synthetic RR sequences by defining three statistical properties, which can be matched to the original patient sequences. The synthetic sequences in turn enable a direct assessment of each statistical property’s individual impact on electrical activity, which cannot be characterized using the patient-specific sequences (as these properties vary concomitantly in patients).
Our results also suggest that the differing conclusions of HRV’s influence on cardiac alternans formation within the field may not be inherently contradictory. We find that increasing the standard deviation or level of variability in the synthetic sequences and the simulations using Gaussian sequences in Fig. 9 similarly leads to higher APD alternations, suggesting a proarrhythmic effect. However, physiological heart rate sequences have self-similarity, as measured by the autocorrelation time, which when increased reduced APD alternations in the synthetic sequences. This suggests there is an optimal balance of variation and similarity within a healthy heart rate sequence, which could reduce the likelihood of APD alternans formation such as in the NSR population. Similarly, Zlochiver et al. showed that constant DI pacing reduces alternans formation, which also indicates that nonconstant pacing is beneficial (67). Consistent with this hypothesis, recent experiments showed that reinstating respiration-based HRV in a CHF sheep model led to improved cardiac function (increased cardiac output, decreased myocyte hypertrophy, and more uniform t-tubule structure) (68).
Patient-Specific Modeling of Cardiac Electrophysiology
In recent years, the medical community has started to both understand and emphasize the importance of an individual’s unique background, including environmental and genetic factors, in treatment and healthcare. This has led to the concept of personalized medicine, for which medical care is optimized for a given individual (69). Computational modeling can be used to further personalized medicine particularly in the context of cardiac disease, since an individual’s cardiac electrical and mechanical function, arrhythmic propensity, and drug response can be explored by varying model parameters or incorporating external data. For example, magnetic resonant imaging (MRI) has been paired with ionic models to generate patient-based simulations, which are used to aid clinical decision-making in patients undergoing ablation for atrial fibrillation (31–33).
Although this methodology offers valuable insight into atrial fibrillation recurrence, there is a lack of studies incorporating patient-specific changes in heart rate. Relan et al. developed an analogous experimental approach, where they created personalized three-dimensional electrophysiological models using optical mapping and MRI data from healthy porcine hearts. They further posited that clinically relevant, patient-specific models could be similarly created using surface epicardial or endocardial electroanatomical mapping (70). In comparison, our methodology generates patient-specific simulations of various durations using data from an easily measured, noninvasive ECG. This allows for analysis of the resulting electrical activity at different time points and in both health and disease. For example, this methodology could be used to further analyze the variance of electromechanical properties between the different classes of CHF, which we were unable to study because of the small sample size of our dataset. Future work will use this approach to generate predictions of patients’ arrhythmic propensity for risk stratification.
Limitations
Although this investigation provides novel insight into the importance of long-term changes in heart rate, it also has limitations. Though the single-cell, discrete-time map model recapitulates the overarching relationships between APD and intracellular Ca signaling, we cannot explore more direct arrhythmic precursors such as spatial gradients, spatial alternans formation, or conduction block. Furthermore, arrhythmia formation is ultimately a three-dimensional phenomenon that depends on cell-cell coupling, which is not represented in our current study. In addition, the model does not explicitly simulate changes in transmembrane potential, ion channel function, and intracellular cell signaling pathways as in ionic models, and thus, it is not possible to correlate a certain result with a specific molecular mechanism.
We also emulate pathological remodeling in CHF by varying a subset of model parameters. Although this methodology enabled us to mimic experimental differences between NSR and CHF, this cannot fully recapitulate the complex, heterogeneous structural and ionic remodeling that occurs in CHF. For example, the autonomic nervous system influences heart rate, rhythm, and contractility in a multifaceted, disease-dependent manner, which is not accounted for in this investigation beyond changes in the RR sequences (71, 72). Despite the drawbacks, this minimal representation allows for simulation of 24 h of electrical activity for 78 individuals for two different parameter sets (i.e., NSR and CHF-associated parameters), which would require a very high computational cost using ionic models. Furthermore, the relatively low computational cost of the discrete-time map model approach, relative to ionic models, facilitated a wide range of simulations with synthetic RR sequences, varying different statistical properties of an RR sequence, the model phenotype, and RR-sequence duration, which would have been computational prohibitive with other approaches.
DATA AVAILABILITY
Supporting figures, simulation code, and data files with all patient RR sequences are available in the following Github repository: https://github.com/SHWeinberg/Phadumdeo-HRV-CHF.
SUPPLEMENTAL DATA
Supplemental Figs. S1–S16 and Supplemental Table S1 and Supplemental Methods are available in the following Github repository: https://github.com/SHWeinberg/Phadumdeo-HRV-CHF.
GRANTS
This work was supported by the National Institutes of Health (NIH) Grants R01HL138003 and R01HL165751 (to S.H.W.).
DISCLOSURES
No conflicts of interest, financial or otherwise, are declared by the authors.
AUTHOR CONTRIBUTIONS
V.M.P. and S.H.W. conceived and designed research; V.M.P. and B.L.M. performed experiments; V.M.P. and B.L.M. analyzed data; V.M.P., B.L.M., T.J.H., and S.H.W. interpreted results of experiments; V.M.P. and B.M.M. prepared figures; V.M.P., B.L.M., and S.H.W. drafted manuscript; V.M.P. and S.H.W. edited and revised manuscript; V.M.P. and S.H.W. approved final version of manuscript.
REFERENCES
- 1. Roger VL. Epidemiology of heart failure. Circ Res 113: 646–659, 2013. doi: 10.1161/CIRCRESAHA.113.300268. [DOI] [PMC free article] [PubMed] [Google Scholar]
- 2. Tsao CW, Aday AW, Almarzooq ZI, Alonso A, Beaton AZ, Bittencourt MS, Boehme AK, , et al. Heart disease and stroke statistics—2022 update: a report from the American Heart Association. Circulation 145: e153–e639, 2022. [Erratum in Circulation 146: e141, 2022]. doi: 10.1161/CIR.0000000000001052. [DOI] [PubMed] [Google Scholar]
- 3. Saour B, Smith B, Yancy CW. Heart failure and sudden cardiac death. Card Electrophysiol Clin 9: 709–723, 2017. doi: 10.1016/j.ccep.2017.07.010. [DOI] [PubMed] [Google Scholar]
- 4. Kemp CD, Conte JV. The pathophysiology of heart failure. Cardiovasc Pathol 21: 365–371, 2012. doi: 10.1016/j.carpath.2011.11.007. [DOI] [PubMed] [Google Scholar]
- 5. Husti Z, Varró A, Baczkó I. Arrhythmogenic remodeling in the failing heart. Cells 10: 3203, 2021. doi: 10.3390/cells10113203. [DOI] [PMC free article] [PubMed] [Google Scholar]
- 6. Tomaselli GF, Zipes DP. What causes sudden death in heart failure? Circ Res 95: 754–763, 2004. doi: 10.1161/01.RES.0000145047.14691.db. [DOI] [PubMed] [Google Scholar]
- 7. La Rovere MT, Pinna GD, Maestri R, Mortara A, Capomolla S, Febo O, Ferrari R, Franchini M, Gnemmi M, Opasich C, Riccardi PG, Traversi E, Cobelli F. Short-term heart rate variability strongly predicts sudden cardiac death in chronic heart failure patients. Circulation 107: 565–570, 2003. doi: 10.1161/01.cir.0000047275.25795.17. [DOI] [PubMed] [Google Scholar]
- 8. Nolan J, Batin PD, Andrews R, Lindsay SJ, Brooksby P, Mullen M, Baig W, Flapan AD, Cowley A, Prescott RJ, Neilson JM, Fox KA. Prospective study of heart rate variability and mortality in chronic heart failure: results of the United Kingdom heart failure evaluation and assessment of risk trial (UK-heart). Circulation 98: 1510–1516, 1998. doi: 10.1161/01.cir.98.15.1510. [DOI] [PubMed] [Google Scholar]
- 9. Huikuri HV, Stein PK. Heart rate variability in risk stratification of cardiac patients. Prog Cardiovasc Dis 56: 153–159, 2013. doi: 10.1016/j.pcad.2013.07.003. [DOI] [PubMed] [Google Scholar]
- 10. Sandercock GR, Brodie DA. The role of heart rate variability in prognosis for different modes of death in chronic heart failure. Pacing Clin Electrophysiol 29: 892–904, 2006. doi: 10.1111/j.1540-8159.2006.00457.x. [DOI] [PubMed] [Google Scholar]
- 11. Böhm M, Swedberg K, Komajda M, Borer JS, Ford I, Dubost-Brama A, Lerebours G, Tavazzi L; SHIFT Investigators. Heart rate as a risk factor in chronic heart failure (SHIFT): the association between heart rate and outcomes in a randomised placebo-controlled trial. Lancet 376: 886–894, 2010. doi: 10.1016/S0140-6736(10)61259-7. [DOI] [PubMed] [Google Scholar]
- 12. Kotecha D, Flather MD, Altman DG, Holmes J, Rosano G, Wikstrand J, Packer M, Coats AJS, Manzano L, Böhm M, van Veldhuisen DJ, Andersson B, Wedel H, von Lueder TG, Rigby AS, Hjalmarson Å, Kjekshus J, Cleland JGF; Beta-Blockers in Heart Failure Collaborative Group. Heart rate and rhythm and the benefit of beta-blockers in patients with heart failure. J Am Coll Cardiol 69: 2885–2896, 2017. doi: 10.1016/j.jacc.2017.04.001. [DOI] [PubMed] [Google Scholar]
- 13. Monfredi O, Lyashkov AE, Johnsen AB, Inada S, Schneider H, Wang R, Nirmalan M, Wisloff U, Maltsev VA, Lakatta EG, Zhang H, Boyett MR. Biophysical characterization of the underappreciated and important relationship between heart rate variability and heart rate. Hypertension 64: 1334–1343, 2014. doi: 10.1161/HYPERTENSIONAHA.114.03782. [DOI] [PMC free article] [PubMed] [Google Scholar]
- 14. Sacha J. Interaction between heart rate and heart rate variability. Ann Noninvasive Electrocardiol 19: 207–216, 2014. doi: 10.1111/anec.12148. [DOI] [PMC free article] [PubMed] [Google Scholar]
- 15. Fox K, Ford I, Steg PG, Tendera M, Ferrari R; BEAUTIFUL Investigators. Ivabradine for patients with stable coronary artery disease and left-ventricular systolic dysfunction (BEAUTIFUL): a randomised, double-blind, placebo-controlled trial. Lancet 372: 807–816, 2008. doi: 10.1016/S0140-6736(08)61170-8. [DOI] [PubMed] [Google Scholar]
- 16. Weiss JN, Karma A, Shiferaw Y, Chen PS, Garfinkel A, Qu Z. From pulsus to pulseless: the saga of cardiac alternans. Circ Res 98: 1244–1253, 2006. doi: 10.1161/01.RES.0000224540.97431.f0. [DOI] [PubMed] [Google Scholar]
- 17. Qu Z, Xie Y, Garfinkel A, Weiss JN. T-wave alternans and arrhythmogenesis in cardiac diseases. Front Physiol 1: 154, 2010. doi: 10.3389/fphys.2010.00154. [DOI] [PMC free article] [PubMed] [Google Scholar]
- 18. Heijman J, Zaza A, Johnson DM, Rudy Y, Peeters RL, Volders PG, Westra RL. Determinants of beat-to-beat variability of repolarization duration in the canine ventricular myocyte: a computational analysis. PLoS Comput Biol 9: e1003202, 2013. doi: 10.1371/journal.pcbi.1003202. [DOI] [PMC free article] [PubMed] [Google Scholar]
- 19. McIntyre SD, Mori Y, Tolkacheva EG. The effect of feedback on alternans formation in the heart. In: ASME 2012 5th Annual Dynamic Systems and Control Conference joint with the JSME 2012 11th Motion and Vibration Conference. 2012, p. 585–589. doi: 10.1115/DSCC2012-MOVIC2012-8646. [DOI] [Google Scholar]
- 20. McIntyre SD, Kakade V, Mori Y, Tolkacheva EG. Heart rate variability and alternans formation in the heart: the role of feedback in cardiac dynamics. J Theor Biol 350: 90–97, 2014. doi: 10.1016/j.jtbi.2014.02.015. [DOI] [PubMed] [Google Scholar]
- 21. Kulkarni K, Lee SW, Tolkacheva EG. Pro-arrhythmic effect of heart rate variability during periodic pacing. In: 2016 IEEE 38th Annual International Conference of the Engineering in Medicine and Biology Society (EMBC). IEEE, 2016, p. 149–152. [DOI] [PubMed] [Google Scholar]
- 22. Dvir H, Zlochiver S. Stochastic pacing effect on cardiac alternans – simulation study of a 2D human ventricular tissue. In: 2013 35th Annual International Conference of the IEEE Engineering in Medicine and Biology Society (EMBC). IEEE, 2013, p. 1514–1517. doi: 10.1109/EMBC.2013.6609800. [DOI] [PubMed] [Google Scholar]
- 23. Dvir H, Zlochiver S. The interrelations among stochastic pacing, stability, and memory in the heart. Biophys J 107: 1023–1034, 2014. doi: 10.1016/j.bpj.2014.07.004. [DOI] [PMC free article] [PubMed] [Google Scholar]
- 24. Phadumdeo VM, Weinberg SH. Heart rate variability alters cardiac repolarization and electromechanical dynamics. J Theor Biol 442: 31–43, 2018. doi: 10.1016/j.jtbi.2018.01.007. [DOI] [PubMed] [Google Scholar]
- 25. Zaniboni M. Short-term action potential memory and electrical restitution: a cellular computational study on the stability of cardiac repolarization under dynamic pacing. PLoS One 13: e0193416, 2018. doi: 10.1371/journal.pone.0193416. [DOI] [PMC free article] [PubMed] [Google Scholar]
- 26. Wilson D, Ermentrout B. Stochastic pacing inhibits spatially discordant cardiac alternans. Biophys J 113: 2552–2572, 2017. doi: 10.1016/j.bpj.2017.10.001. [DOI] [PMC free article] [PubMed] [Google Scholar]
- 27. Weinberg SH. Spatial discordance and phase reversals during alternate pacing in discrete-time kinematic and cardiomyocyte ionic models. Chaos 25: 103119, 2015. doi: 10.1063/1.4932961. [DOI] [PubMed] [Google Scholar]
- 28. Weinberg SH, Tung L. Oscillation in cycle length induces transient discordant and steady-state concordant alternans in the heart. PLoS One 7: e40477, 2012. doi: 10.1371/journal.pone.0040477. [DOI] [PMC free article] [PubMed] [Google Scholar]
- 29. Krogh-Madsen T, Christini DJ. Nonlinear dynamics in cardiology. Annu Rev Biomed Eng 14: 179–203, 2012. doi: 10.1146/annurev-bioeng-071811-150106. [DOI] [PMC free article] [PubMed] [Google Scholar]
- 30. Roberts BN, Yang PC, Behrens SB, Moreno JD, Clancy CE. Computational approaches to understand cardiac electrophysiology and arrhythmias. Am J Physiol Heart Circ Physiol 303: H766–H783, 2012. doi: 10.1152/ajpheart.01081.2011. [DOI] [PMC free article] [PubMed] [Google Scholar]
- 31. Ali RL, Hakim JB, Boyle PM, Zahid S, Sivasambu B, Marine JE, Calkins H, Trayanova NA, Spragg DD. Arrhythmogenic propensity of the fibrotic substrate after atrial fibrillation ablation: a longitudinal study using magnetic resonance imaging-based atrial models. Cardiovasc Res 115: 1757–1765, 2019. doi: 10.1093/cvr/cvz083. [DOI] [PMC free article] [PubMed] [Google Scholar]
- 32. Boyle PM, Zghaib T, Zahid S, Ali RL, Deng D, Franceschi WH, Hakim JB, Murphy MJ, Prakosa A, Zimmerman SL, Ashikaga H, Marine JE, Kolandaivelu A, Nazarian S, Spragg DD, Calkins H, Trayanova NA. Computationally guided personalized targeted ablation of persistent atrial fibrillation. Nat Biomed Eng 3: 870–879, 2019. doi: 10.1038/s41551-019-0437-9. [DOI] [PMC free article] [PubMed] [Google Scholar]
- 33. Krueger MW, Seemann G, Rhode K, Keller DU, Schilling C, Arujuna A, Gill J, O'Neill MD, Razavi R, Dössel O. Personalization of atrial anatomy and electrophysiology as a basis for clinical modeling of radio-frequency ablation of atrial fibrillation. IEEE Trans Med Imaging 32: 73–84, 2013. doi: 10.1109/TMI.2012.2201948. [DOI] [PubMed] [Google Scholar]
- 34. Guevara M, Ward G, Shrier A, Glass L. Electrical alternans and period doubling bifurcations. IEEE Comp Cardiol 562: 167–170, 1984. [Google Scholar]
- 35. Fox JJ, Riccio ML, Drury P, Werthman A, Gilmour RF Jr.. Dynamic mechanism for conduction block in heart tissue. New J Phys 5: 101, 2003. doi: 10.1088/1367-2630/5/1/401. [DOI] [Google Scholar]
- 36. Fox JJ, Bodenschatz E, Gilmour RF Jr.. Period-doubling instability and memory in cardiac tissue. Phys Rev Lett 89: 138101, 2002. doi: 10.1103/PhysRevLett.89.138101. [DOI] [PubMed] [Google Scholar]
- 37. Shiferaw Y, Sato D, Karma A. Coupled dynamics of voltage and calcium in paced cardiac cells. Phys Rev E Stat Nonlin Soft Matter Phys 71: 021903, 2005. doi: 10.1103/PhysRevE.71.021903. [DOI] [PMC free article] [PubMed] [Google Scholar]
- 38. Xie LH, Sato D, Garfinkel A, Qu Z, Weiss JN. Intracellular ca alternans: coordinated regulation by sarcoplasmic reticulum release, uptake, and leak. Biophys J 95: 3100–3110, 2008. doi: 10.1529/biophysj.108.130955. [DOI] [PMC free article] [PubMed] [Google Scholar]
- 39. Qu Z, Shiferaw Y, Weiss JN. Nonlinear dynamics of cardiac excitation-contraction coupling: an iterated map study. Phys Rev E Stat Nonlin Soft Matter Phys 75: 011927, 2007. doi: 10.1103/PhysRevE.75.011927. [DOI] [PubMed] [Google Scholar]
- 40. Phadumdeo VM, Weinberg SH. Dual regulation by subcellular calcium heterogeneity and heart rate variability on cardiac electromechanical dynamics. Chaos 30: 093129, 2020. doi: 10.1063/5.0019313. [DOI] [PMC free article] [PubMed] [Google Scholar]
- 41. Goldberger AL, Amaral LA, Glass L, Hausdorff JM, Ivanov PC, Mark RG, Mietus JE, Moody GB, Peng CK, Stanley HE. PhysioBank, PhysioToolkit, and PhysioNet: components of a new research resource for complex physiologic signals. Circulation 101: E215–E220, 2000. doi: 10.1161/01.cir.101.23.e215. [DOI] [PubMed] [Google Scholar]
- 42. Malik M. Heart rate variability: standards of measurement, physiological interpretation, and clinical use: Task Force of the European Society of Cardiology and the North American Society for Pacing and Electrophysiology. Ann Noninv Electrocard 1: 151–181, 1996. doi: 10.1111/j.1542-474X.1996.tb00275.x. [DOI] [Google Scholar]
- 43. Shaffer F, Ginsberg JP. An overview of heart rate variability metrics and norms. Front Public Health 5: 258, 2017. doi: 10.3389/fpubh.2017.00258. [DOI] [PMC free article] [PubMed] [Google Scholar]
- 44. Zeraati R, Engel TA, Levina A. A flexible Bayesian framework for unbiased estimation of timescales. Nat Comput Sci 2: 193–204, 2022. doi: 10.1038/s43588-022-00214-3. [DOI] [PMC free article] [PubMed] [Google Scholar]
- 45. Chokngamwong R, Chiu LS. Thailand daily rainfall and comparison with TRMM products. J Hydrometeorol 9: 256–266, 2008. doi: 10.1175/2007JHM876.1. [DOI] [Google Scholar]
- 46. Piles M, van der Schalie R, Gruber A, Muñoz-Marí J, Camps-Valls G, Mateo-Sanchis A, Dorigo W, de Jeu R. Global estimation of soil moisture persistence with l and c-band microwave sensors. In: IGARSS 2018-2018 IEEE International Geoscience and Remote Sensing Symposium. IEEE, 2018, p. 8259–8262. [Google Scholar]
- 47. Weinberg S. Impaired sarcoplasmic reticulum calcium uptake and release promote electromechanically and spatially discordant alternans: a computational study. Clin Med Insights Cardiol 10: 1–15, 2016. doi: 10.4137/CMC.S39709. [DOI] [PMC free article] [PubMed] [Google Scholar]
- 48. O'Hara T, Virág L, Varró A, Rudy Y. Simulation of the undiseased human cardiac ventricular action potential: model formulation and experimental validation. PLoS Comput Biol 7: e1002061, 2011. doi: 10.1371/journal.pcbi.1002061. [DOI] [PMC free article] [PubMed] [Google Scholar]
- 49. Gomez JF, Cardona K, Romero L, Ferrero JM Jr, Trenor B. Electrophysiological and structural remodeling in heart failure modulate arrhythmogenesis. 1D simulation study. PLoS One 9: e106602, 2014. doi: 10.1371/journal.pone.0106602. [DOI] [PMC free article] [PubMed] [Google Scholar]
- 50. Wilson LD, Jeyaraj D, Wan X, Hoeker GS, Said TH, Gittinger M, Laurita KR, Rosenbaum DS. Heart failure enhances susceptibility to arrhythmogenic cardiac alternans. Heart Rhythm 6: 251–259, 2009. doi: 10.1016/j.hrthm.2008.11.008. [DOI] [PMC free article] [PubMed] [Google Scholar]
- 51. Pogwizd SM, Bers DM. Cellular basis of triggered arrhythmias in heart failure. Trends Cardiovasc Med 14: 61–66, 2004. doi: 10.1016/j.tcm.2003.12.002. [DOI] [PubMed] [Google Scholar]
- 52. Piacentino V 3rd, Weber CR, Chen X, Weisser-Thomas J, Margulies KB, Bers DM, Houser SR. Cellular basis of abnormal calcium transients of failing human ventricular myocytes. Circ Res 92: 651–658, 2003. doi: 10.1161/01.RES.0000062469.83985.9B. [DOI] [PubMed] [Google Scholar]
- 53. Hobai IA, O'Rourke B. Decreased sarcoplasmic reticulum calcium content is responsible for defective excitation-contraction coupling in canine heart failure. Circulation 103: 1577–1584, 2001. doi: 10.1161/01.cir.103.11.1577. [DOI] [PubMed] [Google Scholar]
- 54. Denniss AL, Dashwood AM, Molenaar P, Beard NA. Sarcoplasmic reticulum calcium mishandling: central tenet in heart failure? Biophys Rev 12: 865–878, 2020. doi: 10.1007/s12551-020-00736-y. [DOI] [PMC free article] [PubMed] [Google Scholar]
- 55. Li GR, Lau CP, Ducharme A, Tardif JC, Nattel S. Transmural action potential and ionic current remodeling in ventricles of failing canine hearts. Am J Physiol Heart Circ Physiol 283: H1031–H1041, 2002. doi: 10.1152/ajpheart.00105.2002. [DOI] [PubMed] [Google Scholar]
- 56. Akar FG, Rosenbaum DS. Transmural electrophysiological heterogeneities underlying arrhythmogenesis in heart failure. Circ Res 93: 638–645, 2003. doi: 10.1161/01.RES.0000092248.59479.AE. [DOI] [PubMed] [Google Scholar]
- 57. Wilson LD, Wan X, Rosenbaum DS. Cellular alternans: a mechanism linking calcium cycling proteins to cardiac arrhythmogenesis. Ann NY Acad Sci 1080: 216–234, 2006. doi: 10.1196/annals.1380.018. [DOI] [PubMed] [Google Scholar]
- 58. Fukaya H, Plummer BN, Piktel JS, Wan X, Rosenbaum DS, Laurita KR, Wilson LD. Arrhythmogenic cardiac alternans in heart failure is suppressed by late sodium current blockade by ranolazine. Heart rhythm 16: 281–289, 2019. doi: 10.1016/j.hrthm.2018.08.033. [DOI] [PubMed] [Google Scholar]
- 59. Fox K, Borer JS, Camm AJ, Danchin N, Ferrari R, Lopez Sendon JL, Steg PG, Tardif JC, Tavazzi L, Tendera M; Heart Rate Working Group. Resting heart rate in cardiovascular disease. J Am Coll Cardiol 50: 823–830, 2007. doi: 10.1016/j.jacc.2007.04.079. [DOI] [PubMed] [Google Scholar]
- 60. Böhm M, Reil JC, Deedwania P, Kim JB, Borer JS. Resting heart rate: risk indicator and emerging risk factor in cardiovascular disease. Am J Med 128: 219–228, 2015. doi: 10.1016/j.amjmed.2014.09.016. [DOI] [PubMed] [Google Scholar]
- 61. Huikuri HV, Raatikainen MJ, Moerch-Joergensen R, Hartikainen J, Virtanen V, Boland J, Anttonen O, Hoest N, Boersma LV, Platou ES, Messier MD, Bloch-Thomsen PE; Cardiac Arrhythmias and Risk Stratification after Acute Myocardial Infarction Study Group. Prediction of fatal or near-fatal cardiac arrhythmia events in patients with depressed left ventricular function after an acute myocardial infarction. Eur Heart J 30: 689–698, 2009. doi: 10.1093/eurheartj/ehn537. [DOI] [PMC free article] [PubMed] [Google Scholar]
- 62. Tsuji H, Larson MG, Venditti FJ Jr, Manders ES, Evans JC, Feldman CL, Levy D. Impact of reduced heart rate variability on risk for cardiac events. The Framingham Heart Study. Circulation 94: 2850–2855, 1996. doi: 10.1161/01.cir.94.11.2850. [DOI] [PubMed] [Google Scholar]
- 63. Qu Z, Weiss JN. Cardiac alternans: from bedside to bench and back. Circ Res 132: 127–149, 2023. doi: 10.1161/CIRCRESAHA.122.321668. [DOI] [PMC free article] [PubMed] [Google Scholar]
- 64. Bers DM. Altered cardiac myocyte ca regulation in heart failure. Physiology (Bethesda) 21: 380–387, 2006. doi: 10.1152/physiol.00019.2006. [DOI] [PubMed] [Google Scholar]
- 65. Bayer JD, Narayan SM, Lalani GG, Trayanova NA. Rate-dependent action potential alternans in human heart failure implicates abnormal intracellular calcium handling. Heart Rhythm 7: 1093–1101, 2010. doi: 10.1016/j.hrthm.2010.04.008. [DOI] [PMC free article] [PubMed] [Google Scholar]
- 66. Shaffer F, McCraty R, Zerr CL. A healthy heart is not a metronome: an integrative review of the heart’s anatomy and heart rate variability. Front Psychol 5: 1040, 2014. doi: 10.3389/fpsyg.2014.01040. [DOI] [PMC free article] [PubMed] [Google Scholar]
- 67. Zlochiver S, Johnson C, Tolkacheva E. Constant DI pacing suppresses cardiac alternans formation in numerical cable models. Chaos 27: 093903, 2017. doi: 10.1063/1.4999355. [DOI] [PubMed] [Google Scholar]
- 68. Shanks J, Abukar Y, Lever NA, Pachen M, LeGrice IJ, Crossman DJ, Nogaret A, Paton JFR, Ramchandra R. Reverse re-modelling chronic heart failure by reinstating heart rate variability. Basic Res Cardiol 117: 4, 2022. doi: 10.1007/s00395-022-00911-0. [DOI] [PMC free article] [PubMed] [Google Scholar]
- 69. Chan IS, Ginsburg GS. Personalized medicine: progress and promise. Annu Rev Genomics Hum Genet 12: 217–244, 2011. doi: 10.1146/annurev-genom-082410-101446. [DOI] [PubMed] [Google Scholar]
- 70. Relan J, Pop M, Delingette H, Wright GA, Ayache N, Sermesant M. Personalization of a cardiac electrophysiology model using optical mapping and MRI for prediction of changes with pacing. IEEE Trans Biomed Eng 58: 3339–3349, 2011. doi: 10.1109/TBME.2011.2107513. [DOI] [PubMed] [Google Scholar]
- 71. Franciosi S, Perry FKG, Roston TM, Armstrong KR, Claydon VE, Sanatani S. The role of the autonomic nervous system in arrhythmias and sudden cardiac death. Auton Neurosci 205: 1–11, 2017. doi: 10.1016/j.autneu.2017.03.005. [DOI] [PubMed] [Google Scholar]
- 72. Mehra R, Tjurmina OA, Ajijola OA, Arora R, Bolser DC, Chapleau MW, Chen PS, Clancy CE, Delisle BP, Gold MR, Goldberger JJ, Goldstein DS, Habecker BA, Handoko ML, Harvey R, Hummel JP, Hund T, Meyer C, Redline S, Ripplinger CM, Simon MA, Somers VK, Stavrakis S, Taylor-Clark T, Undem BJ, Verrier RL, Zucker IH, Sopko G, Shivkumar K. Research opportunities in autonomic neural mechanisms of cardiopulmonary regulation: a report from the national heart, lung, and blood institute and the national institutes of health office of the director workshop. JACC Basic Transl Sci 7: 265–293, 2022. doi: 10.1016/j.jacbts.2021.11.003. [DOI] [PMC free article] [PubMed] [Google Scholar]
Associated Data
This section collects any data citations, data availability statements, or supplementary materials included in this article.
Supplementary Materials
Supplemental Figs. S1–S16 and Supplemental Table S1 and Supplemental Methods are available in the following Github repository: https://github.com/SHWeinberg/Phadumdeo-HRV-CHF.
Data Availability Statement
Supporting figures, simulation code, and data files with all patient RR sequences are available in the following Github repository: https://github.com/SHWeinberg/Phadumdeo-HRV-CHF.