

Abstract
Heme oxygenases (Hmoxs) are enzymes that catalyze the first and rate-limiting step in the degradation of heme to carbon monoxide, iron, and biliverdin. The two main isozymes, namely Hmox1 and Hmox2, are encoded by two different genes. Mutation of the Hmox1 gene in mice is known to cause extensive prenatal lethality, and limited information is available about the expression of Hmox proteins in developing mouse embryos. In this study, immunohistochemistry was used to perform a detailed investigation comparing Hmox proteins in Hmox1 wild-type and knockout (KO) mouse embryos collected from wild-type and heterozygous timed-matings. Western analysis for Hmoxs was also done in the organs of late-gestation embryos. The results demonstrated cytoplasmic and nuclear localization of Hmoxs in all the organs examined in wild-type embryos. Interestingly, Hmox2 immunoreactive protein signals were significantly low in most of the organs of mid- and late-gestation Hmox1-KO embryos. Furthermore, relative levels of Hmox2 were revealed to be significantly lower in the lung and kidney of late-gestation Hmox1-KO embryos by western analysis, which complemented the immunohistochemistry findings in these two organs. The current study provides detailed immunoexpression patterns of Hmox proteins in wild-type and Hmox1-KO mouse embryos in mid- and late-gestation:
Keywords: heme oxygenase, immunohistochemistry, knockout, mouse embryos, phenotype
Introduction
Heme oxygenases (Hmoxs) are enzymes that catalyze the first and rate-limiting step in the breakdown of heme to carbon monoxide, iron, and biliverdin. There are two isoforms of this enzyme, namely Hmox1 and Hmox2, which are encoded by two different genes. 1 Hmox1 is the product of only one transcript, whereas Hmox2 is encoded by two or more transcripts of a single gene. 2 A third isoform, Hmox3, was detected in the rat tissues 3 and was proved to be a pseudogene of Hmox2. 4 Hmox1 is a 32-kDa protein that is present at low levels in nearly all mammalian tissues under normal physiologic conditions but is readily induced by diverse agents and stimuli. 2 It is known to modulate physiologic processes such as iron homeostasis, antioxidant defense, inflammatory response, wound healing, cell proliferation, erythropoiesis, and angiogenesis. Hmox2, on the contrary, is a 36-kDa protein with tissue-specific expression, with high levels reported in testes, brain, liver, kidney, and gut.2,5 It has also been reported to be a heme-binding protein due to the presence of two heme regulatory motifs or heme-binding sites not involved in heme catalysis. 6
To understand the biological functions of Hmoxs in vivo, gene-targeted mice were produced for both Hmox1 and Hmox2. The Hmox2 knockout (KO) mouse had no obvious phenotype and survived normally. 7 On the contrary, Hmox1-KO mouse showed extensive prenatal lethality as mating between heterozygous (HET) mice yielded only 5% Hmox1-KO mice against the expected Mendelian ratio of 25%. 8 Extensive prenatal lethality of the Hmox1-KO mice was also observed by two other groups, suggesting that Hmox1 has an important role in rodent embryogenesis.9,10 However, there are contradictory reports in the literature about the gestational age at which the KO embryos die. According to two groups, it is during mid-gestation that the embryos die,11,12 whereas a third group 13 reported the lethality of embryos at late-gestation (18.5 dpc) and after birth. In our laboratory, we observed only 10.2% KO mice as opposed to the anticipated 25% in the progeny of HET breeding pairs at weaning. 14 To date, there is no consensus on the cause of this lethality or the gestational age at which the embryos die. Interestingly, double KOs for Hmox1 and Hmox2 showed 100% embryonic lethality, leading the authors to speculate that the two isoforms may be performing similar functions during development and may be compensating for each other. 11
All the pioneering studies done for the presence of Hmoxs in embryonic tissues of rats and mice focused mainly on determining Hmox activity.15 –17 This was followed by gene expression studies in the developing organs, mainly in liver, lung, and brain.17 –21 Studies on Hmox mRNA and protein levels in the embryos are, however, preliminary and incomplete. The literature review revealed that no comprehensive study providing information regarding organ- or tissue-specific localization of Hmoxs and their levels in developing embryos has been reported so far. Hmox gene expression has been reported during development, but only for a few gestational ages and mainly in the organs. There are many lacunae and complete profile of Hmox expression in mid- and late-gestation would throw light on its role in survival of embryos during development. The current work aims to elucidate the expression of Hmox proteins in mid-gestation (12.5 dpc) and late-gestation (18.5 dpc) wild-type embryos obtained from wild-type timed-matings and their comparison with the embryos obtained from HET timed-matings.
Materials and Methods
Materials
Routine chemicals used were from Merck, Sigma, and Qualigens. Antibodies: Hmox1 (ADI-SPA-895-D; Enzo Life Sciences, Farmingdale, New York, USA) and Hmox2 antibodies (ADI-SPA-897-D; Enzo Life Sciences, Farmingdale, New York, USA), β-actin (ab28364; Abcam, Cambridge, UK), and Goat anti-Rabbit IgG (HRP) secondary antibody (ab97080; Abcam, Cambridge, UK). Reagents used for immunohistochemistry: goat serum (sc-2043; Santa Cruz Biotechnology, Dallas, Texas, USA); 3, 3′ diaminobenzidine (DAB) solution (SK-4100; Vector Laboratories, Newark, California, USA); and hematoxylin stain (Sigma, St. Louis, Missouri, USA). Reagents used for western blotting: Pierce BCA protein assay kit (23227; Thermo Scientific, Waltham, Massachusetts, USA) and SuperSignal West Pico Chemiluminescent Substrate (34077; Thermo Scientific, Waltham, Massachusetts, USA), Protease inhibitor cocktail—cOmplete (Roche Holding AG, Basel, Switzerland).
Animals
Hmox1 mutation was maintained in the HET condition on a mixed genetic background (C57BL/6 × FVB with predominantly C57BL/6 background). The colony was set up in 2005 with HET breeding pairs gifted by Dr. Anupam Agarwal (The University of Alabama, Birmingham, USA). The progeny obtained by mating Hmox1 HET females and males were genotyped and documented. WT mice from the colony were also bred to obtain mice for use as controls in the experiments. C57BL/6 mice were procured from Institute of Genomics and Integrative Biology (IGIB) and bred in the transgenic animal room. These mice were used for experiments to validate the results obtained with the WT controls of the Hmox1 colony. The colony was established and maintained at 20C–24C, 40–70% humidity, and a 14 hr light/10 hr dark cycle. Animals were housed in an Individually Ventilated Caging System (Citizen Industries, Ahmedabad, Gujrat, India) to maintain them in a sterile environment. Animal husbandry and use of experimental animals were as per CPCSEA guidelines (https://cpcsea.nic.in/Content/54_1_ACTS,RULESANDGUIDELINES.aspx). The experimental protocol was approved by the Institutional Animal Ethics Committee of the Department of Zoology, University of Delhi [DU/ZOOL/IAEC-R/2017/21].
Sample Collection and Genotyping
Timed-matings were set between virgin females and proven stud males (2–6 months old). The day on which the copulatory plug was detected was considered as 0.5 dpc. Embryos along with their placenta were collected at 12.5 and 18.5 dpc, and were fixed in 4% paraformaldehyde at 4C for 6 and 28 hr, respectively. The samples were then dehydrated by passing through ascending grades of alcohol from 70% to absolute alcohol and stored at −20C in absolute alcohol till immunohistochemistry was performed. For immunoblotting, organs were dissected out and were stored in −80C deep freezer. Embryos in the correct developmental stage for 12.5 and 18.5 days, using Theiler staging criteria, were used for the study. To account for inter-animal variation, embryos were collected from three females for each gestational age.
Genomic DNA was isolated from adult tail biopsies or yolk sac of embryos (Laird’s protocol 22 ) and genotyped by multiplex polymerase chain reaction (PCR). 23 For Hmox1 WT, HET, and KO screening, two sets of primers, one specific for the WT allele and second specific for the KO allele, were used. Conditions for PCR were as follows: 95C for 5 min for denaturing the genomic DNA, 95C for 30 sec, 54C (tail biopsies)/60C (yolk sac) for 30 sec, and 72C for 1 min, repeating 35 cycles followed by 72C for 10 min for final elongation. WT (146 bp) and KO (283 bp) bands were analyzed using electrophoresis (Fig. A1).
Immunohistochemistry and Imaging
Para- and mid-sagittal sections of 5-µm thickness were obtained by sectioning the embryos using a microtome. The sections were de-paraffinized in xylene and rehydrated in a graded series of ethanol followed by antigen retrieval in 1-mM ethylenediaminetetraacetic acid solution which was heated in a water bath at 90C. This was followed by quenching the endogenous peroxidase by incubating the sections in 3% H2O2 in dark. Sections were subsequently incubated in blocking buffer (5% goat serum and 1% BSA in 0.1% PBST) for 2 hr at room temperature (RT) and then with Hmox1 and Hmox2 antibodies (1:100 dilution in 1.5% goat serum in 0.1% PBST) at 4C for 18 hr in a humidified chamber. Next, the sections were incubated with HRP-conjugated secondary antibody for 1 hr at RT. Staining in the sections was visualized using freshly prepared DAB solution for 1 min followed by counterstaining with hematoxylin for 30 sec. After this, the sections were dehydrated by passing through ascending grades of ethanol, cleared in xylene, mounted in DPX and air dried at RT. The whole-mount images of the embryos were taken with a Nikon digital camera attached to a Stereo zoom microscope [Nikon SMZ1000, Objective—Plan 1×; Zooming knob—0.8×; numerical aperture (NA)—0.1; working distance (WD)—70 mm]. For higher magnification, images were taken with a digital camera (Nikon Digital Sight DS-Fil) attached to an inverted microscope (Nikon Eclipse TS100, Objective—40× with NA—0.6 and WD—3.6–2.8 mm). The Nikon Imaging Software (NIS-Elements software) was used on computers to capture and save images taken with Nikon cameras.
Quantitation of the Immunohistochemical Images
The brown DAB staining represented the presence/localization of Hmoxs in the tissue sections, and the protein signals were quantitated in the images taken with 40× objective using ImageJ software. Briefly, the image was opened in the ImageJ and the scale bar present in the image was erased to avoid its inclusion in the quantitation. The color threshold channel was then accessed, and the “hue” and “brightness” were manually adjusted for each image using the original JPEG image of the section as a point of reference. Following that, the integrated density values were acquired with the “Measure” option in the “Analyze” menu, and the results were saved in MS-Excel format (Fig. A2).
Image Analysis
The semi-quantitative analysis was done to compare the immunoreactive signals of Hmoxs among the three groups in each organ (at each gestation). At 12.5 dpc, the brain, heart, lung, and liver were analyzed, whereas at 18.5 dpc, all of these organs, along with the kidney, were analyzed. We did not examine the kidneys at 12.5 dpc as only small outgrowths of the ureteric bud, nephric duct, and a few parts of metanephric mesenchyme (early) were visible, which were not uniform across different embryo sections. The details of the same at each gestation are listed in Table 1. For better representation of the immunohistochemical staining in each section, three images were taken with the 40× objective within each of these regions in randomly chosen fields of view. For each gestational age and genotype, three embryo samples (obtained from three distinct females) were assessed. Following quantification, the mean of the integrated densities for each embryonic organ was calculated, and the pooled mean of each organ was derived by combining the data from all three sample sets. The data were plotted as a clustered bar graph with genotype and organ as category variables and were expressed as the mean integrated density × 108 ± standard error of the mean (SEM).
Table 1.
The Organs Imaged With a 40× Objective in 12.5 and 18.5 dpc Embryo Sections for Immunohistochemical Analysis.
| 12.5 dpc Embryo (Images Analyzed/Embryo) |
18.5 dpc Embryo (Images Analyzed/Embryo) |
|---|---|
| Forebrain: corpus striatum (3)
Midbrain (3) Hindbrain: medulla oblongata (3) |
Forebrain: thalamus (3)
Midbrain (3) Hindbrain: medulla oblongata (3) |
| Heart (3) | Heart (3) |
| Lungbud (3) | Lung (3) |
| Liver (3) | Liver (3) |
| — | Kidney cortex (3)
Kidney medulla (3) |
Immunoblotting
Adult tissues and embryonic organs were lysed in radioimmunoprecipitation assay buffer containing protease inhibitors, and the amount of protein in the samples was determined with the BCA protein assay kit. Then, 40 µg of protein was separated via 12% SDS-PAGE and afterward transferred to a nitrocellulose membrane by wet electro transfer technique using the Scie-Plas apparatus. After transfer, the membrane was blocked with 5% skim milk in 0.1% TBST for 1.5 hr. After blocking, the membrane was incubated with the primary antibody (Hmox1/Hmox2: 1:10,000 dilution in 5% skim milk in 0.1% TBST) for 16 hr at 4C. This was followed by incubation with the HRP-conjugated secondary antibody (1:15,000 dilution in 0.1% TBST) for 1 hr at RT. The protein bands that had bound the primary antibody were visualized with ECL Chemiluminescent Substrate Kit (Thermo Scientific, Waltham, Massachusetts, USA) and the images of the same were captured in Amersham Imager 600 (AI600) (GE HealthCare, Chicago, Illinois, USA). The bands were quantified using AI600 Analysis Software (GE HealthCare, Chicago, Illinois, USA). Each membrane that had been probed for the protein of interest was stripped and re-probed with β-actin (1:10,000 dilution in 5% skim milk in 0.1% TBST).
Statistical Analysis
SigmaPlot 14 software was used for statistical analysis of immunohistochemistry and immunoblot data. The signal intensities/relative levels of Hmox proteins in the embryonic organs of different groups were compared. One-way analysis of variance (ANOVA) was done to compare the immunohistochemistry and immunoblot data of the embryos followed by Tukey’s honest significance test (HSD) post hoc test (only when statistically significant difference in group means was observed by ANOVA). Two-tailed Student’s t-test was done for comparing two groups (Hmox1 immunohistochemistry). Statistical significance was determined at p<0.05.
Results
In this study, wild-type embryos obtained from wild-type timed-matings (referred to as wWT) were used as controls. Our main aim was to study the immunoexpression patterns and relative levels of Hmox proteins in wild-type and Hmox1-KO mouse embryos. The wild-type littermates of KOs (referred to as WT in the text) were also analyzed in this study to check the influence of maternal genotype on the expression of Hmoxs. The partial deficiency of Hmox1 in the HET mother has been linked to delay placental and embryonic development. 12 Therefore, it was intriguing to see whether the Hmox protein expression in their wild-type progeny was altered.
Immunolocalization of Hmoxs in Mid-Gestational (12.5 dpc) Hmox1 Wild-type and KO Embryos
Hmox1: The whole-mount images of para- and mid-sagittal sections stained for Hmox1 in 12.5 dpc wild-type (wWT and WT) and KO embryo sections are shown along with no primary antibody controls (Fig. 1A to I). The staining for Hmox1 was observed throughout the wWT embryo sections (Fig. 1B and C). Immunoreactive staining was intense in the corpus striatum, roof of the neopallial cortex, wall of the fourth ventricle, wall of the midbrain, medulla oblongata, tongue, dorsal root ganglia, mantle layer of spinal cord, and liver of wWT embryo sections. In WT embryo sections (Fig. 1E and F), the pattern of staining for Hmox1 was similar to wWT embryos; however, the intensity of staining appeared to be slightly high in neopallial cortex, roof of midbrain, medulla oblongata, and mantle layer of spinal cord in the mid-sagittal section (Fig. 1F). No staining was seen for Hmox1 in KO embryo sections (Fig. 1H and I), and it looked similar to the no primary antibody control sections (Fig. 1A, D, and G).
Figure 1.

Immunohistochemical staining of para- and mid-sagittal sections (5 µm) of 12.5 dpc wWT (B and C), WT (E and F), and KO (H and I) embryos with Hmox1 antibody. A, D, and G are no primary antibody controls. The regions of the organs that were imaged at higher magnification for cellular details are indicated in the whole-mount images. (J, K) Corpus striatum: The cell types are difficult to identify and distinguish without cell type–specific markers in the brain. (L, M) Heart: Cardiac muscle (CM) cells of the muscular region of the ventricles are visible, and the nuclei (n) of the same are indicated with red arrows. (N, O) Lung bud (lb): The epithelial cells (ec) lining the lb are indicated with black arrows, and the lung mesenchyme is marked by me. (P, Q) Liver: The sinusoids are indicated by a red asterisk, and the liver parenchyma is marked as p. Other regions identified at this stage that are labeled in H and I: cc—central canal of spinal cord; cs—corpus striatum; drg—dorsal root ganglion; fv—fourth ventricle; h—heart; li—liver; lv—lateral ventricle; lb—lung bud; mb—midbrain; mo—medulla oblongata; rnc—roof of neopallial cortex; sc—spinal cord; t—tail; to—tongue. IHC was done on three embryos of each genotype and a representative of each genotype is presented in this figure. Scale bars: A to I—1 mm; J to Q—50 µm. Abbreviations: IHC, immunohistochemistry; KO, knockout; WT, wild-type.
The regions indicated in the whole-mount images were imaged with a 40× objective to analyze the cellular expression pattern. At higher magnification, Hmox1 staining was visible in the cytoplasm and nucleus of the brain cells of wWT sections (Fig. 1J). Hmox1 immunoreactive protein staining was slightly lower in the WT sections compared with the wWT, although nuclear staining appeared to be comparable (Fig. 1J and K). In the whole-mount images, this difference was not apparent. Cytoplasmic and nuclear staining for Hmox1 was comparable in the cardiac muscles of heart (Fig. 1L and M) of the wWT and WT embryo sections. Hmox1 staining was detected in the cytoplasm of the epithelial cells of the lung bud and the surrounding mesenchymal cells of wWT sections, whereas only some of these cell types showed nuclear staining (Fig. 1N). The pattern of staining for Hmox1 in the lung bud of the embryos was similar in wWT and WT, but the intensity appeared to be slightly less in the later (Fig. 1N and O). Hmox1 staining was observed in the cytoplasm and nucleus of most of the cells present in the liver parenchyma (Fig. 1P). Both cytoplasmic and nuclear staining for Hmox1 was slightly less in WT compared with that in wWT sections (Fig. 1P and Q). The intensity of staining varied slightly among the three embryo sets examined by immunohistochemistry for a specific protein, but the pattern was consistent.
Hmox2: The overall pattern of staining for Hmox2 in wWT embryo sections was similar to that of Hmox1 as intense staining was observed throughout the sections (Fig. 2A and B). The pattern of immunoreactive staining for Hmox2 in WT embryo sections was similar to that of wWT (Fig. 2A to D). However, in the KO embryo sections, immunoreactive staining for Hmox2 was less intense in comparison with wWT and WT (Fig. 2A to F). Higher magnification images demonstrated that the immunoreactive Hmox2 protein staining in the cytoplasm of the brain cells was similar in wWT and WT sections, whereas the nuclear staining was more in wWT (Fig. 2G and H). Both cytoplasmic and nuclear staining was low in the KO section compared with the wWT and WT (Fig. 2G to I). Immunoreactive staining for Hmox2 in the cardiac muscle cells of the heart was slightly higher in WT compared with wWT sections (Fig. 2J and K), whereas in the Kos, the staining appeared to be low (Fig. 2L). In lung bud, staining intensity for Hmox2 in the cytoplasm and nuclei of the two cell types (epithelial and mesenchymal cells) was slightly low in WT and KO sections compared with that of wWT (Fig. 2M to O). Comparison of Hmox2 immunoreactive staining in liver showed that both cytoplasmic and nuclear staining was more or less comparable in the wWT and WT sections, whereas it was low in KOs (Fig. 2P to R).
Figure 2.

Immunohistochemical staining of para- and mid-sagittal sections (5 µm) of 12.5 dpc wWT (A and B), WT (C and D), and KO (E and F) embryos with Hmox2 antibody. The regions of the organs that were imaged at higher magnification for cellular details are indicated in the whole-mount images. (G to I) Corpus striatum: The cell types are difficult to identify and distinguish without cell type–specific markers in the brain. (J to L) Heart: Cardiac muscle (CM) cells of the muscular region of the ventricles are visible, and the nuclei (n) of the same are indicated with red arrows. (M to O) Lung bud (lb): The epithelial cells (ec) lining the lb are indicated with black arrows, and the lung mesenchyme is marked by me. (P to R) Liver: The sinusoids are indicated by a red asterisk, and the liver parenchyma is marked as p. IHC was done on three embryos of each genotype and a representative of each genotype is presented in this figure. Scale bars: A to F—1 mm; G to R—50 µm. Abbreviations: IHC, immunohistochemistry; KO, knockout; WT, wild-type.
Immunolocalization of Hmoxs in Late-Gestational (18.5 dpc) Hmox1 Wild-type and KO Embryos
Hmox1: The whole-mount images of para- and mid-sagittal sections stained for Hmox1 in 18.5 dpc wild-type (wWT and WT) and KO embryo sections are shown along with no primary antibody controls (Fig. 3A to I). Differential staining pattern for Hmox1 in wWT embryo sections was observed (Fig. 3B and C) with high immunoreactive staining in all regions of the brain, heart, deposits of brown fat, liver, and mantle layer of spinal cord. Moderate staining was seen in tongue, duodenum, forelimbs, and kidney. Staining in lung and thymus gland appeared to be low. Similar to wWT sections, differential staining was also observed in the WT sections for Hmox1, but the overall intensity was slightly low (Fig. 3E and F).
Figure 3.

Immunohistochemical staining of para- and mid-sagittal sections (5 µm) of 18.5 dpc wWT (B and C), WT (E and F), and KO (H and I) embryos with Hmox1 antibody. A, D, and G are no primary antibody controls. (J, K) Lung: The alveoli (al) are clearly visible; however, it is difficult to distinguish between epithelial and mesenchymal cells in areas surrounding them. Epithelial cells of the bronchiole (br) are indicated by black arrows. (L, M) Liver: Individually scattered megakaryocytes (Me) are indicated with blue arrows, and the liver parenchyma is marked as p. (N, O) Kidney cortex: Proximal or distal convoluted tubules (pct/dct) and glomeruli (g) are indicated by red and yellow arrows, respectively, and the cortex parenchyma is marked as p. (P, Q) Kidney medulla: Mostly, radially arranged collecting ducts (cd) indicated by green arrows are visible in the medulla. Other regions identified at this stage that are labeled in H and I:; bf—deposits of brown fat; f—forelimb; fb—forebrain; h—heart; hb—hindbrain; k—kidney; li—liver; lu—lung; mb—midbrain; sc—spinal cord; t—tail; tg—thymus gland; to—tongue. IHC was done on three embryos of each genotype and a representative of each genotype is presented in this figure. The higher magnification images of the forebrain and heart regions (indicated with an asterisk in C and F) are presented in Fig. A3. Scale bars: A to I—2 mm; J to Q—50 µm. Abbreviations: IHC, immunohistochemistry; KO, knockout; WT, wild-type.
Higher magnification images showed uniform Hmox1 staining in the cytoplasm of the brain cells of wWT section. Nuclear staining for Hmox1 was also visible in some of the brain cells of forebrain and most of cells of mid- and hindbrain. In forebrain, both cytoplasmic and nuclear immunoreactive Hmox1 staining was low in WT sections compared with wWT (Fig. A3A and B). The size of the nuclei and the substance of the brain appear to be slightly different in the two wild-types. The brain has a complex histological structure and innate anatomical variations are present in it. Hence, one cannot attribute these differences to the genotype. In cardiac muscle cells of the heart of wWT sections (Fig. A3D and E), Hmox1 staining was present throughout the cytoplasm but nuclear staining was detected only in few cells. Hmox1 cytoplasmic staining was high in wWT section compared with WT in the cardiac muscle cells. In lung, moderate Hmox1 staining was seen in the nucleus of most of the cells surrounding the alveoli and epithelial cells of the bronchioles of the wWT sections (Fig. 3J). Cytoplasmic staining was also seen in most of the cells but the intensity was low. At this stage, it is difficult to distinguish epithelial cells from mesenchymal cells in the areas surrounding the alveoli without the use of specific cell markers. Immunoreactive Hmox1 staining was comparable in wWT and WT sections (Fig. 3J and K). Hmox1 was localized in both cytoplasm and nucleus of some of the parenchymal cells, and intense staining was present in small clusters in the liver of wWT sections (Fig. 3L). The pattern and immunoreactive staining of Hmox1 protein was similar in wWT and WT sections (Fig. 3L and M). In kidney, Hmox1 was localized in the cytoplasm and nucleus of most of the proximal and distal convoluted tubules present in the cortex of wWT section (Fig. 3N); however, it was difficult to distinguish between these two types of tubules. Faint staining was seen in the cells of the glomeruli. In medulla (Fig. 3P), both cytoplasmic and nuclear staining was seen in most of the cells of collecting ducts and loop of Henle. In both the cortex and medulla, only a few interstitial cells of the parenchyma showed faint cytoplasmic staining for Hmox1. Similar intensity Hmox1 immunoreactive staining was observed in the cytoplasm and nuclei of some of the proximal and distal convoluted tubules present in the kidney cortex of wWT and WT sections (Fig. 3N and O). In collecting ducts present in the medulla, the immunoreactive staining for Hmox1 was also comparable in wWT and WT sections (Fig. 3P and Q).
Hmox2: The pattern of staining for Hmox2 was uniform throughout the embryo sections, as all the organs that are visible at this gestational age showed intense staining in wWT embryo sections (Fig. 4A and B). The immunoreactive staining pattern for Hmox2 in WT embryo sections was comparable with that of wWT but the intensity appeared to be slightly lower (Fig. 4A to D). Furthermore, in the KO embryo sections, immunoreactive staining for Hmox2 was markedly lower in comparison with wWT and WT (Fig. 4A to F).
Figure 4.

Immunohistochemical staining of para- and mid-sagittal sections (5 µm) of 18.5 dpc wWT (A and B), WT (C and D), and KO (E and F) embryos with Hmox2 antibody. The regions of the organs that were imaged at higher magnification for cellular details are indicated in the whole-mount images. (G to I) Lung: The alveoli (al) are clearly visible and the epithelial cells of the bronchiole (br) are indicated by black arrows. (J to L) Individually scattered megakaryocytes (me) are indicated with blue arrows, and the liver parenchyma is marked as p. (M to O) Kidney cortex: Proximal or distal convoluted tubules (pct/dct) and glomeruli (g) are indicated by red and yellow arrows, respectively, and the cortex parenchyma is marked as p. (P to R) Kidney medulla: Mostly, radially arranged collecting ducts (cd) indicated by green arrows are visible in the medulla. IHC was done on three embryos of each genotype and a representative of each genotype is presented in this figure. The higher magnification images of the forebrain and heart (indicated with an asterisk in B, D, and F) are presented in Fig. A3. Scale bars: A to F—2 mm; G to R—50 µm. Abbreviations: IHC, immunohistochemistry; KO, knockout; WT, wild-type.
Higher magnification images revealed that Hmox2 was localized uniformly in cytoplasm of the brain cells and in nucleus of most of these cells in wWT sections (Fig. A3G). Intense Hmox2 staining was present throughout the cytoplasm of cardiac muscle cells of heart but nuclear staining was detected only in few cells (Fig. A3J). The intensity of Hmox2 staining in the cytoplasm and nucleus of brain and cardiac muscle cells was in the following order: wWT > WT > KO (Fig. A3G to L). In lung, intense staining was seen in the cytoplasm and nucleus of most of the cells surrounding the alveoli and epithelial cells of the bronchioles (Fig. 4G). The WT and KO lung sections displayed lower Hmox2 staining than wWT sections (Fig. 4G to I). Hmox2 staining was intense and uniform in the cytoplasm of liver parenchymal cells of wWT sections (Fig. 4J). Few of these cells had nuclear staining for Hmox2. The order of Hmox2 immunoreactive staining intensity in the cytoplasm and nuclei of liver parenchyma cells was similar to that observed in the brain and heart (Fig. 4J to L). Intense cytoplasmic and nuclear staining for Hmox2 was seen in both cortical and medullary regions of wWT sections, including proximal and distal convoluted tubules, collecting duct, and the loop of Henle, whereas staining in the glomeruli was faint (Fig. 4M and N). Hmox2 staining intensity was low in these tubules in both WT and KO sections (Fig. 4N, O, Q, and R).
Semi-quantitative Analysis of Immunohistochemistry Results
All 12.5 and 18.5 dpc samples were quantitated, and the results are shown in Fig. 5 as mean ± SEM in a clustered bar graph.
Figure 5.

Semi-quantitative analysis of immunohistochemistry results of 12.5 and 18.5 dpc embryos. Three images in each organ were taken for each section and quantitated using ImageJ. The immunoreactive signals for the analyzed proteins in the various organs of wWT, WT, and KO embryo sections are plotted as mean integrated density × 108 ± SEM (n=3 biological replicates). An asterisk indicates significant difference between three groups as determined by Student’s t-test (Hmox1) or Tukey’s post hoc test (Hmox2). Statistical significance was determined at *p<0.05. Abbreviations: KO, knockout; WT, wild-type.
Hmox1: At 12.5 dpc, no significant difference was observed in the immunoreactive protein signals of Hmox1 between wWT and WT in the four organs. At 18.5 dpc, WT embryos showed significantly lower Hmox1 protein signals in the heart (p=0.017, Student’s t-test) and liver (p=0.005, Student’s t-test) compared with wWT controls.
Hmox2: At 12.5 dpc, ANOVA revealed significant differences for Hmox2 protein signals in the brain (p<0.001), lung (p<0.001), and liver (p=0.002) of the three groups. In the brain, Hmox2 signals were significantly lower in KO embryos compared with the wWT and WT (p<0.001, Tukey’s HSD post hoc test). In the lung, Hmox2 signals were significantly higher in WT embryos compared with that of wWT (p=0.011, Tukey’s HSD post hoc test) and KO (p<0.001, Tukey’s HSD post hoc test). The Hmox2 signals were also lower in the liver of KO embryos compared with wWT (p=0.01, Tukey’s HSD post hoc test) and WT (p<0.001, Tukey’s HSD post hoc test). At 18.5 dpc, ANOVA revealed significant differences in Hmox2 protein signals in all the organs (brain, heart, liver, and kidney: p<0.001, lung: p=0.002). It was observed that the signals were significantly lower in organs of the KO embryos compared with wWT (brain, heart, liver, and kidney: p<0.001; lung: p=0.002; Tukey’s post hoc test) and WT embryos (brain: p=0.043, heart: p=0.012, liver: p=0.027, and kidney: p=0.02; Tukey’s post hoc test). Significant differences were also observed between wWT and WT in all the organs except the lung, with the signals in the WT being lower.
Relative Levels of Hmox1 Protein in the Organs of Late-Gestation (18.5 dpc) Hmox1 Wild-type Embryos and Validation of Controls Used in This Study
As mentioned above, we used wWT as controls that were obtained from the timed-matings between wild-type mice from our Hmox1 colony. These have a mixed genetic background (C57BL/6 × FVB with predominantly C57BL/6 background). To validate these controls, we performed immunoblot analysis for Hmox1 in the organs of wild-type embryos obtained from three different types of timed-matings: (1) ♂C57BL/6 × ♀C57BL/6 (BL/6), (2) ♂wWT × ♀wWT, and (3) ♂HET × ♀HET. We also included wild-type embryos from HET timed-mating because our immunohistochemical data revealed significant changes in the Hmox1 protein signals in the heart and liver of wWT and WT embryos.
Immunoblots with three biological replicates of each wild-type (BL/6, wWT, and WT) of 18.5 dpc organs probed with Hmox1 antibody are presented in Fig. 6. Organs from three embryos obtained from three different females for each type of timed-mating were analyzed to account for inter-animal variation. Spleens from wWT and KO adult mice were used as positive and negative controls, respectively. Positive control sample had three bands depicting the presence of 32, 30, and 28 kDa Hmox1 forms, whereas no band was detected in the negative control sample. Western blot analysis of the embryonic organs revealed the presence of Hmox1 protein in all the five organs; however, the intensity of the bands and presence of the three forms was variable. Faint 32 and 28 kDa bands were detected in the brain of all the three types of wild-type embryos with similar intensities. In the heart, 32 kDa bands were of similar intensities except in two samples which had slightly lower intensity bands (wWT and WT of set 3). Bands of 28 kDa were extremely faint in most of the heart samples and absent in one BL/6 (set 1) and one WT (set 3) heart sample. All the three forms were detected in the lung and liver of late-gestational embryos. In the lung, 32 and 28 kDa bands were of high but variable intensities, whereas 30 kDa bands were faint but of similar intensity in all the samples. In liver, intense bands were detected for 32 and 28 kDa forms, whereas 30 kDa bands were faint. The pattern of bands observed was similar to that of the lung. In kidneys, 32 and 28 kDa bands were detected; however, the 28-kDa bands were more intense in wWT and WT kidney samples compared with that of BL/6 in all the three sets.
Figure 6.

Western blots of Hmox1 in brain, heart, lung, liver, and kidney of 18.5 dpc BL/6, wWT, and WT embryos with the corresponding β-actin blots. The positions of the samples are indicated. Spleen samples (10 µg) in the last two lanes of each blot were from wWT and KO adult mouse. The integrated signal intensities of the bands were quantitated using Amersham Imager 600 software. The ratio of integrated signal intensities of Hmox1 to β-actin was calculated and plotted as mean ± SD (n=3 biological replicates) in a clustered bar graph. Statistical significance was determined at p<0.05. Asterisk (*) and hash (#) indicate significant difference between two groups as determined by Tukey’s HSD post hoc test and Student’s t-test, respectively. Abbreviations: HSD, honest significance test; KO, knockout; WT, wild-type.
The integrated signal intensity of the bands was quantitated, and the ratios of Hmox1 to β-actin for each form are plotted as mean ± SD in a clustered bar graph (Fig. 6—clustered bar graph). We did not compare the relative amount of all the three forms of Hmox1 among the organs because the level of β-actin varied in the embryonic organs. ANOVA revealed significant differences in the relative levels of 30 kDa (p=0.01) and 28 kDa (p=0.032) Hmox1 forms in the livers of the three groups. It was observed that relative levels of these two forms of Hmox1 were significantly lower in the liver of WT compared with wWT (30 kDa: p=0.009 and 28 kDa: p=0.028; Tukey’s HSD post hoc test). ANOVA gave a p value of 0.052 when the relative levels of 32 kDa Hmox1 were compared in the liver of the three groups. This suggested that the differences could be significant as the value was just above the set threshold of 0.05. Therefore, we did pairwise comparison by Student’s t-test and observed that the relative levels of 32 kDa Hmox1 were significantly lower in WT liver compared with wWT (p=0.0234, two-tailed Student’s t-test). These results clearly indicate that there is no difference in the relative levels of Hmox1 in BL/6 and wWT in the five organs analyzed validating the suitability of wWT used as controls in this study.
Relative Levels of Hmox2 Protein in Organs of Late-Gestation (18.5 dpc) Hmox1 Wild-type and KO Embryos
Immunoblots with three biological replicates of each genotype (wWT, WT, and KO) of 18.5 dpc organs probed with Hmox2 antibody are presented in Fig. 7. Testes from wWT and KO adult mice were used as positive controls which detected 38 and 36 kDa Hmox2 bands. Western blot analysis of the embryonic organs revealed the presence of 36 kDa Hmox2 protein in all the five organs; however, the intensity and pattern of the bands was variable. Very faint 36 kDa bands were seen for Hmox2 in the brain of wWT, WT, and KO embryos. In the heart, bands were of variable intensity. All three KO lung samples had bands of low intensity compared with the wWT and WT samples. In the liver, bands seemed to have equal intensities apart from one of the samples [wWT (set 2)]. The bands in all the three KO kidney samples were very faint; however, the wWT and WT kidney samples had bands of comparable intensity.
Figure 7.

Western blots of Hmox2 in brain, heart, lung, liver, and kidney of 18.5 dpc wWT, WT, and KO embryos with the corresponding β-actin blots. The positions of the samples are indicated. Testis samples (40 µg) in the last two lanes of each blot were from wWT and KO adult mouse. The integrated signal intensities of the bands were quantitated using Amersham Imager 600 software. The ratio of integrated signal intensities of Hmox2 to β-actin was calculated and plotted as mean ± SD (n=3 biological replicates) in a clustered bar graph. Statistical significance was determined at p<0.05. Asterisk (*) indicates significant difference between two groups as determined by Tukey’s HSD post hoc test. Abbreviations: HSD, honest significance test; KO, knockout; WT, wild-type.
ANOVA revealed significant differences in the relative levels of Hmox2 in the lung (p=0.03) and kidney (p=0.013) of 18.5 dpc embryos (Fig. 7—clustered bar graph). It was observed that relative levels of Hmox2 were significantly lower in both these organs of KO embryos compared with the wWT embryos (lung: p=0.003 and kidney: p=0.011; Tukey’s HSD post hoc test). Although the relative levels of Hmox2 in WT were low compared with wWT in the five organs analyzed, the differences were not significant.
Discussion
Hmox1 is a key player in the degradation of heme and mutation in this gene in mice is known to cause extensive partial (or full) prenatal or postnatal lethality.1,8 –14 The manifestation of the phenotype in Hmox1 KO mouse embryos is variable. The phenotype observed in Hmox1 KO embryos includes varying degree of embryonic growth retardation, pallor in embryos and amniotic sac, lower body weights, and smaller size.11,12,24 As the work on localization and levels of Hmox protein in mouse embryos was preliminary and incomplete, we performed a comprehensive examination of the same in mid- and late-gestation wild-type and KO mouse embryos.
In the current study, we observed tissue localization of Hmoxs in all the major developing organs during mid- and late-gestation wild-type embryos, indicating their importance during development. Interestingly, both nuclear and cytoplasmic localization was seen for the Hmoxs in the major organs of the embryos. Immunoblot analysis also confirmed the presence of Hmoxs in the brain, heart, lung, liver, and kidney of late-gestation wild-type embryos. Out of the three forms of Hmox1, the ones with molecular mass 32 and 28 kDa were detected in all the organs, whereas the 30-kDa form was detected only in lung and liver. The 30- and 28-kDa forms are known to be generated by proteolytic cleavage of 32 kDa Hmox1.25 –28 The 30-kDa fragment was shown to be capable of biological activity like the native protein, 25 whereas the 28-kDa fragment has been shown to be localized in the nucleus and had low or no enzymatic activity. 28 The relative levels of 32 and 28 kDa Hmox1 and immunoreactive signals in the brain of 18.5 dpc embryo were low. A previous study, on the contrary, found no Hmox1 protein in the brains of rat embryos from 1 day before birth to adulthood. 18 Another study done on the cerebral cortex of mice found significantly higher Hmox1 mRNA levels at 14 dpc, which dropped during the postnatal period and reached their lowest levels by adulthood. 21 These reports, however, cannot be directly compared with our findings because one was conducted in rats and the other examined mRNA levels in mouse embryos, whereas we examined the protein levels. Nonetheless, even though several studies illustrate the neuroprotective role of Hmox1 in adults, its role in embryonic development is unknown. 29 The presence of Hmox1 in the cardiac cells of developing heart clearly demonstrates its importance. However, little is known about the role of Hmox1 in cardiac function during development, despite the fact that numerous lines of evidence suggest that it has cytoprotective and anti-apoptotic effects on adult mammalian cardiomyocytes through CO.30,31 Hmox1–CO system has been reported to maintain ventricular size and blood pressure during acute hypoxia.32,33 However, whether it also plays a role in maintaining ventricular size during embryonic development needs to be investigated, as the size of the ventricle is an important metric of heart function because it determines how much blood can be pumped per heartbeat. It is important to note that the intrauterine environment is relatively hypoxic compared with the external environment. 34
The profile of the three forms of Hmox1 in the five organs of late-gestation wild-type embryos is a novel observation. Immunohistochemistry demonstrated that Hmox1 was found in the cytoplasm of lungbud epithelial cells at 12.5 dpc, alveoli and bronchiolar epithelial cells at 18.5 dpc, and surrounding mesenchymal cells. Previous study has found that Hmox1 mRNA in rats peaked at late-gestation, between 19.5 and 20.5 dpc, and then fell dramatically postnatally. 20 However, the Hmox1 protein levels were found to be the highest few hours after birth and lowest in adults and suggested that it might be playing a role in oxidative stress protection. Interestingly, postnatal (at day 10) lung development has been found to be compromised in Hmox1-KOs with disorganized and simpler alveolar structure and has been attributed to cause partial postnatal lethality. 13 These findings show that Hmox1 may be involved in lung development as well as oxidative stress protection. In the liver, Hmox1 was present as intense small clusters in the parenchyma. Several studies have reported higher levels of Hmox1 mRNA/protein/activity in the late-gestation rodent embryos (or neonates) compared with adults.17,19,35 A recurrent finding in these studies was that the developing liver had more Hmox1 expression than the adult, implying that the liver might be the main site of heme degradation during development. We also observed lower Hmox1 protein in the liver compared with the spleen in adults, even though spleen lysate with only 10 µg of protein was loaded compared with liver lysate with 40 µg in the preliminary blots done for the selection of positive control samples for western analysis (Fig. A4). The lower hepatic Hmox1 protein levels in adults compared with fetuses could be because, in adults, the spleen takes over the heme degradation. The 32- and 28-kDa forms of Hmox1 were found in kidneys, with the 28-kDa band being more intense, which implicated that perhaps the regulatory role of Hmox1 was more prevalent (as 28 kDa has been shown to localize to the nucleus). The immunolocalization of Hmox1 was mostly found in the cytoplasm and nucleus of the various tubules of cortex and medulla.
With respect to Hmox2, we detected 36 kDa Hmox2 in the aforementioned organs of 18.5 dpc wild-type embryos and a uniform localization of Hmox2 in various organs of 12.5 and 18.5 dpc wild-type embryos. Surprisingly, the Hmox2 signals were high in the brains of 12.5 and 18.5 dpc embryos by immunohistochemical analysis, but the western analysis at 18.5 dpc revealed that the relative level of Hmox2 was low. One can attribute this difference to techniques, as immunohistochemistry was done only on two sections of 5 µm each, whereas western blotting was done on lysate prepared from the whole brain of the embryo. Our results were consistent with the previous reports in rodents in which Hmox2 protein was detected in the brain of late-gestation embryos.18,21 However, a faint band of 38 kDa was also seen in the brain, as well as the heart, lung, and kidneys. In mice, Hmox2 transcript variants encoding proteins with additional 19 (transcript variant 4) and 28 amino acids (transcript variant 3) have been reported (NCBI Reference Sequence: NP_001365928.1; NP_001343979.1), which might be the band observed at 38 kDa, but its significance needs to be investigated. Hmox2 protein has been shown to be high in late-gestation (16.5 and 19.5 dpc) rat embryo lungs which declined at birth. 20 Study done in neonatal rats revealed that Hmox2 protein levels increased after birth, remained high for the first 2 weeks postpartum, and gradually decreased to the low levels in the adults. 35 However, there are no reports regarding the expression of Hmox2 in mouse embryos. Nonetheless, our work clearly shows that Hmox2 is localized uniformly in mid- and late-gestation wild-type embryos. The protein was detected in all the five organs analyzed in late-gestation embryos, though the relative levels were low in the brain, contrary to what has been observed in the adults. 36
The comparison of immunoreactive Hmox1 protein in the two wild-types (wWT and WT) revealed altered protein signals during late-gestation as Hmox1 signals were low in the heart and liver of WT embryos. This was complemented by our immunoblot analysis as we observed lower Hmox1 levels in the liver of WT embryos compared with the wWT embryos. This could be attributed to the influence of maternal Hmox1 genotype. Primitive hematopoiesis, which primarily involves the generation of primitive erythroid cells in the yolk sac and the subsequent seeding of the liver with definitive myelo-erythroid progenitor cells, declines at 12.5 dpc. Following that, definitive hematopoiesis takes over, sustaining the adult blood system via hematopoietic stem cells in the liver. 37 During embryogenesis, separate populations of erythroid cells are formed, which help to transport oxygen and metabolic waste products via hemoglobin.38,39 The synthesis of heme and its catabolism are therefore extremely important in maintaining appropriate levels of heme in erythroid cells. Dynamic interplay of multiple events such as erythrocyte maturation and turnover, iron absorption and transport, hemoglobin synthesis, heme synthesis and degradation occurs simultaneously in a rapidly growing embryo. Therefore, a precise balance between different systems has to ensure that it also has protective mechanisms in place to dispose of the potentially toxic free heme and free iron. Consequently, it is evident that Hmox1 is essential for the embryo’s survival by reducing the potential toxicity of unbound heme and iron in the liver. Nonetheless, how partial deficiency of Hmox1 in the mother is affecting the expression of Hmox1 mainly in the liver of WT embryos warrants further investigation, as we also observed lower Hmox2 in the organs of 18.5 dpc WT embryos compared with the wWT controls.
The most interesting observation in our study was lower Hmox2 protein signals in the analyzed organs of mid- and late-gestation Hmox1-KO embryos compared with the wWT controls. This was again complemented by our immunoblot analysis as we observed lower levels of 36 kDa Hmox2 in lung and kidney of Hmox1-KO embryos. However, we found no significant alterations in the 38-kDa form of Hmox2 in the organs between wWT and KO, but its role needs to be examined (data not shown). Lower Hmox2 protein in Hmox1-KO embryos has not been reported in the literature so far. It is certainly an interesting observation because Hmox1 has been reported to be inducible by a broad range of chemical and physical stresses and structurally unrelated agents, including heme, heat shock, cytokines, lipopolysaccharide, growth factors, hydrogen peroxide, and heavy metals, whereas Hmox2 is constitutively expressed.31,40 The current rationale for two isoforms of Hmox is that Hmox2 offers a baseline level of defense against heme in the absence of stressors that would otherwise induce Hmox1. Interestingly, we found that Hmox2 levels were low in organs of 18.5 dpc KO embryos where the 28-kDa form is either equal to or greater than 32 kDa, such as the lung, liver, and kidney. Previous work has confirmed that nuclear localization of Hmox1 regulates the DNA-binding activity of important transcription factors and activates the expression of critical genes involved in oxidative stress response. 40 Genetic compensation, which involves changes in the level of RNA/protein that can functionally compensate for the absence another gene, is common. 41 However, this is certainly not the case here, and the current findings imply that the expressions of Hmox1 and Hmox2 are correlated, which needs to be experimentally verified.
In summary, our current work involves the localization of Hmoxs in mid- and late-gestation wild-type mouse embryos. We are first to report the profile of the three forms of Hmox1 in the organs of late-gestation wild-type embryos. Furthermore, the Hmoxs were low in the wild-type embryos obtained from HET mother. The lower Hmox2 protein in the organs of mid- and late-gestation Hmox1-KO embryos compared with the wWT controls, particularly in the lung and kidney of 18.5 dpc KOs, is a novel observation. The findings of the study highlight that Hmoxs are crucial during embryonic development, and their role is certainly not restricted to canonical heme degradation during embryogenesis.
Acknowledgments
The authors thank the animal house staff for their help, particularly Mr. Hem Narayan Sharma, in carrying out this study smoothly.
Appendix
Appendix Figure A1.
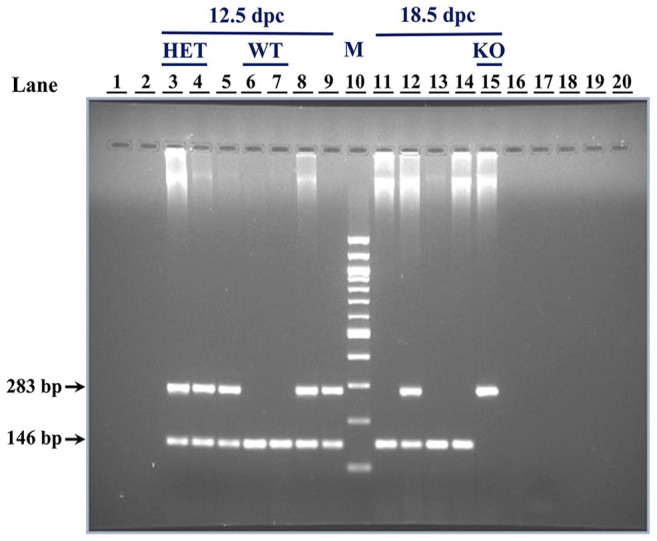
A representative gel demonstrating the genotype determination of 12.5 and 18.5 dpc embryos by agarose gel electrophoresis of multiplex polymerase chain reaction (PCR) products. DNA was isolated from yolk sac samples of the embryos and 2 μl of the same was used as template in multiplex PCR. The PCR products were analyzed on 2% agarose gel. Amplicons are indicated by arrows: samples with only 146 bp band are WT, with only 283 bp band are KO, and with both bands are HET. Lanes are numbered 1–20 with the corresponding sample number in brackets. Sample number indicates the ID of the embryos from which the yolk sac was collected: 3 (E786*), 4 (E787*), 5 (E788*), 6 (E789*), 7 (E790*), 8 (E791*), 9 (E792*), 10 (M: 100 bp DNA marker), 11 (E793*), 12 (E794*), 13 (E795*), 14 (E796*), 15 (E797*), 17 (negative control). Abbreviations: HET, heterozygous; KO, knockout; WT, wild-type.
Appendix Figure A2.

Screenshots of the steps of quantitation of immunohistochemical images by ImageJ software.
Appendix Figure A3.

(A to C) Immunohistochemical localization of Hmox1 in the forebrain region of the wWT, WT, and KO embryos. The region of forebrain imaged was thalamus which is a diencephalon derivative. (D to F) Immunohistochemical localization of Hmox1 in the heart of the wWT, WT, and KO embryos. Cardiac muscle (CM) cells of the muscular region of the ventricles are visible and the nuclei (n) of the same are indicated with black arrows. (G to I) Immunohistochemical localization of Hmox2 in the forebrain region of the wWT, WT, and KO embryos. (J to L) Immunohistochemical localization of Hmox2 in the heart of the wWT, WT, and KO embryos. Scale bars: 50 µm. Abbreviations: KO, knockout; WT, wild-type.
Appendix Figure A4.

Hmox1 and Hmox2 protein detection in organs of wWT adult mouse. Ten µg of protein was loaded for spleen, whereas for remaining tissues 40 µg was loaded. (A) Colored images of the blots probed with Hmox1 and Hmox2 antibodies showing the position of bands with respect to the prestained protein marker. (B) Colored images of the same blots stripped and probed with β-actin antibody. (C) Gray scale images of the same blots taken without colorimetric marker. Lane 1—prestained protein marker, lane 2—lung, lane 3—liver, lane 4—spleen, lane 5—kidney, and lane 6—testis. Abbreviation: WT, wild-type.
Footnotes
The author(s) declared no potential conflicts of interest with respect to the research, authorship, and/or publication of this article.
Author Contributions: MR, DB, and SBM helped with conceptualization and experimental design; MR, PC, DB, SJ, and SBM with sample collection and methodology; MR and DB with experiments; MR, SBM, DB, and PC with data analysis and interpretation; MR with writing of original draft; and MR, DB, PC, SJ, and SBM with revisions to scientific content of manuscript. All coauthors approved the manuscript.
Funding: The author(s) disclosed receipt of the following financial support for the research, authorship, and/or publication of this article: This research was supported by R&D Grant from the University of Delhi awarded to SBM and DST PURSE Phase II scheme, Department of Zoology, University of Delhi. MR (Schs./JRF & SRF/AA/139/F-124/2013-14), DB, and PC(21/06/2015 (i)EU-V) received fellowship from UGC. SJ (09/045/(1533)/2017-EMR-1) received CSIR fellowship.
ORCID iDs: Meenakshi Rana  https://orcid.org/0000-0002-4465-4298
Divya Bajaj
https://orcid.org/0000-0001-5040-1521
Sidhant Jain
https://orcid.org/0000-0003-2596-9566
Contributor Information
Meenakshi Rana, Department of Zoology, University of Delhi, New Delhi, India; Department of Zoology, Dyal Singh College, University of Delhi, New Delhi, India.
Divya Bajaj, Department of Zoology, University of Delhi, New Delhi, India; Department of Zoology, Hindu College, University of Delhi, New Delhi, India.
Pooja Choubey, Department of Zoology, University of Delhi, New Delhi, India.
Sidhant Jain, Department of Zoology, University of Delhi, New Delhi, India; Institute for Globally Distributed Open Research and Education (IGDORE), Rewari, Haryana, India.
Sharmila Basu-Modak, Department of Zoology, University of Delhi, New Delhi, India.
Literature Cited
- 1. Cruse I, Maines MD. Evidence suggesting that the two forms of heme oxygenase are products of different genes. J Biol Chem. 1988;263(7):3348–53. [PubMed] [Google Scholar]
- 2. Ryter SW, Alam J, Choi AM. Heme oxygenase-1/carbon monoxide: from basic science to therapeutic applications. Physiol Rev. 2006;86(2):583–650. [DOI] [PubMed] [Google Scholar]
- 3. McCoubrey WK, Jr, Huang TJ, Maines MD. Isolation and characterization of a cDNA from the rat brain that encodes hemoprotein heme oxygenase-3. Eur J Biochem. 1997;247(2):725–32. [DOI] [PubMed] [Google Scholar]
- 4. Hayashi S, Omata Y, Sakamoto H, Higashimoto Y, Hara T, Sagara Y, Noguchi M. Characterization of rat heme oxygenase-3 gene. Implication of processed pseudogenes derived from heme oxygenase-2 gene. Gene. 2004;336(2):241–50. [DOI] [PubMed] [Google Scholar]
- 5. Maines MD, Trakshel GM, Kutty RK. Characterization of two constitutive forms of rat liver microsomal heme oxygenase. Only one molecular species of the enzyme is inducible. J Biol Chem. 1986;261(1):411–9. [PubMed] [Google Scholar]
- 6. McCoubrey WK, Jr, Huang TJ, Maines MD. Heme oxygenase-2 is a hemoprotein and binds heme through heme regulatory motifs that are not involved in heme catalysis. J Biol Chem. 1997;272(19):12568–74. [DOI] [PubMed] [Google Scholar]
- 7. Poss KD, Thomas MJ, Ebralidze AK, O’Dell TJ, Tonegawa S. Hippocampal long-term potentiation is normal in heme oxygenase-2 mutant mice. Neuron. 1995;15(4):867–73. [DOI] [PubMed] [Google Scholar]
- 8. Poss KD, Tonegawa S. Heme oxygenase 1 is required for mammalian iron reutilization. Proc Natl Acad Sci U S A. 1997;94(20):10919–24. [DOI] [PMC free article] [PubMed] [Google Scholar]
- 9. Yet SF, Perrella MA, Layne MD, Hsieh CM, Maemura K, Kobzik L, Wiesel P, Christou H, Kourembanas S, Lee ME. Hypoxia induces severe right ventricular dilatation and infarction in heme oxygenase-1 null mice. J Clin Invest. 1999;103(8):R23–9. [DOI] [PMC free article] [PubMed] [Google Scholar]
- 10. Yoshida T, Maulik N, Ho YS, Alam J, Das DK. H(mox-1) constitutes an adaptive response to effect antioxidant cardioprotection: a study with transgenic mice heterozygous for targeted disruption of the Heme oxygenase-1 gene. Circulation. 2001;103(12):1695–701. [DOI] [PubMed] [Google Scholar]
- 11. Poss KD. Examination of diverse physiological functions of mammalian heme oxygenases by gene targeting [Doctoral thesis]. Cambridge, MA: Department of Biology, Massachusetts Institute of Technology; 1998. p. 138. [Google Scholar]
- 12. Zhao H, Wong RJ, Kalish FS, Nayak NR, Stevenson DK. Effect of heme oxygenase-1 deficiency on placental development. Placenta. 2009;30(10):861–8. [DOI] [PMC free article] [PubMed] [Google Scholar]
- 13. Zhuang T, Zhang M, Zhang H, Dennery PA, Lin QS. Disrupted postnatal lung development in heme oxygenase-1 deficient mice. Respir Res. 2010;11(1):142. [DOI] [PMC free article] [PubMed] [Google Scholar]
- 14. Jain S, Nandi G, Choubey P, Rana M, Basu-Modak S. Determination and analysis of sex ratios in heme oxygenase 1 gene targeted mouse embryos. Birth Defects Res. 2023;115(2):179–87. [DOI] [PubMed] [Google Scholar]
- 15. Thaler MM, Gemes DL, Bakken AF. Enzymatic conversion of heme to bilirubin in normal and starved fetuses and newborn rats. Pediatr Res. 1972;6(3):197–201. [DOI] [PubMed] [Google Scholar]
- 16. Maines MD, Kappas A. Study of the developmental pattern of heme catabolism in liver and the effects of cobalt on cytochrome P-450 and the rate of heme oxidation during the neonatal period. J Exp Med. 1975;141(6):1400–10. [DOI] [PMC free article] [PubMed] [Google Scholar]
- 17. Lin JH, Villalon P, Nelson JC, Abraham NG. Expression of rat liver heme oxygenase gene during development. Arch Biochem Biophys. 1989;270(2):623–9. [DOI] [PubMed] [Google Scholar]
- 18. Sun Y, Rotenberg MO, Maines MD. Developmental expression of heme oxygenase isozymes in rat brain. Two HO-2 mRNAs are detected. J Biol Chem. 1990;265(14):8212–7. [PubMed] [Google Scholar]
- 19. Watanabe T, Hasegawa G, Yamamoto T, Hatakeyama K, Suematsu M, Naito M. Expression of heme oxygenase-1 in rat ontogeny. Arch Histol Cytol. 2003;66(2):155–62. [DOI] [PubMed] [Google Scholar]
- 20. Dennery PA, Lee CS, Ford BS, Weng YH, Yang G, Rodgers PA. Developmental expression of heme oxygenase in the rat lung. Pediatr Res. 2003;53(1):42–7. [DOI] [PubMed] [Google Scholar]
- 21. Zhao H, Wong RJ, Nguyen X, Kalish F, Mizobuchi M, Vreman HJ, Stevenson DK, Contag CH. Expression and regulation of heme oxygenase isozymes in the developing mouse cortex. Pediatr Res. 2006;60(5):518–23. [DOI] [PubMed] [Google Scholar]
- 22. Sambrook J, Russell DW. Molecular cloning: a laboratory manual. New York: Cold Spring Harbor Laboratory Press; 2001. p. 2344. [Google Scholar]
- 23. Orozco LD, Kapturczak MH, Barajas B, Wang X, Weinstein MM, Wong J, Deshane J, Bolisetty S, Shaposhnik Z, Shih DM, Agarwal A, Lusis AJ, Araujo JA. Heme oxygenase-1 expression in macrophages plays a beneficial role in atherosclerosis. Circ Res. 2007;100(12):1703–11. [DOI] [PubMed] [Google Scholar]
- 24. Zenclussen ML, Casalis PA, El-Mousleh T, Rebelo S, Langwisch S, Linzke N, Volk HD, Fest S, Soares MP, Zenclussen AC. Haem oxygenase-1 dictates intrauterine fetal survival in mice via carbon monoxide. J Pathol. 2011;225(2):293–304. [DOI] [PubMed] [Google Scholar]
- 25. Yoshida T, Sato M. Posttranslational and direct integration of heme oxygenase into microsomes. Biochem Biophys Res Commun. 1989;163(2):1086–92. [DOI] [PubMed] [Google Scholar]
- 26. Greene YJ, Healey JF, Bonkovsky HL. Immunochemical studies of haem oxygenase. Preparation and characterization of antibodies to chick liver haem oxygenase and their use in detecting and quantifying amounts of haem oxygenase protein. Biochem J. 1991;279(Pt 3):849–54. [DOI] [PMC free article] [PubMed] [Google Scholar]
- 27. Ishikawa K, Sato M, Yoshida T. Expression of rat heme oxygenase in Escherichia coli as a catalytically active, full-length form that binds to bacterial membranes. Eur J Biochem. 1991;202(1):161–5. [DOI] [PubMed] [Google Scholar]
- 28. Lin Q, Weis S, Yang G, Weng YH, Helston R, Rish K, Smith A, Bordner J, Polte T, Gaunitz F, Dennery PA. Heme oxygenase-1 protein localizes to the nucleus and activates transcription factors important in oxidative stress. J Biol Chem. 2007;282(28):20621–33. [DOI] [PubMed] [Google Scholar]
- 29. Waza AA, Hamid Z, Ali S, Bhat SA, Bhat MA. A review on heme oxygenase-1 induction: is it a necessary evil. Inflamm Res. 2018;67(7):579–588. [DOI] [PubMed] [Google Scholar]
- 30. Stec DE, Abraham NG. Pharmacological and clinical significance of heme oxygenase-1. Antioxidants. 2021;10(6):854. [DOI] [PMC free article] [PubMed] [Google Scholar]
- 31. Ryter SW. Heme oxygenase-1: an anti-inflammatory effector in cardiovascular, lung, and related metabolic disorders. Antioxidants. 2022;11(3):555. [DOI] [PMC free article] [PubMed] [Google Scholar]
- 32. Chen YH, Yet SF, Perrella MA. Role of heme oxygenase-1 in the regulation of blood pressure and cardiac function. Exp Biol Med. 2003;228(5):447–53. [DOI] [PubMed] [Google Scholar]
- 33. Hartsfield CL, McMurtry IF, Ivy DD, Morris KG, Vidmar S, Rodman DM, Fagan KA. Cardioprotective and vasomotor effects of HO activity during acute and chronic hypoxia. Am J Physiol Heart Circ Physiol. 2004;287(5):H2009–15. [DOI] [PubMed] [Google Scholar]
- 34. Patterson AJ, Zhang L. Hypoxia and fetal heart development. Curr Mol Med. 2010;10(7):653–66. [DOI] [PMC free article] [PubMed] [Google Scholar]
- 35. Sun Y, Maines MD. Heme oxygenase-2 mRNA: developmental expression in the rat liver and response to cobalt chloride. Arch Biochem Biophys. 1990;282(2):340–5. [DOI] [PubMed] [Google Scholar]
- 36. Intagliata S, Salerno L, Ciaffaglione V, Leonardi C, Fallica AN, Carota G, Amata E, Marrazzo A, Pittalà V, Romeo G. Heme oxygenase-2 (HO-2) as a therapeutic target: activators and inhibitors. Eur J Med Chem. 2019;183:111703. [DOI] [PubMed] [Google Scholar]
- 37. Sugiyama D, Inoue-Yokoo T, Fraser ST, Kulkeaw K, Mizuochi C, Horio Y. Embryonic regulation of the mouse hematopoietic niche. Sci World J. 2011;11:1770–80. [DOI] [PMC free article] [PubMed] [Google Scholar]
- 38. Fraser ST, Midwinter RG, Berger BS, Stocker R. Heme oxygenase-1: a critical link between iron metabolism, erythropoiesis, and development. Adv Hematol. 2011;2011:473709. [DOI] [PMC free article] [PubMed] [Google Scholar]
- 39. Fraser ST, Midwinter RG, Coupland LA, Kong S, Berger BS, Yeo JH, Andrade OC, Cromer D, Suarna C, Lam M, Maghzal GJ, Chong BH, Parish CR, Stocker R. Heme oxygenase-1 deficiency alters erythroblastic island formation, steady-state erythropoiesis and red blood cell lifespan in mice. Haematologica. 2015;100(5):601–10. [DOI] [PMC free article] [PubMed] [Google Scholar]
- 40. Wu J, Li S, Li C, Cui L, Ma J, Hui Y. The non-canonical effects of heme oxygenase-1, a classical fighter against oxidative stress. Redox Biol. 2021;47:102170. [DOI] [PMC free article] [PubMed] [Google Scholar]
- 41. El-Brolosy MA, Stainier DYR. Genetic compensation: a phenomenon in search of mechanisms. PLoS Genet. 2017;13(7):e1006780. [DOI] [PMC free article] [PubMed] [Google Scholar]