

Abstract
Background
In recent years, there has been increasing interest in resting state fMRI (rsfMRI)-based brain entropy (BEN) as a unique tool to characterize brain activity. While previous studies have indicated that rsfMRI-based BEN might be correlated with cognition, it remains unclear whether and to what extent BEN is influenced by other factors that typically affect brain activity measured by fMRI.
Purpose
To investigate the relationship between BEN and physiological indices, including respiratory rate (RR), heart rate (HR), systolic blood pressure (s-BP), and body mass index (BMI), and to investigate whether and to what extent the relationship between BEN and cognition is influenced by physiological variables.
Study type
Retrospective.
Subjects
1206 healthy subjects (mean age: 28.83 +/− 3.69 years; 550 male) with rsfMRI datasets selected from the Human Connectome Project (HCP).
Field strength/Sequence
Multiband echo planar imaging (EPI) sequence at 3.0 Tesla.
Assessment
Neurocognitive, physical health (RR, HR, s-BP, BMI), and rsfMRI data were retrieved from the HCP datasets. Neurocognition was measured through the total cognition score (TCC) provided by HCP. BEN maps were calculated from rsfMRI data.
Statistical tests
All physiological and cognitive associations of BEN were assessed with multiple regression.
Results
Using a statistical significance threshold of pheight-family wise error (FWE)<0.05 or pcluster-FWE<0.05, no significant BEN vs HR association was identified. Under the threshold, BEN was negatively associated with RR and positively associated with both s-BP and BMI in posterior brain regions and areas overlapping with the default mode network (DMN). Physiological factors had minor to moderate spatially localized influence on the association between BEN and cognition. After controlling the physiological effects, BEN still showed regional correlations with total cognition, including negative correlations in the fronto-parietal cortex and positive correlation in the sensorimotor system (motor network and the limbic system).
Data conclusions
RR negatively affects rsfMRI-derived BEN, while s-BP positively affects BEN. The positive associations between BEN and cognition in the motor network and the limbic system might indicate a facilitation of information processing in the sensorimotor system.
Keywords: Brain entropy, resting state fMRI, cognition, body mass index, blood pressure, respiratory rate
Introduction
Entropy is a physical measure indicating either the degree of disorder and randomness (1) or the number of accessible micro-states of a system in the fields of thermodynamics and statistical mechanics, respectively. In information theory, entropy refers to the amount of information in a system (2). Artificial and biological systems tend towards a high entropy state, and this tendency needs to be counteracted at the expense of energy in order to preserve the information content at a high level (3). Crucially, a number of studies have suggested that during normal waking consciousness the brain behaves like a self-organized system (4) with characteristics of criticality (5, 6) that are maintained through a regular input of energy and an extended capacity for entropy suppression (7).
In recent years, there has been growing interest in brain entropy (BEN), as a tool to characterize the brain activity measured by neuroimaging techniques, in particular resting-state fMRI (rsfMRI) (8). A recent study has shown that rsfMRI-derived BEN is correlated with cognition (9). In particular, lower BEN in part of the executive control network (ECN) and default mode network (DMN) has been associated with higher fluid intelligence as well as better performance during working memory, language, and relational tasks (9). Importantly, it has been suggested that BEN is largely independent of other metrics related to brain activity, such as cerebral blood flow and fractional amplitude of low frequency fluctuations (fALFF) (10), hence may potentially represent a unique signature of brain activity. However, whether and to what extent BEN measures are influenced by other variables that have consistently been reported to affect brain activity, such as physiological indices and body mass index (BMI), remains unclear. Blood oxygen level dependent (BOLD) signal as measured by fMRI is a combination of cerebral blood flow, cerebral blood volume, and oxygen consumption rate which are affected by RR, HR, BP, and BMI (11). Studies have shown that these physiological confounds may lead to BOLD signal fluctuations that can be mistaken for neuronally-driven changes (12–14). Moreover, BMI has been reported to impact task-induced brain activity (15), cerebral blood flow (16), and resting-state functional connectivity (rs-FC) of both the DMN and ECN (17, 18).
BEN is calculated using the sample entropy (SampEn), which enables estimation of the randomness of the brain activity at rest based on how often different patterns of brain activity are found in the BOLD signal time-series (8). Importantly, normal brain activity is characterized by long-range temporal correlations (LRTC) (19) of which BEN represents an indirect measure, meaning that high BEN values indicate independence between the data, a low number of repeated patterns and randomness, while low BEN values indicate persistence, repetition, and predictive behavior. Since RR and HR related physiological signal components have been suppressed from the Human Connectome Project (HCP) rsfMRI data used in this study during preprocessing (20) and our previous study had demonstrated the neuronal nature of BEN derived from these preprocessed data, we predicted that BEN, as well as its association with cognition, would not be substantially influenced by these variables. On the other hand, the effect of BP on BOLD signal has not been removed from the HCP data during preprocessing, and hence we expect that the rsfMRI derived BEN might be affected by BP. Moreover, since BMI effects cannot be excluded during preprocessing and previous studies have shown that BMI is broadly associated with brain activity, and in particular with rs-FC of ECN and DMN (17, 18), we hypothesized that BMI would be related with BEN to some extent.
Thus the aim of this study was to investigate whether and how rsfMRI-derived BEN was affected by physiological variables, including RR, HR, BP, and BMI using the data provided by the WU-Minn Human Connectome Project (HCP) (21). A further aim was to examine whether accounting for physiological confounds influenced the association between BEN and cognition.
Materials and methods
Informed consent
Data acquisition and sharing have been approved by the HCP parent IRB. Written informed consent forms were obtained from all subjects before any experiments. This study re-analyzed the HCP data and Data Use Terms were signed and approved by the WU-Minn HCP Consortium. Data re-analysis has been approved by UMB IRB.
Data and BEN mapping
rsfMRI data, demographic data, physical health data, and behavioral data from 1206 healthy young participants (mean age = 28.83 ± 3.69 years; mean education = 14.86 ± 1.81 years; males/females = 550/656) were downloaded from HCP. Data were released on July 21, 2017. Participants had undergone two resting-state sessions (Rest1 and Rest2) acquired in two days, each including two runs. Each run was acquired using the same multi-band sequence (22) and included 1200 timepoints. In order to compensate for image distortions induced by the long scan time, readout direction was from left to right for the first run of each session (Rest1 LR and Rest2 LR), and from right to left for the second run of each session (Rest1 RL and Rest2 RL). Other acquisition parameters included: repetition time (TR) = 720ms, echo time (TE) = 33.1ms, resolution = 2×2×2mm3. To investigate whether the artifact removal procedure applied during the HCP preprocessing pipeline would reduce or remove the variability associated with RR, HR, BP, and BMI, two types of rsfMRI data were downloaded: minimally preprocessed (m-rsfMRI) and fully preprocessed rsfMRI (f-rsfMRI) data. The minimal preprocessing pipeline included correction for spatial distortions, head motion, and B0 distortions, registration to T1-weighted structural images, normalization to MNI space, global intensity normalization, and masking out non-brain voxels (23). The full preprocessing pipeline was applied to remove confounds and non-neuronal artifacts (including physiological signals) and included high-pass temporal filtering and independent component analyses (ICA)-based artifact removal (20, 23). Normalized m-rsfMRI and f-rsfMRI were downloaded and smoothed using fslmath provided by FSL (https://fsl.fmrib.ox.ac.uk/fsl/fslwiki/) with a Gaussian filter with full-width-at-half-maximum (FWHM) = 2.5 mm.
BEN maps were calculated for m-rsfMRI and f-rsfMRI datasets for each run in each scan session with the BEN mapping toolbox (BENtbx) (8). Briefly, entropy values were calculated using the SampEn formula, which is the logarithmic likelihood that a small section (within a window of length ‘m’) of the data that “matches” with other sections will still “match” the others if the section window length increases by 1. “Match” is defined by a threshold of r times standard deviation of the entire time series. Window length m is widely set to be from 2 to 3 (8). The embedding vector matching cut-off should be selected to avoid “no matching” (when it is too small) and “all matching” (when it is too big) (24). Based on previous publications (8), a window length of 3 and a cut-off threshold of 0.6 were adopted in this study (8). After entropy calculation, outliers were identified by calculating the mean BEN of each subject, and participants with mean BEN above |3| standard deviations from the group average were excluded. This procedure was repeated for each of the four runs separately. Participants were excluded if they were identified as outliers either in the m-rsfMRI or f-rsfMRI BEN maps. Then, BEN maps were smoothed with a FWHM Gaussian filter of 4 mm to further mitigate between subject mis-registration after image normalization. A scheme of the BEN calculation process is reported in Figure 1 (further information about BEN mapping procedure can also be found in (8)).
Figure 1.
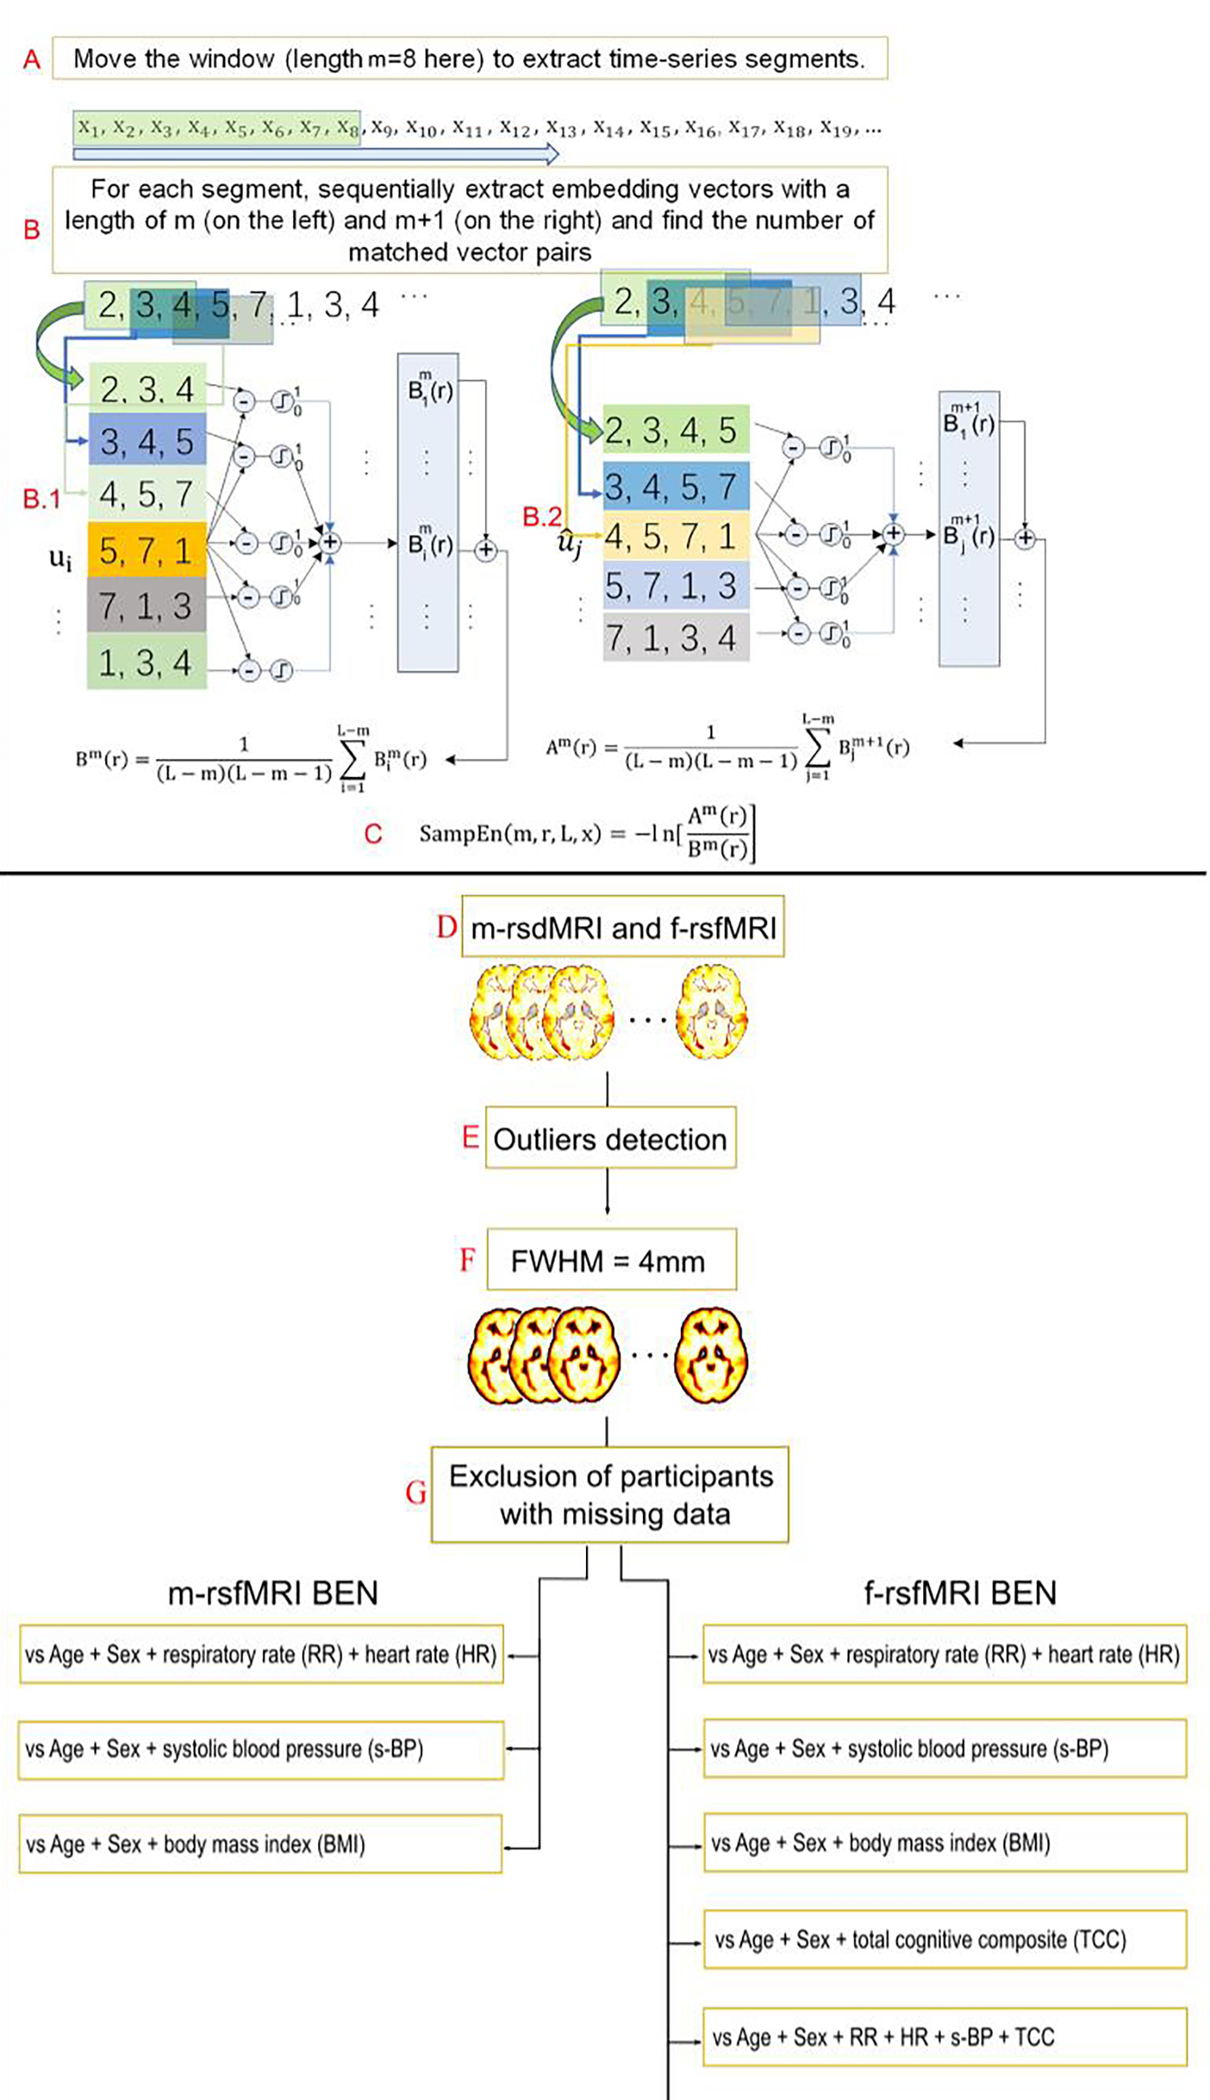
Scheme of the brain entropy (BEN) calculation adapted from (9). (A) A time window is used to extract a sub-time series at m successive timepoints (m = 8 here) from the original time series. (B) The embedding vector matching process is performed for the embedding window length of m (B.1) and m + 1 (B.2). (C) Sample entropy (SampEn) is calculated as the natural logarithm of the ratio between the total number of matches of the window length m and that of the window length of m+1. BEN maps were calculated using minimally and fully preprocessed resting state fMRI data (respectively m-rsfMRI and f-rsfMRI) (D). Participants with mean BEN > |3| standard deviations from the group average were identified as outliers and excluded from the sample (E). BEN maps were smoothed with a with full-width-at-half-maximum (FWHM) filter of 4 mm (F), and participants with missing behavioral data were excluded from analyses (G). BEN maps were entered as the dependent variable in multiple regression models to investigate the relationship between BEN and respiratory rate (RR), heart rate (HR), systolic blood pressure (s-BP), body mass index (BMI), and total cognitive composite (TCC) scores.
Physiological indices and BMI
The following measures were obtained from the HCP data: BMI (calculated by dividing participants’ weight in kg by the square of their height in meters), systolic BP (s-BP), and diastolic BP (d-BP). These data were collected in Day 1 of the rsfMRI experiment.
RR and HR were calculated separately using the following steps. HCP provided a text file for each rsfMRI scan session. The second and the third column within the file are the respiratory and cardiac recordings. Signal sampling rate was 400 Hz, which is roughly 288 times faster than the sampling rate of rsfMRI. Both time series were low pass filtered with a cutoff of 5 Hz and 10 Hz for the respiration and cardiac data, respectively. Local maxima were then detected using Matlab (Mathworks, Natick, Massachusetts, United States) function islocalmax (Matlab 2021b). The first derivative of the time stamps of the local maxima was calculated. The rmoutliers function of Matlab was used to remove outlier peak to peak time differences. The remaining time differences of each recording were averaged and considered to be the respiration cycle and heart beat cycle, respectively. Subjects were excluded from the following analyses if their final mean respiration cycle was longer than 10 secs or if the heart beat cycle was longer than 4 secs.
Cognition
The HCP protocol includes a broad assessment of participants’ cognitive abilities using the NIH Toolbox Cognition Battery (25). In particular, the following cognitive domains were evaluated: language, executive function, episodic memory, processing speed, and working memory. Each domain was assessed using specific tasks (26), including Picture Vocabulary Test (language – vocabulary), Oral Reading Recognition Test (language – reading decoding), Dimensional Change Card Sort Test (executive function – cognitive flexibility), Flanker Inhibitory Control and Attention Test (executive function – inhibitory control and attention), Picture Sequence Memory Test (episodic memory), Pattern Comparison Processing Speed Test (processing speed), and List Sorting Working Memory Test (working memory) (26). Participants’ scores for the individual tasks were averaged to obtain three composite scores: fluid cognition composite, crystallized cognition composite, and total cognition composite (TCC). The fluid cognition composite assessed processing speed, memory, and executive functions, whereas the crystallized cognition composite evaluated language and verbal skills. The TCC was obtained by combining the fluid and crystallized cognition composites (26). Since age is a covariate in the subsequent statistical analyses, the age-unadjusted TCC scores were adopted in this study.
Statistical analysis
Before statistical analyses, Pearson’s correlation coefficients (r) between s-BP and d-BP and between BP and BMI (27) were calculated in order to detect and eliminate highly correlated measures.
Statistical analyses were performed for each rsfMRI run separately, and participants with any missing data (including TCC, RR, HR, s-BP, and BMI) were excluded from the sample. The final sample size, including participants excluded during the outlier detection procedure, was: 940 participants for Rest1 LR; 960 participants for Rest1 RL; 901 participants for Rest2 LR; 903 participants for Rest2 RL. Note that not all participants completed all rsfMRI runs, therefore the sample size of each run is slightly different. Analyses were performed with SPM12 (https://www.fil.ion.ucl.ac.uk/spm/software/spm12/) using multiple regression. Specifically, a separate multiple regression model was built for each scan session using BEN maps from all subjects as the dependent variable. In each model, age and sex were included as covariates. Results were thresholded at pheight<.05 and corrected for multiple comparisons using the family-wise error (FWE) rate.
The effect of RR and HR on BEN was tested using BEN maps derived from m-rsfMRI and f-rsfMRI separately. Using the same procedure, the BEN vs s-BP and BEN vs BMI relationships were explored with two separate multiple regression models. Finally, the BEN vs TCC relationship was investigated with two multiple regressions using only BEN maps derived from f-rsfMRI data. In the first one, only the TCC was included in the model. In the second, RR, HR, and s-BP were added as covariates. A summary of the multiple regression models is reported in Figure 1 (lower panel).
Results
There were no significant associations between HR and BEN using m-rsfMRI or f-rsfMRI data (all pheight>.05). On the other hand, RR was negatively associated with BEN. Specifically, in the m-rsfMRI data higher RR was mainly related to lower BEN in cerebellar and ventral occipital and temporal regions, with smaller clusters in frontal, temporal, and parietal regions (Figure 2a–d). Using f-rsfMRI data, the effect of RR was much reduced, although residual effects were still detected in the cerebellum, subcortical regions (e.g., amygdala, putamen, caudate, thalamus), insula, frontal and parietal cortex, and insula (Figure 2e–h).
Figure 2.
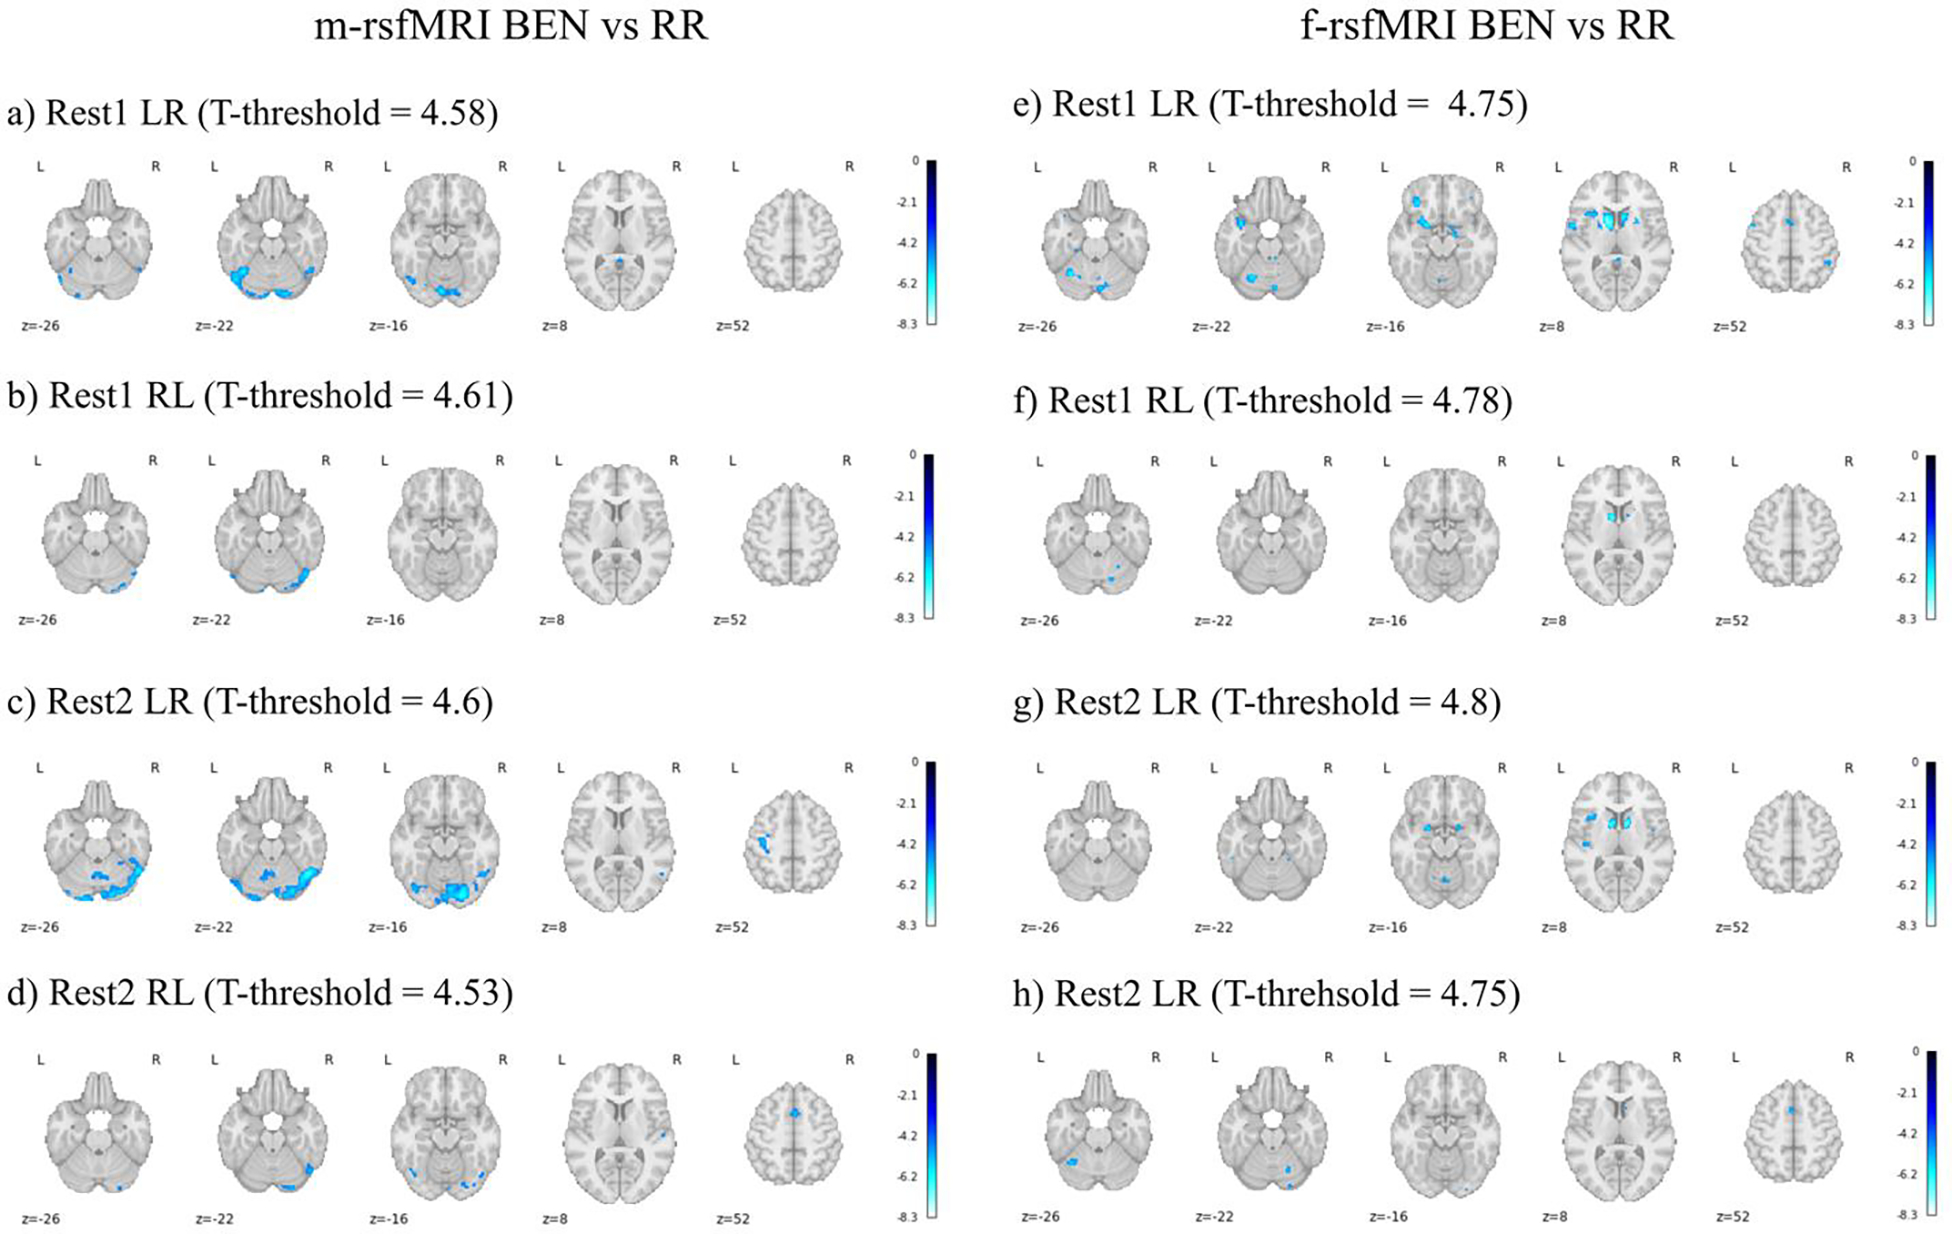
Brain entropy (BEN) vs respiratory rate (RR) using minimally preprocessed rsfMRI data (m-rsfMRI) (a-d) and fully preprocessed rsfMRI data (f-rsfMRI) (e-h). Age, sex, and heart rate were included as covariates in all models. Results are reported for Rest1 LR (a, e), Rest1 RL (b, f), Rest2 LR (c, g), and Rest2 RL (d, h). The T-threshold is reported for each analysis. Colormap intensity is based on T-values. The colormap limits have been set as the highest T-value found across all analyses. Negative values indicate a negative association between BEN and RR.
s-BP was positively correlated with increased BEN in the cerebellum, occipital cortex, precuneus/posterior cingulate cortex, middle cingulate cortex, superior and inferior parietal lobules (i.e., angular and supramarginal gyri), pre and postcentral gyri, and temporal cortex (Figure 3). In the first two runs, the effect of s-BP on BEN was more extended for the f-rsfMRI (Figure 3e, f) compared to the m-rsfMRI (Figure 3a, b) data. Moreover, note that significant clusters were more extended in the first two runs (Figure 3a–f).
Figure 3.
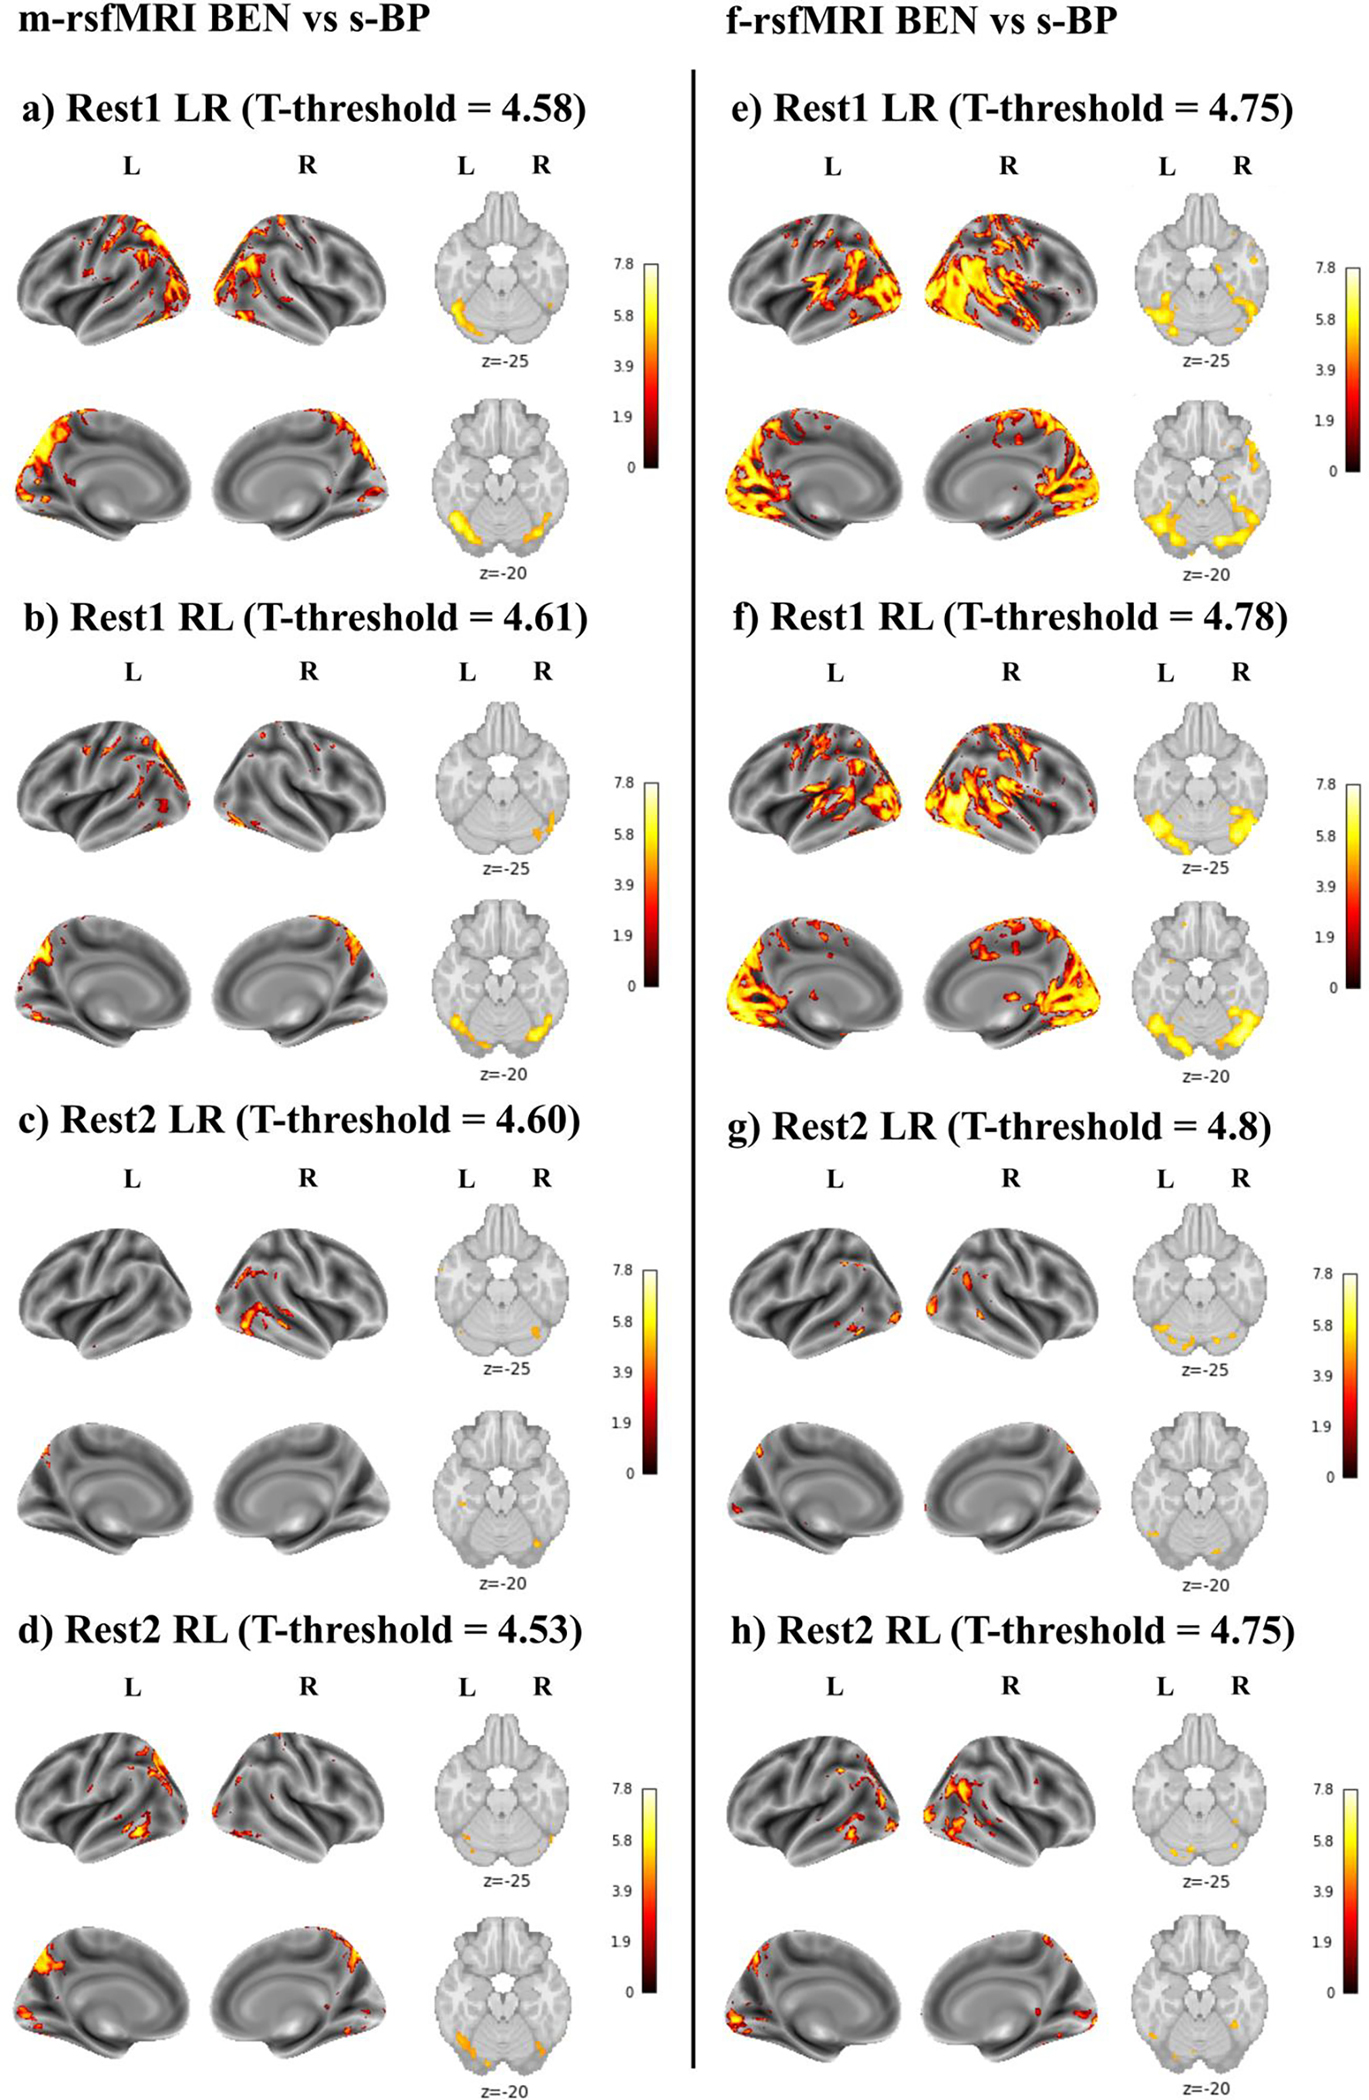
Brain entropy (BEN) vs systolic blood pressure (s-BP) using minimally preprocessed rsfMRI data (m-rsfMRI) (a-d) and fully preprocessed rsfMRI data (f-rsfMRI) (e-h). Results are reported for Rest1 LR (a, e), Rest1 RL (b, f), Rest2 LR (c, g), and Rest2 RL (d, h). The T-threshold is reported for each analysis. Colormap intensity is based on T-values. The colormap limits have been set as the highest T-value found across all analyses. Positive values indicate a positive association between BEN and s-BP and between BEN and BMI.
BMI was positively correlated with BEN (Figure 4). This relationship did not appear to be affected by the minimal (Figure 4a–d) or full (Figure 4e–h) preprocessing pipeline. Overall, these results showed higher consistency across the four runs, indicating that higher BMI was associated with increased BEN in the cerebellum, occipital cortex, superior and inferior parietal lobules, precuneus/posterior cingulate cortex, posterior lateral and ventral temporal lobes, and medial and dorsolateral prefrontal cortex.
Figure 4.
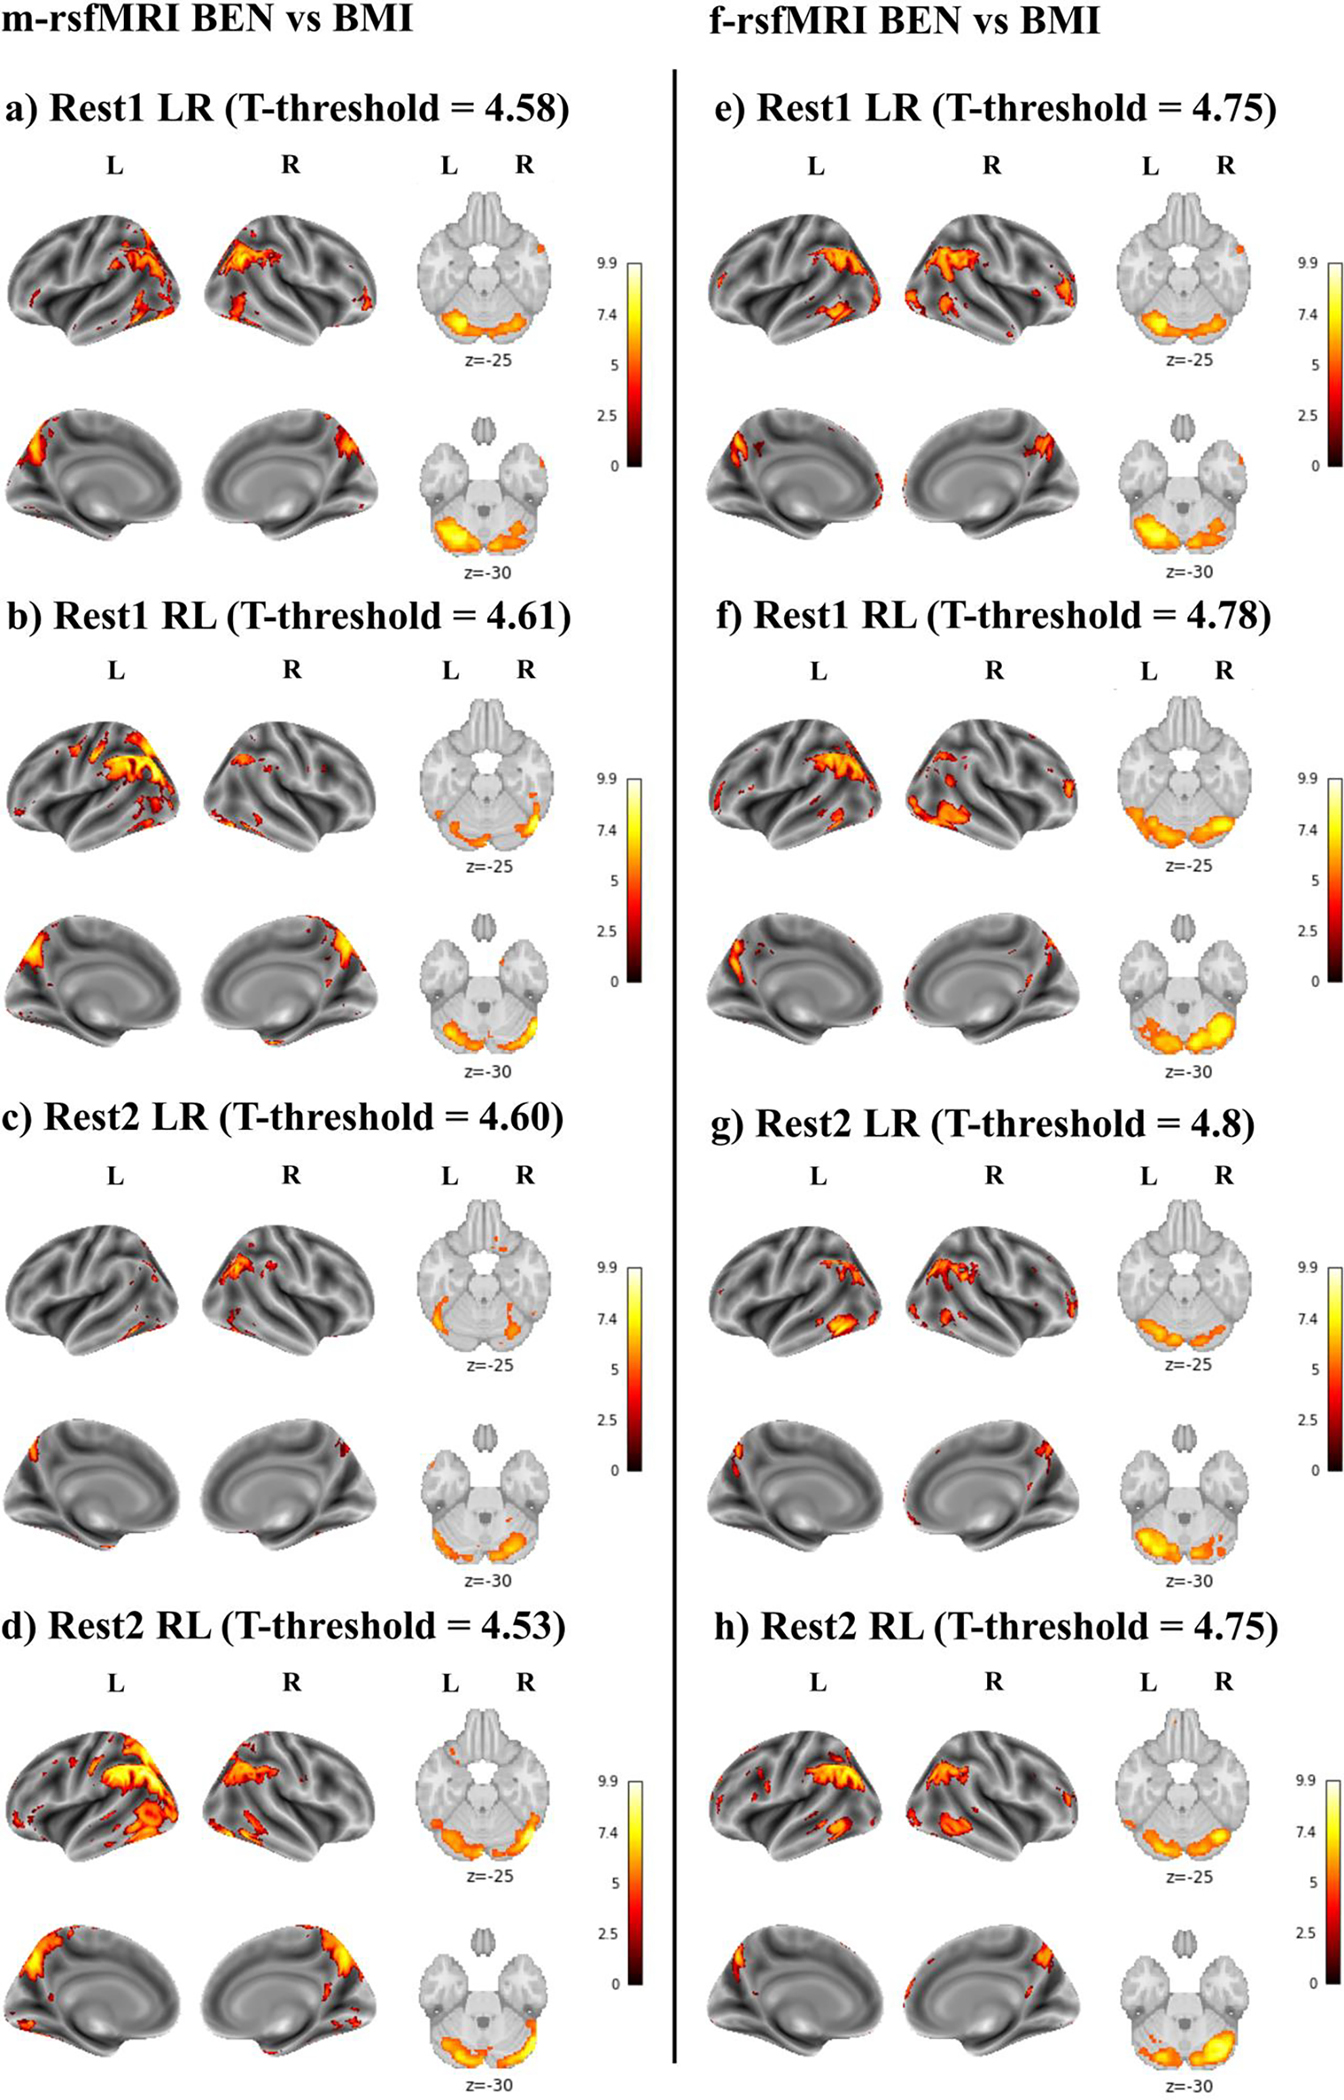
Brain entropy (BEN) vs body mass index (BMI) using minimally preprocessed rsfMRI data (m-rsfMRI) (a-d) and fully preprocessed rsfMRI data (f-rsfMRI) (e-h). Results are reported for Rest1 LR (a, e), Rest1 RL (b, f), Rest2 LR (c, g), and Rest2 RL (d, h). The T-threshold is reported for each analysis. Colormap intensity is based on T-values. The colormap limits have been set as the highest T-value found across all analyses. Positive values indicate a positive association between BEN and s-BP and between BEN and BMI.
When exploring the association between BEN and TCC, only a few small clusters survived to a p-FWEheight<.05 threshold. Since applying such a stringent threshold might prevent us from detecting significant associations between BEN and cognition, for these analyses results were thresholded at p-uncorrectedheight<.001 and p-FWEcluster<.05.
For the first three runs, negative associations between TCC and BEN were detected with and without including physiological indices as covariates (Figure 5a–c, 5e–g). Specifically, higher TCC was associated with lower BEN in the cerebellum, precuneus/posterior cingulate cortex, inferior parietal lobule, middle and superior temporal gyri, and dorsolateral prefrontal cortex. In addition, in the first (Figure 5a, e) and third (Figure 5c, g) runs BEN was positively associated with TCC in the cerebellum, left orbital frontal cortex and subcortical regions. Including physiological indices as covariates confirmed these positive correlations, with additional clusters displayed in the pre- and postcentral gyri.
Figure 5.
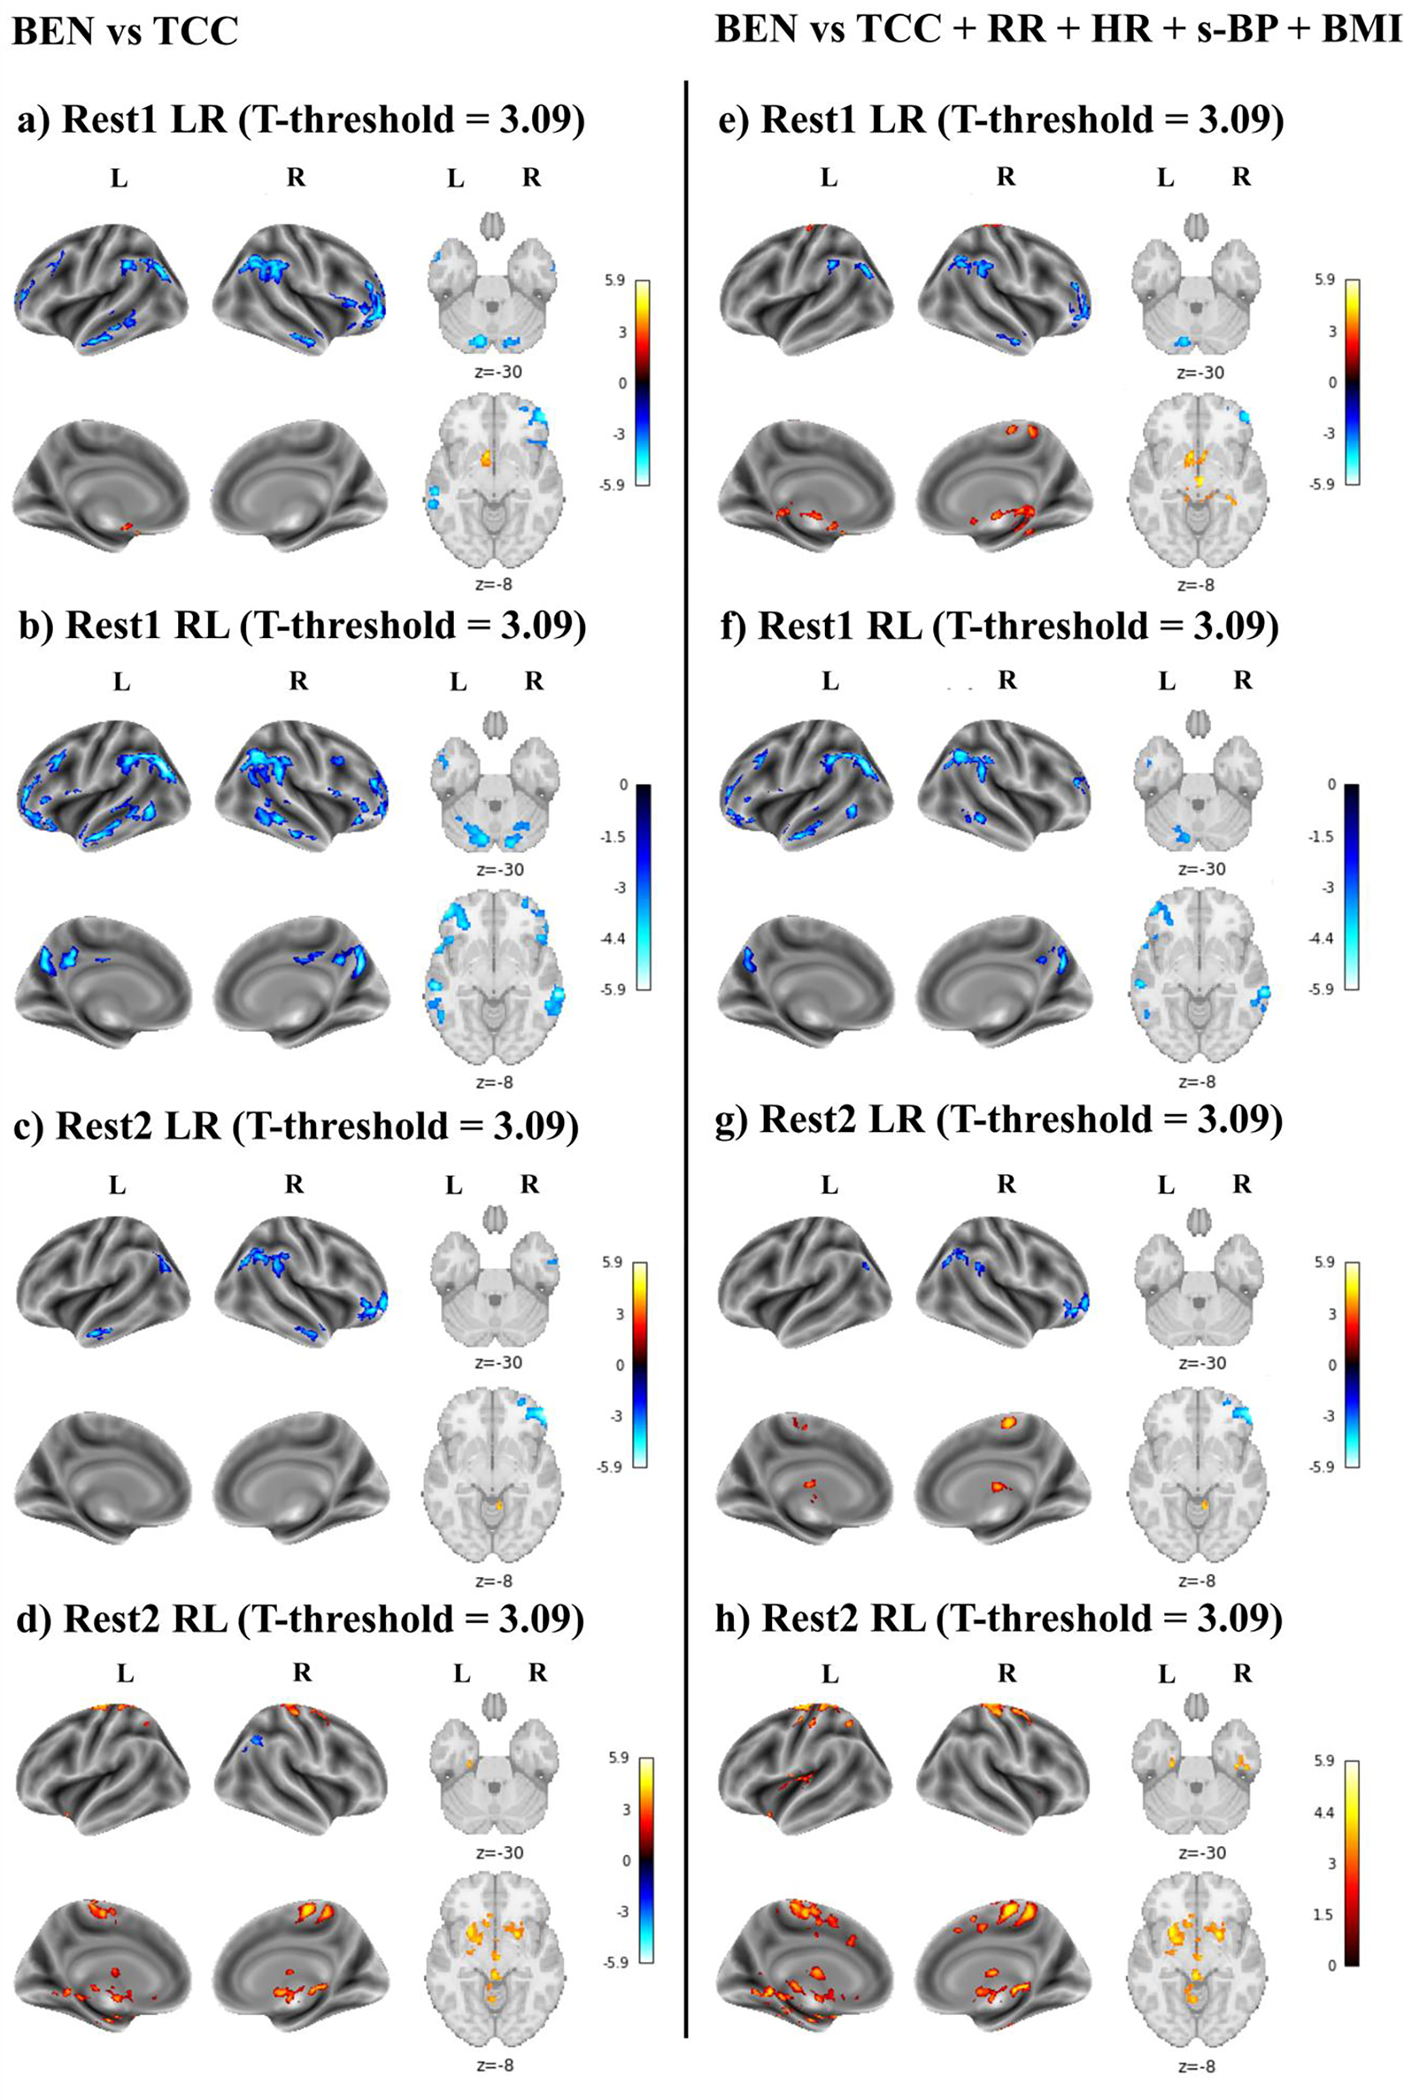
Brain entropy (BEN) vs total cognitive component (TCC). This association was first tested including only TCC in the model (a-d), and then adding respiratory rate (RR), hearth rate (HR), and systolic blood pressure (s-BP) as covariates (e-h). Age and sex were included as covariates in all models. Results are reported for Rest1 LR (a, e), Rest1 RL (b, f), Rest2 LR (c, g), and Rest2 RL (d, h). The T-threshold is reported for each analysis. Colormap intensity is based on T-values. The colormap limits have been set as the highest T-value found across all analyses. Positive values indicate a positive association between BEN and TCC, whereas negative values indicate a negative association between BEN and TCC.
In the last run (Figure 5d), a negative association between BEN and TCC was detected only in the right inferior parietal lobule when physiological indices were not included in the model. Moreover, a broad positive relationship between BEN and TCC was displayed in the left and right pre- and postcentral gyri, subcortical regions, insula, brain stem, and ventral temporal cortex. A similar pattern was observed when including RR, HR, and s-BP as covariates (Figure 4h).
Discussion
In this study, we investigated whether BEN was affected by physiological variables and BMI. Physiological indices considered included RR, HR, s-BP, and d-BP. In addition, we explored the relationship between BEN and cognition and tested whether this relationship was influenced by physiological variables.
To investigate whether the ICA-based artifact removal procedure applied during the full preprocessing pipeline (20) would reduce or remove the effects of HR and RR on BEN, the association between these physiological confounds and BEN was tested using m-rsfMRI and f-rsfMRI data separately. For both types of rsfMRI data, we did not observe a significant effect of HR on BEN. On the other hand, higher RR was mainly associated with lower BEN in the cerebellum and ventral occipital/temporal cortex when using minimally preprocessed data. Artifact removal systematically reduced the effect of RR on BEN, although statistically significant residual effects were still present. Intriguingly, we found a regional rather than a global effect of RR on BEN, suggesting that in most parts of the brain, entropy of resting state activity was not affected by respiration. Because the BEN vs RR associations were examined using linear regression, no effects in most of the brain may also suggest that the respiratory effects, if existing, are highly nonlinear and not detectable by linear regression. Additionally, these findings indicate that longer respiration cycles (corresponding to higher RR measured in secs) contributed more low frequency fluctuations to both minimally and fully preprocessed rsfMRI data and resulted in lower BEN. There are several ways in which the respiratory process can introduce noise into fMRI time series. For instance, through thoracic and abdominal movements associated with respiration, or by directly modulating deoxyhemoglobin concentrations and the levels of carbon dioxide (CO2) (12, 28). Overall, our results suggest that the respiratory process, and in particular RR, might affect regional BEN. As we discussed above, the regional effects of RR on BEN suggested no effects, or no linear effects, of RR in most parts of the brain. If that is the case, including RR as a covariate will not affect results in regions showing no linear RR effects.
s-BP was positively correlated with BEN in the cerebellum, occipital cortex, superior and inferior parietal lobules, precuneus/posterior cingulate cortex, pre and postcentral gyri, and temporal regions. This effect was more extended in the first two (i.e., Rest1 LR and Rest1 RL) compared to the last two (i.e., Rest2 LR and Rest2 RL) runs. Since BP was collected on Day 1 together with the first two rsfMRI runs, this discrepancy may be related to day-to-day BP fluctuations (29). Oscillation in BP has repeatedly been reported to influence BOLD signal (13, 14), and our results suggest that they might also affect BEN measures. However, it is worth noting that altered brain activity at rest, task-related brain activity, and cerebral blood flow have been found in the visual occipital, sensorimotor, and dorsal attention networks in hypertensive patients compared to healthy controls (30, 31). Moreover, BP is directly correlated with BMI (27), and the BEN of some regions, including precuneus and inferior parietal lobules, was positively associated with both s-BP and BMI. In more detail, BMI was broadly and directly correlated with BEN in the left and right cerebellum, occipital cortex, inferior parietal lobules, precuneus/posterior cingulate cortex, posterior lateral and ventral temporal lobes as well as the medial and dorsolateral prefrontal cortex. Crucially, many of these regions are considered key components of the DMN (32), and previous findings suggest that higher BMI may be associated with lower rs-FC within this network in young (17) and older adults (33).
Based on the above literature, we speculate that a positive association between BMI and BEN in these regions could be indicative of changes in rsFC within the DMN. Moreover, based on a previous study showing that lower BEN in the DMN is associated with higher fluid intelligence and better performance in several neurocognitive tasks (9), we should expect that increased BEN of DMN in individuals with high BMI would be correlated with worse cognitive performance. While testing this hypothesis was beyond the aim of this study, it should be noted that higher BMI and lower mean functional connectivity of the posterior DMN have been correlated with worse performance in the executive domain in older adults (33). Moreover, obese individuals (BMI > 30) have repeatedly been reported to perform worse in executive tasks (34). For instance, obese compared to healthy individuals drawn from the same HCP sample examined in this study showed impaired performance in several cognitive domains including not only executive functions, but also attention and memory (35). In the same study, obese individuals compared to controls showed worse performance in a working memory fMRI task, and this difference was associated with reduced deactivation of task-negative brain regions included in the DMN (e.g., medial prefrontal cortex, posterior cingulate gyrus) (35). As a collateral finding of their analyses, the authors also suggested that inadequate or inefficient suppression of DMN may underpin impaired behavioral performance on multiple cognitive tasks in obese individuals (35). Likely, our findings of positive DMN BEN vs BMI associations might suggest that higher BEN of DMN measured during resting-state would be related to reduced suppression of this network during task-induced brain activity in individuals with high BMI. Moreover, based on evidence of positive correlation between BP and BMI (27) and lower cognitive performance in individuals with high BP (36, 37), we speculate that our results on BP and BMI might reflect a broader metabolic condition (e.g., risk factors of metabolic syndrome) (38) possibly associated with altered brain functioning and impaired cognitive performance. Future studies will be necessary to either corroborate or reject these hypotheses.
Finally, we examined the relationship between BEN and cognition adopting the TCC as a measure of general cognitive ability. In the first three runs, TCC was negatively correlated with BEN in the precuneus/posterior cingulate cortex, inferior parietal lobule (i.e., angular and supramarginal gyrus), middle and superior temporal gyri, cerebellum, and dorsolateral prefrontal cortex. This pattern was observed independent of the inclusion of physiological indices as covariates. In addition, the first and third runs were characterized by positive correlations between BEN and TCC in the cerebellum, left orbital frontal cortex and subcortical regions. Positive associations were confirmed when physiological confounds were entered into the model, with additional clusters emerging in the pre- and postcentral gyri. The last run was mainly characterized by positive associations between TCC and BEN in the left and right pre- and postcentral gyri, subcortical regions, insula, brain stem, and ventral temporal cortex. This pattern was similarly observed whether or not physiological confounds were included as covariates. The negative association between BEN and TCC reported in this study is consistent with (9), where BEN in temporal and fronto-parietal regions was proposed to represent an indirect proxy of brain reserve, meaning that lower BEN (i.e., higher LRTC) indicates higher brain reserve and fluid intelligence. We should note here that the group of brain areas whose BEN was negatively associated with cognition largely overlaps with the regions whose BEN was positively associated with BMI, which would be consistent with our hypothesis that increased BEN in the DMN of individuals with high BMI reflects reduced cognitive performance. However, the positive BEN vs TCC associations observed in this study seem to be inconsistent with this hypothesis. In this regard, we should note that the spatial locations are different: the positive cognitive correlations in the current study were in the limbic and sensorimotor system, while the negative cognitive correlations reported in this study and in (9) were found in the DMN and ECN. The high sensorimotor entropy finding is consistent with the low motor network Hurst exponent (meaning high randomness). High entropy means high irregularity and high information content (2), and the sensorimotor network needs that to extensively interact with environment which might have played a beneficial role for the survival of the human species, enabling a better adjustment in a constantly changing and unpredictable environment (39, 40). Therefore, the positive association between BEN and cognition reported in this study might reflect a facilitation of information processing in the regions described above (10). Differences in the tasks adopted to assess cognition might also partially explain this discrepancy between our study and previous findings (9). Indeed, in (9) the Penn Matrix Test was adopted as an index of fluid intelligence, and performance during on-magnet fMRI tasks was used to assess working memory, language, and relational domains. On the other hand, in the current study the TCC, which summarizes performance of both fluid and crystallized intelligence tests in a single score, was used as an index of general cognitive ability. In addition, we point out that these results were not completely consistent across runs. A possible reason for these discrepancies is that in the HCP, the brain activity and cognitive assessment were not acquired at the same time. The unsynchronized potential fluctuations of both measures could potentially contribute to the observed BEN vs TCC correlation discrepancy across time (four runs, two at each of the two scan days). Overall, the results reported in the current study suggest that accounting for physiological confounds might have a minor, although statistically significant, influence on the association between BEN and cognition. Moreover, these findings expand our previous work, suggesting that low BEN in temporal and fronto-parietal areas and high BEN in the motor network as well as the limbic system are associated with high cognitive capacity.
Limitations
One limitation of this work was that the observed effects were not stable across the four different rsfMRI scans. For the physiological associations, the variabilities suggest that the physiological influence on BEN may vary across time and brain regions. For the cognitive associations, the variability might be partially contributed by the time difference between imaging and the cognitive assessment. Another limitation was that the rsfMRI data were from young healthy adults. The observed BEN vs physiology and BEN vs total cognition associations may differ in aging population or individuals with various diseases.
Conclusion
Regional BEN was negatively associated with RR, and accounting for physiological variables during preprocessing reduces but not eliminates this relationship. Moreover, BEN of posterior brain regions as well as pre- and postcentral gyri was positively associated with s-BP, while BEN of the DMN was positively related with BMI. We found both negative and positive association between BEN and cognition after accounting for physiological influences. While the first are consistent with previous findings, the positive associations in the motor network and the limbic system provide novel insights, suggesting that a facilitation of information processing in the sensorimotor system might be associated with higher cognitive ability.
Acknowledgments
Both imaging and behavior data were provided by the Human Connectome Project, WU-Minn Consortium (Principal Investigators: David Van Essen and Kamil Ugurbil; 1U54MH091657) funded by the 16 NIH Institutes and Centers that support the NIH Blueprint for Neuroscience Research; and by the McDonnell Center for Systems Neuroscience at Washington University in St. Louis. Data and/or research tools used in the preparation of this manuscript were obtained from the National Institute of Mental Health (NIMH) Data Archive (NDA). NDA is a collaborative informatics system created by the National Institutes of Health to provide a national resource to support and accelerate research in mental health. Dataset identifier(s): [NIMH Data Archive Digital Object Identifier 10.15154/1526336]. This manuscript reflects the views of the authors and may not reflect the opinions or views of the NIH or of the Submitters submitting original data to NDA. The authors thank the Human Connectome Project for open access to its data.
Grant support
This work was supported by NIH grants: R01AG060054, R01AG070227, R01EB031080-01A1, R21AG082345, P41EB029460-01A1 and by the University of Maryland Baltimore, Institute for Clinical & Translational Research (ICTR) through the NIH grant: 1UL1TR003098.
References
- 1.Clausius: Über die Wärmeleitung gasförmiger Körper. Ann Phys 1865; 125:353–400. [Google Scholar]
- 2.Shannon CE: A Mathematical Theory of Communication. Bell System Technical Journal 1948; 27:379–423. [Google Scholar]
- 3.Morowitz HJ: Energy Flow in Biology; Biological Organization as a Problem in Thermal Physics. Academic Press; 1968. [Google Scholar]
- 4.Singer W: The Brain, a Complex Self-organizing System. European Review 2009; 17:321–329. [Google Scholar]
- 5.Deco G, Jirsa VK: Ongoing Cortical Activity at Rest: Criticality, Multistability, and Ghost Attractors. The Journal of Neuroscience 2012; 32:3366–3375. [DOI] [PMC free article] [PubMed] [Google Scholar]
- 6.Tagliazucchi E, Balenzuela P, Fraiman D, Chialvo DR: Criticality in Large-Scale Brain fMRI Dynamics Unveiled by a Novel Point Process Analysis. Front Physiol 2012; 3. [DOI] [PMC free article] [PubMed] [Google Scholar]
- 7.Carhart-Harris RL: The entropic brain - revisited. Neuropharmacology 2018; 142:167–178. [DOI] [PubMed] [Google Scholar]
- 8.Wang Z, Li Y, Childress AR, Detre JA: Brain Entropy Mapping Using fMRI. PLoS One 2014; 9:e89948. [DOI] [PMC free article] [PubMed] [Google Scholar]
- 9.Wang Z: The neurocognitive correlates of brain entropy estimated by resting state fMRI. Neuroimage 2021; 232:117893. [DOI] [PMC free article] [PubMed] [Google Scholar]
- 10.Song D, Chang D, Zhang J, Ge Q, Zang Y-F, Wang Z: Associations of brain entropy (BEN) to cerebral blood flow and fractional amplitude of low-frequency fluctuations in the resting brain. Brain Imaging Behav 2019; 13:1486–1495. [DOI] [PubMed] [Google Scholar]
- 11.Buxton RB, Wong EC, Frank LR: Dynamics of blood flow and oxygenation changes during brain activation: The balloon model. Magn Reson Med 1998; 39:855–864. [DOI] [PubMed] [Google Scholar]
- 12.Birn RM, Murphy K, Handwerker DA, Bandettini PA: fMRI in the presence of task-correlated breathing variations. Neuroimage 2009; 47:1092–1104. [DOI] [PMC free article] [PubMed] [Google Scholar]
- 13.Kassinopoulos M, Mitsis GD: Physiological noise modeling in fMRI based on the pulsatile component of photoplethysmograph. Neuroimage 2021; 242:118467. [DOI] [PubMed] [Google Scholar]
- 14.Whittaker JR, Driver ID, Venzi M, Bright MG, Murphy K: Cerebral Autoregulation Evidenced by Synchronized Low Frequency Oscillations in Blood Pressure and Resting-State fMRI. Front Neurosci 2019; 13. [DOI] [PMC free article] [PubMed] [Google Scholar]
- 15.Zhang Y, Ji W, Jiang F, et al. : Associations among body mass index, working memory performance, gray matter volume, and brain activation in healthy children. Cerebral Cortex 2022. [DOI] [PMC free article] [PubMed] [Google Scholar]
- 16.Willeumier KC, Taylor DV, Amen DG: Elevated BMI Is Associated With Decreased Blood Flow in the Prefrontal Cortex Using SPECT Imaging in Healthy Adults. Obesity 2011; 19:1095–1097. [DOI] [PMC free article] [PubMed] [Google Scholar]
- 17.Doucet GE, Rasgon N, McEwen BS, Micali N, Frangou S: Elevated Body Mass Index is Associated with Increased Integration and Reduced Cohesion of Sensory-Driven and Internally Guided Resting-State Functional Brain Networks. Cerebral Cortex 2018; 28:988–997. [DOI] [PMC free article] [PubMed] [Google Scholar]
- 18.Kullmann S, Heni M, Veit R, et al. : The obese brain: Association of body mass index and insulin sensitivity with resting state network functional connectivity. Hum Brain Mapp 2012; 33:1052–1061. [DOI] [PMC free article] [PubMed] [Google Scholar]
- 19.He BJ: Scale-Free Properties of the Functional Magnetic Resonance Imaging Signal during Rest and Task. The Journal of Neuroscience 2011; 31:13786–13795. [DOI] [PMC free article] [PubMed] [Google Scholar]
- 20.Smith SM, Beckmann CF, Andersson J, et al. : Resting-state fMRI in the Human Connectome Project. Neuroimage 2013; 80:144–168. [DOI] [PMC free article] [PubMed] [Google Scholar]
- 21.Van Essen DC, Smith SM, Barch DM, Behrens TEJ, Yacoub E, Ugurbil K: The WU-Minn Human Connectome Project: An overview. Neuroimage 2013; 80:62–79. [DOI] [PMC free article] [PubMed] [Google Scholar]
- 22.Moeller S, Yacoub E, Olman CA, et al. : Multiband multislice GE-EPI at 7 tesla, with 16-fold acceleration using partial parallel imaging with application to high spatial and temporal whole-brain fMRI. Magn Reson Med 2010; 63:1144–1153. [DOI] [PMC free article] [PubMed] [Google Scholar]
- 23.Glasser MF, Sotiropoulos SN, Wilson JA, et al. : The minimal preprocessing pipelines for the Human Connectome Project. Neuroimage 2013; 80:105–124. [DOI] [PMC free article] [PubMed] [Google Scholar]
- 24.Richman JS, Moorman JR: Physiological time-series analysis using approximate entropy and sample entropy. American Journal of Physiology-Heart and Circulatory Physiology 2000; 278:H2039–H2049. [DOI] [PubMed] [Google Scholar]
- 25.Gershon RC, Wagster MV, Hendrie HC, Fox NA, Cook KF, Nowinski CJ: NIH Toolbox for Assessment of Neurological and Behavioral Function. Neurology 2013; 80(Issue 11, Supplement 3):S2–S6. [DOI] [PMC free article] [PubMed] [Google Scholar]
- 26.Heaton RK, Akshoomoff N, Tulsky D, et al. : Reliability and Validity of Composite Scores from the NIH Toolbox Cognition Battery in Adults. Journal of the International Neuropsychological Society 2014; 20:588–598. [DOI] [PMC free article] [PubMed] [Google Scholar]
- 27.Dua S, Bhuker M, Sharma P, Dhall M, Kapoor S: Body mass index relates to blood pressure among adults. N Am J Med Sci 2014; 6:89. [DOI] [PMC free article] [PubMed] [Google Scholar]
- 28.Chang C, Glover GH: Relationship between respiration, end-tidal CO2, and BOLD signals in resting-state fMRI. Neuroimage 2009; 47:1381–1393. [DOI] [PMC free article] [PubMed] [Google Scholar]
- 29.Rosei EA, Chiarini G, Rizzoni D: How important is blood pressure variability? European Heart Journal Supplements 2020; 22(Supplement_E):E1–E6. [DOI] [PMC free article] [PubMed] [Google Scholar]
- 30.Alosco ML, Gunstad J, Xu X, et al. : The impact of hypertension on cerebral perfusion and cortical thickness in older adults. Journal of the American Society of Hypertension 2014; 8:561–570. [DOI] [PMC free article] [PubMed] [Google Scholar]
- 31.Naumczyk P, Sabisz A, Witkowska M, et al. : Compensatory functional reorganization may precede hypertension-related brain damage and cognitive decline. J Hypertens 2017; 35:1252–1262. [DOI] [PMC free article] [PubMed] [Google Scholar]
- 32.Raichle ME: The Brain’s Default Mode Network. Annu Rev Neurosci 2015; 38:433–447. [DOI] [PubMed] [Google Scholar]
- 33.Beyer F, Kharabian Masouleh S, Huntenburg JM, et al. : Higher body mass index is associated with reduced posterior default mode connectivity in older adults. Hum Brain Mapp 2017. [DOI] [PMC free article] [PubMed] [Google Scholar]
- 34.Yang Y, Shields GS, Guo C, Liu Y: Executive function performance in obesity and overweight individuals: A meta-analysis and review. Neurosci Biobehav Rev 2018; 84:225–244. [DOI] [PubMed] [Google Scholar]
- 35.Syan SK, Owens MM, Goodman B, et al. : Deficits in executive function and suppression of default mode network in obesity. Neuroimage Clin 2019; 24:102015. [DOI] [PMC free article] [PubMed] [Google Scholar]
- 36.Gifford KA, Badaracco M, Liu D, et al. : Blood Pressure and Cognition Among Older Adults: A Meta-Analysis. Archives of Clinical Neuropsychology 2013; 28:649–664. [DOI] [PMC free article] [PubMed] [Google Scholar]
- 37.Mahinrad S, Kurian S, Garner CR, et al. : Cumulative Blood Pressure Exposure During Young Adulthood and Mobility and Cognitive Function in Midlife. Circulation 2020; 141:712–724. [DOI] [PMC free article] [PubMed] [Google Scholar]
- 38.Tahmi M, Palta P, Luchsinger JA: Metabolic Syndrome and Cognitive Function. Curr Cardiol Rep 2021; 23:180. [DOI] [PubMed] [Google Scholar]
- 39.Hofman MA: Evolution of the human brain: when bigger is better. Front Neuroanat 2014; 8. [DOI] [PMC free article] [PubMed] [Google Scholar]
- 40.Rilling JK: Comparative primate neuroimaging: insights into human brain evolution. Trends Cogn Sci 2014; 18:46–55. [DOI] [PubMed] [Google Scholar]