

Abstract
We examined relationships between measures of adaptive behavior (AB), cognitive ability, and autism symptom severity in 1,458 preschool-aged children with autism from the Study to Explore Early Development. While publications commonly describe autistic children as “low-“ or “high-functioning” based on cognitive ability, relying solely on cognitive scores may obscure meaningful variation in functioning. We found significant heterogeneity in AB scores of children with cognitive scores both above and below the threshold of two or more standard deviations below the population mean specified in the diagnostic criteria for intellectual disability (ID). Although cognitive and AB scores were strongly associated in our sample, considerable variation in overall AB and more than half in socialization and motor skills was unaccounted for by cognitive ability, autism symptom severity, and other covariates. Among children who could be designated “low-functioning” based on cognitive scores, 39.7% had composite AB scores indicating no significant delays, while among those who might be designated “high-functioning,” 9.0% had significant delays in overall AB and 22.2% in socialization. These results suggest AB scores capture variations in the autism phenotype not accounted for by other measures we considered.
Introduction
Autism research reports often describe study participants who meet diagnostic criteria for autism and have cognitive or intelligence quotient (IQ) scores in the average or above average range as “high-functioning” (Venter et al., 1992; Szatmari et al., 2003; Lecavalier, 2014; de Giambattista et al., 2019). It is not uncommon for research designs to incorporate IQ-based functional classifications in their inclusion or exclusion criteria (e.g., Zajic et al., 2018; Pereira et al., 2018; Calhoun et al., 2020; Fung et al., 2021; Kim et al., 2023), and the phrases “low-“ and “high-functioning autism” have been used widely in everyday communications as well. This approach is problematic given the consistently reported gap between cognitive and adaptive functioning in autistic individuals (Klin et al., 2007; Alvares et al., 2020; Tamm et al., 2021). Thus, these commonly used classifications of functioning may mask important variability in the relative strengths and difficulties in multiple domains of functioning of autistic individuals and obscure significant needs for support among those with cognitive scores above a given cutoff (Alvares et al., 2020; Wolff et al., 2022).
A similar dichotomy based on cognitive scores is often applied in epidemiologic studies of autism to define co-occurring intellectual disability (ID), with co-occurring ID typically defined to include individuals who both meet diagnostic criteria for autism and have cognitive scores at least two standard deviations (SD) below the population mean. Many population-based prevalence estimates of co-occurring ID among autistic children are based solely on cognitive scores (Fombonne et al., 2022; Maenner et al., 2020; Van Naarden Braun et al., 2015; Wiggins et al., 2022; Zeidan et al., 2022) despite clinical diagnostic criteria for ID explicitly requiring consideration of adaptive performance as well (Tassé, et al., 2016). This present study examines classifications of functioning and the relationship between cognitive development and AB in children with autism in a large, well-characterized, community-based sample of preschool-aged children and aims to replicate and build upon relevant findings from previous studies by examining variability in AB scores across the spectrum of cognitive abilities. In doing so, this study provides a critical examination of the use of the terms “low-“ and “high-functioning” and “co-occurring ID” based solely on IQ in the autism literature.
Marked variation in AB among individuals with autism has been well-documented across study samples and data sources, age ranges (preschool to adulthood), and even in individuals considered “high-functioning” based on IQ (Alvares et al., 2020; Bӧlte & Poustka, 2002; Doobay et al., 2014; Fombonne & Zuckerman, 2022; Freeman et al., 1988; Kanne et al., 2011; Klin et al., 2007; Matthews et al., 2015; Paul et al., 2014; Tamm et al., 2022). Several studies looking at domain scores from the Vineland Adaptive Behavior Scales (VABS), one of the most commonly used instruments for measuring AB in autistic individuals, have found evidence of an “autism profile,” a characteristic pattern in VABS domain scores with relative strengths in daily living skills, intermediate scores in communication, and greatest delays in socialization (Venter et al., 1992; Carter et al., 1998; Bӧlte & Poustka, 2002; Perry et al., 2009; Yang et al., 2016), though others have not found this same pattern in their samples (Perry et al., 2009; Ray-Subramanian et al., 2011; Yang et al., 2016; Tillmann et al., 2019; Tamm et al., 2021).
In general, AB scores are positively correlated with cognitive ability (Perry et al., 2009; Kanne et al., 2011; Ray-Subramanian et al., 2011; Pathak et al., 2019; Alvares et al., 2020; Hodge et al., 2021), and the literature suggests this relationship may be stronger in children with autism with lower cognitive scores (Liss et al., 2001; Yang et al., 2016; Tillmann et al., 2019). Despite this significant association, children with autism commonly exhibit discrepancies between cognitive ability and AB scores (Klin et al., 2007; Charman et al., 2011; Kraper et al., 2017; Tamm et al., 2021; Vig & Jedrysek, 1995; Paul et al., 2014), and these gaps have been shown to be larger in individuals with higher cognitive scores and to widen with increasing age (Kanne et al. 2011; Bradshaw et al., 2019; Pathak et al., 2019; Alvares et al., 2020). Large discrepancies in which cognitive scores surpass AB scores have been documented in autistic individuals and IQs above the ID threshold; conversely, in children with autism and cognitive scores two or more SDs below the mean, AB scores are often similar to or exceed IQ (Bӧlte & Poustka, 2002; Matthews et al., 2015; Yang et al., 2016; Bradshaw et al., 2019; Pathak et al., 2019; Alvares et al., 2020). One longitudinal study found that toddlers with autism with average or above IQs were much more likely than typically developing peers to have below average AB socialization and daily living skills, with IQ/AB discrepancies appearing early and growing with age (Bradshaw et al., 2019). These findings suggest that children with autism may have greater AB strengths and/or delays than would be expected based on their IQ, and these discrepancies may merit consideration in research on functioning of autistic children.
AB scores are also generally inversely associated, albeit weakly or non-significantly, with autism symptom severity as measured by Autism Diagnostic Observation Schedule (ADOS) calibrated severity scores (CSS) and the Autism Diagnostic Interview, Revised (ADI-R) (Hill et al., 2015; Yang et al., 2016; McDonald et al., 2017; Franchini et al., 2018; Pathak et al., 2019; Hodge et al., 2021). Previous investigators have theorized that IQ/AB discrepancy patterns could be a result of cognitive ability limiting attainment of AB skills in children with lower IQs, while autism symptom severity might attenuate AB skill development in children with higher IQs (Liss et al., 2001; Yang et al., 2016; McDonald et al., 2017). However, while both cognitive ability and autism symptom severity are associated with adaptive functioning, neither appears to fully explain variation in adaptive functioning, suggesting that AB scores capture unique variation in functioning and may be useful for characterizing support needs and variations in the autism phenotype (Perry et al., 2009; Ray-Subramanian et al., 2011; Hill et al., 2015; Hodge et al., 2021).
Here we describe adaptive behavior (AB) scores of participants in a large, community-based, epidemiological study of diverse, rigorously characterized two- to five-year-old children with autism and examine the association between AB and cognitive development as well as sociodemographic characteristics, autism severity, and behavioral and emotional health. We hypothesize that:
There will be significant AB delays in children with autism, even among those with cognitive scores above the ID threshold of two SDs below the mean, with the greatest limitations in socialization, followed by communication, and then daily living skills and motor skills (i.e., the “autism profile”).
While cognitive scores and autism symptom severity will explain significant variation in AB scores, a large amount of variation in AB scores in children with autism will remain unexplained by these and other factors associated with AB scores, including sociodemographic characteristics and behavioral and emotional health.
Children with autism with cognitive scores above the threshold for ID will exhibit significant discrepancies between cognitive and AB scores, with AB scores significantly lower than cognitive scores, while among children with cognitive scores below the ID threshold, AB scores will be similar to or exceed cognitive scores.
Methods
Study Sample
The Study to Explore Early Development (SEED) identified children with autism aged 30–68 months by end of data collection through multiple sources, including health, education, early intervention, and other service program settings at study sites within areas of six states (California, Colorado, Georgia, Maryland, North Carolina, Pennsylvania) (Wiggins et al., 2021). Caregivers were asked questions about sociodemographic characteristics, medical history, services and treatments, and other information via telephone interview and mailed questionnaires; caregivers also filled out various standard instruments such as the Child Behavior Checklist (CBCL) (Achenbach, 1992). All participating families completed the Social Communication Questionnaire (SCQ) (Rutter et al., 2003a), and children who had an autism spectrum disorder (ASD) diagnosis upon enrollment or had ASD risk noted on the SCQ were evaluated with the Mullen Scales of Early Learning (MSEL) (Mullen, 1995) and ADOS (Lord et al., 1999; Lord et al., 2012), and mothers completed the VABS, Second Edition (VABS-II) (Sparrow et al., 2005) and ADI-R (Lord et al., 1994; Rutter et al., 2003b). Children who did not meet these criteria were evaluated only with the MSEL; if ASD behaviors were witnessed during MSEL administration, the family was asked to also complete the ADOS, ADI-R, and VABS.
Final classification was based on diagnostic criteria for ASD from results of a comprehensive developmental evaluation, including the ADOS and ADI-R, performed by clinicians with established research reliability. Clinical judgment was also considered for children with an early learning age equivalent <24 months who met SEED ASD criteria on the ADOS and ADI-R since the ADI-R is not appropriate for children in this mental age range (Schendel et al., 2012; Wiggins et al., 2015). This population-based ascertainment protocol supported the identification and rigorous assessment of children with autism with and without a previous diagnosis from clinical and community-based sources. Written informed consent was obtained from all participating families. For this research, analysis was restricted to children in the SEED ASD group (n=1,480). Sociodemographic characteristics of the sample are provided in Table 1.
Table 1.
Child, maternal, and sociodemographic characteristics, overall and stratified by cognitive ability, of children with autism spectrum disorder, Study to Explore Early Development phases one (birth years 2003–2006) and two (birth years 2008–2011)
| Early Learning Composite* | |||
|---|---|---|---|
| Demographic Characteristic; n (%) | Overall n=1480 |
>70 n=530 |
≤70 n=930 |
| Child Age at Assessment (years) | |||
| Mean (standard deviation) | 4.7 (0.7) | 4.7 (0.7) | 4.8 (0.7) |
| Range | 2.4–5.8 | 2.4–5.8 | 2.6–5.8 |
| Missing | 3 (0.2) | 0 (0.0) | 0 (0.0) |
| Child Sex | |||
| Male | 1208 (81.6) | 437 (82.5) | 752 (80.9) |
| Female | 272 (18.4) | 93 (17.6) | 178 (19.1) |
| Child Race & Ethnicity | |||
| Non-Hispanic white | 647 (43.7) | 308 (58.1) | 329 (35.4) |
| Non-Hispanic black | 309 (20.9) | 57 (10.8) | 248 (26.7) |
| Hispanic | 273 (18.5) | 79 (14.9) | 192 (20.7) |
| Non-Hispanic other & multiracial | 249 (16.8) | 86 (16.2) | 159 (17.1) |
| Missing | 2 (0.1) | 0 (0.0) | 2 (0.2) |
| Child Birth Order | |||
| Firstborn | 702 (47.4) | 284 (53.6) | 410 (44.1) |
| Second or later born | 713 (48.2) | 228 (43.0) | 473 (50.9) |
| Missing | 65 (4.4) | 18 (3.4) | 47 (5.1) |
| Current Income, Relative to | |||
| Poverty Threshold | |||
| ≤100% | 133 (9.0) | 32 (6.0) | 100 (10.8) |
| 101–200% | 277 (18.7) | 63 (11.9) | 207 (22.3) |
| 201–299% | 234 (15.8) | 80 (15.1) | 151 (16.2) |
| 300–399% | 220 (14.9) | 100 (18.9) | 119 (12.8) |
| ≥400% | 561 (37.9) | 246 (46.4) | 309 (33.2) |
| Missing | 55 (3.7) | 9 (1.7) | 44 (4.7) |
| Maternal Education | |||
| Less than high school | 63 (4.3) | 10 (1.9) | 53 (5.7) |
| High school graduate | 152 (10.3) | 33 (6.2) | 115 (12.4) |
| Some college | 467 (31.6) | 152 (28.7) | 306 (32.9) |
| College graduate | 467 (31.6) | 176 (33.2) | 287 (30.9) |
| Advanced degree | 317 (21.4) | 155 (29.3) | 160 (17.2) |
| Missing | 14 (1.0) | 4 (0.8) | 9 (1.0) |
| Maternal Age at Enrollment (years) | |||
| Mean (standard deviation) | 35.6 (5.6) | 36.1 (5.2) | 35.3 (5.7) |
| Range | 20–52 | 21–52 | 20–52 |
| Mother Born in United States | |||
| Yes | 1132 (76.5) | 422 (79.6) | 694 (74.6) |
| No | 336 (22.7) | 105 (19.8) | 228 (24.5) |
| Missing | 12 (0.8) | 3 (0.6) | 8 (1.0) |
| Primary Language Spoken at Home | |||
| English | 1296 (87.6) | 492 (92.8) | 787 (84.6) |
| Spanish | 78 (5.3) | 12 (2.3) | 65 (7.0) |
| Other | 93 (6.3) | 23 (4.3) | 69 (7.4) |
| Missing | 13 (0.9) | 3 (0.6) | 9 (1.0) |
| Study Site | |||
| California | 235 (15.9) | 91 (17.2) | 139 (15.0) |
| Colorado | 275 (18.6) | 122 (23.0) | 149 (16.0) |
| Georgia | 285 (19.3) | 83 (15.7) | 202 (21.7) |
| Maryland | 254 (17.2) | 75 (14.2) | 179 (19.3) |
| North Carolina | 226 (15.3) | 84 (15.9) | 137 (14.7) |
| Pennsylvania | 205 (13.9) | 75 (14.2) | 124 (13.3) |
Percentages may not add up to 100 due to rounding.
MSEL Early Learning Composite scores were available for 1,460 (98.6%) children with ASD.
Measures
Vineland Adaptive Behavior Scales Second Edition: Survey Interview Form (VABS-II; Sparrow et al, 2005)
The VABS-II is a semi-structured interview designed to measure a child’s current behavior with an item coding system ranging from “never or rarely performed without help” to “consistently performed without help”. The VABS-II was administered in person to the participating child’s caregiver. VABS domains include Communication, Socialization, Daily Living Skills, and in children less than six years of age, Motor Skills, and an overall Adaptive Behavior Composite score can be derived from domain scores. For the Composite and all domain scores, standard scores with mean 100, standard deviation 15, and higher scores indicating higher adaptive functioning were used in analyses. VABS-II scores were available for 1,458 (98.5%) children with ASD.
Mullen Scales of Early Learning (MSEL; Mullen 1995)
The MSEL measures early learning ability in young children up to 68 months of age. In SEED, the MSEL was administered at the in-person assessment, and four subscales on the MSEL– Fine Motor, Visual Reception, Expressive Language, and Receptive Language – were collected. Subscale T-scores have a mean of 50 and standard deviation of 10, and the Early Learning Composite (ELC) is an overall measure of cognitive functioning with a standard score mean of 100 and standard deviation of 15; higher scores on the MSEL indicate higher cognitive ability. This research focused on the MSEL ELC and, to improve precision in the lower range in the regression analysis, a composite raw score was calculated by summing the raw scores from the four subscales. To avoid underestimating early learning ability in children with language delays that are likely present in this preschool-aged sample but may not persist over time or with intervention, we also performed supplemental analyses using the Visual Reception subscale raw score as a proxy for nonverbal cognitive ability, which has been shown to be more stable in young children with autism than verbal IQ due to the rapid language development evident in verbal scores measured in longitudinal studies of children with autism (Howlin et al., 2004; Akshoomoff, 2006; Chawarska et al., 2009; Ellis Weismer et al., 2021). For analyses stratified by cognitive ability, an ELC threshold of 70 (i.e., two SD below the mean), was used to stratify the sample by whether they would be considered “high-functioning” or “low-functioning” in the literature. MSEL ELC scores were available for 1,460 (98.6%) children with ASD. We also conducted a sensitivity analysis using developmental quotients (DQ) and stratifying by a DQ threshold of 70. An overall DQ was calculated by averaging the age equivalent scores from the four subscales, dividing by the child’s age in months at administration of the MSEL, and multiplying by 100; a Visual Reception DQ was also calculated from the Visual Reception age equivalent. These results are available in the supplemental materials (Tables S3 and S4).
Autism Diagnostic Observation Schedule, Second Edition (ADOS; Lord et al., 1999; Lord et al., 2012)
The ADOS is a semi-structured diagnostic child observation that captures social affect and stereotyped behavior and restricted interests in four alternative modules: 1–pre-verbal/single words; 2–phrase speech/non-fluent, 3–fluent speech (child/adolescent), and 4–fluent speech (adolescent/adult). In SEED, module 1, 2, or 3 was administered at the in-person assessment depending on the expressive language abilities of the child. For this research, ADOS CSSs were used to measure autism symptom severity, with higher CSSs indicating higher severity (Gotham et al., 2009).
Childhood Behavior Checklist/1½−5 (CBCL) (Achenbach 1992)
The CBCL/1½−5 is a parent-administered questionnaire on which a child’s caregiver is asked to score behavioral and emotional items on a scale of ‘not true, as far as you know,’ ‘somewhat or sometimes true,’ and ‘very true or often true’ with higher scores indicating greater problems. The CBCL includes three broad scales: Externalizing (which includes attention problems and aggressive behavior), Internalizing (which includes anxiety/depression, emotional reactivity, somatic complaints, and withdrawn behaviors), and Total Problems. CBCL forms were mailed to participating families and filled out by caregivers. T-scores with mean 50 and standard deviation 10 were collected for the Externalizing, Internalizing, and Total Problems scales with a score of ≥65 indicating borderline to clinically significant problems and higher scores indicating more problems.
Statistical Analysis
For Hypothesis 1, we computed VABS-II summary statistics. Mean scores were compared between VABS-II domains using Friedman tests and post-hoc Wilcoxon signed rank sum tests, overall and within each ELC stratum. To estimate the amount of variance in VABS-II scores explained by cognitive ability and autism symptom severity (Hypothesis 2), hierarchical linear regression analysis was performed. In univariate analysis, child’s sex, race, ethnicity, age at administration of the MSEL, and birth order; family’s current income relative to the federal poverty level; primary language spoken in the home; maternal age at enrollment, education, and place of birth; and study site were associated with VABS-II scores and included as predictors in Model 1. In subsequent separate steps, different predictors were added to the regression model, including MSEL composite raw score (Model 2); to account for the potential of a curvilinear relationship in which cognitive and adaptive scores were similar in the lower MSEL score range while cognitive development outpaced adaptive scores in the higher MSEL score range, we also included the quadratic term. In Model 3, ADOS CSS was added, followed by the interaction between ADOS CSS and the two cognitive variables (Model 4) in order to explore the potential effect modification of cognitive development on the relationship between adaptive scores and autism severity. Finally, we added CBCL Total T-score in Model 5 to estimate the additional variance in AB scores explained by overall behavioral and emotional problems (Green & Carter, 2014; Kraper et al., 2017; Franchini et al., 2018). We did not examine externalizing and internalizing problems separately due to significant correlations between these two domains. Nested models were then compared using Wald tests incorporating robust standard errors to determine if the additional variance explained by a new predictor was significant. Separate regressions were run for the VABS-II Composite and each domain score. Regression analysis was limited to complete cases (n=1,278 [86.4% of ASD cases] for the Composite regression; n=1,291 [87.2% of ASD cases] for domain regressions), and we also performed sensitivity analyses using multiple imputation to account for children missing data.
Finally, we described cognitive ability/AB discrepancies among children with ASD with both MSEL ELC and VABS-II scores recorded (Hypothesis 3), overall and within three age cohorts (2–3 years, 4 years, and 5 years of age). We estimated the percent of children with autism with either, both, or neither ELC or VABS-II score indicating significant challenges and calculated Cohen’s kappa coefficients to assess the degree of agreement between the two measures in categorization of functioning (McHugh, 2012). Additionally, after converting both ELC and VABS-II scores into SD units rounded to two decimal places, we calculated the magnitude of cognitive ability/AB discrepancies and determined the percent of children within each cognitive stratum with one and two SD discrepancies between the two measures.
Regression analysis was conducted using R Version 4.2.2 (R Core Team, 2022); the R packages ‘lmtest’ (Zeileis & Hothorn, 2002) and ‘sandwich’ (Zeileis, 2004; Zeileis et al., 2020) were used for nested model comparisons. All other statistical analyses were conducted using SAS Version 9.4 (SAS Institute Inc., 2010). The design and implementation of the SEED study have benefited from community stakeholder input from autistic self-advocates, family members, and service providers, although there was no direct community involvement in the reported study.
Results
Hypothesis 1
On average, the SEED ASD group exhibited significant AB delays. As hypothesized, the Socialization mean was lowest and Motor Skills highest (1.9 and 1.4 SDs below the mean, respectively). In children with ELC≤70, mean VABS-II Composite and domain scores were all 1.7 SD or more below the mean. In children with ELC>70, all mean domain scores were below the population mean of 100, with mean Composite, Daily Living Skills, and Socialization greater than one SD below the mean.
Contrary to our hypothesis, Communication scores were higher than Daily Living Skills on average (Table 2). Between-domain analysis revealed that all mean domain scores significantly differed from one another (p<0.0001 for all comparisons except Communication versus Daily Living Skills in children with ELC≤70 [p=0.03]), overall and within each ELC stratum. Overall and for children with ELC≤70, mean Motor Skills scores were highest, followed by Communication, Daily Living Skills, and Socialization, while in children with ELC>70, mean Communication scores were highest, followed by Motor Skills, Daily Living Skills, and finally Socialization.
Table 2.
Summary statistics for selected instruments, overall and stratified by cognitive ability, for children with autism spectrum disorder, Study to Explore Early Development phases one (birth years 2003–2006) and two (birth years 2008–2011)
| MSEL Early Learning Composite | ||||||||||
|---|---|---|---|---|---|---|---|---|---|---|
| Overall | ≤70 | >70 | ||||||||
| Variable | Mean | Standard Deviation | Range | Mean | Standard Deviation | Range | Mean | Standard Deviation | Range | |
| VABS-II | Composite | 73.2 | 13.3 | 41–114 | 67.3 | 11.2 | 41–98 | 83.6 | 9.9 | 47–114 |
| Communication | 77.8 | 17.7 | 36–131 | 69.7 | 15.5 | 36–108 | 92.1 | 11.1 | 40–131 | |
| Daily Living Skills | 74.7 | 15.1 | 34–121 | 69.0 | 14.0 | 34–109 | 84.8 | 11.3 | 48–121 | |
| Socialization | 72.1 | 12.6 | 44–112 | 67.6 | 11.2 | 44–105 | 80.0 | 11.1 | 49–112 | |
| Motor Skills | 79.7 | 13.4 | 49–124 | 74.9 | 12.0 | 49–117 | 88.0 | 11.7 | 49–124 | |
| MSEL | Early Learning Composite | 66.6 | 19.6 | 49–132 | 53.6 | 6.3 | 49–70 | 89.3 | 13.3 | 71–132 |
| Composite Raw Score | 131.0 | 39.7 | 14–197 | 109.9 | 32.8 | 14–173 | 167.8 | 17.8 | 94–197 | |
| Visual Reception T-Score | 34.7 | 15.5 | 20–80 | 25.5 | 8.8 | 20–58 | 51.0 | 10.5 | 20–80 | |
| Visual Reception Raw Score | 37.4 | 10.2 | 0–50 | 32.3 | 9.2 | 0–50 | 46.3 | 4.0 | 27–50 | |
| Fine Motor T-score | 29.6 | 11.7 | 20–80 | 23.0 | 6.1 | 20–52 | 41.1 | 10.3 | 20–80 | |
| Fine Motor Raw Score | 33.8 | 8.8 | 6–49 | 29.6 | 7.4 | 6–47 | 41.2 | 5.6 | 23–49 | |
| Receptive Language T-score | 30.2 | 12.9 | 20–73 | 22.0 | 4.4 | 20–51 | 44.5 | 10.2 | 20–73 | |
| Receptive Language Raw Score | 30.5 | 11.5 | 0–48 | 24.5 | 9.4 | 0–45 | 41.1 | 5.6 | 20–48 | |
| Expressive Language T-score | 29.1 | 11.4 | 20–74 | 22.5 | 5.1 | 20–49 | 40.8 | 9.8 | 20–74 | |
| Expressive Language Raw Score | 29.2 | 11.5 | 3–50 | 23.5 | 9.9 | 3–44 | 39.3 | 5.7 | 20–50 | |
| ADOS | Calibrated Severity Score | 7.3 | 1.6 | 4–10 | 7.6 | 1.6 | 4–10 | 6.7 | 1.6 | 4–10 |
| CBCL | Total T-Score | 62.9 | 11.1 | 32–98 | 63.4 | 10.5 | 36–98 | 62.0 | 12.1 | 32–94 |
| Externalizing T-Score | 59.7 | 11.3 | 28–97 | 60.0 | 10.7 | 35–97 | 59.2 | 12.4 | 28–92 | |
| Internalizing T-Score | 62.6 | 9.6 | 29–97 | 62.6 | 9.2 | 33–97 | 62.4 | 10.4 | 29–97 | |
VABS-II: Vineland Adaptive Behavior Scales, Second Edition; MSEL: Mullen Scales of Early Learning; ADOS: Autism Diagnostic Observation Schedule; CBCL: Childhood Behavior Checklist.
Hypothesis 2
There was wide variation in VABS-II scores in the overall ASD group and within cognitive strata. VABS-II Composite scores ranged from 41–114 (3.9 SDs below the mean to 0.9 above the mean) (Table 2). Overall and in children with ELC>70, Communication scores had the largest range of any domain, while in children with ELC≤70, Daily Living Skills scores had the largest range; Socialization had the smallest range of any domain overall and in both strata (Table 2).
In regression analysis, sociodemographic factors explained between 6.0% (Motor Skills) to 17.2% (Communication) of variance in VABS-II scores (Table 3). Addition of the MSEL composite raw score explained significant and substantial variance in VABS-II scores (ΔR2=51.1% for the VABS-II Composite score), with domain-specific ΔR2 values ranging from 58.0% in Communication to 31.9% in Motor Skills scores (Table 3, Model 2a). Addition of the ADOS CSS (Model 3a) explained a significant but small amount of additional variance in the Communication (ΔR2=0.1%), Daily Living Skills (ΔR2=0.2%), and Socialization (ΔR2=0.4%) domains. Addition of the MSEL/ADOS CSS interaction only explained significant additional variance for Motor Skills (ΔR2=0.5%) (Model 4a). Finally, addition of the CBCL Total T-score explained significant additional variance for all VABS-II scores, explaining most in Socialization (ΔR2=4.9%) and least in Motor Skills (ΔR2=1.0%) (Model 5a). Altogether, these predictors explained 67.2% of the variance in composite AB scores, with most explained variance in VABS-II Communication scores (R2=76.4%), followed by Daily Living Skills (R2=57.3%), Socialization (R2=48.9%), and Motor Skills (R2=39.5%) (Table 3).
Table 3.
Results of linear regression modeling Vineland Adaptive Behavior Scales, Second Edition scores in children with autism spectrum disorder, Study to Explore Early Development phases one (birth years 2003–2006) and two (birth years 2008–2011)
| VABS-II Score | |||||||||||||
|---|---|---|---|---|---|---|---|---|---|---|---|---|---|
| Composite | Communication | Daily Living Skills | Socialization | Motor Skills | |||||||||
| Model | Variables Added | R2 (%) | ΔR2 (%) | R2 (%) | ΔR2 (%) | R2 (%) | ΔR2 (%) | R2 (%) | ΔR2 (%) | R2 (%) | ΔR2 (%) | ||
| Overall | n | 1278 | 1291 | 1291 | 1291 | 1291 | |||||||
| 1a | Demographicsa | 13.2 | NA | 17.2 | NA | 14.1 | NA | 10.5 | NA | 6.0 | NA | ||
| 2a | + MSEL Composite Raw Scoreb | 64.3 | 51.1*** | 75.2 | 58.0*** | 54.8 | 40.7*** | 43.5 | 33.0*** | 37.9 | 31.9*** | ||
| 3a | + ADOS Calibrated Severity Score | 64.4 | 0.0 | 75.3 | 0.1* | 55.0 | 0.2* | 43.9 | 0.4** | 37.9 | 0.0 | ||
| 4a | + Interactionc | 64.4 | 0.0 | 75.3 | 0.0 | 55.0 | 0.0 | 44.0 | 0.2 | 38.4 | 0.5** | ||
| 5a | + CBCL Total T-Score | 67.2 | 2.8*** | 76.4 | 1.1*** | 57.3 | 2.3*** | 48.9 | 4.9*** | 39.5 | 1.0*** | ||
| MSEL Early Learning Composite | ≤70 | n | 794 | 802 | 802 | 802 | 802 | ||||||
| 1b | Demographicsa | 10.4 | NA | 11.0 | NA | 15.7 | NA | 9.2 | NA | 6.6 | NA | ||
| 2b | + MSEL Composite Raw Scoreb | 61.4 | 50.9*** | 71.2 | 60.2*** | 53.8 | 38.1*** | 42.9 | 33.8*** | 30.8 | 24.1*** | ||
| 3b | + ADOS Calibrated Severity Score | 61.4 | 0.0 | 71.4 | 0.1* | 53.8 | 0.0 | 43.7 | 0.8** | 31.2 | 0.4* | ||
| 4b | + Interactionc | 61.5 | 0.1 | 71.4 | 0.1 | 53.9 | 0.1 | 43.8 | 0.1 | 31.3 | 0.0 | ||
| 5b | + CBCL Total T-Score | 63.6 | 2.2*** | 72.1 | 0.7*** | 56.1 | 2.1*** | 47.7 | 3.9*** | 31.9 | 0.6* | ||
| >70 | n | 484 | 489 | 489 | 489 | 489 | |||||||
| 1c | Demographicsa | 13.3 | NA | 20.0 | NA | 11.4 | NA | 11.2 | NA | 9.6 | NA | ||
| 2c | + MSEL Composite Raw Scoreb | 20.1 | 6.9*** | 33.4 | 13.4*** | 14.9 | 3.5** | 12.3 | 1.2* | 13.0 | 3.4** | ||
| 3c | + ADOS Calibrated Severity Score | 20.4 | 0.3 | 33.8 | 0.4 | 15.7 | 0.9* | 12.5 | 0.1 | 14.0 | 1.1* | ||
| 4c | + Interactionc | 20.6 | 0.1 | 33.8 | 0.0 | 15.9 | 0.2 | 13.0 | 0.6 | 14.4 | 0.4 | ||
| 5c | + CBCL Total T-Score | 28.7 | 8.1*** | 39.0 | 5.2*** | 20.2 | 4.3*** | 22.0 | 9.0*** | 16.9 | 2.5** | ||
p-value <0.05,
p-value <0.01,
p-value <0.0001
VABS-II: Vineland Adaptive Behavior Scales, Second Edition; MSEL: Mullen Scales of Early Learning; ADOS: Autism Diagnostic Observation Schedule, Second Edition; CBCL: Childhood Behavior Checklist; NA: not applicable.
Demographic variables: child’s sex, child’s race and ethnicity, child’s age at administration of MSEL, child’s birth order, household income, primary language spoken in the home, maternal age at enrollment (and the quadratic term), maternal education, mother’s place of birth, and study site.
Includes MSEL Composite Raw Score + MSEL Composite Raw Score2
Interaction between MSEL variables and ADOS CSS
In children with MSEL ELC≤70, the full model explained between 72.1% (Communication) and 31.9% (Motor Skills) of AB score variance (Table 3). The MSEL composite raw score explained significant additional variance for every VABS-II score, ranging from 60.2% for Communication to 24.1% for Motor Skills. The ADOS CSS explained significant additional variance for Communication (ΔR2=0.1%), Socialization (ΔR2=0.8%), and Motor Skills (ΔR2=0.4%), while the additional variance explained by the MSEL/ADOS CSS interaction was not significant for any score. CBCL Total T-score explained significant additional variance for the Composite and every domain, ranging from 3.9% for Socialization to 0.6% for Motor Skills.
In comparison, in children with ELC>70, these predictors explained less of the VABS-II score variance with R2 values ranging from 39.0% for Communication to 16.9% for Motor Skills (Table 3). The MSEL composite raw score explained significant additional variance for every VABS-II score, ranging from 13.4% for Communication to 1.2% for Socialization. Addition of the ADOS CSS explained significant additional variance in Daily Living Skills (ΔR2=0.9%) and Motor Skills (ΔR2=1.1%), while the MSEL/ADOS CSS interaction did not explain significant additional variance for any VABS-II score. CBCL Total T-scores explained significant additional variance for every VABS-II scores, ranging from 9.0% for Socialization to 2.5% for Motor Skills. For all scores except Communication, the additional variance explained by CBCL scores was similar to or greater than that explained by the MSEL composite raw score, particularly in the Socialization domain in which the CBCL Total T-score explained 9.0% significant additional variance compared to only 1.2% significant additional variance explained by the MSEL composite raw score (Table 3).
Analysis of multiply imputed data resulted in similar R2 and ΔR2 values. Additionally, patterns were generally similar when the Visual Reception raw score was used as our measure of cognitive ability, except that, generally, the Visual Reception raw score explained a smaller amount of additional variance in VABS-II scores than the composite raw score (see Table S2).
Hypothesis 3
Figure 1 shows the wide range of composite AB scores among children with ELC scores below and above the two SD below the mean cutoff (Figure 1). Cohen’s kappa coefficients indicated weak (Composite [0.45]) to minimal (Communication [0.36], Daily Living Skills [0.37], Socialization [0.38], and Motor Skills [0.26]) agreement between MSEL ELC and VABS-II scores regarding whether or not both scores fell above or below the two SD cutoff for significant functional impairment or delay. In our sample, 25.3% of children had ELC≤70 but VABS-II Composite scores indicating no significant adaptive delays, while 3.3% and 8.1% had ELC>70 but VABS-II Composite and Socialization scores, respectively, indicating significant delay (Figure 1, Table S5). Over a third (39.7%) of children with ASD and ELC≤70 did not have a composite AB score indicating significant adaptive delay (Figure 1, Quadrant I). In addition, among children with ELC>70, 9.0% and 22.2% had VABS-II Composite and Socialization scores, respectively, indicating significant adaptive delay (Figure 1, Quadrant IV; Table S5). Similar results for other VABS-II domain scores are provided in supplementary Table S5. Patterns were similar when the relationship between VABS-II scores and the MSEL Visual Reception T-score were examined, but a smaller percentage of children had cognitive scores indicating significant delay when measured by the Visual Reception T-score rather than ELC (49.5% versus 63.7%) (see Figure S1).

Discrepant (I, IV) and concordant (II, III) categorizations of functioning based on cognitive development as measured by the Mullen Scales of Early Learning Composite and/or adaptive behavior scores as measured by the Vineland Adaptive Behavior Scales, Second Edition Composite in children with autism spectrum disorder, Study to Explore Early Development phases one (birth years 2003–2006) and two (birth years 2008–2011). Dashed lines indicate two standard deviations below the mean on the VABS-II (horizontal line) and MSEL (vertical line), the cutoff typically used to indicate significant impairment or delay. Note: VABSII: Vineland Adaptive Behavior Scales, Second Edition; ABC: Adaptive Behavior Composite; MSEL: Mullen Scales of Early Learning; ELC: Early Learning Composite.
Consistent with our third hypothesis, we found discrepancies between MSEL ELC and VABS-II scores. Most children with ELC>70 had cognitive scores exceeding their VABS-II scores (62.1% for the Composite). The largest discrepancies were seen in the Socialization domain, with 36.2% of children having ELC>AB with at least a one SD discrepancy and 12.3% having a two SD or more discrepancy between the two scores (Figure 2). Discrepancies were also large for other domains (Figure 2). In children with ELC≤70, adaptive scores often exceeded ELC (91.9% for the Composite), and the proportion with AB scores at least one SD greater than their ELC ranged from 73.8% for Motor Skills to 43.1% for Socialization (Figure 3).
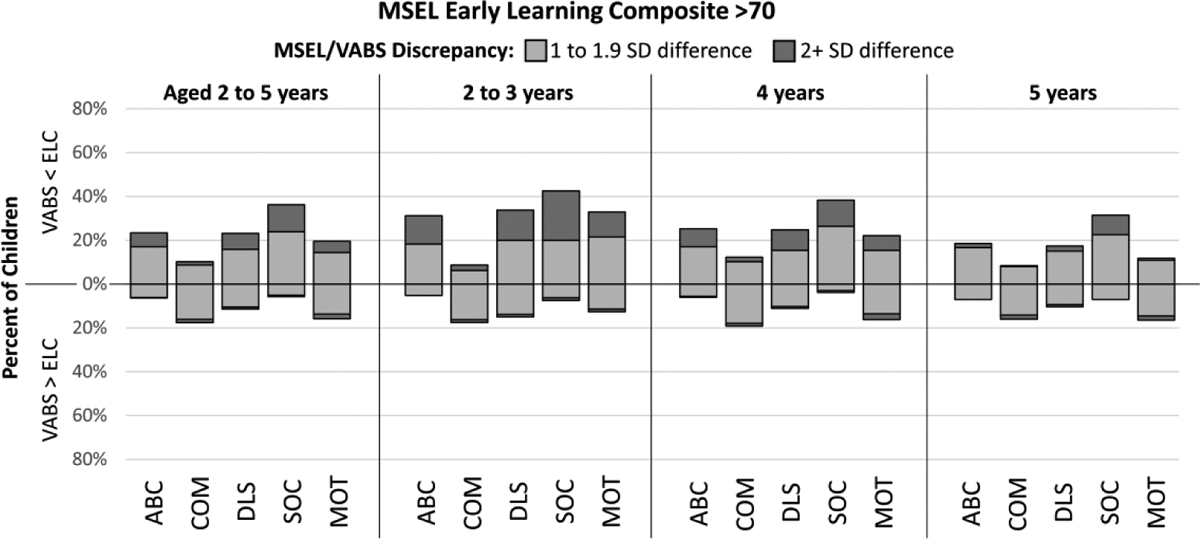
Discrepancies of one or more SD between cognitive development as measured by the Mullen Scales of Early Learning (MSEL) Composite (ELC) and Vineland Adaptive Behavior Scales, Second Edition Composite (ABC), Communication (COM), Daily Living Skills (DLS), Socialization (SOC), and Motor Skills (MOT) scores among children with autism spectrum disorder and MSEL ELC >70, Study to Explore Early Development phases one (birth years 2003–2006) and two (birth years 2008–2011) Note: VABS: Vineland Adaptive Behavior Scales, Second Edition; MSEL: Mullen Scales of Early Learning; ELC: Early Learning Composite; SD: standard deviation; ABC: Adaptive Behavior Composite; COM: Communication; DLS: Daily Living Skills; SOC: Socialization; MOT: Motor Skills.
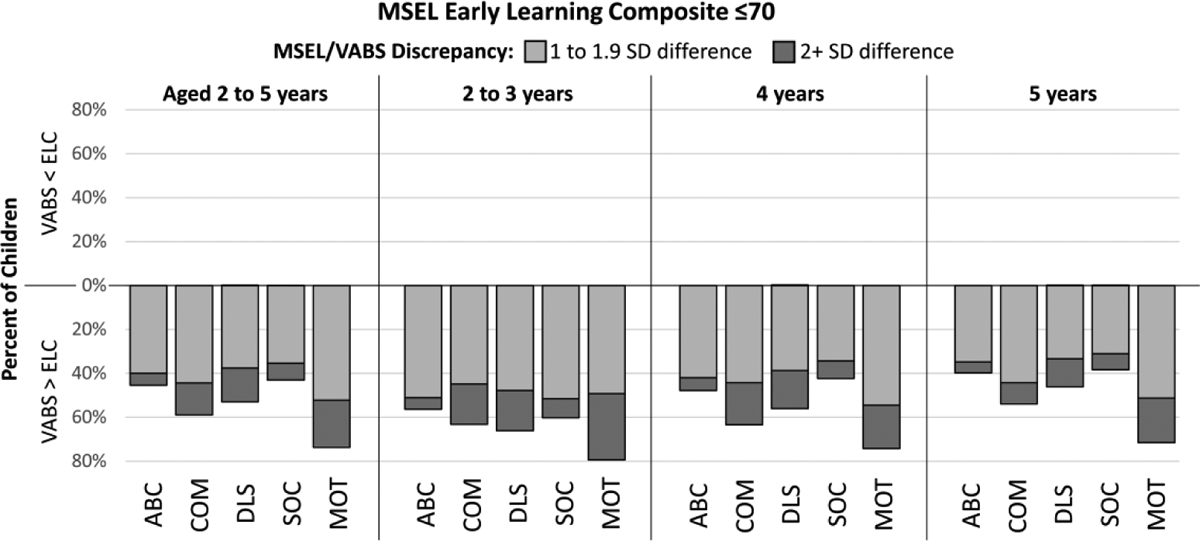
Discrepancies of one or more SD between cognitive development as measured by the Mullen Scales of Early Learning (MSEL) Composite (ELC) and Vineland Adaptive Behavior Scales, Second Edition Composite (ABC), Communication (COM), Daily Living Skills (DLS), Socialization (SOC), and Motor Skills (MOT) scores among children with autism spectrum disorder and MSEL ELC ≤70, Study to Explore Early Development phases one (birth years 2003–2006) and two (birth years 2008–2011) Note: VABS: Vineland Adaptive Behavior Scales, Second Edition; MSEL: Mullen Scales of Early Learning; ELC: Early Learning Composite; SD: standard deviation; ABC: Adaptive Behavior Composite; COM: Communication; DLS: Daily Living Skills; SOC: Socialization; MOT: Motor Skills.
When stratified by age, the proportion of children with a two SD or more discrepancy between their ELC and VABS-II scores decreased with increasing age (Figures 2 and 3), with this trend generally more pronounced in children with ELC>70. There were substantial proportions of children with at least a one or more SD difference in all age cohorts.
Discussion
Our findings of wide variation in adaptive functioning of preschool children with autism may have important implications for identifying service needs and targets of interventions, tracking short-and long-term outcomes, and describing functioning in future epidemiologic and clinical studies of ASD. With respect to the VABS “autism profile,” we confirmed that children with ASD have significant Socialization delays and, in comparison to other domains, relatively fewer Motor delays, although scores in this domain still indicated meaningful limitations. In contrast to other studies (e.g., Bӧlte & Poustka, 2002; Perry et al., 2009; Yang et al., 2016), we found that Communication scores exceeded Daily Living Skills scores on average in our sample. These findings suggest that, while evidence for a characteristic “autism profile” is mixed, AB domain scores may be useful for characterizing more precise profiles of strengths and support needs in research examining phenotypic variation in children with autism.
Consistent with our hypothesis, neither cognitive development as measured by MSEL raw scores nor autism severity fully explained variation in AB scores in this sample, particularly in the Socialization and Motor Skills domains and in children with cognitive scores above the ID threshold, suggesting that AB scores capture important variation in the ASD phenotype otherwise missed by these other measures. As in past research in children with ASD (e.g., Liss et al., 2001; Yang et al., 2016; Pathak et al., 2019), we found a strong positive relationship between cognitive ability and AB scores, especially for the Communication domain, though, in the overall ASD group, cognitive scores explained less than half of the variation in Daily Living Skills, Socialization, and Motor Skills and even less within each cognitive stratum, explaining less than 14% of variation in any VABS-II score in children with ELC>70. Severity of autism symptoms explained little variance while CBCL scores explained somewhat more, particularly in the Socialization domain and in children with ELC>70, consistent with previous findings of a significant negative association between adaptive functioning and behavioral and emotional problems (Green & Carter, 2014; Kraper et al., 2017; Franchini et al., 2018).
Finally, as hypothesized, we found that children with autism with cognitive scores indicating no significant cognitive delay exhibited substantial cognitive/AB discrepancies; many of these children had cognitive scores substantially exceeding AB scores, although contrary to our hypothesis, we saw a higher proportion of substantial cognitive/AB discrepancies in children with cognitive scores two or more SDs below the mean. These discrepancy findings are consistent with past research of children across different age groups (e.g., Pathak et al., 2019; Tillmann et al., 2019; Alvares et al., 2020). Together these results suggest that using cognitive scores, autism symptom severity, and behavioral and emotional problems as a proxy for “functioning” – either together or separately – obscures heterogeneity in adaptive functioning among children with autism and that large gaps between cognitive development and AB are apparent in children with autism across the spectrum of cognitive development as early as preschool. These findings may be important when designing treatment plans and interpreting research findings.
Our results did not support the theory that cognitive ability would be the limiting factor in attainment of AB skills in children with lower cognitive ability and autism severity for children with greater cognitive development (Liss et al., 2001; Yang et al., 2016; McDonald et al., 2017), as an interaction term between cognitive score and autism symptom severity did not explain substantial additional variance in AB scores and ADOS CSSs did not explain substantial additional variance in either cognitive stratum. However, previous study samples often included older individuals, and longitudinal studies have found an association between greater autism symptom severity and low or declining trajectories of AB skill attainment as well as widening IQ/AB gaps with increasing age (Green & Carter, 2014; Franchini et al., 2018; Bradshaw et al., 2019). Because our sample was preschool-aged, the relationship between autism symptom severity and adaptive functioning and the influence of symptom severity on the gap between cognitive development and AB scores could strengthen as they age and develop. While we actually saw fewer large cognitive ability/AB discrepancies in 4- and 5-year-old children relative to those less than four years of age, previous research has shown that issues related to testability may impact how young children with ASD perform on the MSEL (Akshoomoff, 2006; Courchesne et al., 2019), and therefore, the MSEL may have underestimated the cognitive abilities – especially related to language – of the children in our sample, particularly those under four years of age.
Other factors that may contribute to variation in adaptive functioning in children with autism are behavioral or emotional problems and co-occurring physical and mental health conditions. Previous studies have found associations between the two (Green & Carter, 2014; Kraper et al., 2017; Franchini et al., 2018), though others have not (Tillmann et al., 2019). Our results suggest greater behavioral and emotional problems are associated with lower adaptive functioning, particularly in the Socialization domain. In our sample, CBCL scores explained greater additional variance in AB scores than did autism severity, and in children with ELC scores indicating no significant cognitive delays, CBCL scores explained similar or greater additional variance than even cognitive scores in every domain except Communication.
Strengths and Limitations
The large, population-based SEED sample includes children with ASD from diverse racial, ethnic, and socioeconomic backgrounds. Participants all underwent rigorous, research-reliable, professional assessments and had nearly complete data on instruments measuring cognitive development, adaptive functioning, autism symptom severity, and behavioral and emotional health. Additionally, recruitment procedures allowed for identification of ASD cases from a variety of community sources that may otherwise be missed when participants are recruited primarily from clinical populations, as is the case for much of the previous literature on adaptive functioning in children with autism. The broad diagnostic net for case identification in SEED also made possible the inclusion of children without a previous ASD diagnosis, mitigating the risk of a sample biased towards children with access to healthcare or intervention services.
One limitation of our study was the lack of a measure of social demands and support, particularly given our finding that sociodemographic characteristics explained variation in adaptive functioning (Mandell et al., 2005; Constantino et al., 2020). Future research could examine the association between AB and measures of social determinants of health, such as access to resources like early diagnosis and early intervention programs and family and neighborhood environment. Future research could also examine domain-specific associations between cognitive ability, autism symptom severity, and behavioral and emotional problems and AB scores.
Another consideration is the restricted age range of children in our sample. It is important to note that ID is not typically diagnosed in preschool-aged children due to the instability of IQ scores in this age group. However, early childhood cognitive scores have been shown to be predictive of adult outcomes, including IQ (Bishop et al., 2015; Magiati et al, 2014; Pickles et al., 2020), and this study provides evidence that the gap between cognitive and AB scores found in previous ASD research emerges early and may have important implications for research on ASD with co-occurring ID and interpretation and of past research that classified children with autism as “high-“ or “low-functioning” based solely on cognitive scores. Finally, this analysis focused on the MSEL and VABS-II, and the findings may not generalize to all measures of cognitive and adaptive development.
Conclusions
Our finding of significant heterogeneity in adaptive functioning and substantial discrepancies between cognitive and AB scores in preschool-aged children with autism suggests that understanding the relationship between AB and cognitive ability could lead to better characterization of the heterogeneity and needs for support of young autistic children. Autistic children, particularly those without significant cognitive delays, may have support needs not reflected by their cognitive ability; likewise, children with cognitive delays may have adaptive strengths and abilities not evident based on their cognitive scores. In our sample, reliance on cognitive scores alone to identify level of functioning among young children with ASD would potentially designate 25.3% of children as “low-functioning” or having co-occurring ID despite having no significant delays in overall adaptive functioning and 3.3% of children as “high-functioning” despite having significant delays in overall adaptive functioning. Moreover, 8.1% of children could be classified as “high-functioning” despite having significant delays in VABS-II Socialization scores. In terms of service needs, autistic children who have cognitive scores indicating no significant delays have a range of adaptive ability levels and many may benefit from adaptive behavior interventions.
These findings support concerns often raised by researchers and autistic advocates that categorical labels of functioning may fail to capture an individual’s unique strengths, challenges, and needs for support (Bal et al., 2017; Alvares et al, 2020; Bottema-Beutel et al., 2021). They also suggest that reliance on cognitive scores alone may not be sufficient for describing the epidemiology of co-occurring ID and autism. Cognitive development explained only approximately half of the variation in overall adaptive functioning in our full sample and even less in children without significant cognitive delays. This suggests that assignment of functioning labels based on this measure offers an incomplete and potentially inaccurate picture of the abilities and support needs of autistic children. Future epidemiologic studies and other research focused on children with autism with and without co-occurring cognitive delays could consider incorporating measures of adaptive functioning and examining domain-specific patterns of strengths and weaknesses to better characterize functional abilities.
Supplementary Material
Acknowledgments
The authors would like to thank Olivia Pokoski for her assistance in data verification. We also thank the SEED Data Coordinating Center team at the Clinical and Translational Sciences Institute of Michigan State University for their support. This study was carried out as part of SMF’s doctoral dissertation, and SMF would like to thank committee members Mei Baker and Karen Cruickshanks for their input and guidance. Finally, the authors would like to gratefully acknowledge SEED staff and the children and families who participated in SEED.
Funding
The authors disclosed receipt of the following financial support for the research, authorship, and/or publication of this article: This study was supported by thirteen cooperative agreements from the Centers for Disease Control and Prevention (CDC): Cooperative Agreement Number U10DD000180, Colorado Department of Public Health, U01DD000750 University of Colorado Denver; Cooperative Agreement Number U10DD000181, Kaiser Foundation Research Institute (CA); Cooperative Agreement Number U10DD000182, University of Pennsylvania; Cooperative Agreement Number U10DD000183, Johns Hopkins University; Cooperative Agreement Number U10DD000184, University of North Carolina at Chapel Hill; Cooperative Agreement Number U10DD000498, Michigan State University; Cooperative Agreement Number U01000750, University of Colorado Denver; Cooperative Agreement Number U01000748, Kaiser Foundation Research Institute (CA); Cooperative Agreement Number U01000752, University of Pennsylvania; Cooperative Agreement Number U01000746, Johns Hopkins University; Cooperative Agreement Number U01000749, University of North Carolina at Chapel Hill; Cooperative Agreement Number U10DD000901, Michigan State University; and Cooperative Agreement Number U01DD001215, University of Wisconsin System] and the Waisman Center [Eunice Kennedy Shriver National Institute of Child Health and Human Development grant number U54 HD090256]. SMF also received funding from the Wisconsin Distinguished Graduate Fellowship awarded by the University of Wisconsin-Madison. These data were independently verified at the University of Wisconsin-Madison. The findings and conclusions in this report are those of the authors and do not necessarily represent the views of the Centers for Disease Control and Prevention.
Footnotes
Declaration of conflicting interests
The authors have no conflicts of interest to declare that are relevant to the content of this article.
References
- Achenbach TM (1992) Child Behavior Checklist. Burlington, VT: Achenbach System of Empirically Based Assessment. [Google Scholar]
- Alvares GA, Bebbington K, Cleary D, Evans K, Glasson EJ, Maybery MT, Pillar S, Uljarević M, Varcin K, Wray J, & Whitehouse AJO (2020). The misnomer of ‘high functioning autism’: Intelligence is an imprecise predictor of functional abilities at diagnosis. Autism, 24(1), 221–232. 10.1177/1362361319852831 [DOI] [PubMed] [Google Scholar]
- Akshoomoff N (2006). Use of the Mullen Scales of Early Learning for the assessment of young children with autism spectrum disorders. Child Neuropsychology, 12(4–5), 269–277. 10.1080/09297040500473714 [DOI] [PMC free article] [PubMed] [Google Scholar]
- Bal VH, Farmer C, & Thurm A (2017). Describing function in ASD: Using the DSM-5 and other methods to improve precision. Journal of Autism and Developmental Disorders, 47(9), 2938–2941. 10.1007/s10803-017-3204-3 [DOI] [PMC free article] [PubMed] [Google Scholar]
- Bishop SL, Farmer C, & Thurm A (2015). Measurement of nonverbal IQ in autism spectrum disorder: Scores in young adulthood compared to early childhood. Journal of Autism and Developmental Disorders, 45(4), 966–974. 10.1007/s10803-014-2250-3 [DOI] [PMC free article] [PubMed] [Google Scholar]
- Bottema-Beutel K, Kapp SK, Lester JN, Sasson NJ, & Hand BN (2021). Avoiding ableist language: Suggestions for autism researchers. Autism in Adulthood, 3(1), 18–29. 10.1089/aut.2020.0014 [DOI] [PMC free article] [PubMed] [Google Scholar]
- Bradshaw J, Gillespie S, Klaiman C, Klin A, & Saulnier C (2019). Early emergence of discrepancy in adaptive behavior and cognitive skills in toddlers with autism spectrum disorder. Autism, 23(6), 1485–1496. 10.1177/1362361318815662 [DOI] [PMC free article] [PubMed] [Google Scholar]
- Bölte S, & Poustka F (2002). The relation between general cognitive level and adaptive behavior domains in individuals with autism with and without co-morbid mental retardation. Child Psychiatry and Human Development, 33, 165–172. 10.1023/A:1020734325815 [DOI] [PubMed] [Google Scholar]
- Calhoun SL, Pearl AM, Fernandez-Mendoza J, Durica KC, Mayes SD, & Murray MJ (2020). Sleep disturbances increase the impact of working memory deficits on learning problems in adolescents with high-functioning autism spectrum disorder. Journal of Autism and Developmental Disorders, 50, 1701–1713. 10.1007/s10803-019-03928-y [DOI] [PubMed] [Google Scholar]
- Carter AS, Volkmar FR, Sparrow SS, Wang JJ, Lord C, Dawson G, Fombonne E, Loveland K, Mesibov G, & Schopler E (1998). The Vineland Adaptive Behavior Scales: Supplementary norms for individuals with autism. Journal of Autism and Developmental Disorders, 28, 287–302. 10.1023/a:1026056518470 [DOI] [PubMed] [Google Scholar]
- Charman T, Pickles A, Simonoff E, Chandler S, Loucas T, & Baird G (2011). IQ in children with autism spectrum disorders: Data from the Special Needs and Autism Project (SNAP). Psychological Medicine, 41(3), 619–627. 10.1017/S0033291710000991 [DOI] [PubMed] [Google Scholar]
- Chawarska K, Klin A, Paul R, Macari S, & Volkmar F (2009). A prospective study of toddlers with ASD: Short-term diagnostic and cognitive outcomes. Journal of Child Psychology and Psychiatry, 50(10), 1235–1245. 10.1111/j.1469-7610.2009.02101.x [DOI] [PMC free article] [PubMed] [Google Scholar]
- Constantino JN, Abbacchi AM, Saulnier C, Klaiman C, Mandell DS, Zhang Y, Hawks Z, Bates J, Klin A, Shattuck P, Molholm S, Fitzgerald R, Lowe JK, & Geschwind DH (2020). Timing of the diagnosis of autism in African American children. Pediatrics, 146(3). 10.1542/peds.2019-3629 [DOI] [PMC free article] [PubMed] [Google Scholar]
- Courchesne V, Girard D, Jacques C, & Soulières I (2019). Assessing intelligence at autism diagnosis: mission impossible? Testability and cognitive profile of autistic preschoolers. Journal of Autism and Developmental Disorders, 49, 845–856. 10.1007/s10803-018-3786-4 [DOI] [PubMed] [Google Scholar]
- de Giambattista C, Ventura P, Trerotoli P, Margari M, Palumbi R, & Margari L (2019). Subtyping the autism spectrum disorder: comparison of children with high functioning autism and Asperger syndrome. Journal of Autism and Developmental Disorders, 49(1), 138–150. 10.1007/s10803-018-3689-4 [DOI] [PMC free article] [PubMed] [Google Scholar]
- Doobay AF, Foley-Nicpon M, Ali SR, & Assouline SG (2014). Cognitive, adaptive, and psychosocial differences between high ability youth with and without autism spectrum disorder. Journal of Autism and Developmental Disorders, 44, 2026–2040. 10.1007/s10803-014-2082-1 [DOI] [PubMed] [Google Scholar]
- Ellis Weismer S, Rubenstein E, Wiggins L, & Durkin MS (2021). A preliminary epidemiologic study of social (pragmatic) communication disorder relative to autism spectrum disorder and developmental disability without social communication deficits. Journal of Autism and Developmental Disorders, 51, 2686–2696. 10.1007/s10803-020-04737-4 [DOI] [PMC free article] [PubMed] [Google Scholar]
- Fombonne E, & Zuckerman KE (2022). Clinical profiles of black and white children referred for autism diagnosis. Journal of Autism and Developmental Disorders, 52, 1120–1130. 10.1007/s10803-021-05019-3 [DOI] [PubMed] [Google Scholar]
- Fombonne E, Coppola L, Mastel S, & O’Roak BJ (2022). Validation of autism diagnosis and clinical data in the SPARK cohort. Journal of Autism and Developmental Disorders, 52, 3383–3398. 10.1007/s10803-021-05218-y [DOI] [PubMed] [Google Scholar]
- Franchini M, Zöller D, Gentaz E, Glaser B, Wood de Wilde H, Kojovic N, Eliez S, & Schaer M (2018). Early adaptive functioning trajectories in preschoolers with autism spectrum disorders. Journal of Pediatric Psychology, 43(7), 800–813. 10.1093/jpepsy/jsy024 [DOI] [PubMed] [Google Scholar]
- Freeman BJ, Ritvo ER, Yokota A, Childs J, & Pollard J (1988). WISC-R and Vineland Adaptive Behavior Scale scores in autistic children. Journal of the American Academy of Child and Adolescent Psychiatry, 27(4), 428–249. 10.1097/00004583-198807000-00008 [DOI] [PubMed] [Google Scholar]
- Fung LK, Flores RE, Gu M, Sun KL, James D, Schuck RK, … & Hardan AY (2021). Thalamic and prefrontal GABA concentrations but not GABAA receptor densities are altered in high-functioning adults with autism spectrum disorder. Molecular Psychiatry, 26(5), 1634–1646. 10.1038/s41380-020-0756-y [DOI] [PMC free article] [PubMed] [Google Scholar]
- Gotham K, Pickles A, & Lord C (2009). Standardizing ADOS scores for a measure of severity in autism spectrum disorders. Journal of Autism and Developmental Disorders, 39, 693–705. 10.1007/s10803-008-0674-3 [DOI] [PMC free article] [PubMed] [Google Scholar]
- Green SA, & Carter AS (2014). Predictors and course of daily living skills development in toddlers with autism spectrum disorders. Journal of Autism and Developmental Disorders, 44, 256–263. 10.1007/s10803-011-1275-0 [DOI] [PMC free article] [PubMed] [Google Scholar]
- Hill TL, Gray SAO, Kamps JL, & Varela RE (2015). Age and adaptive functioning in children and adolescents with ASD: The effects of intellectual functioning and ASD symptom severity. Journal of Autism and Developmental Disorders, 45, 4074–4083. 10.1007/s10803-015-2522-6 [DOI] [PMC free article] [PubMed] [Google Scholar]
- Hodge MA, Boulton KA, Sutherland R, Barnett D, Bennett B, Chan E, Cramsie J, Drevensek S, Eapen V, Ganesalingam K, Masi A, Ong N, Williamsz M, Guastella AJ, & Silove N (2021). Predictors of adaptive functioning in preschool aged children with autism spectrum disorder. Autism Research, 14(7), 1444–1455. 10.1002/aur.2501 [DOI] [PubMed] [Google Scholar]
- Howlin P, Goode S, Hutton J, & Rutter M (2004). Adult outcome for children with autism. Journal of Child Psychology and Psychiatry, 45(2), 212–229. 10.1111/j.1469-7610.2004.00215.x [DOI] [PubMed] [Google Scholar]
- Kanne SM, Gerber AJ, Quirmbach LM, Sparrow SS, Cicchetti DV, & Saulnier CA (2011). The role of adaptive behavior in autism spectrum disorders: Implications for functional outcome. Journal of Autism and Developmental Disorders, 41, 1007–1018. 10.1007/s10803-010-1126-4 [DOI] [PubMed] [Google Scholar]
- Kim JI, Bang S, Yang JJ, Kwon H, Jang S, Roh S, … & Kim BN (2023). Classification of preschoolers with low-functioning autism spectrum disorder using multimodal MRI data. Journal of Autism and Developmental Disorders, 53, 25–37. 10.1007/s10803-021-05368-z [DOI] [PubMed] [Google Scholar]
- Klin A, Saulnier CA, Sparrow SS, Cicchetti DV, Volkmar FR, & Lord C (2007). Social and communication abilities and disabilities in higher functioning individuals with autism spectrum disorders: The Vineland and the ADOS. Journal of Autism and Developmental Disorders, 37, 748–759. 10.1007/s10803-006-0229-4 [DOI] [PubMed] [Google Scholar]
- Kraper CK, Kenworthy L, Popal H, Martin A, & Wallace GL (2017). The gap between adaptive behavior and intelligence in autism persists into young adulthood and is linked to psychiatric comorbidities. Journal of Autism and Developmental Disorders, 47, 3007–3017. 10.1007/s10803-017-3213-2 [DOI] [PubMed] [Google Scholar]
- Lecavalier L (2014). Phenotypic variability in autism spectrum disorder: Clinical considerations. In Davis TE, White SW, & Ollendick TH (Eds.), Handbook of Autism and Anxiety (pp. 15–29). New York: Springer. [Google Scholar]
- Liss M, Harel B, Fein D, Allen D, Dunn M, Feinstein C, Morris R, Waterhouse L, & Rapin I (2001). Predictors and correlates of adaptive functioning in children with developmental disorders. Journal of Autism and Developmental Disorders, 31, 219–230. 10.1023/A:1010707417274 [DOI] [PubMed] [Google Scholar]
- Lord C, Rutter M, & Le Couteur AL (1994). Autism Diagnostic Interview-Revised: A revised version of a diagnostic interview for caregivers of individuals with possible pervasive developmental disorders. Journal of Autism and Developmental Disorders, 24(5), 659–685. [DOI] [PubMed] [Google Scholar]
- Lord C, Rutter M, DiLavore PC, & Risi S (1999). Autism Diagnostic Observation Schedule. Los Angeles, CA: Western Psychological Services. [Google Scholar]
- Lord C, Rutter M, DiLavore PC, & Risi S (2012). Autism Diagnostic Observation Schedule (2nd ed.). Los Angeles, CA: Western Psychological Services. [Google Scholar]
- Maenner MJ, Shaw KA, Baio J, Washington A, Patrick M, DiRienzo M, Christensen DL, Wiggins LD, Pettygrove S, Andrews JG, Lopez M, Hudson A, Baroud T, Schwenk Y, White T, Rosenberg CR, Lee LC, Harrington RA, Huston M, … Dietz PM (2020). Prevalence of autism spectrum disorder among children aged 8 years - Autism and Developmental Disabilities Monitoring Network, 11 Sites, United States, 2016. Morbidity and Mortality Weekly Report. Surveillance summaries (Washington, D.C.: 2002), 69(4), 1–12. 10.15585/mmwr.ss6904a1 [DOI] [PMC free article] [PubMed] [Google Scholar]
- Magiati I, Tay XW, & Howlin P (2014). Cognitive, language, social and behavioural outcomes in adults with autism spectrum disorders: A systematic review of longitudinal follow-up studies in adulthood. Clinical Psychology Review, 34(1), 73–86. 10.1016/j.cpr.2013.11.002 [DOI] [PubMed] [Google Scholar]
- Mandell DS, Novak MM, & Zubritsky CD (2005). Factors associated with age of diagnosis among children with autism spectrum disorders. Pediatrics, 116(6), 1480–1486. 10.1542/peds.2005-0185 [DOI] [PMC free article] [PubMed] [Google Scholar]
- Matthews NL, Pollard E, Ober-Reynolds S, Kirwan J, Malligo A, & Smith CJ (2015). Revisiting cognitive and adaptive functioning in children and adolescents with autism spectrum disorder. Journal of Autism and Developmental Disorders, 45, 138–156. 10.1007/s10803-014-2200-0 [DOI] [PubMed] [Google Scholar]
- McDonald CA, Donnelly JP, Rodgers JD, Thomeer ML, Lopata C, & Jordan AK (2017). Brief report: Examination of correlates of adaptive behavior in children with HFASD using the BASC-2 Parent Rating Scale. Journal of Autism and Developmental Disorders, 47, 1530–1534. 10.1007/s10803-017-3046-z [DOI] [PubMed] [Google Scholar]
- McHugh ML (2012). Interrater reliability: The kappa statistic. Biochemia Medica, 22(3), 276–282. [PMC free article] [PubMed] [Google Scholar]
- Mullen E (1995). Mullen Scales of Early Learning. San Antonio, TX: Pearson. [Google Scholar]
- Pathak M, Bennett A, & Shui AM (2019). Correlates of adaptive behavior profiles in a large cohort of children with autism: The Autism Speaks Autism Treatment Network registry data. Autism, 23(1), 87–99. 10.1177/1362361317733113 [DOI] [PubMed] [Google Scholar]
- Paul R, Loomis R, & Chawarska K (2014). Adaptive behavior in toddlers under two with autism spectrum disorders. Journal of Autism and Developmental Disorders, 44, 264–270. 10.1007/s10803-011-1279-9 [DOI] [PubMed] [Google Scholar]
- Pereira AM, Campos BM, Coan AC, Pegoraro LF, De Rezende TJ, Obeso I, … & Cendes F (2018). Differences in cortical structure and functional MRI connectivity in high functioning autism. Frontiers in Neurology, 9, 539. 10.3389/fneur.2018.00539 [DOI] [PMC free article] [PubMed] [Google Scholar]
- Perry A, Flanagan HE, Geier JD, & Freeman NL (2009). Brief report: The Vineland Adaptive Behavior Scales in young children with autism spectrum disorders at different cognitive levels. Journal of Autism and Developmental Disorders, 39, 1066–1078. 10.1007/s10803-009-0704-9 [DOI] [PMC free article] [PubMed] [Google Scholar]
- Pickles A, McCauley JB, Pepa LA, Huerta M, & Lord C (2020). The adult outcome of children referred for autism: typology and prediction from childhood. Journal of Child Psychology and Psychiatry, 61(7), 760–767. 10.1111/jcpp.13180 [DOI] [PMC free article] [PubMed] [Google Scholar]
- R Core Team (2022). R: A language and environment for statistical computing. R Foundation for Statistical Computing, Vienna, Austria. URL https://www.R-project.org/. [Google Scholar]
- Ray-Subramanian CE, Huai N, & Weismer SE (2011). Brief report: Adaptive behavior and cognitive skills for toddlers on the autism spectrum. Journal of Autism and Developmental Disorders, 41, 679–684. 10.1007/s10803-010-1083-y [DOI] [PMC free article] [PubMed] [Google Scholar]
- Rutter M, Bailey A, & Lord C (2003a). SCQ: Social Communication Questionnaire. Los Angeles, CA: Western Psychological Services. [Google Scholar]
- Rutter M, Le Couteur A, & Lord C (2003b). ADI-R: The Autism Diagnostic Interview-Revised. Los Angeles, CA: Western Psychological Services. [Google Scholar]
- SAS Institute Inc. (2010). SAS (Version 9.4). Cary, North Carolina, USA: SAS Institute Inc. [Google Scholar]
- Schendel DE, DiGuiseppi C, Croen LA, Fallin MD, Reed PL, Schieve LA, Wiggins LD, Daniels J, Grether J, Levy S, Miller L, Newschaffer C, Pinto-Martin J, Robinson C, Windham GC, Alexander A, Aylsworth AS, Bernal P, Bonner JD, … & Yeargin-Allsopp M (2012). The Study to Explore Early Development (SEED): A multisite epidemiologic study of autism by the Centers for Autism and Developmental Disabilities Research and Epidemiology (CADDRE) network. Journal of Autism and Developmental Disorders, 42, 2121–2140. 10.1007/s10803-012-1461-8 [DOI] [PMC free article] [PubMed] [Google Scholar]
- Sparrow S, Balla D, & Cicchetti D (2005). Vineland Adaptive Behavior Scales (2nd ed.). San Antonio, TX: Pearson. [Google Scholar]
- Szatmari P, Bryson SE, Boyle MH, Streiner DL, & Duku E (2003). Predictors of outcome among high functioning children with autism and Asperger syndrome. Journal of Child Psychology and Psychiatry, 44(4), 520–528. 10.1111/1469-7610.00141 [DOI] [PubMed] [Google Scholar]
- Tamm L, Day HA, & Duncan A (2021). Comparison of adaptive functioning measures in adolescents with autism spectrum disorder without intellectual disability. Journal of Autism and Developmental Disorders. 10.1007/s10803-021-05013-9 [DOI] [PMC free article] [PubMed] [Google Scholar]
- Tassé MJ, Luckasson R, & Schalock RL (2016). The Relation Between Intellectual Functioning and Adaptive Behavior in the Diagnosis of Intellectual Disability. Intellectual and developmental disabilities, 54(6), 381–390. 10.1352/1934-9556-54.6.381 [DOI] [PubMed] [Google Scholar]
- Tillmann J, San José Cáceres A, Chatham CH, Crawley D, Holt R, Oakley B, Banaschewski T, Baron-Cohen S, Bӧlte S, Buitelaar JK, Durston S, Ham L, Loth E, Simonoff E, Spooren W, Murphy DG, Charman T, & the EU-AIMS LEAP group. (2019). Investigating the factors underlying adaptive functioning in autism in the EU-AIMS Longitudinal European Autism Project. Autism Research, 12(4), 645–657. 10.1002/aur.2081 [DOI] [PMC free article] [PubMed] [Google Scholar]
- Van Naarden Braun K, Christensen D, Doernberg N, Schieve L, Rice C, Wiggins L, … & Yeargin-Allsopp M (2015). Trends in the prevalence of autism spectrum disorder, cerebral palsy, hearing loss, intellectual disability, and vision impairment, metropolitan Atlanta, 1991–2010. PloS one, 10(4), e0124120. [DOI] [PMC free article] [PubMed] [Google Scholar]
- Venter A, Lord C, & Schopler E (1992). A follow-up study of high-functioning autistic children. Journal of Child Psychology and Psychiatry, 33(3), 489–597. 10.1111/j.1469-7610.1992.tb00887.x [DOI] [PubMed] [Google Scholar]
- Vig S, & Jedrysek E (1995). Adaptive behavior of young urban children with developmental disabilities. Mental Retardation, 33(2), 90–98. [PubMed] [Google Scholar]
- Wiggins LD, Reynolds A, Rice CE, Moody EJ, Bernal P, Blaskey L, Rosenberg SA, Lee LC, & Levy SE (2015). Using standardized diagnostic instruments to classify children with autism in the Study to Explore Early Development. Journal of Autism and Developmental Disorders, 45, 1271–1280. 10.1007/s10803-014-2287-3 [DOI] [PMC free article] [PubMed] [Google Scholar]
- Wiggins LD, Rubenstein E, Windham G, Barger B, Croen L, Dowling N, … & Schieve L (2021). Evaluation of sex differences in preschool children with and without autism spectrum disorder enrolled in the study to explore early development. Research in Developmental Disabilities, 112, 103897. 10.1016/j.ridd.2021.103897 [DOI] [PMC free article] [PubMed] [Google Scholar]
- Wiggins LD, Tian LH, Rubenstein E, Schieve L, Daniels J, Pazol K, DiGuiseppi C, Barger B, Moody E, Rosenberg S, Bradley C, Hsu M, Robinson Rosenberg C, Christensen D, Crume T, Pandey J, & Levy SE (2022). Features that best define the heterogeneity and homogeneity of autism in preschool-age children: A multisite case-control analysis replicated across two independent samples. Autism Research: Official Journal of the International Society for Autism Research, 15(3), 539–550. 10.1002/aur.2663 [DOI] [PMC free article] [PubMed] [Google Scholar]
- Wolff N, Stroth S, Kamp-Becker I, Roepke S, & Roessner V (2022). Autism Spectrum Disorder and IQ - A Complex Interplay. Frontiers in Psychiatry, 13, 856084. 10.3389/fpsyt.2022.856084 [DOI] [PMC free article] [PubMed] [Google Scholar]
- Yang S, Paynter JM, & Gilmore L (2016). Vineland Adaptive Behavior Scales: II profile of young children with autism spectrum disorder. Journal of Autism and Developmental Disorders, 46, 64–73. 10.1007/s10803-015-2543-1 [DOI] [PubMed] [Google Scholar]
- Zajic MC, McIntyre N, Swain-Lerro L, Novotny S, Oswald T, & Mundy P (2018). Attention and written expression in school-age, high-functioning children with autism spectrum disorders. Autism, 22(3), 245–258. 10.1177/1362361316675121 [DOI] [PubMed] [Google Scholar]
- Zeidan J, Fombonne E, Scorah J, Ibrahim A, Durkin MS, Saxena S, Yusuf A, Shih A, & Elsabbagh M (2022). Global prevalence of autism: A systematic review update. Autism Research: Official Journal of the International Society for Autism Research, 15(5), 778–790. 10.1002/aur.2696 [DOI] [PMC free article] [PubMed] [Google Scholar]
- Zeileis A, Hothorn T (2002). Diagnostic Checking in Regression Relationships. R News 2(3), 7–10. URL https://CRAN.R-project.org/doc/Rnews/ [Google Scholar]
- Zeileis A (2004). Econometric Computing with HC and HAC Covariance Matrix Estimators. Journal of Statistical Software, 11(10), 1–17. 10.18637/jss.v011.i10 [DOI] [Google Scholar]
- Zeileis A, Köll S, Graham N (2020). Various Versatile Variances: An Object-Oriented Implementation of Clustered Covariances in R.” Journal of Statistical Software, 95(1), 1–36. 10.18637/jss.v095.i01 [DOI] [Google Scholar]
Associated Data
This section collects any data citations, data availability statements, or supplementary materials included in this article.