

Abstract
Aim: Wide volume scan (WVS) coronary computed tomography angiography (CCTA) enables aortic arch visualization. This study assessed whether the thoracic aortic plaque burden (TAPB) score can predict major cardiovascular adverse events (MACE) in addition to and independently of other obstructive coronary artery disease (CAD) attributes.
Methods: This study included patients with suspected CAD who underwent CCTA (n=455). CCTA-WVS was used to assess CAD and the prognostic capacity of TAPB scores. Data analysis included the coronary artery calcification score (CACS), CAD status and extent, and TAPB score, calculated as the sum of plaque thickness and plaque angle at five thoracic aortic segments. The primary endpoint was MACE defined as a composite event comprised of ischemic stroke, acute coronary syndrome, and cardiovascular death.
Results: During a mean follow-up period of 2.8±0.9 years, 40 of 455 (8.8%) patients experienced MACE. In the Cox proportional hazards model adjusted for clinical risks (Suita cardiovascular disease risk score), we identified TAPB score (T3) as a predictor of MACE independent of CACS >400 (hazards ratio [HR], 2.91; 95% confidence interval [CI], 1.26–6.72;p=0.012) or obstructive CAD (HR, 2.83; 95% CI, 1.30–6.18;p=0.009). The area under the curve for predicting MACE improved from 0.75 to 0.795 (p value=0.008) when TAPB score was added to CACS >400 and obstructive CAD.
Conclusions: We found that comprehensive non-invasive evaluation of TAPB and CAD has prognostic value in MACE risk stratification for suspected CAD patients undergoing CCTA.
Keywords: Atherosclerosis, Coronary computed tomography angiography, Coronary artery disease, Ischemic stroke, Prognosis
Introduction
The global cardiovascular disease (CVD) epidemic is well-established, with yearly increases in mortality and morbidity for coronary artery disease (CAD) and stroke 1) . The rapidly aging populations in many regions of the world demand a comprehensive assessment of atherosclerotic CVD risk 2) . Clinical studies have demonstrated that thoracic aortic plaques (TAP), including aortic arch plaques (AAP), can serve as a marker of stroke, dementia, cognitive dysfunction, and mortality due to cardiovascular causes 3 , 4) . Despite the substantial associations between atherosclerotic alterations and increased CVD risk, the clinical significance of early identification of the TAP burden (TAPB) remains unclear.
Coronary computed tomography angiography (CCTA) is the first-line of defense non-invasive test for patients with low to intermediate pretest probability of CAD 5 , 6) . In addition to the coronary artery calcium score (CACS), available from non-contrast computed tomography (CT), CCTA can help assess the presence and severity of CAD and provide prognostic information for future coronary events 7 - 9) . Hoffman et al. demonstrated that CCTA provides better prognostic information as compared to functional tests in patients with chest pain, and this can be explained by the ability of CCTA to identify non-obstructive CAD 8) . Furthermore, in the SCOT-HEART trial, CCTA-guided therapy provided better clinical outcomes than standard therapy without CCTA in patients with CAD 9 , 10) , indicating the importance of identifying high-risk patients with increased atherosclerotic disease burden leading to cardiovascular events.
Recently, we introduced CCTA with a 320-row multidetector CT using wide volume scan (WVS), which enables detailed visualization of the aortic arch (second volume scan) without an increase in the volume of contrast medium injection during the conventional CCTA imaging (first volume scan) 11) . An additional benefit of this method is that it eliminates redundant radiation exposure as compared to the helical scan, which requires oversampling or overlapping of sequential images 12 , 13) . This 320-row multidetector CT permits comprehensive assessment of atherosclerotic alterations in the coronary arteries and thoracic aorta ( Fig.1A ) . For patients undergoing CCTA, it remains unclear whether combinations of these imaging markers serve as predictors of cardiovascular events, including myocardial infarction (MI) and ischemic stroke. This study aimed to investigate whether increased TAPB detected by CCTA-WVS can provide prognostic information in addition to and independent of obstructive CAD status and clinical risk factors in patients with suspected CAD who underwent CCTA.
Fig.1. Schematic flow chart of the study process involving coronary angiography with 320-row multidetector computed tomography to image the aortic arch and coronary atherosclerosis.

(A) First volume scan of the CCTA aiming at the heart and second volume scan aiming at the aortic arch. (B) Flow chart of participants in this study.
CAD, coronary artery disease; CCTA, coronary computed tomography angiography; WVS, wide volume scan.
Methods
Study Population
This study included patients who complained of chest pain and were consecutively admitted to Kashibaseiki Hospital between April 1, 2017 and November 30, 2019 for CCTA examinations. In our institution, CCTA-WVS was used to assess CAD and the thoracic aorta, including the aortic arch. Fig.1B illustrates a flow chart of the patients in our study. The exclusion criteria for our study were as follows: (1) the presence of hemodynamic instability due to acute or previous aortic diseases; (2) presence of acute coronary syndrome; (3) presence of chronic kidney disease treated with maintenance hemodialysis; (4) those with known CAD, defined as prior coronary revascularization (percutaneous coronary intervention [PCI] and coronary artery bypass graft); (5) prior myocardial infarction; (6) previous history of ischemic stroke; (7) age <30 or ≥ 80 years for the calculation of clinical risk score; and (8) unsuitable CCTA image quality for analysis. The final study population consisted of 455 patients without known CVD ( Fig.1B ) . All participants provided written informed consent for the CCTA-WVS imaging. Furthermore, an opt-out process was carried out, which gave patients the option of refusing or permitting the research use of all anonymized patient data including clinical information, laboratory test results, and CCTA imaging. This study protocol was approved by the ethics committee of the Kashibaseiki hospital (2021-A). This study was conducted in accordance with the Declaration of Helsinki.
Definitions
The Suita CVD risk score for each patient was calculated as previously reported 14) . This score (model with electrocardiogram) is a Japanese CVD score calculated using the following parameters: age, sex, high- and low-density lipoprotein cholesterol levels, systolic blood pressure, diastolic blood pressure, smoking, diabetes mellitus, atrial fibrillation, and left ventricular hypertrophy. Suita CVD scores were classified as follows: 0–20 points, 10-year risk ≤ 2%; 21–25 points, 10-year risk of 6%; 26–30 points, 10-year risk of 9%; 31–35 points, 10-year risk of 15%; and ≥ 36 points, 10-year risk of 26%. Blood pressure and levels of serum creatinine, fasting lipids, glucose, glycated hemoglobin, and C-reactive protein were measured at baseline. Medication use at the time of CCTA examination was reported. On the basis of CCTA-WVS findings, pharmacological treatment and lifestyle modifications were recommended for all patients according to the guidelines for hypertension, dyslipidemia, and diabetes, if present 15) . Additionally, patients with suspected obstructive CAD underwent invasive coronary angiography (n=154) and PCI (n=52) based on the CCTA results and in combination with stress tests 16) .
CCTA Image Acquisition and Analysis
All CCTA-WVS examinations were performed using a 320-row multidetector CT (Aquilion ONE/NATURE Edition, Cannon Medical Systems, Inc., Tochigi, Japan) 11) . Two WVSs were performed during a single breath-hold, enabling visualization of the entire thoracic aorta. All CCTA imagings were performed using the electrocardiogram-triggered prospective gating method. Patients with a heart rate >60 bpm were pretreated with oral beta blockers. The CACS was evaluated by using the Agatston scoring method. During CCTA imaging, the first volume scan was aimed at imaging the entire heart, while the second scan was aimed at imaging the aortic arch (left, graphical abstract). A bolus-tracking method was used for image acquisition, and a non-ionic contrast medium of 270 mg I/kg (range, 33–74 mL, Iopamidol, [370 mg I/mL]; Bracco, Milan, Italy) was administered using a power injector at a rate of 2.3–4.9 mL per second through a 20-gauge needle. After injection of the contrast medium, saline was injected through the same venous access site at the same injection rate. A region of interest was set in the ascending aorta, 12 mm (4-slices of the CAC scan) above the left main trunk aiming at the level of the bronchial bifurcation. When the CT value exceeded 150 Hounsfield units, electrocardiogram-synchronized scans were performed within a single breath-hold. The scan parameters were as follows: detector collimation, 0.5×320 mm; gantry rotation time, 350 ms; tube voltage, 120 kV; and tube current, 130–600 mA. The calculated mean radiation dose was 4.5 mSv on average.
All CCTA image analyses were performed using dedicated software (VINCENT, Fujifilm inc., Tokyo, Japan). According to the guidelines provided by the Society of Cardiovascular Computed Tomography 7) , CACS scores were categorized as follows: CACS of 0, 1–100, 101–400, or >400. Obstructive CAD was defined as stenosis ≥ 50% of one or more major epicardial vessels and/or stenosis ≥ 50% of the left main coronary segment. Nonobstructive CAD was defined as the presence of atherosclerotic plaques with <50% stenosis observed in one or more major epicardial vessels. In the absence of the aforementioned conditions, patients were categorized as having no CAD. Using the American Heart Association 16-segment model, the segment stenosis score (SSS) and segment involvement score (SIS) were investigated to evaluate CAD extent and severity 17) .
Aortic Plaque Analysis
For assessment of aortic plaques using dedicated software (VINCENT, Fujifilm inc., Tokyo, Japan), the thoracic aorta was categorized into five segments, comprising the aortic root, ascending aorta, aortic arch, aortic arch branches, and descending aorta above the diaphragm, as previously reported by Kurra et al 18) . The extent of the segments was defined as follows: aortic root, from the aortic annulus to the sinotubular junction; ascending aorta, the segment between the sinotubular junction and the origin of the innominate artery; aortic arch, the segment between the innominate artery and the aortic isthmus; aortic arch branches, the segment including the ostia and proximal 10 mm of the proximal vessel; and descending aorta, the segment between the aortic isthmus and the diaphragm 11) .
An aortic plaque was defined as the presence of a visible thickening of the aortic wall, and the aortic plaque thickness was measured 18) . The presence of aortic plaque was reported separately for each aortic segment. Representative images of TAPs are shown in Fig.2 . For the semi-quantitative analysis, the aortic arch score was calculated as the sum of plaque thickness (0: no plaque, 1: <3 mm, 2: 3–5 mm, 3: >5 mm) and circumferential degree of plaque angle (0: no plaque, 1: <120°, 2: 120–240°, 3: >240°) (total, 0–6 points) for each segment. The total TAPB score was reported as the sum of the aortic plaque score in each segment, resulting in minimum and maximum scores of 0 and 30 points, respectively. The TAPB score was categorized into tertiles (T1, 0–2; T2, 3–9; and T3, ≥ 10). A complex aortic plaque was defined as an aortic plaque showing ulceration or protrusion on CCTA cross-sectional images, as previously reported 11) .
Fig.2. A representative case with thoracic aortic plaque burden score (T3) and obstructive coronary artery disease leading to stroke.
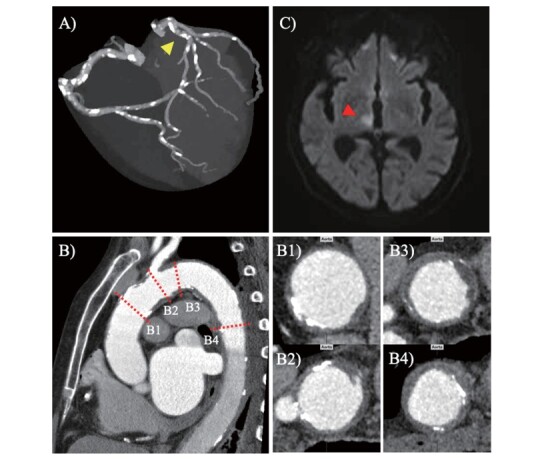
(A) Coronary arteries with severe calcification (B) Vertical axis image of thoracic aorta, ascending aorta (B1), aortic arch (B2 and B3), and descending aorta (B4). (C) Brain magnetic resonance image. A 77-year-old female underwent CCTA-WVS to investigate the cause of chest pain upon physical effort; obstructive CAD was revealed in the proximal portion of the left anterior descending artery (A, yellow arrowhead). Furthermore, a reconstructed image of the CCTA-WVS demonstrated large and complex thoracic aortic plaques (B2 and B3), resulting in a thoracic aortic plaque score of 22 points (T3). One hundred and twenty-four days after the CCTA-WVS examination, the patient had neurological defects, including staggering gait. Brain magnetic resonance imaging revealed an acute infarct area in the right hypothalamus in the diffusion weighted image (C, red arrowhead). CAD, coronary artery disease; CCTA, coronary computed tomography angiography; WVS, wide volume scan.
Primary End Point
The primary endpoint of this study was the occurrence of a major adverse cardiovascular event (MACE), defined as composite events of cardiovascular death, acute coronary syndrome, and ischemic stroke. Acute coronary syndrome was defined as acute myocardial infarction (ST-segment elevation myocardial infarction and non-ST-segment elevation myocardial infarction) or unstable angina pectoris according to the American College of Cardiology/American Heart Association Guidelines. Acute myocardial infarction was defined as typical persistent chest pain with elevated cardiac enzymes 19) . Unstable angina was defined as new-onset angina, exacerbated angina symptomatic with light exertion, or angina that appeared at rest without elevated cardiac enzymes. Ischemic stroke was defined as the sudden onset of neurological signs or symptoms within focal or multifocal vascular territories, based on brain magnetic resonance imaging, that persisted for ≥ 24 hours or until death. A clinical follow-up was performed by interviewing the patients at each hospital visit; telephonic or electronic mail interviews were also conducted. If two or more events occurred, only the first event was included in the analysis.
Statistical Analysis
Statistical analysis was performed using SPSS version 24 (IBM Corp., Armonk, NY, USA) and R software package (version 4.2.2.; R Foundation for Statistical Computing, Vienna, Austria). Categorical variables are reported as counts (percentages) and continuous variables are reported as mean±standard deviation or median (interqurtile range). Variables were compared using the chi-square test for categorical variables, t-test for normally distributed variables, or Mann–Whitney U test for non-normally distributed variables. Inter- and intra-observer reproducibility of the CCTA image analyses were assessed using a subset of 30 analyzed images by Kappa statistics for the presence of aortic plaques and obstructive CAD, along with the intraclass correlation coefficients (ICCs) for the TAPB score. Spearman’s correlation was used to analyze the correlation between the variables. Univariate and multivariable models using Cox proportional hazard analysis were constructed to investigate the association with MACE. To examine whether the TAPB score (T3 versus T1 and T2) serves as a prognostic parameter of MACE independent of CCTA findings, variables entered in the multivariable models were selected on the basis of possible clinical plausibility, multicollinearity, and known association with CV death, ACS, or ischemic stroke, with the adjustment for Suita CVD risk score: Model 1: age, CACS >400, and TAPB score (T3); Model 2: age, obstructive CAD, and TAPB score (T3); Model 3: diabetes, CACS >400, and TAPB score (T3); and Model 4: diabetes, obstructive CAD, and TAPB score (T3). In addition, to take the effect of PCI on outcomes into account, we constructed multivariate Cox proportional hazard models for prediction of MACE that were adjusted by PCI within 3 months and Suita CVD risk score: Model 1: CACS >400 and TAPB score (T3); Model 2: obstructive CAD and TAPB score (T3); Model 3: CACS >400 and complex or large AAP; and Model 4: obstructive CAD and complex or large AAP. Using the Kaplan–Meier curve analysis, a time-to-event analysis for patients with independent predictors and combinations of predictors was performed. To test the hypothesis that the TAPB score would have additional diagnostic value over CCTA findings, multivariable ROC analyses adjusting for the TAPB score (T3 versus T1 and T2) and CACS >400 or obstructive CAD were performed, and the results of these analyses were compared with those of CACS or obstructive CAD. A p-value of <0.05 indicated statistical significance.
Results
Clinical Characteristics and CCTA-WVS Findings
All 455 patients who underwent a CCTA-WVS had images of suitable quality for analysis. The mean age was 65±13 years, and 51% (n=234) were male with a range of cardiovascular risk factors. The mean Suita CVD risk score was 27.0±10.9 points, and more than half of the patients had a 10-year CVD risk ≥ 9% ( Table 1 ) . As shown in Table 1 , patients with increased TAPB were likely to be older, have hypertension, diabetes mellitus, chronic kidney disease, and an increased Suita CVD risk score. The CCTA-WVS findings are shown in Table 2 . Patients with increased TAPB were likely to exhibit a higher prevalence of increased CAC score and have obstructive CAD with increased SIS and SSS ( Table 2 ) . Excellent inter- and intraobserver agreements were observed for the identification of AAPs (κ, 0.94 and 0.98), complex AAPs (κ, 0.91 and 0.94), large AAPs (κ, 0.88 and 0.92), and large/complex AAPs (κ, 0.90 and 0.92). Similar inter- and intraobserver ICCs were observed for the TAPB score (ICC, 0.95 and 0.96).
Table 1. Baseline clinical characteristics of patients according to TAPB.
|
Overall (N = 455) |
TAPB score, T1 (n = 150) |
TAPB score, T2 (n = 155) |
TAPB score, T3 (n = 150) |
p value for trend | |
|---|---|---|---|---|---|
| Age, years | 65 (13) | 55 (12) | 67 (10) | 73 (7.1) | <0.001 |
| Male, n (%) | 234 (51%) | 77 (51%) | 69 (44%) | 88 (57%) | 0.040 |
| Body mass index, kg/m2 | 24.1 (4.1) | 25.2 (4.5) | 23.5 (4.2) | 23.5 (3.4) | <0.001 |
| Hypertension, n (%) | 330 (74%) | 91 (60%) | 109 (70%) | 130 (87%) | <0.001 |
| Diabetes mellitus, n (%) | 105 (24%) | 16 (10%) | 32 (20%) | 57 (38%) | <0.001 |
| Dyslipidemia, n (%) | 318 (71%) | 104 (69%) | 107 (69%) | 107 (74%) | 0.894 |
| Current smoker, n (%) | 68 (15%) | 20 (13%) | 20 (13%) | 28 (19%) | 0.294 |
| Atrial fibrillation, n (%) | 53 (12%) | 13 (8.6%) | 15 (9.6%) | 25 (17%) | 0.062 |
| CKD, n (%) | 116 (26%) | 26 (17%) | 39 (25%) | 51 (34%) | 0.004 |
| Systolic blood pressure, mmHg | 142 (22) | 137 (21) | 143 (22) | 147 (21) | 0.001 |
| Diastolic blood pressure, mmHg | 80 (14) | 80 (14) | 81 (14) | 78 (15) | 0.357 |
| Heart rate, bpm | 77 (15) | 75 (15) | 80 (14) | 78 (15) | 0.334 |
| Laboratory test | |||||
| HDL-cholesterol,mg/dL | 63 (18) | 62 (16) | 65 (20) | 61 (19) | 0.123 |
| LDL-cholesterol, mg/dL | 124 (36) | 129 (36) | 121 (34) | 124 (37) | 0.281 |
| Hemoglobin, g/dL | 14 (1.7) | 14.2 (1.4) | 13.8 (1.9) | 13.8 (1.6) | 0.035 |
| HbA1c, % | 6.1 (1.1) | 5.9 (1.3) | 6.0 (1.0) | 6.3 (1.1) | 0.077 |
| CRP, g/dL | 0.29 (0.65) | 0.20 (0.31) | 0.26 (0.58) | 0.40 (0.91) | 0.078 |
| Suita CVD risk score | 27.0 (10.9) | 18.6 (9.9) | 27.9 (8.7) | 34.5 (7.5) | <0.001 |
| 0–20 points (10-year risk, ≤ 2 %) | 131 (29.4%) | 95 (63%) | 34 (22%) | 2 (1.3%) | <0.001 |
| 21–25 points (10-year risk, 6%) | 75 (16.8%) | 23 (15%) | 35 (23%) | 16 (11%) | 0.018 |
| 26–30 points (10-year risk, 9%) | 61 (13.7%) | 13 (8.6%) | 27 (17%) | 23 (15%) | 0.095 |
| 31–35 points (10-year risk, 15%) | 67 (15%) | 6 (4.0%) | 25 (16%) | 36 (24%) | <0.001 |
| ≥ 36 points (10-year risk, 26%) | 121 (27.1%) | 13 (8.6%) | 35(23%) | 73 (49%) | <0.001 |
| Medication before CCTA examination | |||||
| Aspirin, n (%) | 24 (5.2%) | 1 (0.6%) | 9 (5.8%) | 14 (9.3%) | 0.003 |
| Clopidogrel, n (%) | 23 (5.1%) | 4 (2.6%) | 12 (7.7%) | 7 (4.6%) | 0.125 |
| Warfarin, n (%) | 6 (1.3%) | 1 (0.6%) | 2 (1.3%) | 3 (2.0%) | 0.599 |
| Oral anticoagulant agents, n (%) | 24 (5.2%) | 9 (6.0%) | 6 (3.8%) | 11 (7.3%) | 0.421 |
| RAS inhibitor, n (%) | 103 (23%) | 17 (11%) | 33 (21%) | 53 (35%) | <0.001 |
| Calcium-channel blocker, n (%) | 125 (27%) | 31 (20%) | 42 (27%) | 52 (35%) | 0.025 |
| Beta-blocker, n (%) | 23 (5.1%) | 6 (4.0%) | 6 (3.8%) | 11 (7.3%) | 0.298 |
| Statins, n (%) | 114 (25%) | 33 (22%) | 35 (23%) | 46 (31%) | 0.152 |
| Oral-antidiabetic drugs or insulin, n (%) | 66 (15%) | 7 (4.6%) | 21 (14%) | 38 (25%) | <0.001 |
Variables are reported as numbers (%), mean (standard deviation).
CKD was defined as an estimated glomerular filtration rate of <60 ml/min/1.73 m2.
0–20 points, 10-year risk ≤ 2%; 21–25 points, 10-year risk of 6%; 26-30 points, 10-year risk of 9%; 31–35 points, 10-year risk of 15%; 5) ≥ 36 points, 10-year risk of 26%
CKD, chornic kidney disease; HDL, high-density lipoproteins; LDL, low-density lipoproteins, HbA1c, glycated hemoglobin; CRP, C-reactive protein; CCTA, coronary computed tomography angiography; RAS, renin-angiotensin system; TAPB, thoracic aortic plaque burden
Table 2. Findings of coronary computed tomography angiography with wide volume scan.
|
Overall n = 455 |
TAPB score, T1 (n = 150) |
TAPB score, T2 (n = 155) |
TAPB score, T3 (n = 150) |
p value for trend | |
|---|---|---|---|---|---|
| CAC score | 193 (485) | 39.3 (182.2) | 97.3 (183.4) | 447.0 (743.1) | <0.001 |
| 0 | 191 (42.9%) | 107 (71.3%) | 61 (39.3%) | 23 (15.3%) | <0.001 |
| 0-100 | 122 (26.8%) | 30 (20%) | 51 (32.9%) | 41 (27.3%) | 0.039 |
| 101–400 | 92 (20.6%) | 11 (7.3%) | 36 (23.2%) | 45 (30%) | <0.001 |
| >400 | 50 (11.2%) | 2 (1.3%) | 7 (4.5%) | 41 (27.3%) | <0.001 |
| Nonobstructive CAD | 181 (39.7%) | 67 (44.6%) | 64 (41.3%) | 50 (33.3%) | 0.120 |
| Obstructive CAD | 190 (41.7%) | 30 (20%) | 67 (43.2%) | 93 (62%) | <0.001 |
| 1-vessel disease | 121 (27.1%) | 22 (14.6%) | 44 (28.3%) | 55 (36.6%) | <0.001 |
| 2- or 3-vessel disease | 69 (15.5%) | 8 (5.3%) | 23 (14.8%) | 38 (25.3%) | <0.001 |
| SIS | 2.0 (0−4) | 1.5 (0.5) | 2.9 (2.4) | 3.9 (3.0) | <0.001 |
| SSS | 4.0 (0−10) | 3.2 (4.1) | 6.3 (5.7) | 9.7 (8.6) | <0.001 |
| TAPB score, total | 6.0 (1−12) | 0.0 (0.0−0.0) | 6.0 (4.0−7.0) | 15.0 (12.0−19.0) | <0.001 |
| Aortic root | 0.0 (0−2.0) | 0.0 (0.0−0.0) | 0.0 (0.0−0.0) | 2.0 (1.0−3.0) | <0.001 |
| Ascending aorta | 0.0 (0−2.0) | 0.0 (0.0−0.0) | 0.0 (0.0−0.0) | 2.0 (1.0−3.0) | <0.001 |
| Aortic arch | 2.0 (0-4.0) | 0.0 (0.0−0.0) | 2.0 (0.0−3.0) | 4.0 (3.0−5.0) | <0.001 |
| Arch branches | 0.0 (0−3.0) | 0.0 (0.0−0.0) | 0.0 (0.0−0.0) | 4.0 (0.0−5.0) | <0.001 |
| Descending aorta | 3.0 (1-12) | 0.0 (0.0−0.0) | 3.0 (2.0−3.0) | 4.0 (3.0−5.0) | <0.001 |
| Presence of complex or large plaque | |||||
| Aortic arch complex plaque | 40 (8.7%) | 0 (0%) | 1 (0.6%) | 39 (26%) | <0.001 |
| Complex plaques in any aortic segments | 173 (38%) | 9 (6.0%) | 48 (31%) | 116 (77%) | <0.001 |
| Aortic arch large plaque | 30 (6.6%) | 0 (0%) | 3 (1.9%) | 27 (48.6%) | <0.001 |
| Large plaques in any aortic segments | 79 (17.8%) | 0 (0%) | 18 (3.9%) | 61 (40.6%) | <0.001 |
Variables are reported as numbers (%) or mean±standard deviation or median (interquartile ranges).
CCTA-WVS, coronary computed tomography angiography-wide volume scan; CAC, coronary artery calcification; CAD, coronary artery disease; SIS, segment involvement score; SSS, stenosis severity score; TAPB, thoracic aortic plaque burden
Fig.3 illustrates the prevalence of CACS category, non-obstructive and obstructive CAD, and the tertiles for TAPB scores according to the Suita CVD risk score category. Compared to a Suita CVD risk score ≤ 20, a Suita CVD risk score ≥ 21 was associated with an increased prevalence of CACS, CAD, and TAPB score severity ( Fig.3 ) . There was a moderate correlation between a Suita CVD risk score and CACS (ρ=0.533; p<0.001) and a Suita CVD risk score and a TAPB score (ρ=0.634; p<0.001). There was a weak to moderate correlation between a Suita CVD risk score and SIS (ρ=0.362; p<0.001) and a weak correlation between the Suita CVD risk score and SSS (ρ=0.361; p<0.001).
Fig.3. Prevalence of coronary artery calcium score, coronary artery disease, and thoracic aortic plaque burden score according to the estimated 10-year risk of cardiovascular disease.

(A) Prevalence of CACS category according to the estimated 10-year risk of cardiovascular disease (Suita CVD risk score). (B) Prevalence of the absence of CAD, non-obstructive CAD, and obstructive CAD according to the estimated 10-year risk of cardiovascular disease. (C) Prevalence of TAPB score (T1, T2, and T3) according to the estimated 10-year risk of cardiovascular disease.
CACS, coronary artery calcium score; CAD, coronary artery disease; CVD, cardiovascular disease; TAPB, thoracic aortic plaque burden.
Predictors of MACE
During a mean follow-up period of 2.8±0.9 years (median, 3.0 years, interquartile range, 2.3−3.4 years), MACE was observed in 40 of 455 patients (8.8%; 9 cardiovascular deaths, 18 cases of ACS, and 13 cases of ischemic stroke). Table 3 shows the results of univariate Cox proportional hazard analysis to predict MACE during follow-up. Predictors associated with MACE were advanced age, diabetes mellitus, Suita CVD risk score, obstructive CAD, CACS >400, TAPB score (T3), large AAP, and complex AAP ( Table 3 ) .
Table 3. Cox proportional hazards model for prediction of MACE during follow-up.
| Variable | Crude model (unadjusted model) | |
|---|---|---|
| HR (95% CI) | p-value | |
| Age per 1 year increase | 1.06 (1.02−1.09) | 0.001 |
| Male sex | 2.60 (1.23−5.46) | 0.012 |
| Diabetes mellitus | 4.14 (2.22−7.72) | <0.001 |
| AF | 1.30 (0.55−3.11) | 0.549 |
| CKD | 1.29 (0.66−2.55) | 0.451 |
| Suita CVD risk score | 1.08 (1.05−1.12) | <0.001 |
| CACS >400 | 5.15 (2.68−9.91) | <0.001 |
| Obstructive CAD | 6.38 (2.94−13.86) | <0.001 |
| PCI within 3 months after index CCTA | 2.08 (0.920−4.738) | 0.078 |
| TAPB score: T3 versus T1 and T2 | 5.81 (2.90−11.63) | <0.001 |
| Large AAP | 5.85 (2.85−12.03) | <0.001 |
| Complex AAP | 3.56 (1.69−7.526) | 0.001 |
AAP, aortic arch plaque; AF, atrial fibrillation; CAD, coronary artery disease; CACS, coronary artery calcium score; CCTA, coronary computed tomography angiography; CKD, chronic kidney disease; CI, confidence interval; CVD, cardiovascular disease; MACE, major adverse cardiovascular event; PCI, percutaneous coronary intervention; TAPB, thoracic aortic plaque burden
The Cox proportional hazard model adjusted by age and Suita CVD risk score demonstrated that the TAPB score (T3) was a predictor of MACE independent of CACS >400 ( Table 4 model 1). In the multivariable model adjusted for age, the Suita CVD risk score, TAPB score (T3), and obstructive CAD remained as independent predictors of MACE ( Table 4 , Model 2). With further investigation of the association of TAPB score with MACE, the TAPB score (T3) was associated with MACE, even after adjustment for diabetes and the Suita CVD risk score ( Table 4 Models 3 and 4). Similarly, a multivariable model adjusted by PCI demonstrated that the TAPB score (T3) (Models 1 and 2 in Supplementary Table 1 ) and complex or large AAP (Models 3 and 4 in Supplementary Table 1 ) were independently associated with MACE. There was no multicollinearity among the variables. Associations of an increased TAPB score with MACE were observed even in the subgroup analysis of patients with nonobstructive CAD (univariate model in Supplementary Table 2 ) and those without PCI (multivariable models in Supplementary Table 3 ). 3
Table 4. Multivariate Cox proportional hazards models for prediction of MACE during follow-up.
| Variable | Adjusted model 1 | ||
| Hazard ratio | 95% confidence interval | p-value | |
| Age per 1 increase | 0.56 | 0.94−1.03 | 0.569 |
| CACS >400 | 2.24 | 1.10−4.54 | 0.025 |
| TAPB score (T3 versus T1 and T2) | 2.91 | 1.26−6.72 | 0.012 |
| Suita CVD risk score | 1.05 | 1.01−1.11 | 0.017 |
| Adjusted model 2 | |||
| Age per 1 increase | 0.98 | 0.94−1.03 | 0.553 |
| Obstructive CAD | 3.90 | 1.76−8.66 | 0.001 |
| TAPB score (T3 versus T1 and T2) | 2.83 | 1.30−6.18 | 0.009 |
| Suita CVD risk score | 1.05 | 1.007−1.10 | 0.024 |
| Adjusted model 3 | |||
| Diabetes | 1.96 | 0.96−4.03 | 0.065 |
| CACS >400 | 1.99 | 0.97−4.07 | 0.059 |
| TAPB score (T3 versus T1 and T2) | 2.81 | 1.24−6.36 | 0.013 |
| Suita CVD risk score | 1.03 | 0.99−1.08 | 0.114 |
| Adjusted model 4 | |||
| Diabetes | 1.95 | 0.95−4.03 | 0.069 |
| Obstructive CAD | 3.71 | 1.66−8.30 | 0.001 |
| TAPB score (T3 versus T1 and T2) | 2.65 | 1.23−5.75 | 0.013 |
| Suita CVD risk score | 1.03 | 0.98−1.07 | 0.202 |
CAD, coronary artery disease; CACS, coronary artery calcification score; CVD, cardiovascular disease; MACE, major adverse cardiovascular event; TAPB, thoracic aortic plaque burden
Supplementary Table 1. Multivariate Cox proportional hazards models for prediction of MACE during follow-up in study patients (n = 455) .
| Variable | Adjusted model 1 | ||
| Hazard ratio | 95% confidence interval | p-value | |
| CACS >400 | 2.75 | 1.26−6.02 | 0.011 |
| TAPB score (T3 versus T1 and T2) | 2.88 | 1.28−6.45 | 0.010 |
| PCI within 3 months after index CCTA | 0.62 | 0.24−1.58 | 0.314 |
| Suita CVD risk score | 1.05 | 1.01−1.09 | 0.014 |
| Adjusted model 2 | |||
| Obstructive CAD | 3.97 | 1.79−8.82 | 0.001 |
| TAPB score (T3 versus T1 and T2) | 2.78 | 1.29−6.02 | 0.009 |
| PCI within 3 months after index CCTA | 0.85 | 0.36−1.96 | 0.701 |
| Suita CVD risk score | 1.05 | 1.01−1.09 | 0.022 |
| Adjusted model 3 | |||
| CACS >400 | 3.16 | 1.45−6.92 | 0.004 |
| Complex or large AAP | 1.88 | 0.93−3.78 | 0.076 |
| PCI within 3 months after index CCTA | 0.65 | 0.26−1.66 | 0.377 |
| Suita CVD risk score | 1.06 | 1.02−1.09 | 0.001 |
| Adjusted model 4 | |||
| Obstructive CAD | 4.10 | 1.82−9.23 | 0.001 |
| Complex or large AAP | 1.59 | 0.79−3.19 | 0.186 |
| PCI within 3 months after index CCTA | 0.95 | 0.40−2.23 | 0.910 |
| Suita CVD risk score | 1.06 | 1.02−1.10 | 0.002 |
AAP, aortic arch plaque; CAD, coronary artery disease; CACS, coronary artery calcification score; CI, confidence interval; CVD, cardiovascular disease; MACE, major adverse cardiovascular event; PCI, percutaneous coronary intervention; TAPB, thoracic aortic plaque burden
Supplementary Table 2. Univariate Cox proportional hazards model for prediction of MACE during follow-up in patients without obstructive CAD (n = 265) .
| Variable | Crude model (unadjusted model) | |
|---|---|---|
| HR (95%CI) | P-value | |
| Age per 1 year increase | 1.01 (0.959−1.073) | 0.612 |
| Male sex | 1.44 (0.345−6.075) | 0.613 |
| Diabetes mellitus | 9.09 (2.15−38.37) | 0.003 |
| AF | 0.04 (0.000−720.44) | 0.523 |
| CKD | 3.32 (0.823−13.40) | 0.092 |
| Suita CVD risk score | 1.07 (1.004−1.140) | 0.036 |
| CACS >400 | 5.80 (0.696−48.34) | 0.104 |
| Non-obstructive CAD | 3.20 (0.39−26.04) | 0.276 |
| TAPB score: T3 versus T1 and T2 | 6.13 (1.46−25.70) | 0.013 |
| Large AAP | 2.17 (0.26−18.09) | 0.472 |
| Complex AAP | 2.06 (0.248−17.19) | 0.502 |
AAP, aortic arch plaque; AF, atrial fibrillation; CAD, coronary artery disease; CACS, coronary artery calcification score; CKD, chronic kidney disease; CI, confidence interval; CVD, cardiovascular disease; MACE, major adverse cardiovascular event; TAPB, thoracic aortic plaque burden
MACE was observed in 8 patients without obstructive CAD.
Supplementary Table 3. Multivariable Cox proportional hazards models for prediction of MACE during follow-up in patients without PCI (n = 403) .
| Variable | Adjusted model 1 | ||
| Hazard ratio | 95% confidence interval | p-value | |
| Age per 1 increase | 0.69 | 0.94−1.04 | 0.690 |
| CACS >400 | 3.69 | 1.65−8.24 | 0.001 |
| TAPB score (T3 versus T1 and T2) | 2.93 | 1.22−7.03 | 0.016 |
| Suita CVD risk score | 1.06 | 1.01−1.11 | 0.028 |
| Adjusted model 2 | |||
| Age per 1 increase | 0.98 | 0.94−1.03 | 0.553 |
| Obstructive CAD | 4.30 | 1.83−10.1 | 0.001 |
| TAPB score (T3 versus T1 and T2) | 2.93 | 1.27−6.77 | 0.011 |
| Suita CVD risk score | 1.06 | 1.007−1.11 | 0.027 |
| Adjusted model 3 | |||
| Diabetes | 2.03 | 0.88−4.66 | 0.095 |
| CACS >400 | 2.82 | 1.20−6.65 | 0.017 |
| TAPB score (T3 versus T1 and T2) | 2.83 | 1.20−6.58 | 0.017 |
| Suita CVD risk score | 1.04 | 0.99−1.08 | 0.098 |
| Adjusted model 4 | |||
| Diabetes | 2.51 | 1.13−5.58 | 0.024 |
| Obstructive CAD | 4.12 | 1.73−9.78 | 0.001 |
| TAPB score (T3 versus T1 and T2) | 2.76 | 1.21−6.30 | 0.015 |
| Suita CVD risk score | 1.03 | 0.98−1.08 | 0.277 |
CAD, coronary artery disease; CACS, coronary artery calcification score; CVD, cardiovascular disease; MACE, major adverse cardiovascular event; TAPB, thoracic aortic plaque burden
MACE was observed in 33 patients without PCI.
Cumulative MACE rates for the tertiles of the TAPB score are shown in Fig.4A . Patients with a higher TAPB score experienced higher rates of MACE (2.0%, 5.2%, and 19.3% in patients with TAPB scores grouped as T1, T2, and T3, respectively; log-rank p<0.001, Fig.4A ). Furthermore, patients with TAPB (T3) and obstructive CAD had the highest rate for MACE among the groups stratified by the presence and absence of TAPB (T3) and obstructive CAD (log rank p<0.001, Fig.4B ). Fig.5A displays a good diagnostic value of a TAPB score (T3) in predicting MACE (area under the curve [AUC], 0.717), with a sensitivity of 0.708 and specificity of 0.725. The addition of the TAPB score (T3) significantly improved AUC in predicting MACE by CACS >400 (AUC, from 0.632 to 0.751; p value, 0.0009; Fig.5A ), obstructive CAD (AUC, from 0.71 to 0.781; p value, 0.018; Fig.5B ), and CACS >400 and obstructive CAD (AUC, from 0.75 to 0.795; p value, 0.008; Fig.5D ).
Fig.4. Cumulative event rates for major adverse cardiovascular events stratified by TAPB score.

(A) Cumulative rates for MACE stratified by the TAPB score categories. (B and C) Cumulative rates for MACE stratified by the presence or absence of TAPB score in the third tertile (T3) and CACS >400 (B) or obstructive CAD (C). P-values were obtained using the log-rank test (A) TAPB scores, T3 vs. T1; (B) TAPB score T3 (+) and CACS >400 (+) vs. TAPB score T3 (-) and CACS >400 (-); (C) TAPB score T3 (+) and obstructive CAD (+) vs. TAPB score T3 (-) and obstructive CAD (-).
CACS, coronary artery calcium score; CAD, coronary artery disease; MACE, major adverse cardiovascular events; TAPB, thoracic aortic plaque burden.
Fig.5. Receiver operating curve analysis in predicting major adverse cardiovascular events.

(A) The AUC for TAPB score in the third tertile (T3) in predicting MACE was 0.717. (B) By adding the TAPB score (T3) on CACS >400, AUC in predicting MACE was improved from 0.632 to 0.751 (p value, 0.0009). Similarly, addition of the TAPB score (T3) significantly enhanced the AUC by (C) obstructive CAD (AUC, from 0.71 to 0.781; p value, 0.018), and (D) CACS >400 and obstructive CAD (AUC, from 0.75 to 0.795; p value, 0.008).
AUC, area under the curves; CAD, coronary artery disease; MACE, major adverse cardiovascular events; TAPB, thoracic aortic plaque burden.
Discussion
This study demonstrates the prognostic capacity of the TAPB score to predict MACE in patients with suspected CAD who underwent CCTA-WVS. The major findings of the present study are as follows: (1) increased TAPB score was a predictor of MACE independent of clinical risk score, CACS, and obstructive CAD and (2) the extent of TAPB was an independent predictor of MACE in this population with an additional predictive value from CCTA findings. Our findings indicated that CCTA-WVS enables comprehensive assessment of atherosclerotic alterations in the thoracic aorta and coronary arteries and provides additional prognostic risk stratification for MACE in patients with suspected CAD undergoing CCTA.
Clinical risk factors are well correlated with atherosclerotic disease burden. Yet, there remains a discordance between the risk factors and incident rates of cardiovascular events 20 , 21) , suggesting that an imaging marker approach is required for better prediction of cardiovascular events beyond clinical risks. CAD is a chronic inflammatory disease that progresses without symptoms 5) . Similarly, aortic atherosclerosis evolves without clinical manifestations 22) . Clinical trials have demonstrated that factors other than atrial fibrillation can lead to stroke, such as carotid artery stenosis, aortic plaques, and intracranical atherosclerosis 4 , 23 , 24) . A recent intraaortic imaging study demonstrated that spontaneous aortic plaque rupture occurs frequently 25) . Furthermore, large and complex aortic plaques have been shown to be associated with silent brain infarction and damage in elderly patients without overt stroke 4) . Although AAP has been reported as the predictor of CVD events in patients with stroke 3 , 4) , the literature regarding its prognostic impact in patients without known CAD is limited 11) .
An autopsy study investigating 500 patients reported that ulcerated AAP was more commonly observed in patients with an unknown cause of cerebral infarction than in those with a known cause of cerebral infarction (57.8% versus 20.2%, respectively) 26) . Using CT angiography, Kurra, et al. demonstrated that semi-quantitative assessment of the TAPB score predicts all-cause mortality in patients who undergo cardiac surgery 18) . Furthermore, a recent study using positron emission tomography and CT demonstrated that the thoracic aortic 18F-sodium fluoride activity offers prediction of stroke in patients with established CVD 27) , suggesting the importance of assessing aortic arch atherosclerosis. In contrast to positron emission tomography and CT, our method is in line with daily clinical practice. Given that CCTA is a first-line of defense non-invasive diagnostic test to assess the presence, severity, and extent of CAD 5 , 6 , 28) , TAPB scores assessed by CCTA-WVS provide a comprehensive risk assessment of CVD in patients with suspected CAD undergoing CCTA.
In the present study, the MACE incident rates during a nearly 3-year follow-up were higher than that of the estimated 10-year risk by Suita CVD risk score. This might be partly explained by the fact that our study population had undergone CCTA examination for chest symptoms, whereas the Suita CVD risk score was derived from subjects without any evidence or symptoms of CVD 14) . In addition, our study population consisted of Asians from an aging population 2) , and more than half of the patients had an increased risk of ASCVD (55.8%, 10-year estimated risk of ≥ 9%). The utility of a Suita CVD risk score has been well validated against the Framingham risk score in the Japanese population 14) . Future studies will be needed to confirm whether TAPB scores predict MACE in other populations.
From the perspective of targeting atherosclerosis, lipid-lowering therapy such as proprotein convertase subtilisin/kexin type 9, ezetimibe, and eicosapentaenoic acid in combination with statins has been shown to provide improved outcomes in patients with ACS and stable CAD 29 - 31) . A systematic review demonstrated that lipid lowering therapy can reduce atheroma burden of carotid, coronary, and aortic plaques after treatment for an average of 19.7 months 32) . In line with this, a transesophageal echocardiographic study in Japanese patients with ischemic stroke demonstrated that 5-mg rosuvastatin treatment for 6 months reduced aortic plaque area together with a marked reduction in LDL-cholesterol 33) . Further study is required to investigate whether a lipid-lowering therapy can reduce TAPB score in patients without previous CVD. For secondary prevention of stroke, the current guidelines recommend antiplatelet and statin therapy for patients with ischemic stroke or transient ischemic attack 15 , 34) . In a randomized trial investigating ischemic stroke in patients with AAP >4 mm thick, Amarenco et al. have reported no significant effect of dual antiplatelet therapy (aspirin, 75–150 mg/day, plus clopidogrel, 75 mg/day) over warfarin therapy (international normalized ratio, 2–3) for preventing the composite endpoint of cerebral infarction, myocardial infarction, peripheral embolism, intracranial hemorrhage or death due to vascular causes 35) . In addition, intensive LDL cholesterol lowering therapy has been shown to prevent recurrent events in patients with ischemic stroke 36) . Our present CCTA study indicates that a TAPB score assessed simultaneously with CAD can serve as a predictor of MACE independently of obstructive CAD, suggesting that early identification of patients with increased TAPB scores may facilitate more intensive statin therapy and lifestyle modifications. Future investigations focusing on whether pharmacological interventions and lifestyle modifications are effective for CVD prevention in patients with increased TAPB are warranted.
Limitations
Our findings should be considered in the perspective of the potential limitations of this study. First, we assessed TAPB using a semiquantitative method requiring post-hoc analysis 18) . However, the principal strength of CCTA-WVS imaging acquisition is its reasonable time extension and interpretation of images over conventional CCTA imaging. Second, the event rate during follow-up was relatively high in this study. In addition to this study population having chest symptoms, this may be explained by the relatively low rate of medications at baseline. With respect to background medication for cardiovascular risks, baseline use of statins in the present study was generally low (25%), although patients were treated according to the current guidelines following CCTA results. Third, to calculate the Suita CVD risk score, we excluded patients aged ≥ 80 years in this study. Hence, our findings should be generalized for patients aged <80 years. Finally, since this is an observational study, the treatment strategy based on CCTA-WVS results varied between different clinicians and the choice of care decisions taken by each patient in light of the contemporary clinical guidelines 16) . CCTA-WVS findings may cause uncertainty in therapeutic indications based on TAPB scores and CAD diagnosis. Future prospective studies are necessary to investigate the effective therapeutic intervention for CAD and increased TAPB scores in this population.
Conclusions
Our present data showed that CCTA-WVS offers a unique opportunity to assess TAPB together with CAD in patients who underwent CCTA with a 320-row multidetector CT, demonstrating the prognostic capacity of the TAPB score for MACE independent of CAD. Future prospective studies are warranted to examine the clinical benefit of CCTA-WVS in the prediction of MACE, especially focusing on ischemic stroke in this population.
Financial Support
This work was partially supported by a Research Grant from Fukuda Foundation for Medical Technology.
Author Contributions
K.O. and K.S. contributed to the conception or design of the work. K.O., H.I., K.H., H.Y., Y.K., K.S. and N.K. contributed to the acquisition, analysis, or interpretation of data. K.O. drafted the manuscript. D.F. critically revised the manuscript. All authors reviewed the manuscript, gave final approval, and agreed to be accountable for all aspects of the manuscript to ensure integrity and accuracy.
Acknowledgements
We would like to thank Editage (www.editage.com) for English language editing.
Conflict of Interest
None declared.
References
- 1).Virani SS, Alonso A, Benjamin EJ, Bittencourt MS, Callaway CW, Carson AP, Chamberlain AM, Chang AR, Cheng S, Delling FN, Djousse L, Elkind MSV, Ferguson JF, Fornage M, Khan SS, Kissela BM, Knutson KL, Kwan TW, Lackland DT, Lewis TT, Lichtman JH, Longenecker CT, Loop MS, Lutsey PL, Martin SS, Matsushita K, Moran AE, Mussolino ME, Perak AM, Rosamond WD, Roth GA, Sampson UKA, Satou GM, Schroeder EB, Shah SH, Shay CM, Spartano NL, Stokes A, Tirschwell DL, VanWagner LB, Tsao CW. Heart disease and stroke statistics—2020 update: A report from the American Heart Association. Circulation, 2020; 141: e139-596 [DOI] [PubMed] [Google Scholar]
- 2).Yasuda S, Miyamoto Y, Ogawa H. Current Status of Cardiovascular Medicine in the Aging Society of Japan. Circulation, 2018; 138: 965-967 [DOI] [PubMed] [Google Scholar]
- 3).Tullio MR Di, Russo C, Jin Z, Sacco RL, Mohr JP, Homma S. Aortic arch plaques and risk of recurrent stroke and death. Circulation, 2009; 119: 2376-2382 [DOI] [PMC free article] [PubMed] [Google Scholar]
- 4).Tugcu A, Jin Z, Homma S, Elkind MS V, Rundek T, Yoshita M, DeCarli C, Nakanishi K, Shames S, Wright CB, Sacco RL, Tullio MR Di. Atherosclerotic plaques in the aortic arch and subclinical cerebrovascular disease. Stroke, 2016; 47: 2813-2819 [DOI] [PMC free article] [PubMed] [Google Scholar]
- 5).Knuuti J, Wijns W, Saraste A, Capodanno D, Barbato E, Funck-Brentano C, Prescott E, Storey RF, Deaton C, Cuisset T, Agewall S, Dickstein K, Edvardsen T, Escaned J, Gersh BJ, Svitil P, Gilard M, Hasdai D, Hatala R, Mahfoud F, Masip J, Muneretto C, Valgimigli M, Achenbach S, Bax JJ. 2019 ESC Guidelines for the diagnosis and management of chronic coronary syndromes. Eur Heart J, 2020; 41: 407-477 [DOI] [PubMed] [Google Scholar]
- 6).Narula J, Chandrashekhar Y, Ahmadi A, Abbara S, Berman DS, Blankstein R, Leipsic J, Newby D, Nicol ED, Nieman K, Shaw L, Villines TC, Williams M, Hecht HS. SCCT 2021 Expert Consensus Document on Coronary Computed Tomographic Angiography: A Report of the Society of Cardiovascular Computed Tomography. J Cardiovasc Comput Tomogr, 2021; 15: 192-217 [DOI] [PMC free article] [PubMed] [Google Scholar]
- 7).Hecht HS, Blaha MJ, Kazerooni EA, Cury RC, Budoff M, Leipsic J, Shaw L. CAC-DRS: Coronary Artery Calcium Data and Reporting System. An expert consensus document of the Society of Cardiovascular Computed Tomography (SCCT). J Cardiovasc Comput Tomogr, 2018; 12: 185-191 [DOI] [PubMed] [Google Scholar]
- 8).Hoffmann U, Ferencik M, Udelson JE, Picard MH, Truong QA, Patel MR, Huang M, Pencina M, Mark DB, Heitner JF, Fordyce CB, Pellikka PA, Tardif J-C, Budoff M, Nahhas G, Chow B, Kosinski AS, Lee KL, Douglas PS. Prognostic value of noninvasive cardiovascular testing in patients with stable chest pain: insights from the PROMISE trial (Prospective Multicenter Imaging Study for Evaluation of Chest Pain). Circulation, 2017; 135: 2320-2332 [DOI] [PMC free article] [PubMed] [Google Scholar]
- 9).SCOT-HEART Investigators, Newby DE, Adamson PD, Berry C, Boon NA, Dweck MR, Flather M, Forbes J, Hunter A, Lewis S, MacLean S, Mills NL, Norrie J, Roditi G, Shah AS V, Timmis AD, Beek EJR van, Williams MC. Coronary CT Angiography and 5-Year Risk of Myocardial Infarction. N Engl J Med, 2018; 379: 924-933 [DOI] [PubMed] [Google Scholar]
- 10).Williams MC, Kwiecinski J, Doris M, McElhinney P, D’Souza MS, Cadet S, Adamson PD, Moss AJ, Alam S, Hunter A, Shah ASV, Mills NL, Pawade T, Wang C, Weir McCall J, Bonnici-Mallia M, Murrills C, Roditi G, Beek EJR Van, Shaw LJ, Nicol ED, Berman DS, Slomka PJ, Newby DE, Dweck MR, Dey D. Low-attenuation noncalcified plaque on coronary computed tomography angiography predicts myocardial infarction: results from the multicenter SCOT-HEART trial (Scottish Computed Tomography of the HEART). Circulation, 2020; 141: 1452-1462 [DOI] [PMC free article] [PubMed] [Google Scholar]
- 11).Otsuka K, Ishikawa H, Kono Y, Oku S, Yamaura H, Shirasawa K, Hirata K, Shimada K, Kasayuki N, Fukuda D. Aortic arch plaque morphology in patients with coronary artery disease undergoing coronary computed tomography angiography with wide-volume scan. Coron Artery Dis, 2022; 33: 531 [DOI] [PMC free article] [PubMed] [Google Scholar]
- 12).Hsiao EM, Rybicki FJ, Steigner M. CT coronary angiography: 256-slice and 320-detector row scanners. Curr Cardiol Rep, 2010; 12: 68-75 [DOI] [PMC free article] [PubMed] [Google Scholar]
- 13).Kang EJ. Clinical applications of wide-detector CT scanners for cardiothoracic imaging: An update. Korean J Radiol, 2019; 20: 1583-1596 [DOI] [PMC free article] [PubMed] [Google Scholar]
- 14).Nakai M, Watanabe M, Kokubo Y, Nishimura K, Higashiyama A, Takegami M, Nakao YM, Okamura T, Miyamoto Y. Development of a cardiovascular disease risk prediction model using the suita study, a population-based prospective cohort study in Japan. J Atheroscler Thromb, 2020; 27: 1160-1175 [DOI] [PMC free article] [PubMed] [Google Scholar]
- 15).Kinoshita M, Yokote K, Arai H, Iida M, Ishigaki Y, Ishibashi S, Umemoto S, Egusa G, Ohmura H, Okamura T, Kihara S, Koba S, Saito I, Shoji T, Daida H, Tsukamoto K, Deguchi J, Dohi S, Dobashi K, Hamaguchi H, Hara M, Hiro T, Biro S, Fujioka Y, Maruyama C, Miyamoto Y, Murakami Y, Yokode M, Yoshida H, Rakugi H, Wakatsuki A, Yamashita S; Committee for Epidemiology and Clinical Management of Atherosclerosis. Japan Atherosclerosis Society (JAS) guidelines for prevention of atherosclerotic cardiovascular diseases 2017. J Atheroscler Thromb, 2018; 25: 846-984 [DOI] [PMC free article] [PubMed] [Google Scholar]
- 16).Nakamura M, Yaku H, Ako J, Arai H, Asai T, Chikamori T, Daida H, Doi K, Fukui T, Ito T, Kadota K, Kobayashi J, Komiya T, Kozuma K, Nakagawa Y, Nakao K, Niinami H, Ohno T, Ozaki Y, Sata M, Takanashi S, Takemura H, Ueno T, Yasuda S, Yokoyama H, Fujita T, Kasai T, Kohsaka S, Kubo T, Manabe S, Matsumoto N, Miyagawa S, Mizuno T, Motomura N, Numata S, Nakajima H, Oda H, Otake H, Otsuka F, Sasaki KI, Shimada K, Shimokawa T, Shinke T, Suzuki T, Takahashi M, Tanaka N, Tsuneyoshi H, Tojo T, Une D, Wakasa S, Yamaguchi K, Akasaka T, Hirayama A, Kimura K, Kimura T, Matsui Y, Miyazaki S, Okamura Y, Ono M, Shiomi H, Tanemoto K; Japanese Circulation Society Joint Working Group. JCS/JSCVS 2018 Guideline on Revascularization of Stable Coronary Artery Disease. Circ J, 2022; 86: 477-588 [DOI] [PubMed] [Google Scholar]
- 17).Shi R, Shi K, Yang ZG, Guo YK, Diao KY, Gao Y, Zhang Y, Huang S. Serial coronary computed tomography angiography-verified coronary plaque progression: Comparison of stented patients with or without diabetes. Cardiovasc Diabetol, 2019; 18: 123 [DOI] [PMC free article] [PubMed] [Google Scholar]
- 18).Kurra V, Lieber ML, Sola S, Kalahasti V, Hammer D, Gimple S, Flamm SD, Bolen MA, Halliburton SS, Mihaljevic T, Desai MY, Schoenhagen P. Extent of thoracic aortic atheroma burden and long-term mortality after cardiothoracic surgery: a computed tomography study. JACC Cardiovasc Imaging, 2010; 3: 1020-1029 [DOI] [PubMed] [Google Scholar]
- 19).Thygesen K, Alpert JS, Jaffe AS, Chaitman BR, Bax JJ, Morrow DA, White HD, Executive Group on behalf of the Joint European Society of Cardiology (ESC)/American College of Cardiology (ACC)/American Heart Association (AHA)/World Heart Federation (WHF) Task Force for the Universal Definition of Myocardial Infarction. Fourth universal definition of myocardial infarction (2018). J Am Coll Cardiol, 2018; 72: 2231-2264 [DOI] [PubMed] [Google Scholar]
- 20).Pen A, Yam Y, Chen L, Dennie C, McPherson R, Chow BJW. Discordance between Framingham Risk Score and atherosclerotic plaque burden. Eur Heart J, 2013; 34: 1075-1082 [DOI] [PubMed] [Google Scholar]
- 21).Joshi PH, Nasir K. Discordance between risk factors and coronary artery calcium: implications for guiding treatment strategies in primary prevention settings. Prog Cardiovasc Dis, 2015; 58: 10-18 [DOI] [PubMed] [Google Scholar]
- 22).Ahmadi A, Argulian E, Leipsic J, Newby DE, Narula J. From subclinical atherosclerosis to plaque progression and acute coronary events: JACC State-of-the-art review. J Am Coll Cardiol, 2019; 74: 1608-1617 [DOI] [PubMed] [Google Scholar]
- 23).Tao L, Li XQ, Hou XW, Yang BQ, Xia C, Ntaios G, Chen HS. Intracranial atherosclerotic plaque as a potential cause of embolic stroke of undetermined source. J Am Coll Cardiol, 2021; 77: 680-691 [DOI] [PubMed] [Google Scholar]
- 24).Ibanez B, Fernández-Ortiz A, Fernández-Friera L, García-Lunar I, Andrés V, Fuster V. Progression of Early Subclinical Atherosclerosis (PESA) study: JACC focus seminar 7/8. J Am Coll Cardiol, 2021; 78: 156-179 [DOI] [PubMed] [Google Scholar]
- 25).Komatsu S, Yutani C, Ohara T, Takahashi S, Takewa M, Hirayama A, Kodama K. Angioscopic evaluation of spontaneously ruptured aortic plaques. J Am Coll Cardiol, 2018; 71: 2893-2902 [DOI] [PubMed] [Google Scholar]
- 26).Amarenco P, Duyckaerts C, Tzourio C, Hénin D, Bousser MG, Hauw JJ. The prevalence of ulcerated plaques in the aortic arch in patients with stroke. N Engl J Med, 1992; 326: 221-225 [DOI] [PubMed] [Google Scholar]
- 27).Fletcher AJ, Tew YY, Tzolos E, Joshi SS, Kaczynski J, Nash J, Debono S, Lembo M, Kwiecinski J, Bing R, Syed MBJ, Doris MK, Beek EJR van, Moss AJ, Jenkins WS, Walker NL, Joshi N V, Pawade TA, Adamson PD, Whiteley WN, Wardlaw JM, Slomka PJ, Williams MC, Newby DE, Dweck MR. Thoracic aortic (18)f-sodium fluoride activity and ischemic stroke in patients with established cardiovascular disease. JACC Cardiovasc Imaging, 2022; 15: 1274-1288 [DOI] [PMC free article] [PubMed] [Google Scholar]
- 28).Otsuka K, Fukuda S, Tanaka A, Nakanishi K, Taguchi H, Yoshikawa J, Shimada K, Yoshiyama M. Napkin-ring sign on coronary CT angiography for the prediction of acute coronary syndrome. JACC Cardiovasc Imaging, 2013; 6: 448-457 [DOI] [PubMed] [Google Scholar]
- 29).Cannon CP, Blazing MA, Giugliano RP, McCagg A, White JA, Theroux P, Darius H, Lewis BS, Ophuis TO, Jukema JW, Ferrari GM De, Ruzyllo W, Lucca P De, Im K, Bohula EA, Reist C, Wiviott SD, Tershakovec AM, Musliner TA, Braunwald E, Califf RM, IMPROVE-IT Investigators. Ezetimibe added to statin therapy after acute coronary syndromes. N Engl J Med, 2015; 372: 2387-2397 [DOI] [PubMed] [Google Scholar]
- 30).Sabatine MS, Giugliano RP, Keech AC, Honarpour N, Wiviott SD, Murphy SA, Kuder JF, Wang H, Liu T, Wasserman SM, Sever PS, Pedersen TR. Evolocumab and clinical outcomes in patients with cardiovascular disease. N Engl J Med, 2017; 376: 1713-1722 [DOI] [PubMed] [Google Scholar]
- 31).Almeida SO, Budoff M. Effect of statins on atherosclerotic plaque. Trends Cardiovasc Med, 2019; 29: 451-455 [DOI] [PubMed] [Google Scholar]
- 32).Noyes AM, Thompson PD. A systematic review of the time course of atherosclerotic plaque regression. Atherosclerosis, 2014; 234: 75-84 [DOI] [PubMed] [Google Scholar]
- 33).Ueno Y, Yamashiro K, Tanaka Y, Watanabe M, Miyamoto N, Shimada Y, Kuroki T, Tanaka R, Miyauchi K, Daida H, Hattori N, Urabe T. Rosuvastatin may stabilize atherosclerotic aortic plaque: transesophageal echocardiographic study in the EPISTEME trial. Atherosclerosis, 2015; 239: 476-482 [DOI] [PubMed] [Google Scholar]
- 34).Kernan WN, Ovbiagele B, Black HR, Bravata DM, Chimowitz MI, Ezekowitz MD, Fang MC, Fisher M, Furie KL, Heck D V, Johnston SCC, Kasner SE, Kittner SJ, Mitchell PH, Rich MW, Richardson D, Schwamm LH, Wilson JA, American Heart Association Stroke Council, Council on Cardiovascular and Stroke Nursing, Council on Clinical Cardiology, and Council on Peripheral Vascular Disease. Guidelines for the prevention of stroke in patients with stroke and transient ischemic attack: a guideline for healthcare professionals from the American Heart Association/American Stroke Association. Stroke, 2014; 45: 2160-2236 [DOI] [PubMed] [Google Scholar]
- 35).Amarenco P, Davis S, Jones EF, Cohen AA, Heiss W-D, Kaste M, Laouénan C, Young D, Macleod M, Donnan GA. Clopidogrel plus aspirin versus warfarin in patients with stroke and aortic arch plaques. Stroke, 2014; 45: 1248-1257 [DOI] [PubMed] [Google Scholar]
- 36).Amarenco P, Kim JS, Labreuche J, Charles H, Abtan J, Béjot Y, Cabrejo L, Cha J-K, Ducrocq G, Giroud M, Guidoux C, Hobeanu C, Kim Y-J, Lapergue B, Lavallée PC, Lee B-C, Lee K-B, Leys D, Mahagne M-H, Meseguer E, Nighoghossian N, Pico F, Samson Y, Sibon I, Steg PG, Sung S-M, Touboul P-J, Touzé E, Varenne O, Vicaut É, Yelles N, Bruckert E; Treat Stroke to Target Investigators. A comparison of two LDL Cholesterol targets after ischemic stroke. N Engl J Med, 2020; 382: 9-19 [Google Scholar]