

Abstract
The potential for polycyclic aromatic hydrocarbons (PAHs) to have adverse effects that persist across generations is an emerging concern for human and wildlife health. This study evaluated the role of mitochondria, which are maternally inherited, in the cross-generational toxicity of benzo(a)pyrene (BaP), a model PAH and known mitochondrial toxicant. Mature female zebrafish (F0) were fed diets containing 0, 12.5, 125, or 1250 μg BaP/g at a feed rate of 1% body weight twice/day for 21 days. These females were bred with unexposed males, and the embryos (F1) were collected for subsequent analyses. Maternally-exposed embryos exhibited altered mitochondrial function and metabolic partitioning (i.e. the portion of respiration attributable to different cellular processes), as evidenced by in vivo oxygen consumption rates (OCRs). F1 embryos had lower basal and mitochondrial respiration and ATP turnover-mediated OCR, and increased proton leak and reserve capacity. Reductions in mitochondrial DNA (mtDNA) copy number, increases in mtDNA damage, and alterations in biomarkers of oxidative stress were also found in maternally-exposed embryos. Notably, the mitochondrial effects in offspring occurred largely in the absence of effects in maternal ovaries, suggesting that PAH-induced mitochondrial dysfunction may manifest in subsequent generations. Maternally-exposed larvae also displayed swimming hypoactivity. The lowest observed effect level (LOEL) for maternal BaP exposure causing mitochondrial effects in offspring was 12.5 μg BaP/g diet (nominally equivalent to 250 ng BaP/g fish). It was concluded that maternal BaP exposure can cause significant mitochondrial impairments in offspring.
Keywords: Benzo(a)pyrene, Cross-generational Toxicity, Mitochondria, Oxidative Stress, Polycyclic Aromatic Hydrocarbons, Zebrafish
1. Introduction
Polycyclic aromatic hydrocarbons (PAHs) are highly toxic ubiquitous environmental contaminants. While effects of adult or developmental PAH exposures are relatively well recognized, cross-generational effects of PAHs are an emerging concern. Prenatal and cross-generational exposures to PAHs are associated with adverse birth outcomes as well as later life disorders in humans and animal models (e.g. Perera 2013; Crépeaux 2012; Miller 2016). Studies with fish models report cross- and multi-generational effects of benzo(a)pyrene (BaP; a model PAH) on survival, hatching, development, behavior, and organismal aerobic respiration (Corrales 2014; Knecht 2017).
The mechanisms underlying the cross-generational toxicity of PAHs are poorly understood. Cross-generational effects likely arise from several factors, including the aryl hydrocarbon receptor pathway activation and cytochrome P450 (CYP) metabolism, DNA damage, genetic and epigenetic alterations, oxidative stress, induction of apoptosis, and endocrine disruption (Perera 2013). Heritable epigenetic changes can also play a significant role in the cross-generational toxicity of PAHs, including BaP (Corrales 2014; Knecht 2017).
Mitochondrial dysfunction and associated oxidative stress may contribute to the cross-generational toxicity of PAHs. Mitochondria are sensitive targets of PAHs due to accumulation of PAHs in the double membrane, generation of reactive PAH-metabolites by mitochondrial CYPs, and inability to remove bulky PAH-DNA lesions due to lack of the nucleotide excision repair pathway (Meyer 2013). PAHs induce irreparable mtDNA damage and affect mitochondrial morphology, respiratory functions (e.g. decreased membrane potential and adenosine triphosphate (ATP) production), and apoptosis signaling (Jung 2009; Meyer 2013; Du 2015). These effects of PAHs on mitochondria may persist across generations. For example, mitochondrial respiratory chain complex III deficiency and reduced mtDNA copy number are observed in placentas following maternal air pollution exposure or tobacco smoking (Bouhours-Nouet 2005; Clemente 2016). Prenatal PAH or cigarette smoke exposure in rodents leads to decreased mtDNA copy number, mitochondrial protein expression, and mitochondrial enzyme activity (Godschalk 2018), and mitochondrial dysfunction and oxidative stress in offspring (Crépeaux 2012; Lei 2018). Transgenerational BaP exposure reduces total basal OCRs in F2 zebrafish embryos and increases aerobic respiration in F2 adults (Knecht 2017).
To determine the impacts of maternal PAH exposure on mitochondrial function and integrity in offspring, herein we investigated cross-generational BaP toxicity in zebrafish (Danio rerio) – a preferred vertebrate model for multi-generational studies of environmental toxicants (Corrales 2014; Knecht 2017). In zebrafish, mtDNA is maternally inherited (Artuso 2012; Otten 2016), while DNA methylome is paternally inherited (Jiang 2013). DNA methylation is an epigenetic modification that plays an important role in embryogenesis, including influencing development and differentiation of various types of cells. In zebrafish, the oocyte methylome is hypomethylated relative to the sperm methylome. The maternal methylation pattern is maintained until the 16-cell stage, after which time it is passively demethylated through cell division. Meanwhile, by the midblastula stage, the embryo’s methylation pattern is reprogrammed to resemble that of the sperm, and thus the sperm methylome primarily facilitates the regulation of embryogenesis (Jiang 2013). Thus we only exposed F0 females to evaluate mitochondrial contributions to toxicity, while reducing epigenetic contributions. Using high throughput mitochondrial assays (Stackley 2011; Jayasundara 2015), we examined effects of maternal exposure to BaP on mitochondrial function and antioxidant defense systems in F0 ovaries as well as F1 embryos/larvae. Specifically, we aimed to determine whether (i) exposure to BaP affects bioenergetics in F0 ovaries, (ii) these effects persist in F1 offspring, and (iii) bioenergetics and antioxidant systems of F1 offspring are more sensitive to exposure and associated effects than F0 females.
2. Materials and Methods
2.1. Zebrafish Care
Wild-type (Tropical 5D) adult zebrafish were maintained in a recirculating AHAB system (Aquatic Habitats, Inc., Apopka, FL) on a 14:10 h light/dark cycle at 28–29°C, pH 7.0–7.5, and 60 ppm artificial seawater (ASW; Instant Ocean, Foster & Smith, Rhinelander, WI). Zebrafish were fed twice daily (AM and PM) ad libitum with Artemia nauplii and Zeigler’s Adult Zebrafish Complete Diet (Zeigler Bros., Inc., Gardners, PA).
2.2. Maternal (F0) Benzo(a)pyrene Exposure
Reproductively mature (~1 year old) female zebrafish (F0; N=15/treatment) were fed either vehicle-treated (control) or BaP-treated (nominal concentrations of 12.5, 125, or 1250 μg BaP/g diet) decapsulated brine shrimp eggs (see Supplement for analytical chemistry methods and measured concentrations; exposure regime adapted from Corrales et al. (2014)). F0 females were housed at a density of 5 fish/9.4 L aquarium (Pacific Coast Distributing, Inc., Phoenix, AZ) with three replicate tanks per treatment. Fish were allowed to acclimate for a week while being transitioned to a diet of untreated decapsulated brine shrimp eggs. The first day of the acclimation period and the day before the start of the exposure, the females were spawned with unexposed males to purge existing mature oocytes. Once the exposure started, females were fed 1% body weight twice/day of the corresponding BaP-treated food for 21 days (nominally equivalent to 0, 250, 2500, 25000 ng BaP/g fish/day). On day 22, the females were bred with unexposed males, and eggs were maintained in embryo medium (30% Danieau) at 28°C. On days 23 and 24, the females were euthanized for subsequent analyses.
2.3. Mitochondrial Function of Embryos and Tissues
Mitochondrial function and respiratory partitioning (i.e. the portion of respiration attributable to different cellular processes) were characterized ex vivo in F0 tissues and in vivo in F1 embryos using an Agilent XFe24 Extracellular Flux Analyzer (Agilent Technologies, Santa Clara, CA) at 28°C in XF24 islet capture microplates with at least two blank wells/plate. OCRs were measured before and after pharmacological induction (carbonyl cyanide 4-(trifluoromethoxy) phenylhydrazone (FCCP)) or inhibition (oligomycin and sodium azide or a mix of antimycin A and rotenone) (Sigma-Aldrich, St. Louis, MO) at concentrations listed in Table S1.
F0 female tissue-specific mitochondrial respiration was characterized ex vivo in ovary, heart, brain, and liver samples (4–5 females/tank, 3 tanks/treatment) using a high-throughput tissue bioenergetics analysis method, as previously described (Jayasundara 2015). Working concentrations for pharmacological inhibitors for various tissues can be found in Table S1. Briefly, fish were anesthetized in ice-cold water, euthanized by cervical dislocation, weighed, and dissected alternating between treatments. Whole heart and brain tissues, and <10 mg samples of liver and ovary tissues were weighed and placed in separate wells containing 525 μL Ringer’s solution (pH 7.0 at 28°C) for analysis.
Mitochondrial respiration was characterized in stage-matched F1 embryos lacking visual morphological abnormalities between 24–28 hours post fertilization (hpf) (2 embryos/well, 5–6 wells/maternal tank, 3 tanks/treatment in 700 μL of 65 ppm ASW), as previously described (Stackley 2011; Massarsky 2015). At 24–28 hpf, embryos have been through the mitochondrial bottleneck (Otten 2016) and primarily rely on oxidative phosphorylation (Stackley 2011).
2.4. mtDNA Damage and Copy Number
mtDNA damage and copy number were evaluated in F0 ovaries and F1 embryos. Ovary samples (10–20 mg) were collected from 4–5 F0 females (ovary size permitting) per treatment during the dissections. Further, pooled samples of 12 F1 embryos (36 hpf; stage matched and lacking visual morphological abnormalities) spawned from each maternal tank were collected (4–6 samples/tank, 3 tanks/treatment). Samples were flash frozen in liquid nitrogen and stored at −80°C. DNA was isolated according to the QIAGEN Tissue Extraction Protocol using the QIAGEN Genomic-tip 20/G and QIAGEN Genomic DNA Buffer Set (Hilden, Germany). mtDNA damage was quantified using the long amplicon quantitative polymerase chain reaction (LA-QPCR) method, and relative mtDNA content was quantified using the comparative cycle threshold (Ct) method using real time PCR (RT-PCR), as previously described (Hunter 2010; Gonzalez-Hunt 2016). Primer sequences and PCR parameters are provided in Table S2.
2.5. Oxidative Stress Biomarkers
Antioxidant enzyme activities and glutathione levels were evaluated in F0 ovaries and F1 larvae (4 days post fertilization (dpf)). During the F0 female dissections, two 10–20 mg samples of ovary tissue were collected from each female (ovary size permitting), which were used to evaluate antioxidant enzyme activities and glutathione concentrations (for each assay, 1 sample/fish, 2–5 fish/tank, 3 tanks/treatment). At 4 dpf, 6 samples of 15-pooled whole F1 larvae spawned from each maternal tank were collected to evaluate antioxidant enzyme activities and glutathione concentrations (for each assay, 3 samples/maternal tank, 3 tanks/treatment). All samples were flash frozen in liquid nitrogen and stored at −80°C until analysis.
2.5.1. Antioxidant Enzyme Activities
The activities of glutathione S-transferase (GST), glutathione reductase (GR), and glutathione peroxidase (GPx) were measured in larval extracts, as described previously (Massarsky 2015; Massarsky 2017). This method was adopted for use with ovary tissue extracts in the present study. Total superoxide dismutase (SOD) activity was quantified using a commercially available kit (#19160; Sigma-Aldrich, Inc.). A SpectraMax M5 Spectrophotometer (Molecular Devices, Sunnyvale, CA) and SOFTmax Pro software were used to evaluate enzyme activities, which were normalized to total protein concentrations measured using a commercially available bicinchoninic acid kit (#BCA-1; Sigma-Aldrich, Inc.) and bovine serum albumin standards.
2.5.2. Glutathione Concentrations
Total glutathione (TGSH) and glutathione disulfide (GSSG) concentrations were measured as previously described (Massarsky 2015; Massarsky 2017). Reduced glutathione (GSH) concentrations were calculated using the equation (TGSH = GSH + 2GSSG), and the ratio of GSH:GSSG was determined for each sample.
2.6. F1 Larval Locomotor Activity
At 120 hpf, F1 larvae (stage-matched and lacking visual morphological abnormalities) were transported to the behavioral testing facility. At 144 hpf, larvae were individually transferred into a 96-well plate with glass well inserts containing 0.5 mL embryo media (24 larva/maternal tank, with 1 maternal tank/treatment represented on each plate, across 3 plates). After 1 hour of acclimation at 28°C, larval locomotor activity (average distance moved (cm/minute)) was evaluated over the course of an alternating light/dark test (10 min acclimation period in the dark (0% illumination) followed by 2 cycles of alternating light (10 min, 100% illumination, 5000 lx) and dark (10 min, 0% illumination) periods), using a DanioVision™ lightbox with an infrared camera running EthoVision XT® tracking software (Noldus Information Technology, Wageningen, The Netherlands), as previously described (Massarsky 2015).
2.7. Statistical Analysis
Most statistical analyses were conducted using Graph Pad Prism 6.0 (San Diego, CA). For most endpoints, two-way analysis of variance (ANOVA) with treatment and tank factors was used with Fisher’s least significant difference (LSD) post hoc to test for treatment effects. Bartlett’s test was used to evaluate whether the groups had equal variances. For F0 ovary mitochondrial DNA damage and copy number, one-way ANOVA was used with Fisher’s LSD post hoc to test for treatment effects (due to limited samples due to ovary size). For larval motility, statistical analyses were conducted using Supernova/Statview (SAS, Cary, NC). Mixed-design repeated-measures ANOVA (RMANOVA) with treatment and tank as the between-subject factor and light condition and trial minute as the repeated measures was used with a Dunnett’s two-tailed post hoc to test for treatment effects. For all endpoints, significance was accepted if P<0.05. Additional details on statistical methods are provided in figure legends.
3. Results
3.1. BaP Concentrations in Food
BaP concentrations measured in the treated food were 11.4±0.5, 116±4, and 1130±90 μg BaP/g diet (eq. 0.228±0.095, 2.31±0.82, and 22.7±1.8 μg BaP/g fish, respectively) (average of concentrations on days 0 and 21). BaP concentrations in the control food were below or near the method detection limit (Table S3).
3.2. Mitochondrial Function
3.2.1. F0 Female Tissue Bioenergetics
In F0 ovaries, total basal respiration was reduced by 11%, 12%, and 16% relative to control in the low, medium, and high BaP-exposures, respectively, with statistically significant reductions in the medium and high groups. The decreased basal OCRs were due to significantly lower non-mitochondrial respiration relative to control (20–27%) in all exposures, while mitochondrial respiration was not different between treatments (Figure 1A). Total maximal OCR was also significantly reduced in the high treatment relative to control (8%) due to lower non-mitochondrial respiration, while maximal mitochondrial respiration rates and mitochondrial reserve capacity were not significantly different between treatments (Figure 2A). Heart, brain, and liver-specific bioenergetic profiles of BaP-exposed F0 females were not significantly different from controls (Figures S2–S3).
Figure 1.
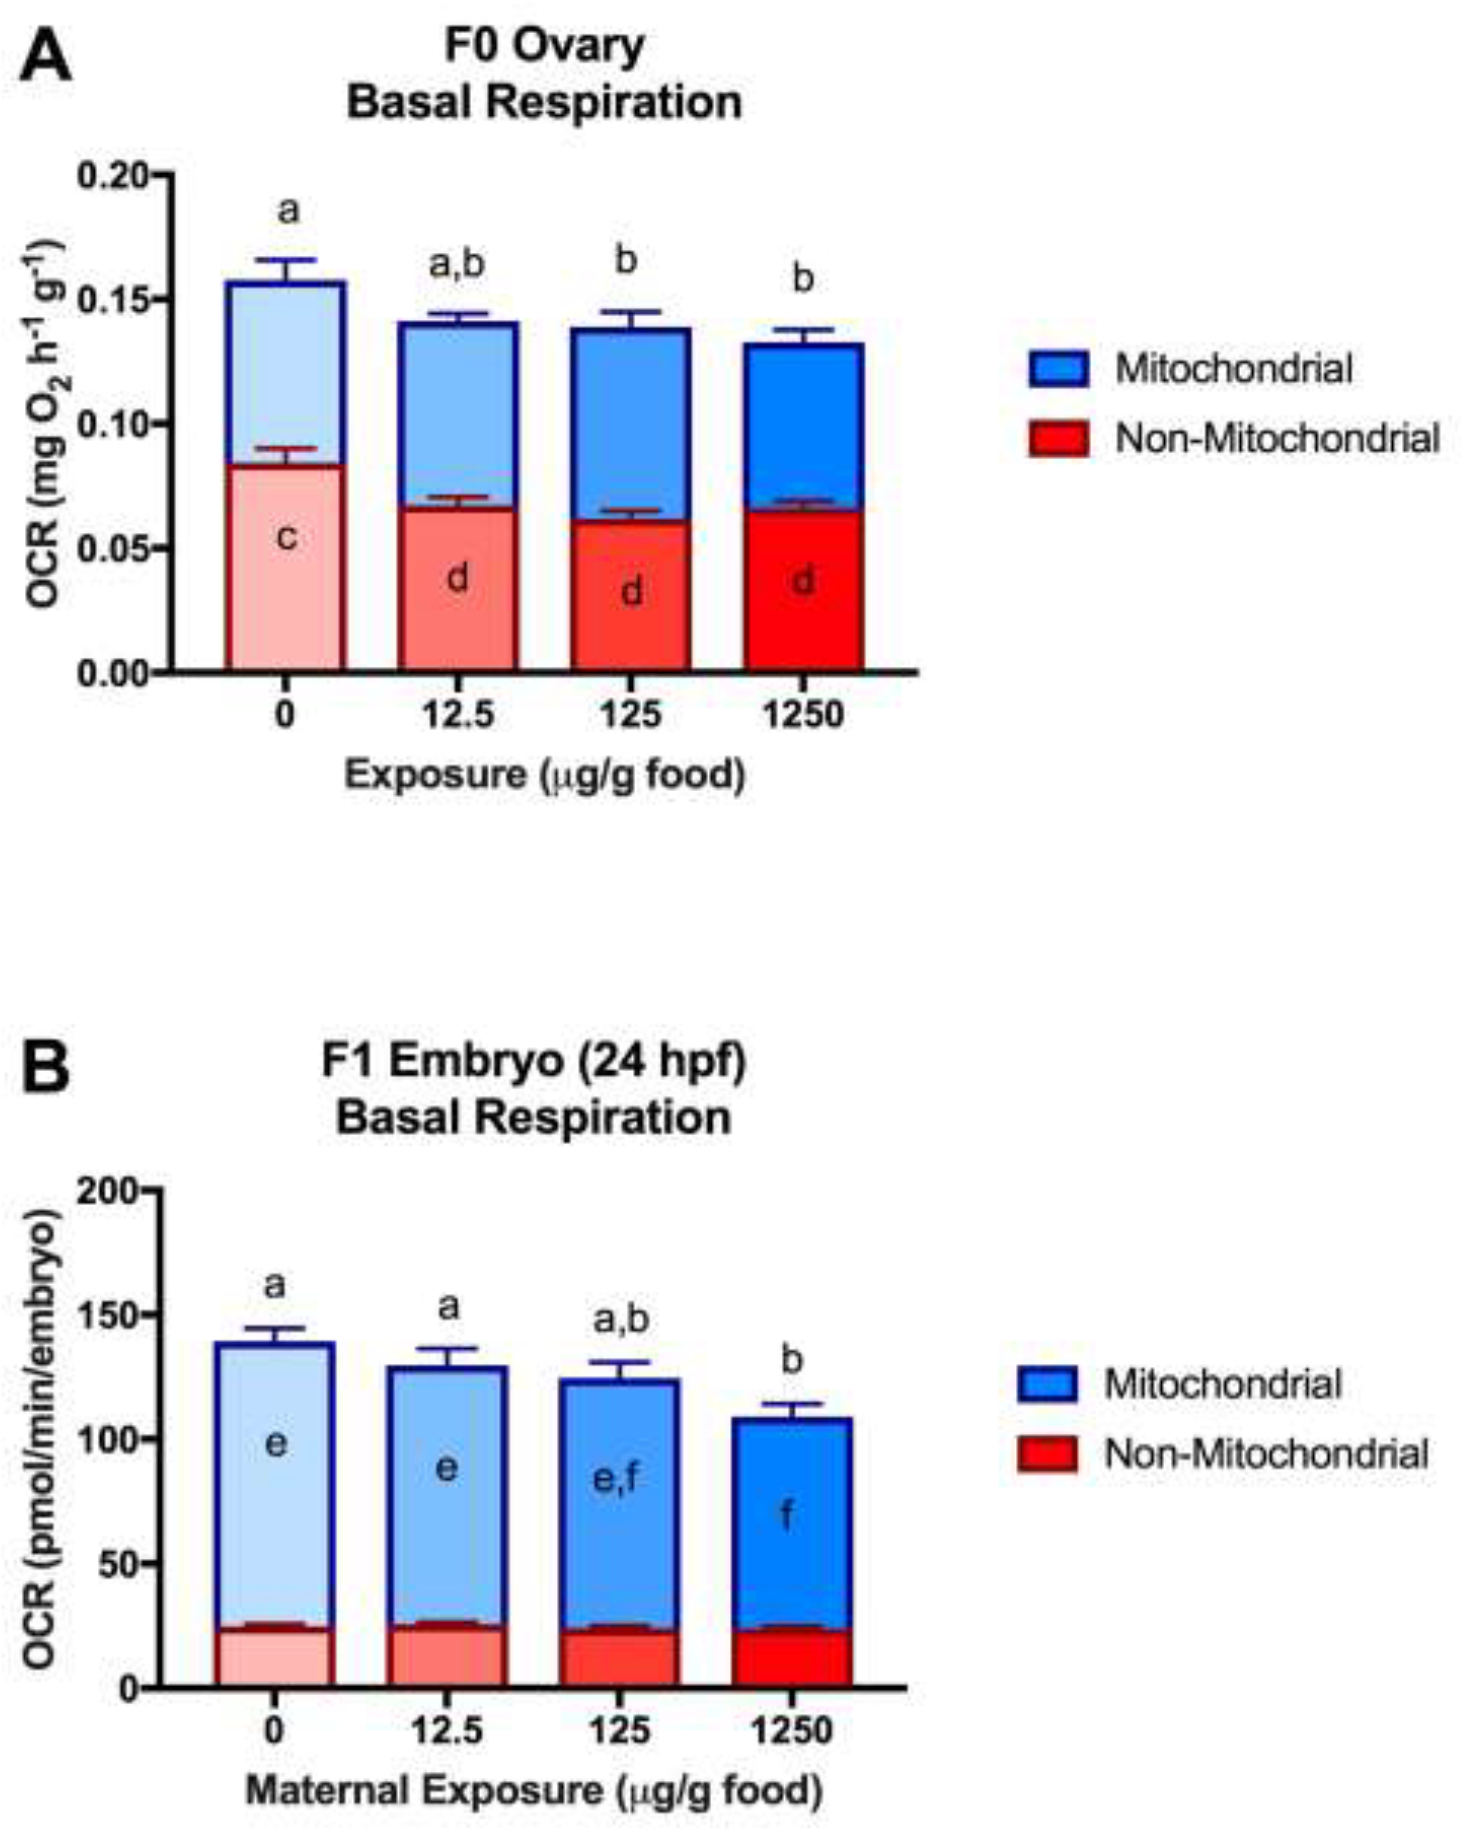
Metabolic partitioning of basal respiration. (A) F0 ovaries (1 ovary/female, 4–5 females/tank, 3 tanks/treatment). (B) 24 hpf F1 embryos (2 embryos/well, 5–6 wells/tank, 3 tanks/treatment) (data from oligomycin plates). Different letters denote statistical differences across treatments within a given parameter (Two-way ANOVA with maternal-treatment and tank factors; Fisher’s LSD for treatment effects; P<0.05). For Figures 1A–B, total basal respiration is represented by the entire bar (red+blue), and statistical significance is denoted by a and b. Non-mitochondrial respiration is represented in red, and significance values (when significant) are displayed within this segment, denoted by c and d. Mitochondrial respiration is represented in blue, and significance values (when significant) are displayed within this segment, denoted by e and f.
Figure 2.

Metabolic partitioning of maximal respiration. (A) F0 ovaries (1 ovary/female, 4–5 females/tank, 3 tanks/treatment group). (B) 24 hpf F1 embryos (2 embryos/well, 5–6 wells/tank, 3 tanks/treatment group) (data from FCCP plates). Different letters denote statistical differences across treatments within a given parameter (Two-way ANOVA with treatment and tank factors; Fisher’s LSD treatment effects; P<0.05). For Figures 2A and 2B, total maximal respiration is represented by the entire bar (red+green+green/pink hashed sections), and statistical significance (when significant) is denoted by n and o. Maximal mitochondrial respiration is represented by the entire green section, including the portion of the green bar which has pink crossed hashes. The portion of maximal mitochondrial respiration that reflects reserve capacity is cross hashed in pink, and significance values (when significant) are displayed within this segment, denoted by p and r. Non-mitochondrial respiration is represented in red, and significance values (when significant) are displayed within this segment, denoted by c and d.
3.2.2. F1 Embryo Bioenergetics
Total basal respiration was significantly reduced (22%) in 24 hpf F1 embryos from the high maternal-treatment relative to control. Although not statistically significant, basal respiration was also lower in the medium group (11%) relative to control. In contrast to the F0 ovaries, the decreased basal OCRs in the F1 embryos were due to reduced mitochondrial respiration in the medium and high groups (12% and 26%, respectively) relative to control. Non-mitochondrial respiration was not different across groups (Figure 1B). Mitochondrial respiration can be further partitioned into respiration coupled to ATP turnover and proton leak. ATP turnover was significantly reduced (23–39%) in embryos from all maternal-treatments relative to control. In contrast, proton leak was significantly increased in embryos from the low and medium groups (34% and 45%, respectively) and was higher (but not significantly) in the high group (16%) (Figure 3A). Mitochondrial coupling efficiency, the percent of mitochondrial respiration linked to ATP production, was 75% in control embryos, but was reduced to 59% in embryos from all maternal-treatments (Figure 3B). For both proton leak and coupling efficiency, standard deviations were significantly different across groups, with higher variability observed in maternal-treatments than controls. Total maximal respiration and maximal mitochondrial respiration were not significantly different between groups. Mitochondrial reserve capacity was significantly increased in the high maternal-treatment (40%) and trending higher in the low maternal-treatment (18%) due to decreased basal respiration but unchanged maximal respiration (Figure 2B). Total basal extracellular acidification rates (ECARs) were significantly reduced in F1 embryos from the high (21%) and relatively low in the medium (8%) maternal-treatments compared to controls (Figure 4A). Overall, F1 embryos from all maternal-treatments were significantly hypometabolic compared to controls (Figure 4B).
Figure 3.

Mitochondrial function and efficiency in 24 hpf F1 embryos (2 embryos/well, 5–6 wells/tank, 3 tanks/treatment) (data from oligomycin plates). (A) Mitochondrial respiratory partitioning. (B) Mitochondrial coupling efficiency. Different letters denote statistical differences across treatments within a given parameter (Two-way ANOVA with maternal treatment and tank factors; Fisher’s LSD for treatment effects; P<0.05). For both proton leak and coupling efficiency, standard deviations were significantly different across treatments (Bartlett’s Test; P<0.0001). For Figure 3A, mitochondrial respiration is represented by the entire bar (orange+purple), and statistical significance is denoted by letters e and f. ATP turnover is represented in orange, and significance values are displayed within this segment, denoted by g and h. Proton leak is represented in purple, and significance values are displayed within this segment, denoted j and k. For Figure 3B, mitochondrial coupling efficiency is represented by the bar, individual values are presented to showcase variability, and significance values are denoted by l and m.
Figure 4.
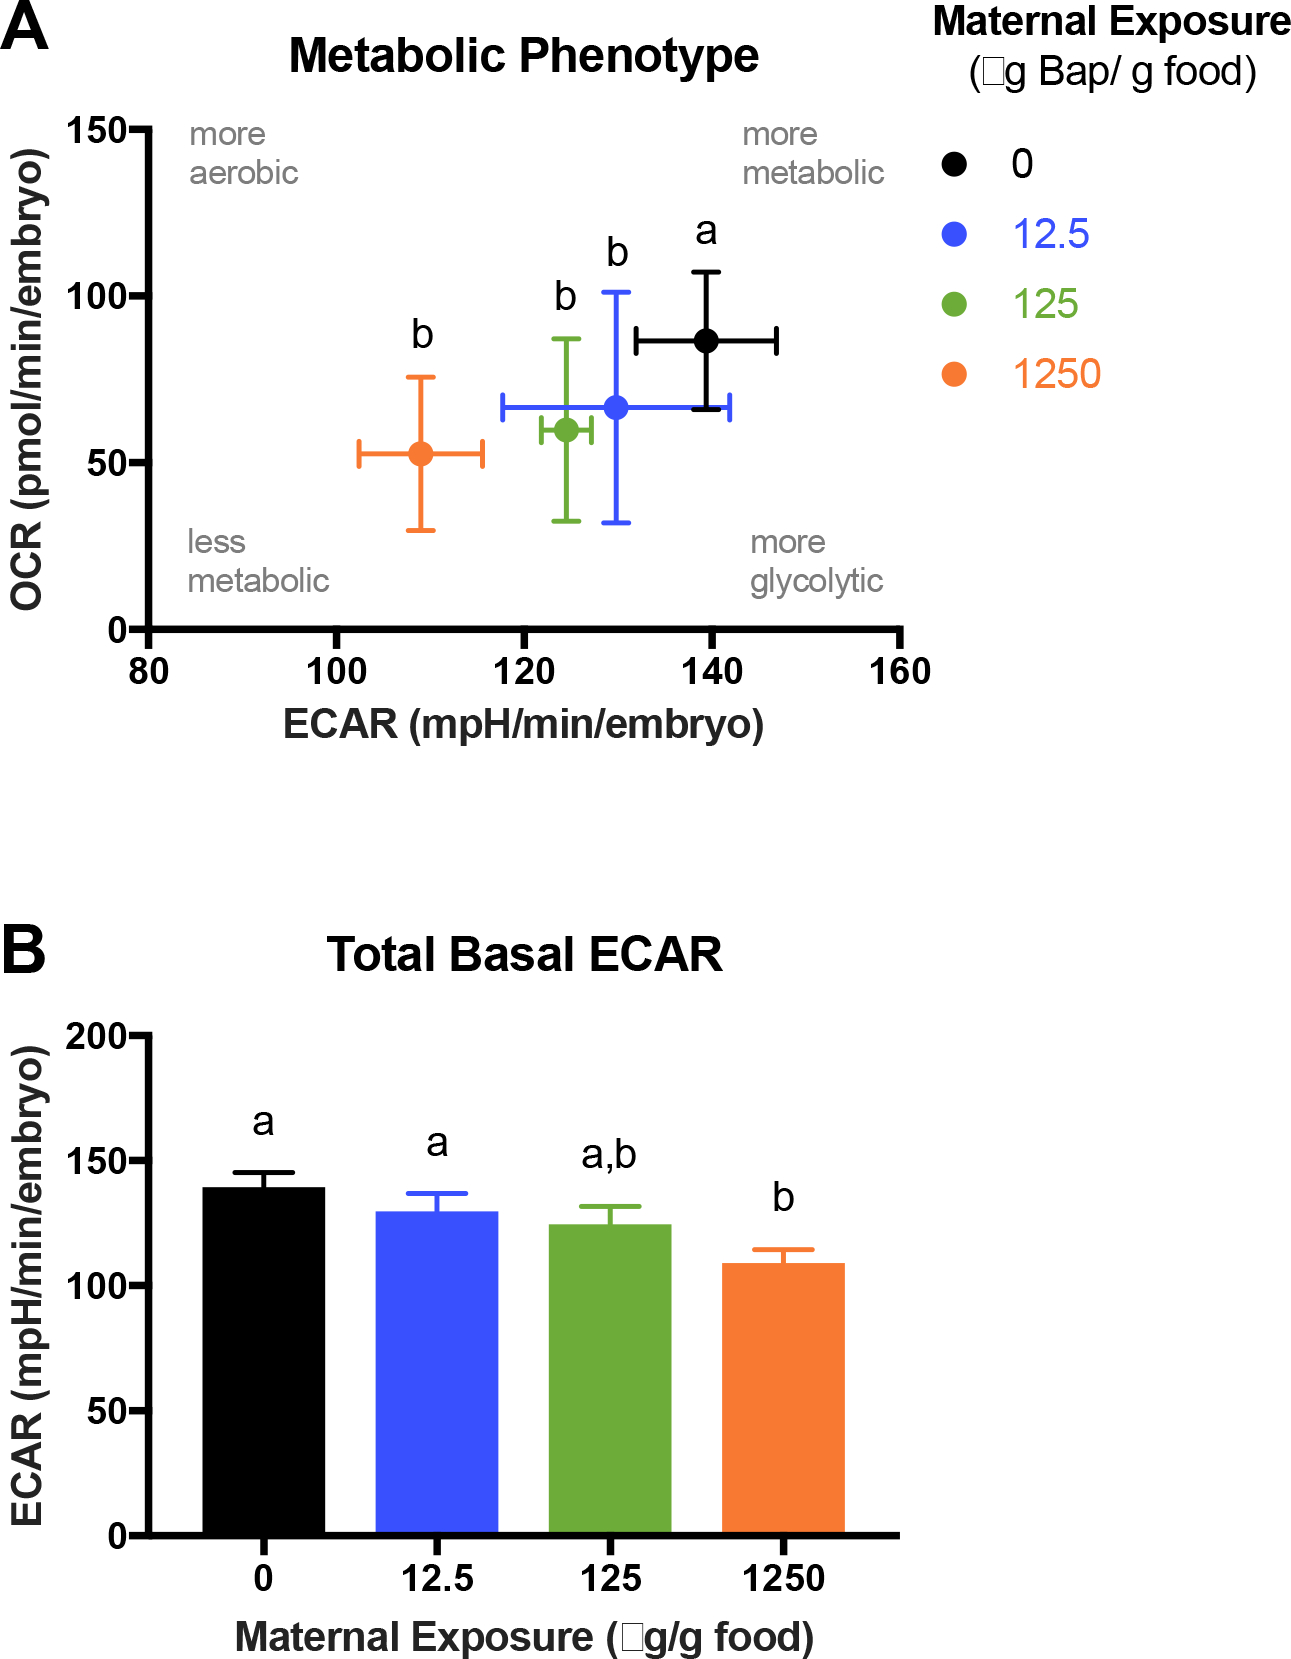
(A) Relative metabolic state of 24 hpf F1 embryos (2 embryos/well, 5–6 wells/tank, 3 tanks/treatment). The X-axis represents total basal extracellular acidification rate (ECAR), a proxy of glycolysis. The Y-axis represents ATP-linked mitochondrial respiration, a proxy of oxidative phosphorylation. The OCR:ECAR ratio was used for statistical analyses. (B) Total basal ECAR. Data are presented as means ± SEM. Different letters denote statistical differences across treatments (Two-way ANOVA with maternal treatment and tank factors; Fisher’s LSD for treatment effects; P<0.05) (data from oligomycin plates).
3.3. mtDNA Damage and Copy Number
In F0 ovaries, mtDNA damage and copy number were not significantly different between treatments (Figure 5A–B). In F1 embryos (36 hpf), significantly increased mtDNA damage was noted in the medium group (18-fold increase; mean value of 0.31 lesions per 10 kb versus 0.017 lesions per 10 kb in the control), which was accompanied by significantly lower (19%) mtDNA copy number relative to control (Figure 5C–D). For both mtDNA damage and copy number in F1 embryos, standard deviations were significantly different across treatment groups. Notably, mtDNA damage levels showed higher variability within a treatment group in maternally-exposed groups than controls, whereas, within group variability for mtDNA copy number was higher in controls.
Figure 5.

Mitochondrial DNA damage and copy number. (A) F0 ovaries (1 ovary sample/female, 4–5 females/treatment) mtDNA damage expressed as lesions/10 kb. (B) F0 ovaries (1 ovary sample/female, 4–5 females/treatment) mtDNA copy number/nuclear genome. (C) 36 hpf F1 embryo (12-pooled embryos/sample, 4–6 samples/tank, 3 tanks/treatment) mtDNA damage expressed as lesions/10 kb. (D) 36 hpf F1 embryo (12-pooled embryos/sample, 4–6 samples/tank, 3 tanks/treatment) mtDNA copy number/nuclear genome. All data are presented as means ± SEM. For Figures 5A and 5B, no significant effects of treatment were detected (One-way ANOVA; Fisher’s LSD for treatment effects; P<0.05). For Figures 5C and 5D, different letters denote statistical differences across treatments (Two-way ANOVA with maternal treatment and tank factors; Fisher’s LSD for treatment effects; P<0.05). For both F1 embryo mtDNA damage and copy number, standard deviations were significantly different across treatment groups (Bartlett’s Test; P<0.0002 and 0.003, respectively), thus individual values are presented to showcase variability.
3.4. Oxidative Stress Biomarkers
3.4.1. Antioxidant Enzyme Activities
Activity of GR was significantly lower in F0 ovaries from the low treatment group (48%) and lower, but without statistical significance, in the medium BaP treatment (43%) relative to controls (Figure 6B). Activities of GST, GPx, and SOD were not significantly different in ovary tissues between treatment groups (Figure 6C–D). Of note, standard deviations were significantly different across treatment groups for GR, GPx, and SOD. Thus, statistical analyses were performed on both nontransformed and log-transformed values. Statistically significant differences were detected for GR upon log transformation.
Figure 6.

Activities of selected antioxidant enzymes in F0 ovaries (1 ovary/female, 2–5 females/tank, 3 tanks/treatment). (A) GST. (B) GR. (C) GPx. (D) SOD. Data are presented as a boxplot (25%–75%) with whiskers from minimum to maximum. Different letters denote statistical differences across treatments. (Two-way ANOVA with treatment and tank factors; Fisher’s LSD for treatment effects; P<0.05). Statisticss were conducted on both untransformed and log transformed values for GR, GPx, and SOD, because standard deviations were significantly different across treatments (Bartlett’s Test; P<0.05), but significant differences were only detected for GR with log transformation. Untransformed values are plotted to showcase unequal variances.
Activities of GST (18–23%) and GR (16–20%) were significantly lower in F1 larvae (96 hpf) from all maternal-treatments relative to control (Figure 7A–B). Further, GPx activity was significantly reduced in larvae from the medium and high maternal-treatments (46% and 27% reductions, respectively) relative to control and trending in the low maternal-treatment (25%) (Figure 7C). SOD activities were not significantly different in larvae across maternal-treatments (Figure 7D); however, standard deviations were significantly different across treatment groups, with higher variability observed in controls. Log transformation did not change lack of statistical differences.
Figure 7.
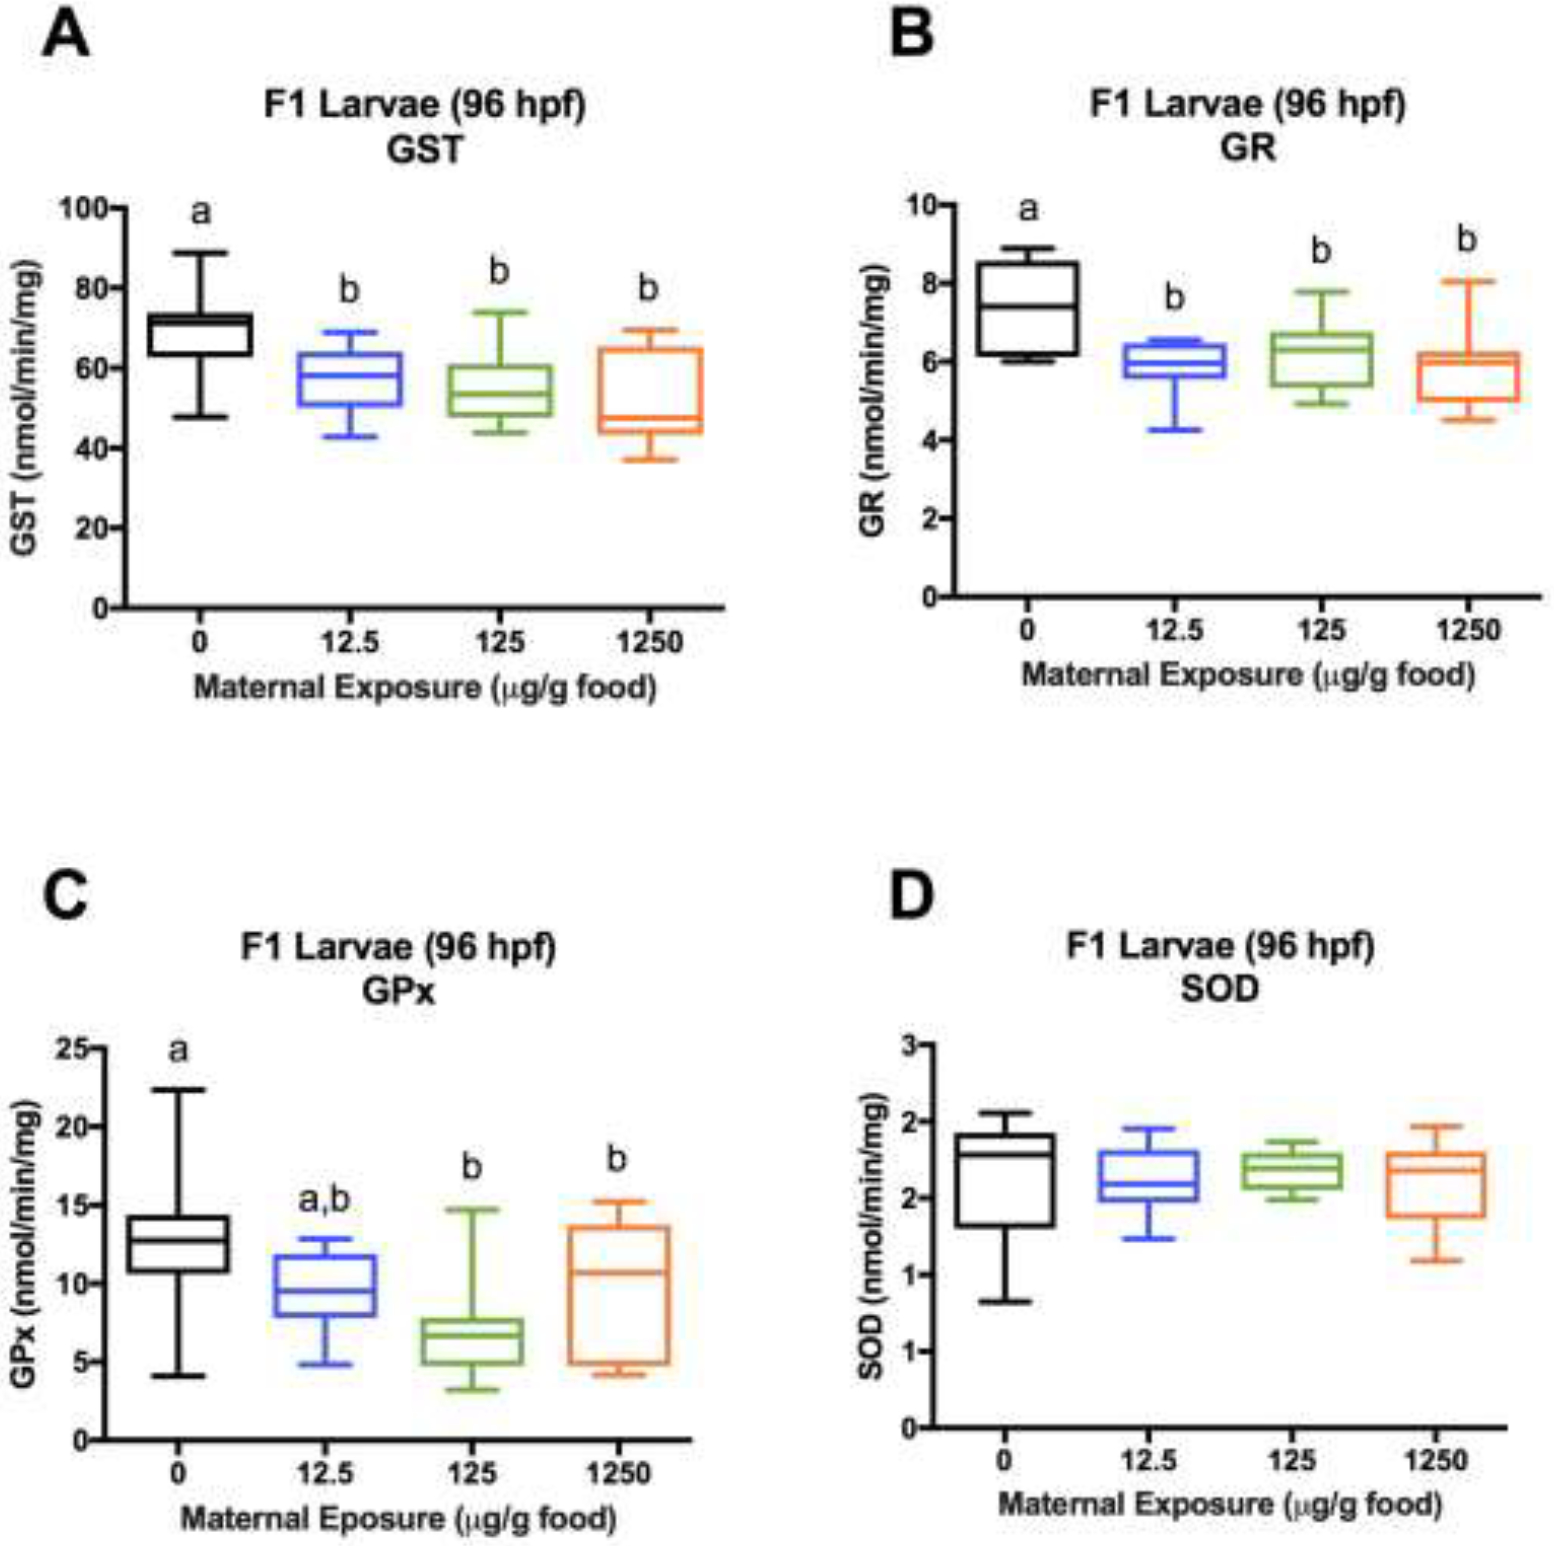
Activities of selected antioxidant enzymes in pooled samples of 96 hpf F1 larvae (15-pooled larvae/sample, 3 samples/tank, 3 tanks/treatment). (A) GST. (B) GR. (C) GPx. (D) SOD. Data are presented as a boxplot (25%–75%) with whiskers from minimum to maximum. Different letters denote statistical differences across treatments. (Two-way ANOVA with maternal treatment and tank factors;Fisher’s LSD for treatment effects; P<0.05). Statisticss were conducted on both untransformed and log transformed values for SOD because standard deviations were significantly different across treatments (Bartlett’s Test; P<0.05), but no significant differences in SOD activities were detected. Untransformed values are plotted to showcase unequal variances.
3.4.2. Glutathione Concentrations
In F0 ovaries, TGSH and GSH concentrations were not significantly different between treatments (Figure 8A–B). GSSG concentrations were significantly reduced in the low and high treatments (22% and 29% reductions, respectively) and trending lower in the medium treatment (18%) relative to controls (Figure 8C). For GSH:GSSG, standard deviations were significantly different across treatment groups. Upon log transformation, heteroscedasticity was corrected enough for parametric testing, and statistically significant differences were detected for GSH:GSSG. Specifically, GSH:GSSG ratios were significantly higher in the low and high treatments (47% and 36% increases, respectively) and also higher (without statistical significance) in the medium treatment (29%) relative to controls (Figure 8D).
Figure 8.
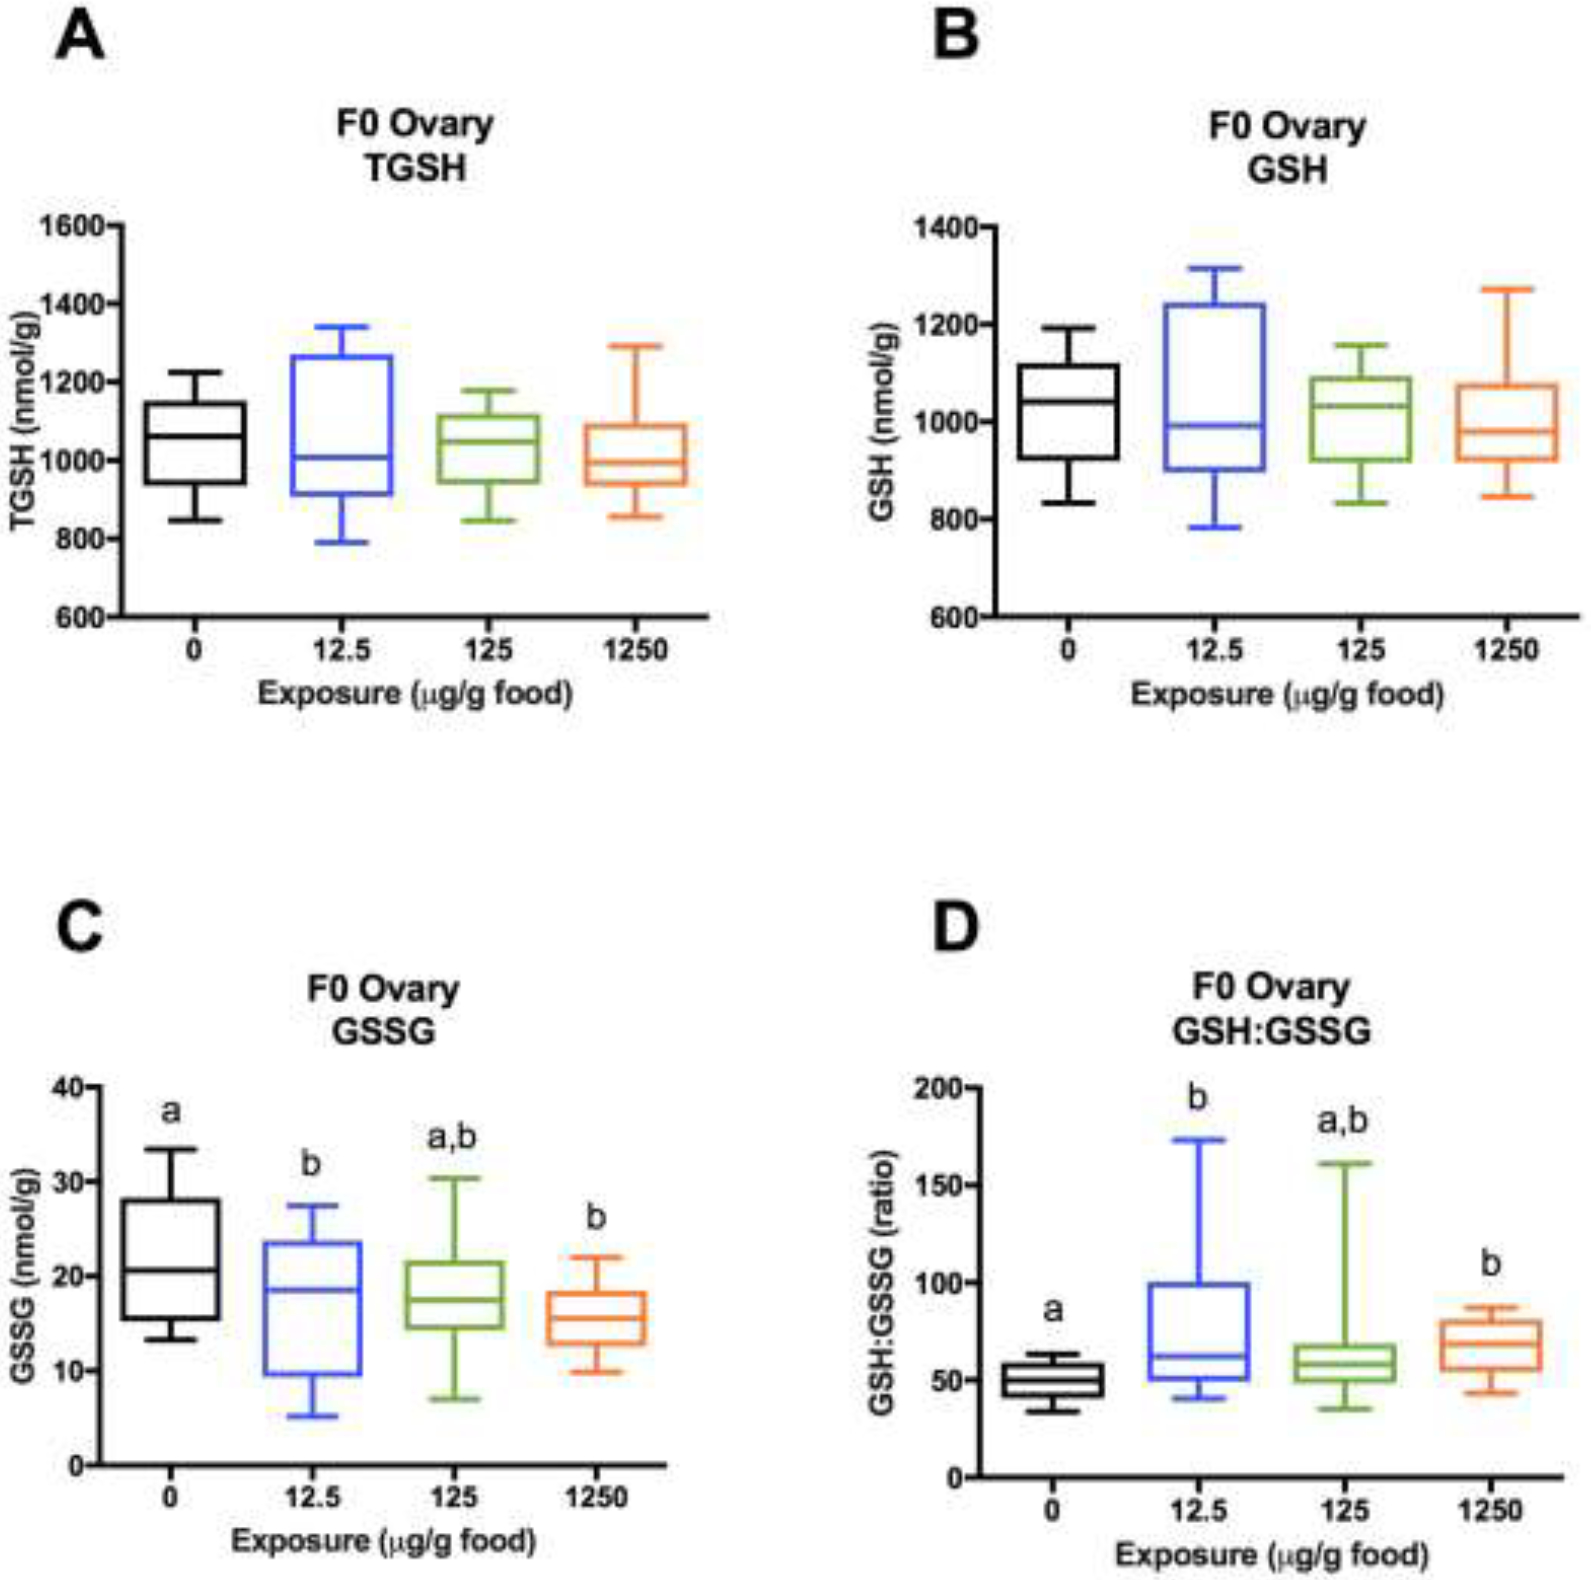
Glutathione concentrations in F0 ovaries (1 ovary/female, 2–5 females/tank, 3 tanks/treatment). (A) TGSH. (B) GSH = TGSH - 2GSSG. (C) GSSG. (D) GSH:GSSG. Data are presented as a boxplot (25%–75%) with whiskers from minimum to maximum. Different letters denote statistical differences across treatments. (Two-way ANOVA with treatment and tank factors; Fisher’s LSD for treatment effects; P<0.05). Statisticss were conducted on log transformed values for GSH:GSSG because standard deviations were significantly different across treatments(Bartlett’s Test; P<0.05), but untransformed values are plotted to showcase unequal variances.
In F1 larvae, TGSH concentrations were significantly lower in all maternally-exposed groups relative to control (11–15% reductions) (Figure 9A). The reduction in TGSH was a result of significant depletions of GSH in larvae from all maternal-treatments (12–16% reductions) (Figure 9B), while GSSG concentrations were significantly higher in F1 larvae from the low and medium groups (36% and 32% increases, respectively). GSSG levels were also higher (26% increase) in larvae from the high group, but were not statistically significant (Figure 9C). Consequently, the GSH:GSSG ratios were significantly decreased in all maternal BaP treatments relative to control (27–36% reductions) (Figure 9D).
Figure 9.

Glutathione concentrations in 96 hpf F1 larvae (15-pooled larvae/sample, 3 samples/tank, 3 tanks/treatment). (A) TGSH. (B) GSH = TGSH - 2GSSG. (C) GSSG. (D) GSH:GSSG. Data are presented as a boxplot (25%–75%) with whiskers from minimum to maximum. Different letters denote statistical differences across treatments. (Two-way ANOVA with maternal treatment and tank factors;Fisher’s LSD for treatment effects; P<0.05). Statistics were conducted on log transformed values for GSH:GSSG because standard deviations were significantly different across treatment groups (Bartlett’s Test; P<0.05), but untransformed values are plotted to showcase unequal variances.
3.5. F1 Larval Locomotor Activity
Maternal exposure to BaP significantly reduced F1 larval locomotor activity. There was a significant main effect of maternal BaP treatment on total distance traveled over the course of the alternating light/dark test. Specifically, larvae from the medium and and high maternal-treatments swam significantly less than controls over the course of the trial. Further, larvae from the high maternal-treatment also swam significantly less during the initial dark acclimation period (Figure 10). There was a significant main effect of light condition on locomotor activity, with larvae from all maternal treatments swimming more in the dark than the light. There was not a significant interaction of light condition and maternal-treatment. There were significant interactions of maternal-treatment and tank during both the initial dark acclimation period and the alternating light-dark test, indicating a general decrease in swimming activity regardless of lighting conditions.
Figure 10.

Locomotor activity of 6 dpf F1 larvae (24 larvae/tank, 3 tanks/treatment). (A) Total distance traveled (mm) as a function of trial minute. (B) Total distance traveled (mm/min) as a function of light condition. Data are presented as means ± SEM. * indicates significant difference compared to control (RMANOVA; Dunnett’s or Fisher’s LSD; P<0.05).
4. Discussion
This study demonstrates that maternal exposure to BaP reduces mitochondrial respiration, efficiency, and integrity, impairs the antioxidant defense system, and affects locomotor activity in F1 offspring. These data highlight the importance of understanding environmental contaminant-induced mitochondrial dysfunction and metabolic shifts during development, as they may contribute to disease pathologies and reduced organismal fitness later in life. Further, these data provide key mechanistic insights into human disease etiologies associated with maternal PAH exposure and cross-generational PAH toxicity.
The observed reduction in total basal respiration in F1 embryos maternally-exposed to BaP is consistent with reduced basal respiration in zebrafish and killifish embryos developmentally exposed to BaP, as well as F2 zebrafish embryos following an F0 exposure (Jung 2009; Knecht 2017). In the present study, the reduction in total basal respiration in F1 embryos can be attributed to reduced mitochondrial respiration and ATP turnover. This reflects reduced mitochondrial coupling efficiency, which was both lower and more variable with maternal exposure, compared to tightly regulated coupling efficiency in controls. The heterogeneity in response supports the mitochondrial bottleneck hypothesis (Mishra 2014). Reduced ATP turnover in zebrafish maternally-exposed to BaP is consistent with reduced ATP generation observed in rats maternally-exposed to cigarette smoke (Lei 2018), although cigarette smoke is a complex mixture containing PAHs and other chemicals.
Reductions in ECARs are concomitant with impaired mitochondrial respiration, suggesting that F1 organisms are not compensating for impaired oxidative phosphorylation with glycolysis and exhibit relatively metabolically quiescent phenotypes. Reduced metabolism, and specifically reduced ATP turnover, could be indicative of limited energy availability, which could result in tradeoffs between maintenance (e.g. mtDNA damage repair) and fitness (Jayasundara 2017).
The observed increased proton leak in maternally-BaP-exposed embryos is consistent with increased proton leak following developmental exposure to BaP in killifish (Du 2015). Herein, proton leak was tightly regulated in controls, but was both higher on average and more variable with maternal exposure. Under certain conditions, incomplete mitochondrial coupling (by basal and inducible proton leak) plays an important role in reducing electron transport chain (ETC) reactive oxygen species (ROS) generation (Jastroch 2010). Therefore, increased proton leak in maternally-BaP-exposed F1 embryos may reflect an attempt to combat increased mitochondrial ROS production to protect against further mitochondrial dysfunction. Alternatively, increased proton leak may be a manifestation of reactive metabolite or oxidative damage to ETC complexes or the phospholipids of the inner mitochondrial membrane (Cheng 2017). Notably, both the magnitude of the increase in proton leak and the higher variability were less apparent in the high maternal-treatment compared to the medium and low-treatments and may reflect a pathological phenotype following significant damage.
Even when respiring normally, mitochondria produce ROS and contribute to oxidative stress. Mitochondrial dysfunction can exacerbate oxidative stress by increasing ROS production and limiting ATP availability, which in turn can affect highly energy-dependent anti-oxidant processes (e.g. lower levels of total glutathione, decreased GSH availability, and reductions in the GSH:GSSG ratio) and further exacerbate the cycle (Schütt 2012). Elevated oxidative stress in F1 larvae maternally-exposed to BaP is evident from lower TGSH concentrations, higher GSSG concentrations, and lower GSH:GSSG ratios, along with reduced ATP turnover. Reductions in GSH and increases in GSSG likely reflect utilization to combat ROS. Reductions in GSH may also reflect induction of phase II metabolism, with conjugation of GSH to xenobiotic compounds or metabolites (Massarsky 2017). It is unclear if BaP metabolites were present in the F1 zebrafish after the maternal exposure. In a similar study, BaP parent compound was not detected in F1 embryos; however, BaP metabolites were not measured (Corrales 2014).
The reduced activities of GR, GPx, and GST in maternally-exposed larvae further suggest suppressed antioxidant capacity and phase II metabolism. Reduced GR activity is consistent with the observed increase in GSSG levels. While differences were not detected in SOD activities, the values measured represent total SOD, including the forms of copper and zinc SODs found in the cytosol and extracellular space. A targeted measurement of mitochondrial manganese SOD may have yielded different results. Reduced antioxidant enzyme activities may reflect oxidative damage to enzymes or other associated cellular components (Massarsky 2017). The reductions in antioxidant capacity and enzyme activities observed in maternally-BaP-exposed zebrafish in the present study are consistent with reduced glutathione content and antioxidant enzyme activities observed in offspring rats maternally-exposed to cigarette smoke (Lei 2018).
Significant increases in mtDNA damage and reductions in mtDNA copy number were also observed in F1 embryos from the medium maternal-BaP-exposure relative to controls. This finding is consistent with increased mtDNA damage in killifish larvae and tissues from adults following direct exposures to BaP via developmental and intraperitoneal exposures, respectively (Jung 2009). Further, in epidemiological studies, prenatal air pollution exposure is associated with increased PAH-DNA adducts and reduced mtDNA content in the placenta and/or cord blood (Desai 2017; Everson 1986). Mitochondrial genome content is also lower in placenta tissues from women who smoke tobacco (Bouhours-Nouet 2005).
The observed reduction in mtDNA copy number in the absence of changes in embryo total maximal and mitochondrial maximal respiration seems counterintuitive. However, in Caenorhabditis elegans, maintenance of normal steady-state ATP levels and near-normal maximal OCR is possible with a 35–55% reduction in mtDNA copy number, even upon further challenge with mitochondrial toxicants (Luz 2016). This suggests that mitochondrial function is not always dependant on mtDNA copy number, either due to a buffer of surplus mitochondrial genomes, or because they can compensate by increased transcriptional activity (Shokolenko 2016). Indeed, mitochondrial RNA can be transcribed at a normal or even elevated levels (Hershberger 2021) in the presence of high levels of mtDNA damage caused by ultraviolet C radiation. Such damage inhibits the mtDNA polymerase γ (Kasiviswanathan 2012), as do the bulky adducts formed by PAH metabolites (Graziewicz 2004). Thus, it is plausible that BaP exposure inhibits mtDNA replication [or induces mitophagy (Bess 2013)], resulting in lower mtDNA copy number, while mitochondrial function is maintained by compensatory mechanisms.
At the organismal level, F1 larvae from the medium and high maternal-BaP-treatments exhibit hypoactivity, which is particularly apparent during in the relatively high activity acclimation and alternating dark periods of the alternating light-dark test. Hypoactivity could be a result of neurobehavioral effects, reduced energy availability, and/or subtle undetected developmental delays or deformities. While hypoactivity was observed with maternal BaP exposure in this study, cross-generational exposure to PAHs is more often associated with hyperactivity in the literature. Larval hyperactivity in F0 and F2 generations (F1 not reported) and adult hyperactivity in F0 and F1 generations occur in zebrafish developmentally or indirectly exposed to BaP, respectively (Knecht 2017). Differences in the timing, duration, level, and route of the F0 exposures between these studies may contribute to dissimilarities in behavioral outcomes. Nonetheless, these data lend to the epidemiological studies that suggest a link between prenatal exposure to PAHs and behavioral disorders in children (Perera 2013).
Notably, mitochondrial dysfunction and oxidative stress responses in F1 offspring occurred largely in the absence of observed effects in F0 ovaries. One potential explanation is that oocytes repress mitochondrial oxidative phosphorylation to reduce ROS production and accumulation of mtDNA damage and mutations (Allen 1996). The bioenergetic quiescence of female gametes may reduce the ability to observe effects of BaP exposure on mitochondrial function (Chappel 2013). Alternatively, mature oocytes have relatively high mtDNA copy number relative to somatic cells (Chappel 2013), which may buffer against mitochondrial damage and dysfunction (Meyer 2013). Further, it is possible that large inter-oocyte variability in mtDNA content results in dilution of effects observed in whole ovary tissue samples (Otten 2016). However, we show that non-mitochondrial respiration in ovary tissues from BaP-exposed F0 females contributes to decreased total basal and total maximal respiration. Non-mitochondrial respiration constitutes oxygen consumed by enzymes (e.g. CYP mono-oxygenases, cyclooxygenases, NADPH oxidases) and is related to ROS generation (Chacko 2014). This decreased non-mitochondrial respiration is consistent with decreased GSSG and increased GSH:GSSG ratios observed in ovaries from BaP-exposed F0 females, indicating lower oxidative stress. However, GR activity (which reduces GSSG to GSH) was decreased in ovary tissue from BaP-exposed F0 females, which is somewhat inconsistent with the increased GSH:GSSG ratio and suggests reduced ability to protect against oxidative stress. In another study, GR activity was lower in ovary tissue from aging female rats, and the altered antioxidant status is thought to contribute to decreased fertility with age (Jansen 2004).
It is possible that the persistent effects of maternal BaP exposure on offspring mitochondrial function are mediated epigenetically. Nuclear control of mitochondrial function is extensive and mediated in part by epigenetic patterning; conversely, mitochondrial function influences nuclear epigenetic patterning including CpG methylation and histone modifications, and there is evidence for such “crosstalk” in environmental toxicology (Weinhouse 2017). For example, mitochondrial dysfunction mediated by maternal exposure to mitochondrial toxicant rotenone altered epigenetic patterning and mitochondrial function in offspring (Lozoya 2020). Although neither energetics nor redox state were not assessed in very early-stage embryos, it is possible that mitochondrial dysfunction at that time could alter epigenetic control of bioenergetic and redox-related genes, thereby explaining the persistently altered phenotypes observed.
The observed effects on bioenergetics and antioxidant defense systems in the present study occurred at environmentally relevant exposure levels. Specifically, exposed fish were fed diets containing 12.5, 125, or 1250 μg BaP/g. While it is difficult to directly compare controlled laboratory exposures to field exposures, which typically involve exposures to complex mixtures and through various environmental media, these levels are comparable to total PAH levels in sediment at moderately and highly contaminated industrial sites. For example, total PAH levels measured at the Atlantic Wood Industries Superfund Site (Elizabeth River, VA) range from 123 to 786 μg/g dry sediment, and levels at another contaminated site along the same river (Republic Creosoting) are similarly high (114 to 296 μg/g) (Clark 2013; Volkoff 2019); these levels are generally consistent with the medium and high exposure levels in the present study. Further, environmental levels measured at other moderately contaminated sites on the Elizabeth River range from approximately 2 to 11 μg/g (Clark 2013; Volkoff 2019), which are generally consistent with the low exposure level in the present study. Sediment-associated PAHs can be accumulated by bottom-dwelling invertebrates (Eadie 1983), such as Artemia, which were used as the dietary exposure medium in the present study. Thus, the dietary exposure levels, and associated effects on bioenergetics and antioxidant defense systems, evaluated in the present study may be experienced by fish inhabiting moderately or highly contaminated industrial sites in the environment.
Our study is not without limitations. The present study focused on effects of maternal exposure on subcellular effects in F1 offspring. Due to the limited number of F1 embryos, time sensitivity of the endpoints of interest, and sensitivity of downstream endpoints to physical manipulation (which could confer additional variability), a visual screen for developmental and morphological normality was conducted; however, no in depth assessments were performed. Data were not collected on F1 embryo production, fertilization rates, mortality, or deformities. The BaP concentrations and exposure regime used in the present study were adapted from another study (Corrales 2014), in which F0 female (as well as male, unlike in the present study) zebrafish were fed diets containing nominal concentrations of 12.5, 125, or 1250 μg BaP/g at a feed rate of 1% body weight twice/day for 21 days. Corrales et al. (2014) reported significantly increased mortality in F1 embryos and larvae from the medium and high maternal-treatment groups. Additionally, decreased time to hatch, decreased larval length, increased incidence of pericardial edema and yolk sack edema, abnormal swim bladders, and abnormal body, tail, and pectoral fin shapes were noted in the medium and/or high groups (Corrales 2014). While we screened for stage-matched and morphologically normal F1 embryos and larvae for all endpoints in the present study, subtle undetected differences in development may confound interpretation of complex endpoints, such as mitochondrial respiration. Further, the loss of magnitude of effects for certain endpoints (e.g. mtDNA damage, mtDNA copy number, proton leak) observed in the high maternal-BaP-treatment in the present study may be attributable to fertilization and survivor bias, as well as potential selection bias for apparently normally developing offspring. Additionally, slight food avoidance was noted in F0 females from the high exposure towards the end of the exposure period; however, there were no differences in body weights across treatment groups at the end of exposure (data not shown). Nevertheless, it is also possible that lack of a dose-response in the high-treatment group may be due to a lower than nominal dose.
Another potential limitation of the present study is that it cannot be determined whether the mitochondrial effects observed in the F1 embryos were due to inheritance of damaged mitochondria, or whether the maturing oocytes were directly exposed to BaP or BaP metabolites inside the F0 females and the F1 embryos were exposed via maternal deposition of BaP or BaP metabolites, which subsequently induced mitochondrial toxicity. Internal BaP doses in F0 ovaries and F1 embryos were not evaluated in the present study. As discussed previously, potential transfer of BaP into F1 zebrafish embryos (8 hpf) was evaluated in a previous study using the same nominal exposure concentrations and regime (Corrales 2014). No BaP was detected in the embryos despite good recovery concentrations, which was could have been attributed to use of an insufficient number of eggs, only a small amount of BaP deposition in the eggs, and/or rapid BaP metabolism by F0 females. The authors stated that deposition of metabolites in F1 embryos was also possible; however, BaP metabolites were not analyzed. Internal doses of BaP or BaP metabolites in F0 ovary tissues were also not evaluated (Corrales 2014). Overall, future studies are needed to determine whether the observed toxicity in the F1 embryos was the result of direct exposure of the F1 or of heritable effects from the F0.
In conclusion, maternal BaP exposure reduced mitochondrial function and integrity and affected the antioxidant system in F1 zebrafish, highlighting the importance of considering the role of mitochondria in disease pathologies resulting from maternal PAH exposures. The cause and effect relationship between the observed effects on mtDNA damage, mitochondrial function, and oxidative stress is unclear; however, these cellular parameters are inherently linked. Mitochondrial dysfunction in the F1 offspring occured largely in the absence of effects in F0 ovaries. The observed developmental vulnerability, as well as high inter-individual variability, in maternally-exposed F1 offspring are consistent with mitochondrial bottleneck hypothesis. The apparent decline in toxicity of the high maternal-BaP-exposure may be affected by fertilization and survivor bias, which have mitochondrial influences. Future studies should aim to determine whether mitochondrial dysfunction and oxidative stress are causal or secondary to other mechanisms (e.g. mitochondrial-epigenetic cross-talk) in the cross-generational toxicity of PAHs. To our knowledge, this work is the first published mechanistic demonstration that maternal PAH exposure can have persistent effects on mitochondrial function across generations, with important applications in human disease etiology. Furthermore, the ecological implications of this finding could be significant considering the role of mitochondria in determining the ecological fitness of teleost fishes (Jayasundara 2017). For example, ecological implications of altered mitochondrial function is likely to be manifested as a function of scope of growth (SOG) (Auer 2015). However, SOG also depends on food availability and other populations dynamics (Auer 2015) and warrants further analyses to elucidate potential population level impacts of mitochondrial dysfunction reported in our study.
Supplementary Material
Highlights.
Maternal BaP exposure affected mitochondrial function in offspring in zebrafish
Maternally-exposed embryos had increased mtDNA damage and decreased copy number
Biomarkers of oxidative stress also increased with maternal exposure
Maternally-exposed larvae exhibited reduced locomotor activity
Mitochondrial effects in offspring occurred in absence of effects in mothers
Acknowledgments
The authors thank the members of the Di Giulio and Meyer laboratories, as well as the Duke University Superfund Research Center Neurobehavioral Toxicity Core and Analytical Chemistry Core, for assisting with fish care, method development, and experiments.
Funding Sources
This research was supported by National Institute of Environmental Health Sciences grant T32-ES021432 and National Institute of Environmental Health Sciences Superfund Research Program grant P42-ES010356.
Footnotes
Declaration of Interest Statement
The authors declare that they have no known competing financial interests or personal relationships that could have appeared to influence the work reported in this paper.
Publisher's Disclaimer: This is a PDF file of an unedited manuscript that has been accepted for publication. As a service to our customers we are providing this early version of the manuscript. The manuscript will undergo copyediting, typesetting, and review of the resulting proof before it is published in its final form. Please note that during the production process errors may be discovered which could affect the content, and all legal disclaimers that apply to the journal pertain.
References
- Allen JF (1996). “Separate sexes and the mitochondrial theory of ageing.” J Theor Biol 180(2): 135–140. [DOI] [PubMed] [Google Scholar]
- Artuso L, Romano A, Verri T, Domenichini A, Argenton F, Santorelli FM and Petruzzella V (2012). “Mitochondrial DNA metabolism in early development of zebrafish (Danio rerio).” Biochim Biophys Acta 1817(7): 1002–1011. [DOI] [PubMed] [Google Scholar]
- Auer SK, Salin K, Rudolf AM, Anderson GJ and Metcalfe NB (2015). “The optimal combination of standard metabolic rate and aerobic scope for somatic growth depends on food availability.” Functional Ecology 29(4): 479–486. [Google Scholar]
- Bess AS, Ryde IT, Hinton DE and Meyer JN (2013). “UVC-induced mitochondrial degradation via autophagy correlates with mtDNA damage removal in primary human fibroblasts.” J Biochem Mol Toxicol 27(1): 28–41. [DOI] [PMC free article] [PubMed] [Google Scholar]
- Bouhours-Nouet N, May-Panloup P, Coutant R, de Casson FB, Descamps P, Douay O, Reynier P, Ritz P, Malthièry Y and Simard G (2005). “Maternal smoking is associated with mitochondrial DNA depletion and respiratory chain complex III deficiency in placenta.” Am J Physiol Endocrinol Metab 288(1): E171–177. [DOI] [PubMed] [Google Scholar]
- Chappel S (2013). “The role of mitochondria from mature oocyte to viable blastocyst.” Obstet Gynecol Int 2013: 183024. [DOI] [PMC free article] [PubMed] [Google Scholar]
- Cheng J, Nanayakkara G, Shao Y, Cueto R, Wang L, Yang WY, Tian Y, Wang H and Yang X (2017). “Mitochondrial Proton Leak Plays a Critical Role in Pathogenesis of Cardiovascular Diseases.” Adv Exp Med Biol 982: 359–370. [DOI] [PMC free article] [PubMed] [Google Scholar]
- Clark BW, Cooper EM, Stapleton HM and Di Giulio RT (2013). “Compound- and mixture-specific differences in resistance to polycyclic aromatic hydrocarbons and PCB-126 among Fundulus heteroclitus subpopulations throughout the Elizabeth River estuary (Virginia, USA).” Environ Sci Technol 47(18): 10556–10566. [DOI] [PMC free article] [PubMed] [Google Scholar]
- Clemente DB, Casas M, Vilahur N, Begiristain H, Bustamante M, Carsin AE, Fernández MF, Fierens F, Gyselaers W, Iñiguez C, Janssen BG, Lefebvre W, Llop S, Olea N, Pedersen M, Pieters N, Santa Marina L, Souto A, Tardón A, Vanpoucke C, Vrijheid M, Sunyer J and Nawrot TS (2016). “Prenatal Ambient Air Pollution, Placental Mitochondrial DNA Content, and Birth Weight in the INMA (Spain) and ENVIRONAGE (Belgium) Birth Cohorts.” Environ Health Perspect 124(5): 659–665. [DOI] [PMC free article] [PubMed] [Google Scholar]
- Chacko BK, Kramer PA, Ravi S, Benavides GA, Mitchell T, Dranka BP, Ferrick D, Singal AK, Ballinger SW, Bailey SM, Hardy RW, Zhang J, Zhi D and Darley-Usmar VM (2014). “The Bioenergetic Health Index: a new concept in mitochondrial translational research.” Clin Sci (Lond) 127(6): 367–373. [DOI] [PMC free article] [PubMed] [Google Scholar]
- Corrales J, Fang X, Thornton C, Mei W, Barbazuk WB, Duke M, Scheffler BE and Willett KL (2014). “Effects on specific promoter DNA methylation in zebrafish embryos and larvae following benzo[a]pyrene exposure.” Comp Biochem Physiol C Toxicol Pharmacol 163: 37–46. [DOI] [PMC free article] [PubMed] [Google Scholar]
- Corrales J, Thornton C, White M and Willett KL (2014). “Multigenerational effects of benzo[a]pyrene exposure on survival and developmental deformities in zebrafish larvae.” Aquat Toxicol 148: 16–26. [DOI] [PMC free article] [PubMed] [Google Scholar]
- Crépeaux G, Bouillaud-Kremarik P, Sikhayeva N, Rychen G, Soulimani R and Schroeder H (2012). “Late effects of a perinatal exposure to a 16 PAH mixture: Increase of anxiety-related behaviours and decrease of regional brain metabolism in adult male rats.” Toxicol Lett 211(2): 105–113. [DOI] [PubMed] [Google Scholar]
- Desai G, Chu L, Guo Y, Myneni AA and Mu L (2017). “Biomarkers used in studying air pollution exposure during pregnancy and perinatal outcomes: a review.” Biomarkers 22(6): 489–501. [DOI] [PMC free article] [PubMed] [Google Scholar]
- Du X, Crawford DL and Oleksiak MF (2015). “Effects of Anthropogenic Pollution on the Oxidative Phosphorylation Pathway of Hepatocytes from Natural Populations of Fundulus heteroclitus.” Aquat Toxicol 165: 231–240. [DOI] [PubMed] [Google Scholar]
- Eadie B, Faust W and Landrum P (1983). Bioconcentrations of PAH by some benthic organisms of the Great Lakes. In: Cooke M, Dennis AJ, eds. Polynuclear aromatic hydrocarbons: Formation, metabolism and measurement. Columbus, OH, Battelle Press: 437–449. [Google Scholar]
- Everson RB, Randerath E, Santella RM, Cefalo RC, Avitts TA and Randerath K (1986). “Detection of smoking-related covalent DNA adducts in human placenta.” Science 231(4733): 54–57. [DOI] [PubMed] [Google Scholar]
- Godschalk R, Remels A, Hoogendoorn C, van Benthem J, Luijten M, Duale N, Brunborg G, Olsen AK, Bouwman FG, Munnia A, Peluso M, Mariman E and van Schooten FJ (2018). “Paternal Exposure to Environmental Chemical Stress Affects Male Offspring’s Hepatic Mitochondria.” Toxicol Sci 162(1): 241–250. [DOI] [PubMed] [Google Scholar]
- Gonzalez-Hunt CP, Rooney JP, Ryde IT, Anbalagan C, Joglekar R and Meyer JN (2016). “PCR-Based Analysis of Mitochondrial DNA Copy Number, Mitochondrial DNA Damage, and Nuclear DNA Damage.” Curr Protoc Toxicol 67: 20.11.21–20.11.25. [DOI] [PMC free article] [PubMed] [Google Scholar]
- Graziewicz MA, Sayer JM, Jerina DM and Copeland WC (2004). “Nucleotide incorporation by human DNA polymerase gamma opposite benzo[a]pyrene and benzo[c]phenanthrene diol epoxide adducts of deoxyguanosine and deoxyadenosine.” Nucleic Acids Res 32(1): 397–405. [DOI] [PMC free article] [PubMed] [Google Scholar]
- Hershberger KA, Rooney JP, Turner EA, Donoghue LJ, Bodhicharla R, Maurer LL, Ryde IT, Kim JJ, Joglekar R, Hibshman JD, Smith LL, Bhatt DP, Ilkayeva OR, Hirschey MD and Meyer JN (2021). “Early-life mitochondrial DNA damage results in lifelong deficits in energy production mediated by redox signaling in Caenorhabditis elegans.” Redox Biol 43: 102000. [DOI] [PMC free article] [PubMed] [Google Scholar]
- Hunter SE, Jung D, Di Giulio RT and Meyer JN (2010). “The QPCR assay for analysis of mitochondrial DNA damage, repair, and relative copy number.” Methods 51(4): 444–451. [DOI] [PMC free article] [PubMed] [Google Scholar]
- Jansen RP and Burton GJ (2004). “Mitochondrial dysfunction in reproduction.” Mitochondrion 4(5–6): 577–600. [DOI] [PubMed] [Google Scholar]
- Jastroch M, Divakaruni AS, Mookerjee S, Treberg JR and Brand MD (2010). “Mitochondrial proton and electron leaks.” Essays Biochem 47: 53–67. [DOI] [PMC free article] [PubMed] [Google Scholar]
- Jayasundara N (2017). “Ecological significance of mitochondrial toxicants.” Toxicology 391: 64–74. [DOI] [PubMed] [Google Scholar]
- Jayasundara N, Kozal JS, Arnold MC, Chan SS and Di Giulio RT (2015). “High-Throughput Tissue Bioenergetics Analysis Reveals Identical Metabolic Allometric Scaling for Teleost Hearts and Whole Organisms.” PLoS One 10(9): e0137710. [DOI] [PMC free article] [PubMed] [Google Scholar]
- Jiang L, Zhang J, Wang JJ, Wang L, Zhang L, Li G, Yang X, Ma X, Sun X, Cai J, Huang X, Yu M, Wang X, Liu F, Wu CI, He C, Zhang B, Ci W and Liu J (2013). “Sperm, but not oocyte, DNA methylome is inherited by zebrafish early embryos.” Cell 153(4): 773–784. [DOI] [PMC free article] [PubMed] [Google Scholar]
- Jung D, Cho Y, Collins LB, Swenberg JA and Di Giulio RT (2009). “Effects of benzo[a]pyrene on mitochondrial and nuclear DNA damage in Atlantic killifish (Fundulus heteroclitus) from a creosote-contaminated and reference site.” Aquat Toxicol 95(1): 44–51. [DOI] [PMC free article] [PubMed] [Google Scholar]
- Kasiviswanathan R, Gustafson MA, Copeland WC and Meyer JN (2012). “Human mitochondrial DNA polymerase γ exhibits potential for bypass and mutagenesis at UV-induced cyclobutane thymine dimers.” J Biol Chem 287(12): 9222–9229. [DOI] [PMC free article] [PubMed] [Google Scholar]
- Knecht AL, Truong L, Marvel SW, Reif DM, Garcia A, Lu C, Simonich MT, Teeguarden JG and Tanguay RL (2017). “Transgenerational inheritance of neurobehavioral and physiological deficits from developmental exposure to benzo[a]pyrene in zebrafish.” Toxicol Appl Pharmacol 329: 148–157. [DOI] [PMC free article] [PubMed] [Google Scholar]
- Lei F, Wang W, Fu Y, Wang J and Zheng Y (2018). “Oxidative stress and mitochondrial dysfunction in parafacial respiratory group induced by maternal cigarette smoke exposure in rat offspring.” Free Radic Biol Med 129: 169–176. [DOI] [PubMed] [Google Scholar]
- Lozoya OA, Xu F, Grenet D, Wang T, Grimm SA, Godfrey V, Waidyanatha S, Woychik RP and Santos JH (2020). “Single Nucleotide Resolution Analysis Reveals Pervasive, Long-Lasting DNA Methylation Changes by Developmental Exposure to a Mitochondrial Toxicant.” Cell Rep 32(11): 108131. [DOI] [PMC free article] [PubMed] [Google Scholar]
- Luz AL and Meyer JN (2016). “Effects of reduced mitochondrial DNA content on secondary mitochondrial toxicant exposure in Caenorhabditis elegans.” Mitochondrion 30: 255–264. [DOI] [PMC free article] [PubMed] [Google Scholar]
- Massarsky A, Jayasundara N, Bailey JM, Oliveri AN, Levin ED, Prasad GL and Di Giulio RT (2015). “Teratogenic, bioenergetic, and behavioral effects of exposure to total particulate matter on early development of zebrafish (Danio rerio) are not mimicked by nicotine.” Neurotoxicol Teratol 51: 77–88. [DOI] [PMC free article] [PubMed] [Google Scholar]
- Massarsky A, Kozal JS and Di Giulio RT (2017). “Glutathione and zebrafish: Old assays to address a current issue.” Chemosphere 168: 707–715. [DOI] [PMC free article] [PubMed] [Google Scholar]
- Meyer JN, Leung MC, Rooney JP, Sendoel A, Hengartner MO, Kisby GE and Bess AS (2013). “Mitochondria as a target of environmental toxicants.” Toxicol Sci 134(1): 1–17. [DOI] [PMC free article] [PubMed] [Google Scholar]
- Miller RL, Yan Z, Maher C, Zhang H, Gudsnuk K, McDonald J and Champagne FA (2016). “Impact of prenatal polycyclic aromatic hydrocarbon exposure on behavior, cortical gene expression and DNA methylation of the.” Neuroepigenetics 5: 11–18. [DOI] [PMC free article] [PubMed] [Google Scholar]
- Mishra P and Chan DC (2014). “Mitochondrial dynamics and inheritance during cell division, development and disease.” Nat Rev Mol Cell Biol 15(10): 634–646. [DOI] [PMC free article] [PubMed] [Google Scholar]
- Otten AB, Theunissen TE, Derhaag JG, Lambrichs EH, Boesten IB, Winandy M, van Montfoort AP, Tarbashevich K, Raz E, Gerards M, Vanoevelen JM, van den Bosch BJ, Muller M and Smeets HJ (2016). “Differences in Strength and Timing of the mtDNA Bottleneck between Zebrafish Germline and Non-germline Cells.” Cell Rep 16(3): 622–630. [DOI] [PubMed] [Google Scholar]
- Perera FP, Wang S, Rauh V, Zhou H, Stigter L, Camann D, Jedrychowski W, Mroz E and Majewska R (2013). “Prenatal exposure to air pollution, maternal psychological distress, and child behavior.” Pediatrics 132(5): e1284–1294. [DOI] [PMC free article] [PubMed] [Google Scholar]
- Schütt F, Aretz S, Auffarth GU and Kopitz J (2012). “Moderately reduced ATP levels promote oxidative stress and debilitate autophagic and phagocytic capacities in human RPE cells.” Invest Ophthalmol Vis Sci 53(9): 5354–5361. [DOI] [PubMed] [Google Scholar]
- Shokolenko IN, Alexeyev MF. Mitochondrial transcription in mammalian cells. Front Biosci (Landmark Ed). 2017. Jan 1;22(5):835–853. doi: 10.2741/4520. [DOI] [PMC free article] [PubMed] [Google Scholar]
- Stackley KD, Beeson CC, Rahn JJ and Chan SS (2011). “Bioenergetic profiling of zebrafish embryonic development.” PLoS One 6(9): e25652. [DOI] [PMC free article] [PubMed] [Google Scholar]
- Volkoff SJ, Osterberg JS, Jayasundara N, Cooper E, Hsu-Kim H, Rogers L, Gehrke GE, Jayaraman S and Di Giulio RT (2019). “Embryonic Fundulus heteroclitus responses to sediment extracts from differentially contaminated sites in the Elizabeth River, VA.” Ecotoxicology 28(9): 1126–1135. [DOI] [PMC free article] [PubMed] [Google Scholar]
- Weinhouse C (2017). “Mitochondrial-epigenetic crosstalk in environmental toxicology.” Toxicology 391: 5–17. [DOI] [PMC free article] [PubMed] [Google Scholar]
Associated Data
This section collects any data citations, data availability statements, or supplementary materials included in this article.