

Abstract
Objective:
Symptoms in gastroparesis (Gp) and functional dyspepsia (FD) overlap; using egg protein substitute to measure gastric emptying of solids (GES), ~40% of patients are reclassified from Gp to FD, and vice-versa. Our aim was to assess inter- and intra-coefficients of variation (COV) in GES in symptomatic patients with Gp or FD with documented slow or normal GES respectively.
Design:
Scintigraphic GES (T1/2 and GE% at 2 and 4h) using a 320kcal real egg meal (30% fat) was tested in the following: single measurements in 20 patients with diabetes mellitus (10 each type 1 and type 2); repeat GES to estimate COVintra measured: 3 days apart in 9 Gp, 4 weeks apart in 21 Gp and 18 with FD with normal GE assigned to placebo, and in 70 patients at 94.3 weeks (median) apart.
Results:
COVinter for GE% at 4h and GE T1/2 were respectively 14.2% and 23.5% in FD and 27.5% and 33% in Gp; COVintra for GE% at 4h and GE T1/2 up to 4 weeks apart were 23.4% and 37.9% in FD and 20.1% and 33% in Gp. GE% at 2h showed less consistent results. However, >85% retained original diagnosis as normal or delayed. From clinical GES to baseline research for Gp group, repeat GES (after treatment) showed the COVintra for GE% at 4h was 37.3% at median 94.3 weeks, with 26/70 changed diagnoses.
Conclusion:
The 320kcal (30% fat) GES scintigraphic test provides consistent diagnosis in >85% and should be the standard test for suspected gastric emptying disorders.
Keywords: emptying, prokinetic, percent, T1/2
INTRODUCTION
An optimal method to measure gastric emptying (GE) is of paramount importance for clinical practice and research. Earlier research suggested that GE delay and symptoms may not be correlated (1) or that symptomatic responses to treatment may not be associated with improved GE.(2) Other studies have demonstrated association of delayed GE and symptoms,(3) confirmed in an analysis of the literature for significant association of optimally measured GE with upper gastrointestinal symptoms, particularly the individual symptoms of nausea and vomiting.(4) A meta-regression of therapeutic studies has shown a significant association of reduction in GE T1/2 (that is acceleration of GE) with a significant recognizable clinical improvement of upper gastrointestinal symptoms.(5)
National societies (6) endorse measurement of GE of solids (GES) in clinical practice for identification of abnormalities in gastric motor functions, for investigation of pathophysiological mechanisms that might contribute to patients’ symptoms, and for evaluation of efficacy of approved or unapproved prokinetic agents. Although stable isotope breath tests are also approved for clinical appraisal of patients with suspected GE delay,(7) scintigraphic measurement of GE continues to be the most commonly used method. However, among 339 patients referred to a tertiary center for suspected gastroparesis, only 196 patients (57.8%) had been evaluated with a GE study; 130 of these patients (38.3%) had undergone a 4-hour GE study but only 23 patients (6.8%) ingested radiolabeled eggs as the test meal. Sixty-six patients (19.5%) were ultimately confirmed to have gastroparesis, whereas 273 (80.5%) received an alternative diagnosis.(8)
Optimization of GE measurement is therefore critically important. Performance characteristics of the measurements of GES in healthy adult participants have been previously documented in the literature (9, 10) based on the emptying of a 320 kilocalorie, 30% fat egg meal. The latter study (10) also provided information regarding inter-individual and intra-individual coefficients of variation (COV) in 319 healthy adults (214 females, 105 males), which were predictably lowest for the percent emptied from the stomach at 4 hours [GE4h (COVinter, 9.6%)]; the overall COVintra for GE T1/2 was 23.8% and for GE4h was 12.6%.(10) An alternative meal composed of egg-protein substitute (Egg Beaters®) used in many studies (11) uses >10% retained at 4 hours as a cut-off for diagnosing delayed GE based on the 95%ile in 100 healthy volunteers studied at multiple centers. Others have determined that this test has not been widely adopted and instead proposed use of the Nottingham Test Meal (NTM) consisting of 400mL liquid nutrient (0.75 kcal/mL with 111In radiolabel) and an optional solid component (12 solid agar-beads, 0 kcal, with 99mTc radiolabel).(12) With this test meal, the GE T1/2 with the liquid- and solid-component NTM was median 44 minutes (95% confidence interval of the mean in 74 healthy adults of 28–78 min) and 162 minutes (144–193 min), respectively.(13) This approach has been applied using liquid GE alone in 330 consecutive adult, non-diabetic patients with dyspeptic symptoms, and estimated the interquartile range for T1/2 from 61 healthy controls (38–56 minutes) and revealed frequently observed patterns included normal early- with slow late-phase (25%) and fast early- with slow late-phase emptying (27%).(14) There is evidence that such a caloric liquid meal empties at approximately the same rate with the same pattern of emptying as the Egg Beaters® meal.(15)
For the liquid nutrient and the Egg Beaters® meal, there are, to date, no reported intra-individual variations reported. Intra-individual variations among patients with gastroparesis have scarcely been documented in the literature. A prior study documented the inter- and intra-subject variability of GES, but the sample size was only 26, with 14 diabetic patients and 12 healthy controls.(16) In 61 patients with upper gastrointestinal symptoms (21 diabetic) who underwent GE measurements twice with the same 320kcal, 30% fat egg meal, performed with an average interval of 15 days apart, the COVinter for GE T1/2 was 40% and the COVintra was 20%. These COV measurements were similar in patients with diabetes and in those who did not have diabetes.(17) It is worth noting, however, that the COVintra for GE T1/2 was higher in patients with rapid (28%) GE than in those with delayed (18%) GE or those with normal GE (12%). Conversely, the COVintra for GE% emptied at 4h was lower (3%) in patients with rapid emptying compared to 19% with delayed emptying and 12% with normal emptying.(17)
The National Institutes of Health Gastroparesis Consortium documented symptom overlap in patients with gastroparesis and functional dyspepsia, and the symptoms were associated with differences in GE measurements (18) at 4h that used the lower calorie and low fat (2%) meal (Egg Beaters®). The study showed that, over 48 weeks, 42% of patients with an initial diagnosis of gastroparesis were reclassified as having functional dyspepsia based on normalization of GE results (<10% retained at 4h) at 48 weeks after receiving treatment for gastroparesis; conversely, 37% of patients with functional dyspepsia were reclassified as having gastroparesis based on >10% retained at 4h on GE test at 48 weeks.(18)
Given these findings, it is necessary to further characterize the variations between and within patients with upper gastrointestinal symptoms, particularly in patients with diabetes mellitus and in patients with the prior diagnosis of gastroparesis based on slow GE or functional dyspepsia with normal GE. The current cohort studied differs from our prior study of patients with upper GI symptoms,(17) in that the current study of intra-subject COV was conducted in patients with confirmed gastroparesis based on slow GE as well as in patients with functional dyspepsia with normal GE.(17) Thus, our aims were to assess COVinter of scintigraphic measurements of GE conducted in prior studies in patients with type 1 diabetes or idiopathic gastroparesis and in patients with type 2 diabetes and gastroduodenal symptoms,(19, 20) and to measure COVintra in patients with proven gastroparesis by comparing results at baseline and after treatment for 3 days with placebo in a randomized, parallel-group design trial of the effects of felcisetrag (21) or after treatment for 4 weeks (22, 23) in randomized, parallel-group design trials of the effects of cannabidiol (CBD).
MATERIALS AND METHODS
Data Source
We retrospectively obtained data from a database of published GE studies conducted in patients with type 1 or 2 diabetes (19, 20) who reported having gastroduodenal symptoms and who had previously participated in placebo-controlled, crossover trials of the effects of RM-131 (relamorelin). A second cohort (21) consisted of patients with an established diagnosis of gastroparesis (7 idiopathic, 3 diabetic) who had previously participated in a parallel-group, randomized, controlled trial of felcisetrag. Two additional cohorts with documented GE of the same 320kcal, 30% fat meal with gastroparesis (23) or functional dyspepsia with normal gastric emptying (22) who participated in a placebo-controlled, parallel-group, 4-week duration study of cannabidiol were also included in the current analysis. These cohorts are summarized in Table 1.
Table 1.
Overview of cohorts and data used for analysis of performance of gastric emptying studies
| Study cohort | Disease/condition | Medication | Design of placebo-control RCT | Data used | N for inter-subject analysis | N for intra-subject analysis |
|---|---|---|---|---|---|---|
| Cohort 1 (RM-131 [relamorelin] study) | Type 1 or 2 DM with gastroduodenal symptoms | RM-131 (relamorelin) | crossover | Placebo arm (baseline only) | 20 (10 DM1, 10 DM2) | NA |
| Cohort 2 (Felcisetrag study) | Gastroparesis | Felcisetrag | parallel-group | Placebo arm (baseline and day 3) | 10# | 9 |
| Cohort 3 (CBD study - gastroparesis) | Gastroparesis | CBD | parallel-group | Placebo arm (baseline and week 4) | 23 | 21 |
| Cohort 4 (CBD study - functional dyspepsia) | Functional dyspepsia | CBD | parallel-group | Placebo arm (baseline and week 4) | 18 | 18 |
CBD = cannabidiol; DM = diabetes mellitus; RCT = randomized controlled trial
:one participant had incomplete data during placebo treatment and was excluded from the intra-subject analysis
For all these participants, only the data from the placebo treatment arm were used, and for the patients with gastroparesis in the felcisetrag and CBD studies and those with functional dyspepsia in the CBD study, we used both sets of data at baseline and at the end of treatment during which participants had been randomized in a blinded manner to placebo.
For 70 patients who participated in the studies, we also compared the results of the diagnostic GES test performed in the clinical nuclear medicine lab with the baseline GES performed in the research lab.
Our research team (gastroenterologists, nurses, technologists, study coordinators) evaluated all the participants in specific studies conducted by our research team in our Clinical Research Trials Unit. All participants underwent clinical evaluations including physical examination and review of their medical records to be sure there were no additional confounders that could alter their GE results such as opioid use or concomitant treatment with agents that could retard GE. Additional details regarding the clinical manifestations of the participants are included in the previously published articles.(19–23)
Written informed consent was obtained from all participants in each of the previous studies. This specific study, which formed the basis for the analysis reported in this paper, was approved by Mayo Clinic Institutional Review Board (IRB #21-003438). The medical records of any patients who had denied authorization of use of their medical (including research) records for research purposes were not used in the analysis in the current study, as required by the Institutional Review Board.
Gastric Emptying Study
We measured GE by our established, validated scintigraphic method.(10) Patients ate a 99mTc-labeled meal of 2 scrambled eggs (standard size), 1 slice of whole wheat bread, and 1 glass (240mL) of skim (<1% fat) milk (320kcal, 30% fat) after fasting overnight for at least 8 hours. Abdominal images were obtained with a gamma camera, each for a duration of 2 minutes. The images were taken with an anterior view and a posterior view immediately after eating the radiolabeled egg meal. Additional anterior and posterior images were then obtained at specified times over the next 4 hours: every 15 minutes during the first 2 hours, and every 30 minutes during the last 2 hours. All clinical diagnostic studies included at least GE results at 1h, 2h, and 4h. In preparation for the GE studies performed in the clinical diagnostic lab, or the research lab, all study participants were informed not to take any prescription or over-the-counter medications that could interfere with GE for at least 48 hours before and during their tests. Patients with diabetes participating in research GE tests undergo measurement of fasting blood glucose with correction of levels >250mg/dL with short-acting insulin SQ, based on a standard algorithm.
Data Collection
We quantified transit measurements based on 99mTc counts measured within a 140keV (±20%) window. To quantify the counts in the stomach, we used a variable region of interest program, and all regions of interest were drawn by one technologist (DB). Our primary endpoint was the GE T1/2, which was estimated from a plot that linearly interpolated the imaging data obtained during the 4 hours after eating the radiolabeled meal. We also quantitated the gastric emptying results by the percent (%) emptied from the stomach at 1h, 2h, 3h, and 4h after eating the radiolabeled meal. This was consistent with previous publication that such data provide clinically relevant information,(11, 24) providing the basis for the consensus recommendations of the American Neurogastroenterology and Motility Society and the Society of Nuclear Medicine.(6) These endpoints were shown to be relevant as optimal measurement of GE that correlated with upper gastrointestinal symptoms and responsiveness to prokinetic agents.(4, 5)
Assessments of Inter- and Intra-individual Variations in Gastric Emptying Measurements
The inter-subject variations (COVinter) were estimated from the transit parameters (GE T1/2, GE2h and GE4h) among 20 participants with type 1 or type 2 diabetes with gastroduodenal symptoms when they received placebo in the crossover studies. In the parallel-group designed studies with felcisetrag (21) and cannabidiol,(22, 23) the baseline measurement was used to estimate the COVinter for the patients with functional dyspepsia or gastroparesis.
Intra-subject variations (COVintra) were derived from the two transit values obtained 3 days apart for the 9 patients with gastroparesis [felcisetrag trial (21) in which one participant had incomplete data during placebo treatment and was excluded from the intra-subject analysis], 21 patients with gastroparesis [CBD trial (23)] and 18 patients with FD [CBD trial (22)] who were blindly randomized to placebo treatment. COVintra was also calculated for 70 patients in whom there was measurement of GES using the same method in the clinical diagnostic practice and compared to the measurement obtained during placebo treatment in the respective clinical trials. For these patients, we also estimated the time lag in weeks between the two measurements.
Statistical Analysis
We used descriptive statistics to summarize participant demographics in each of the three groups as well as GE endpoints; all these data are mean ± SEM.
The COVinter were calculated by the standard deviation divided by the mean and expressed as a percent. The COVintra was calculated for the patients with functional dyspepsia or gastroparesis randomly assigned to treatment with placebo who were studied on two occasions (at baseline and at the end of treatment with placebo) by dividing the standard deviation of the within subject differences by the overall (grand) mean of the corresponding transit measurements (10) and expressed as a percent. Bland–Altman plots (25) were used to assess visually the intra-subject variations in GE. Spearman correlations were performed to assess correlations e.g., between measurements at baseline and after placebo treatment. All statistical analyses were conducted using SigmaPlot 12 (Systat Software Inc, San Jose, CA).
RESULTS
Inter-individual coefficient of variation
Table 2 summarizes the demographic features of the patient cohorts and COVinter for each group of patients in the different studies. The first group of 20 patients with diabetes included those with or without gastroparesis, and their clinical characteristics as described in the original trials are available in Supplemental Table 1. Their COVinter reflected the prior clinical diagnoses, with higher COVinter compared to the more defined cohorts with functional dyspepsia or established gastroparesis. This is illustrated by the COVinter of 44.9% compared to 23.5% in functional dyspepsia and 33% in gastroparesis. For all groups, the COVinter was lowest for GE% emptied at 4h, and highest for GE% emptied at 2h.
Table 2.
Gastric emptying results at first (or baseline) measurement of different groups as well as COVinter. Data are mean ± SEM or percent variation.
| Group | N | Age (yr) | Sex (F/M) | BMI, kg/m2 | GE2h % | GE4h % | T1/2, min |
|---|---|---|---|---|---|---|---|
| DM1 or IG + GD symptoms | 10 | 45.7 ± 4.4 | 8/2 | 24.1 ± 1.1 | 22.0 ± 3.7 | 68.0 ± 5.7 | 206 ± 27 |
| DM2 + GD symptoms | 10 | 51.8 ± 2.5 | 10/0 | 31.1 ± 1.7 | 51.7 ± 10.8 | 83.8 ± 4.7 | 128 ± 19 |
| COVinter DM1, IG and DM2 | 20 | 60.0% | 22.6% | 44.9% | |||
| Functional dyspepsia (CBD trial) | 18 | 33.6 ± 2.8 | 13/5 | 25.40 ± 1.18 | 47.2 ± 7.5 | 86.1 ± 2.9 | 140.6 ± 7.8 |
| COVinter functional dyspepsia | 18 | 39.9% | 14.2% | 23.5% | |||
| Gastroparesis (felcisetrag trial) | 10 | 46.7 ± 5.0 | 8/2 | 24.63 ± 1.75 | 21.7 ± 3.4 | 68.3 ± 5.4 | 206 ± 22 |
| Gastroparesis (CBD trial) | 23 | 42.3 ± 3.0 | 18/5 | 27.44 ± 1.04 | 25.0 ± 3.3 | 68.1 ± 4.0 | 209 ± 14 |
| Combined gastroparesis (felceistrag+CBD trial) | 33 | 43.6 ± 2.5 | 26/7 | 26.59 ± 0.91 | 24.0 ± 2.5 | 68.2 ± 4.7 | 208 ± 12 |
| COVinter gastroparesis | 33 | 60.6% | 27.5% | 33.0% | |||
BMI=body mass index; CBD=cannabidiol; COVinter=inter-subject coefficient of variation; DM=diabetes mellitus, type 1 or type 2; F=female; GD=gastroduodenal; GE=gastric emptying; h=hour; IG=idiopathic gastroparesis; M=male; min=minutes; yr=years
Intra-individual coefficient of variation between baseline, and end of placebo treatment
Figure 1 shows the parameters of GE T1/2 and percent emptied at 2h and 4h in 17 patients with functional dyspepsia and documented normal GE. The correlation curves with 95% confidence interval show consistent results, and the upper limits of normal range (174min for GE T1/2, 25% for GE at 2h and 75% for GE at 4h) document the misclassification of GE on repeat tests in only 3 patients. Bland-Altman plot (Figure 2) shows consistency of GE data for the majority of patients with functional dyspepsia, with the vast majority of the replicate data within 40 minutes difference for GE T1/2, 20% difference for GE at 2h and 10% difference for GE at 4h. The COVintra are also documented in Table 3, in which it is noted that the data are more consistent for GE% emptied at 4h (16.6%) and GE T1/2 (21.2%), compared to GE% emptied at 2h (33.1%).
Figure 1.
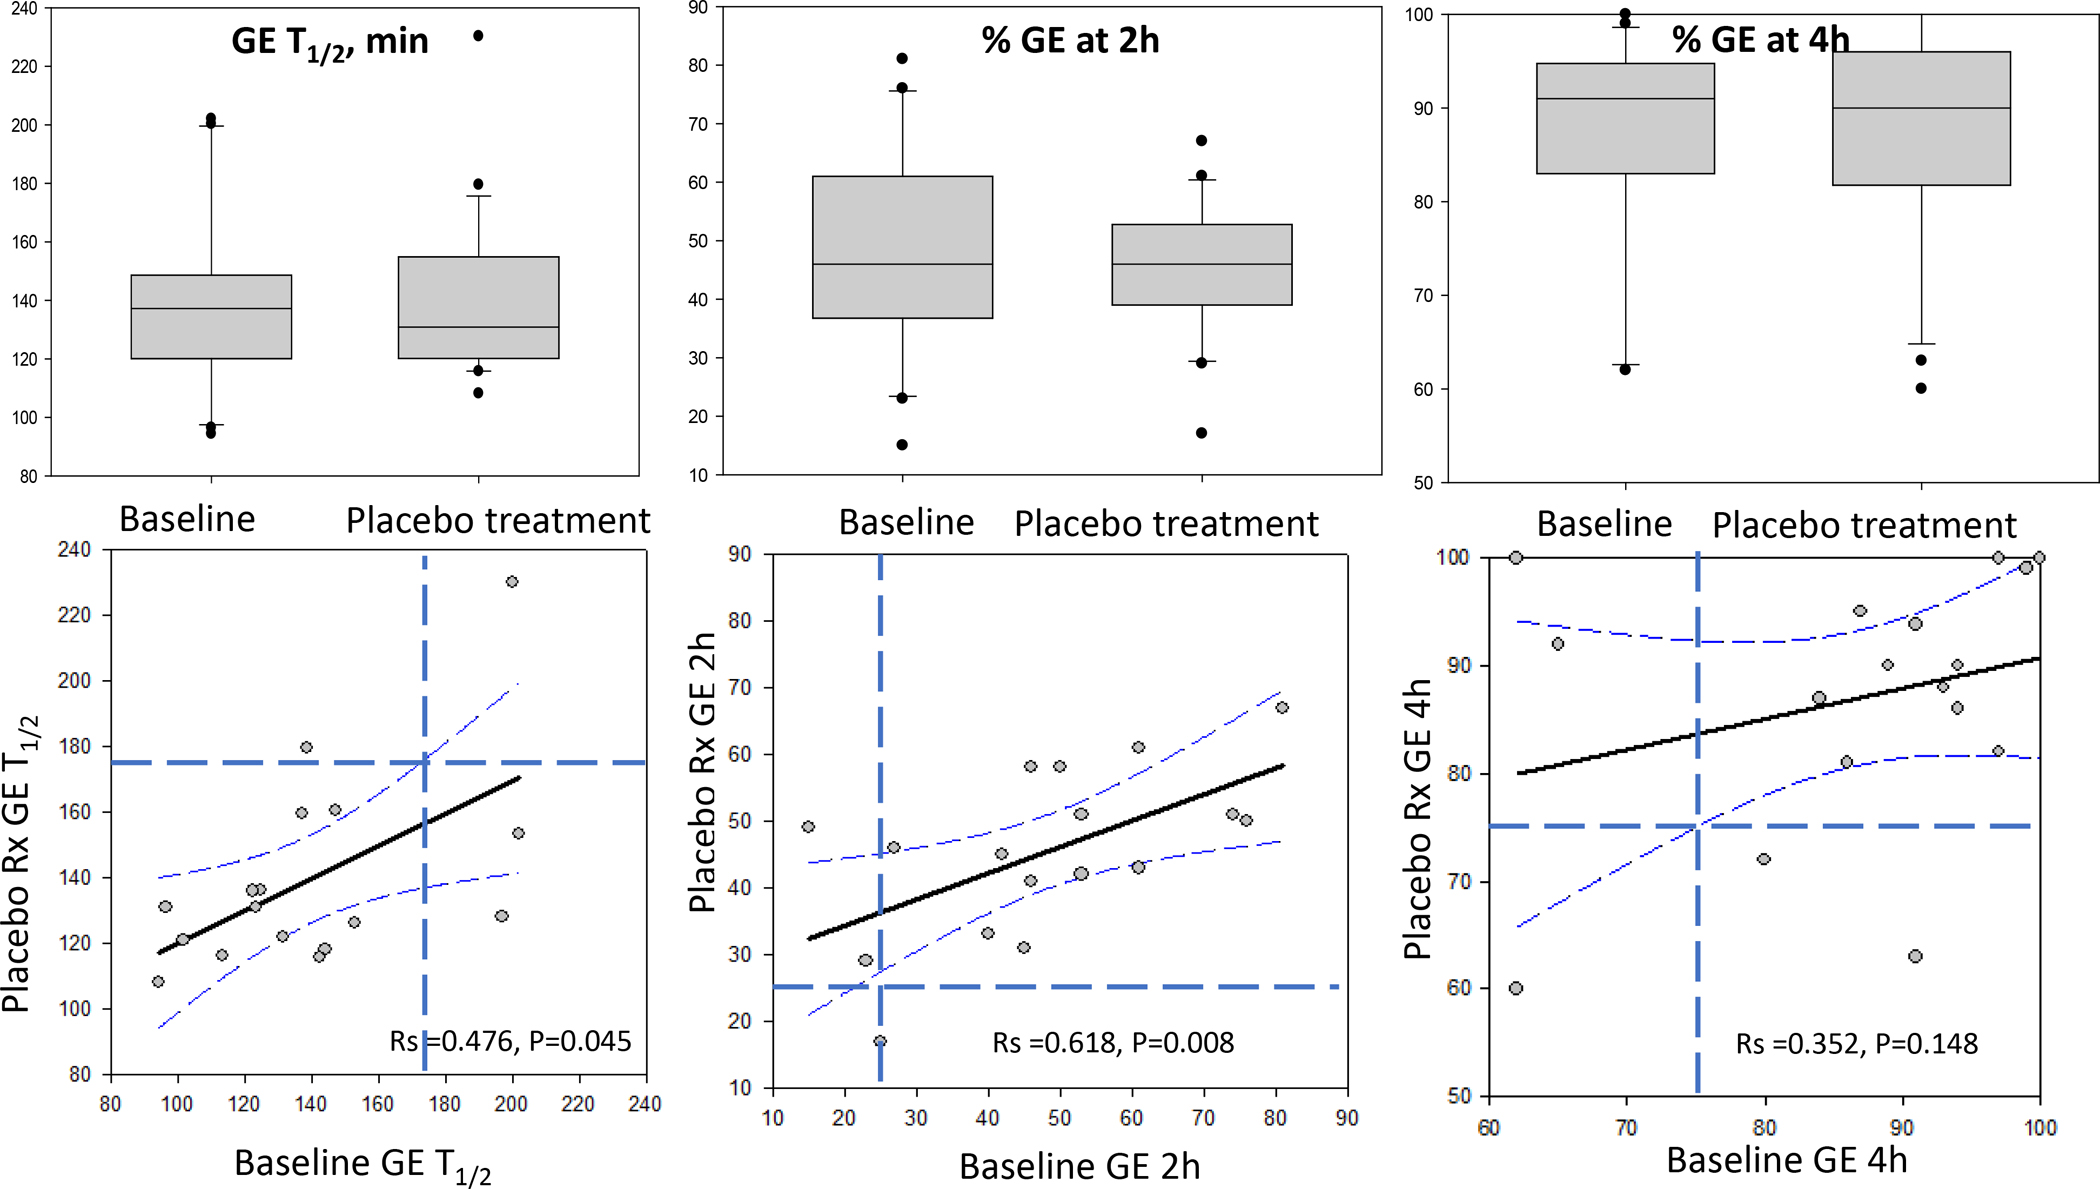
Parameters of gastric emptying (GE) of solids in patients with functional dyspepsia and documented normal gastric emptying showing interquartile range, 5% and 95% confidence interval (CI) and outliers at baseline and after treatment with placebo for 4 weeks (upper panel). Lower panel shows correlations with 95% CI of regression and upper limit of normal range shown by interrupted lines (174 minutes for GE T1/2, 25% for GE at 2 hours, and 75% for GE at 4 hours). Note 3 patients had delayed emptying on repeat test.
Figure 2.
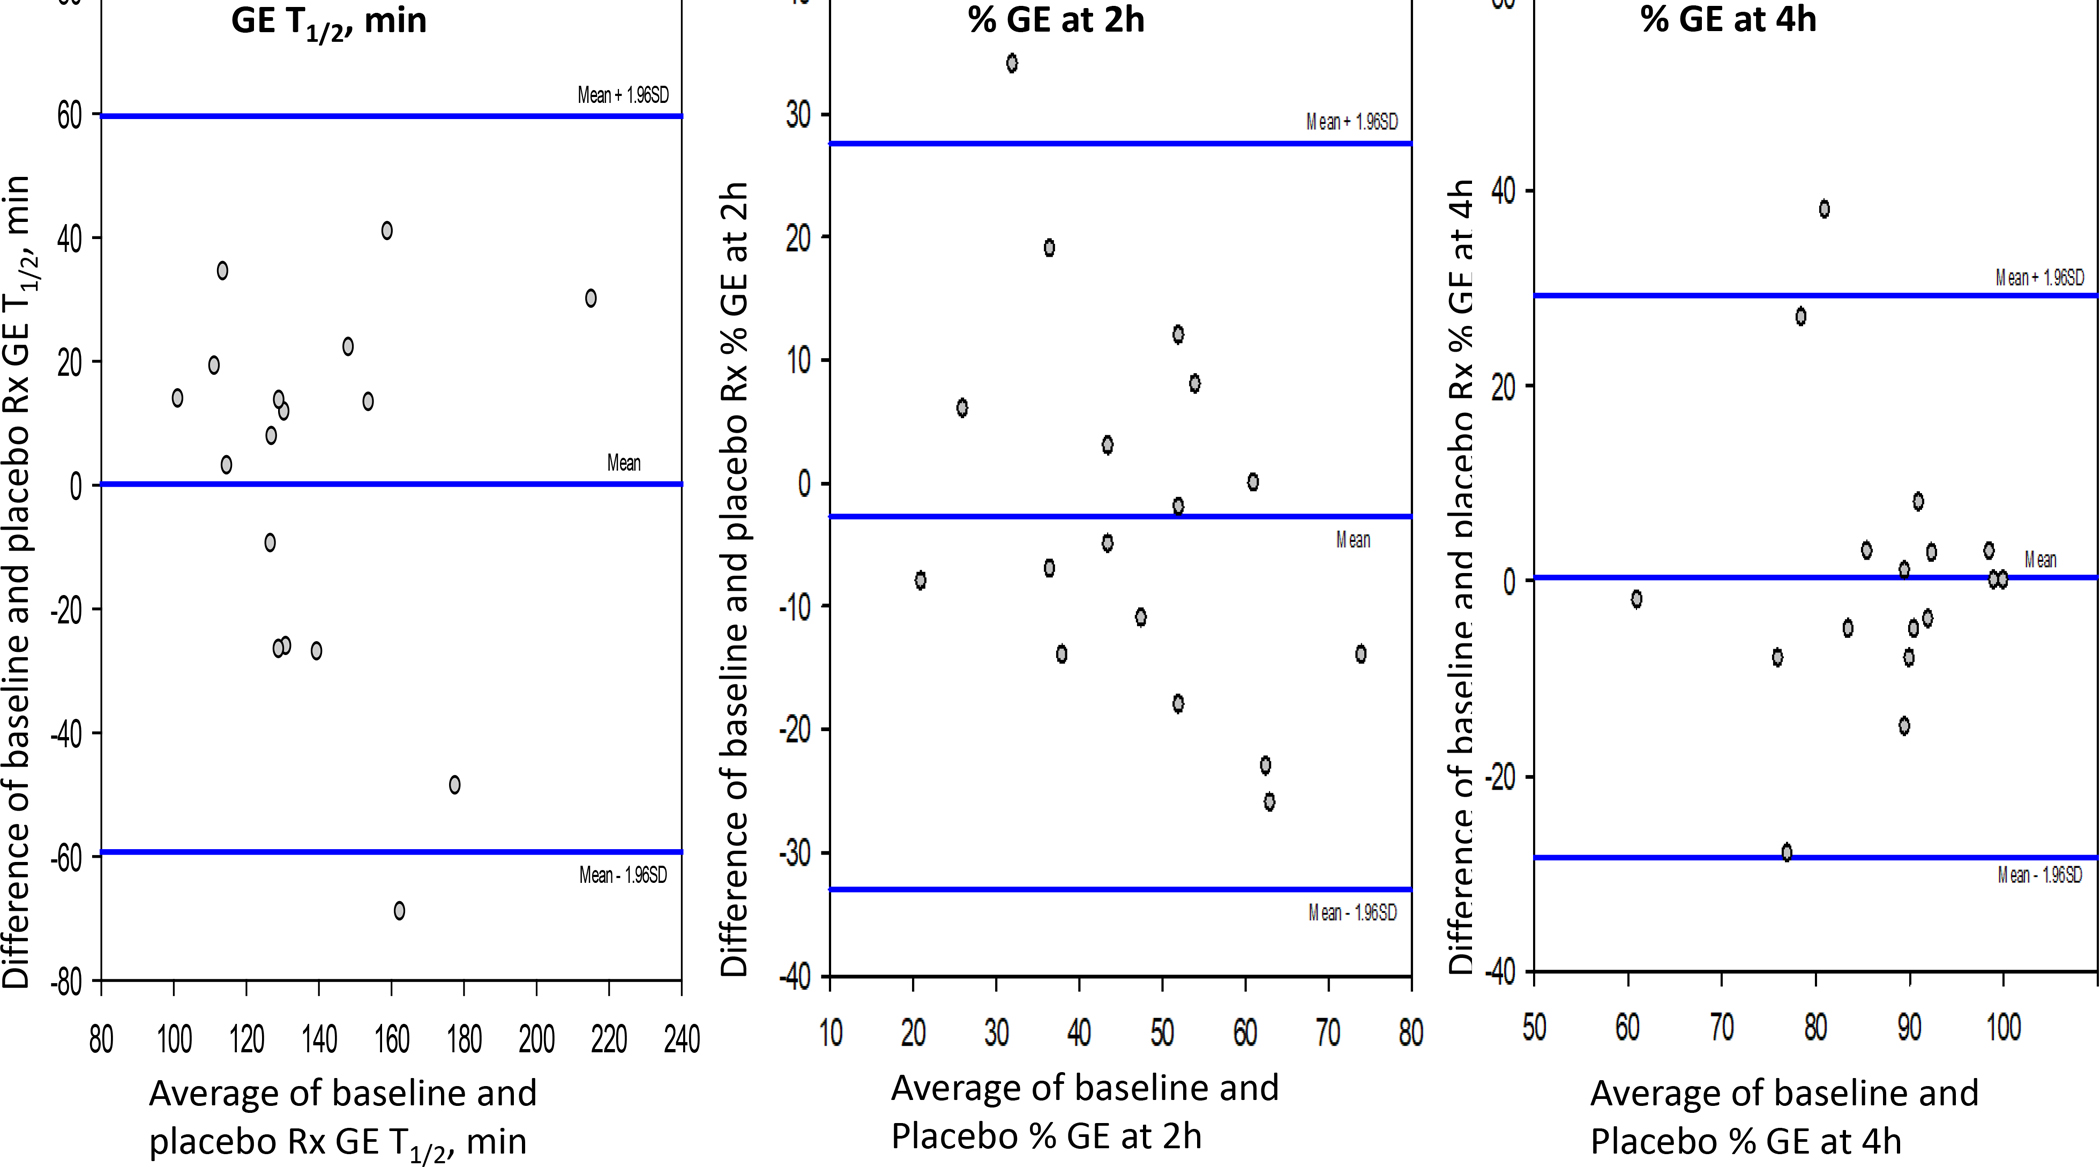
Bland-Altman plot showing consistency of gastric emptying (GE) data for the majority of patients with functional dyspepsia. The vast majority of the replicate data are within 40 minutes difference for GE T1/2, 20% difference for GE at 2 hours, and 10% difference for GE at 4 hours.
Table 3.
Gastric emptying results at first (or baseline) measurement of different groups as well as COVintra based on change post-placebo treatment. Data are mean ± SEM or % variation.
| COVintra for Group | N | Age (yr) | Sex (F/M) | BMI, kg/m2 | GE2h% | GE4h % | T1/2, min |
|---|---|---|---|---|---|---|---|
| Functional dyspepsia | 18* | 33.6 ± 2.8 | 13/5 | 25.40 ± 1.18 | 47.2 ± 7.5 | 86.1 ± 2.9 | 140.6 ± 7.8 |
| COVintra functional dyspepsia | 33.1% | 16.6% | 21.2% | ||||
| Gastroparesis (felcisetrag trial) | 9 | 45.7 ± 5.4 | 7/2 | 24.61 ± 1.95 | 21.7 ± 3.8 | 69.8 ± 5.8 | 204.1 ± 24.9 |
| COVintra gastroparesis (felcisetrag) | 44.0% | 23.4% | 37.9% | ||||
| Gastroparesis (CBD trial) | 21 | 42.4 ± 3.2 | 17/4 | 27.86 ± 1.09 | 23.4 ± 3.4 | 67.1 ± 4.3 | 214.4 ± 15.2 |
| COVintra gastroparesis (CBD trial) | 51.2% | 19.1% | 31.5% | ||||
| Combined gastroparesis (felcisetrag+CBD trial) | 30 | 43.4 ± 2.7 | 24/6 | 26.88 ± 0.98 | 22.9 ± 2.6 | 67.9 ± 3.4 | 211.3 ± 12.8 |
| COVintra gastroparesis (felcisetrag+CBD trial) | 49.7% | 20.1% | 33.1% |
1 missing value at GE 2h, % emptied
BMI=body mass index; CBD=cannabidiol; COVinter=inter-subject coefficient of variation; F=female; GE=gastric emptying; h=hour; M=male; min=minutes; yr=years
Figure 3 shows combined data for the patients with gastroparesis and previously documented delayed GE who received placebo when they participated in parallel-group, randomized treatment trials with felcisetrag (21) (3 days) and cannabidiol (22, 23) (4 weeks). As shown in the lower panel of Figure 3, correlations with 95% CI of the regression line document the general trends of the correlations between the two measurements for all three endpoints. In addition, in comparison to the upper limit of normal ranges shown by interrupted lines (174min for GE T1/2, 25% for GE at 2h and 75% for GE at 4h), it is noted that 1 patient had normal GE on repeat testing using GE T1/2, and that 4 patients had normal GE% emptied at 2h, and 3 patients had normal GE% emptied at 4h with 2 of these 3 patients being within 5% of the cutoff value of 75% emptied.
Figure 3.
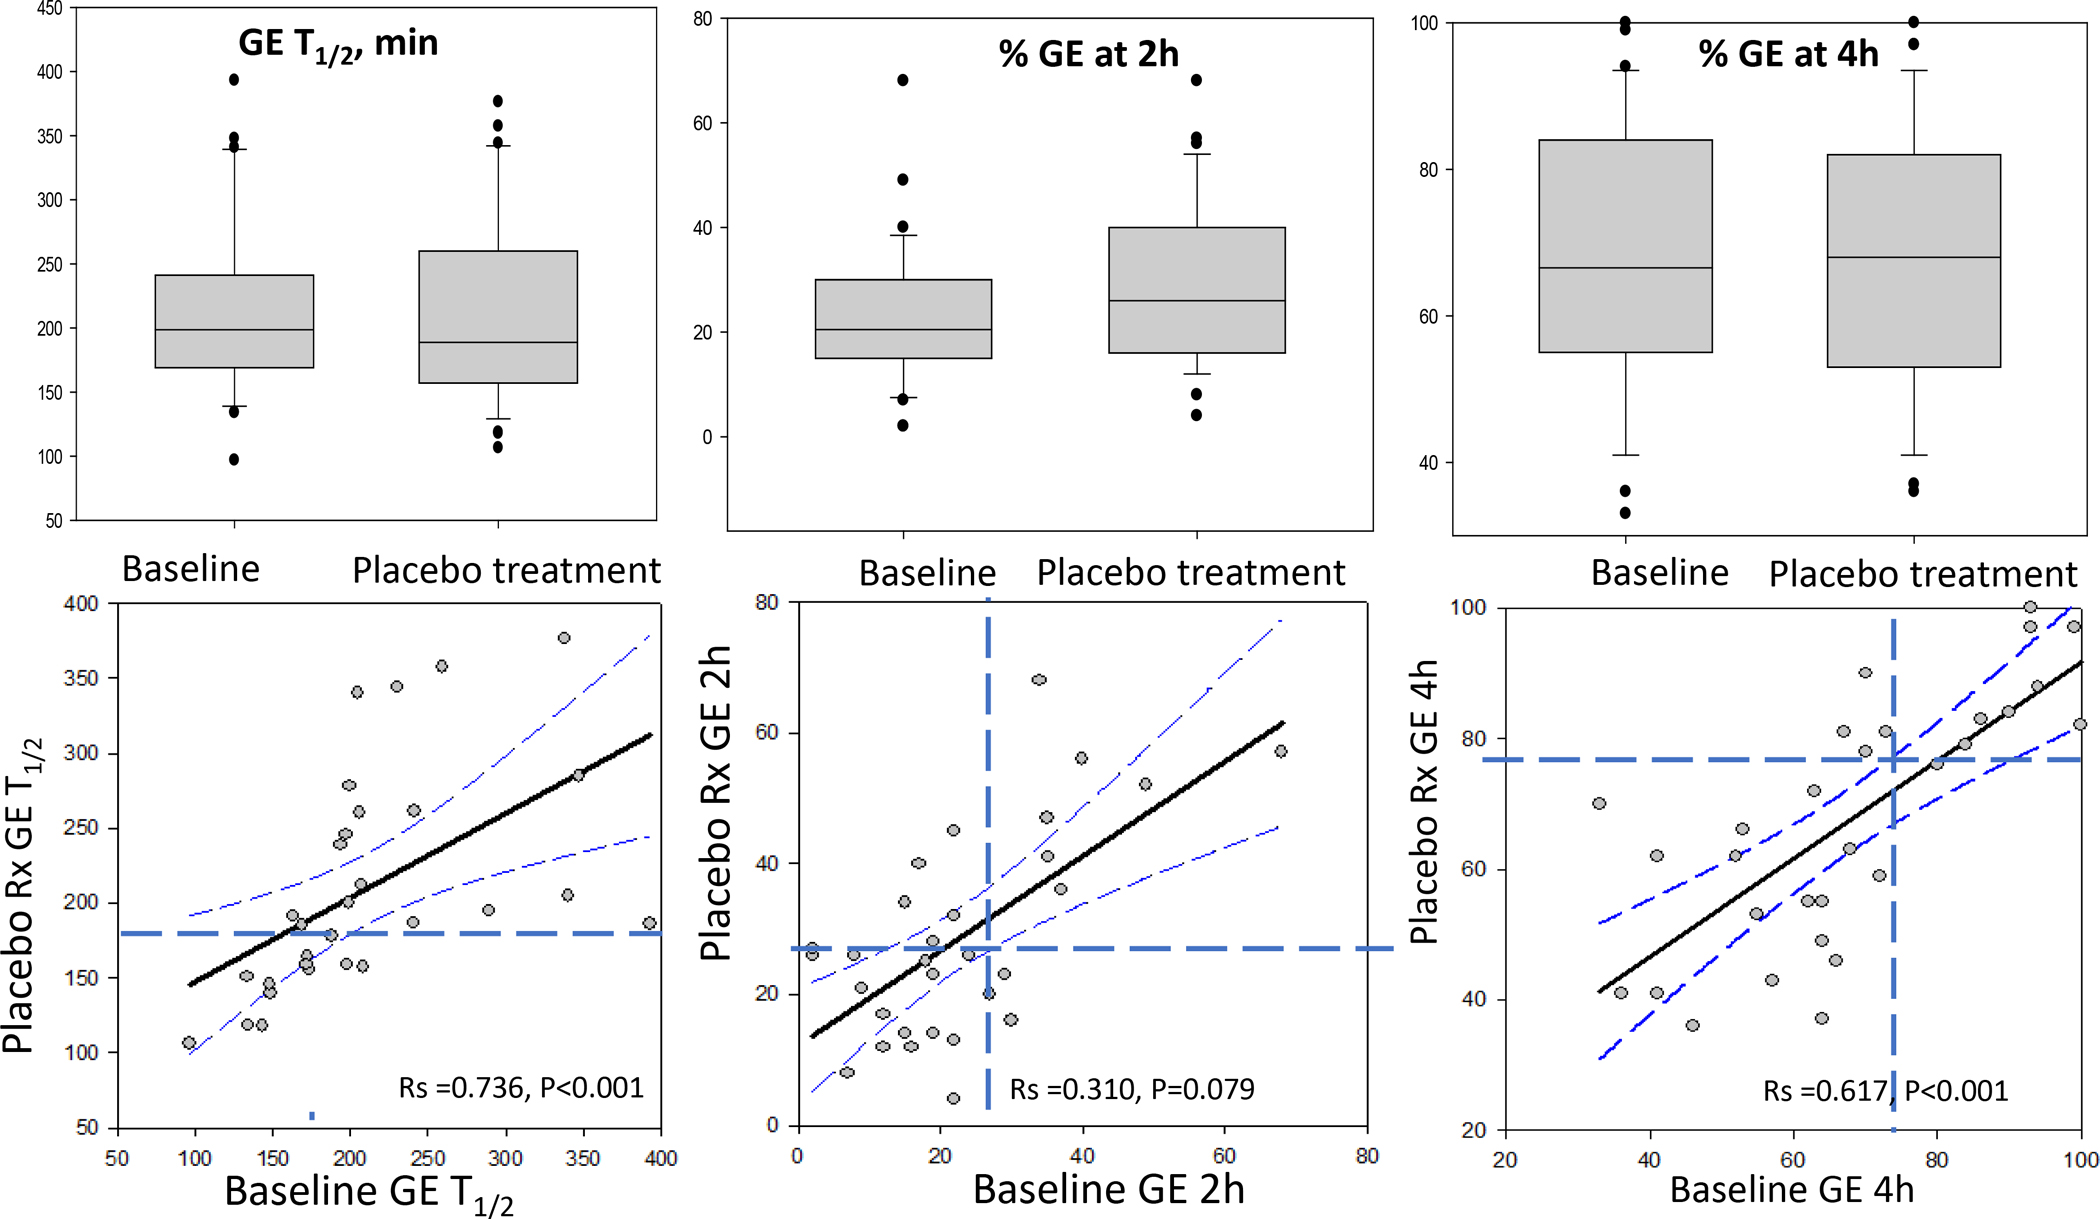
Parameters of gastric emptying (GE) of solids in patients with gastroparesis and documented slow GE showing interquartile range, 5% and 95% confidence interval (CI) and outliers at baseline and after treatment with placebo for 4 weeks (upper panel). Lower panel shows correlations with 95% CI of regression and upper limit of normal range shown by interrupted lines (174 minutes for GE T1/2, 25% for GE at 2 hours, and 75% for GE at 4 hours). Note: Very few patients’ GE results are misclassified based on these parameters, in particular GE T1/2 and GE at 4 hours.
Figure 4 is a Bland-Altman plot showing consistency of GE data for the majority of patients with gastroparesis. The vast majority of the replicate data are within 60 minutes difference for GE T1/2, 20% difference for GE at 2h and 20% difference for GE at 4h. Importantly, despite the variation, only 4 patients were inconsistently classified on repeat testing (see regression analysis in Figure 3), with 2 patients having data close to the cutoff values.
Figure 4.
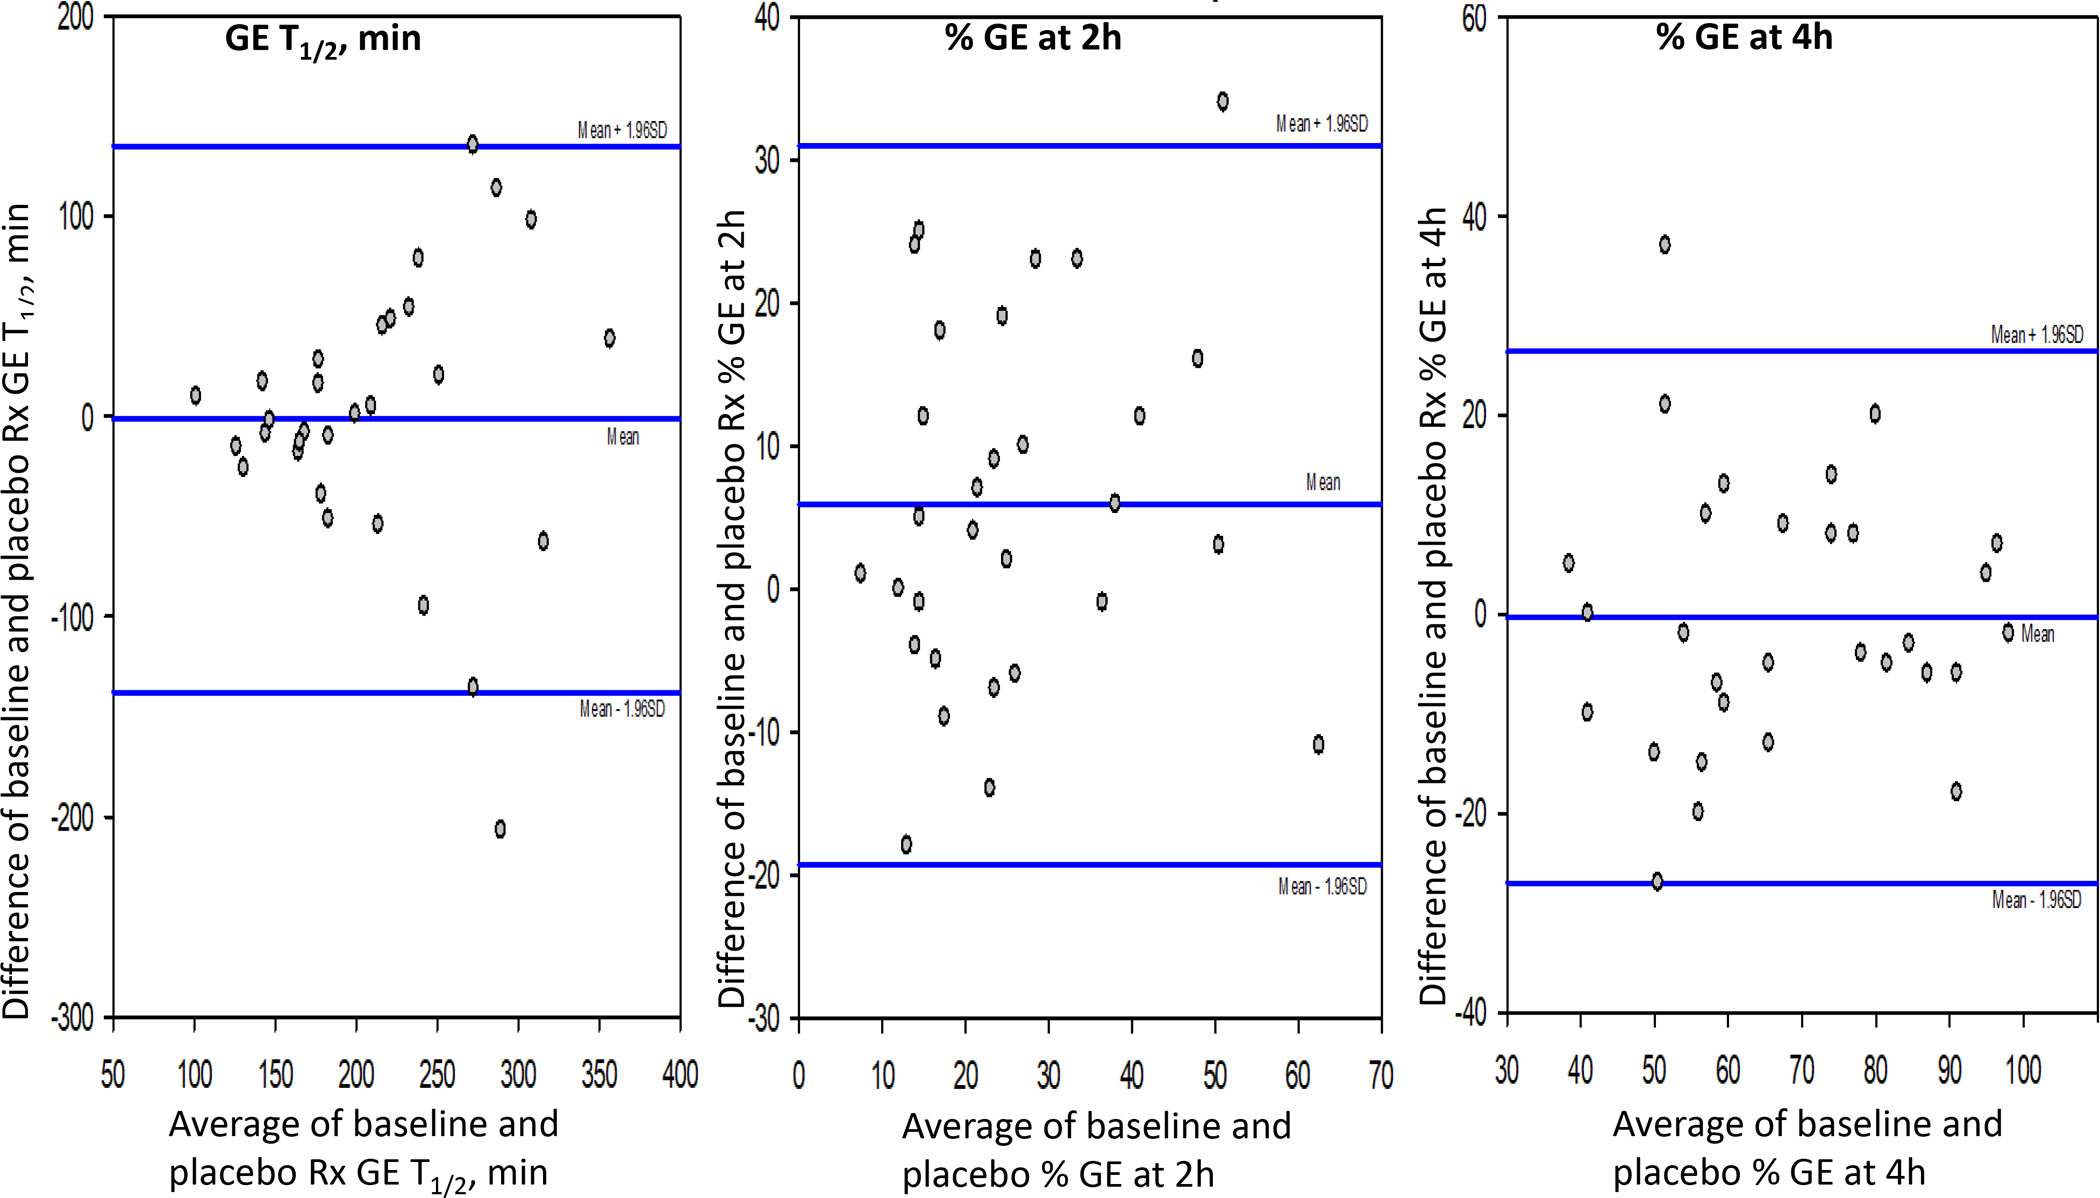
Bland-Altman plot showing consistency of gastric emptying (GE) data for the majority of patients with gastroparesis. The vast majority of the replicate data are within 60 minutes difference for GE T1/2, 20% difference for GE at 2 hours, and 20% difference for GE at 4 hours. Importantly, despite the variation, only 2 patients were inconsistently classified on repeat test (see regression analysis in figure 3).
Table 3 also documents the consistent intra-individual measurements for the patients with gastroparesis. Thus, for the entire group with gastroparesis, COVintra was 20.1% for GE% emptied at 4h and 33.1% for GE T1/2. As in the patients with functional dyspepsia, the COVintra in patients with gastroparesis was numerically higher for GE% at 2h (49.7%).
Comparison of data obtained during clinical diagnostic test and research test
For 70 patients, data were available to compare GE% at 2h and 4h, based on the same GE test conducted in the clinical diagnostic laboratory and the subsequent measurement of GE at baseline in the research laboratory. The age of the patients was 54.3 ± 2.5 (SEM) years, and BMI was 26.3± 0.6 kg/m2. The two tests were conducted with a median interval of 94.3 weeks (10th and 90th percentile of 6 to 499 weeks). Figure 5 shows there was no significant difference in GE% at 2h (p=0.145 on signed rank test); however, there was a significant difference in GE% at 4h (p<0.001). The lower panel also shows the GE% at 4h data are consistent between the two tests in 46/70 patients, and the majority of variations are observed in the 24 patients shown in the left upper quadrant of the figure where the second estimate showed normal results, reflecting either variation over a median 94 weeks or effects of therapeutic interventions administered over the time interval between the diagnostic test and subsequent participation in the research trial.
Figure 5.
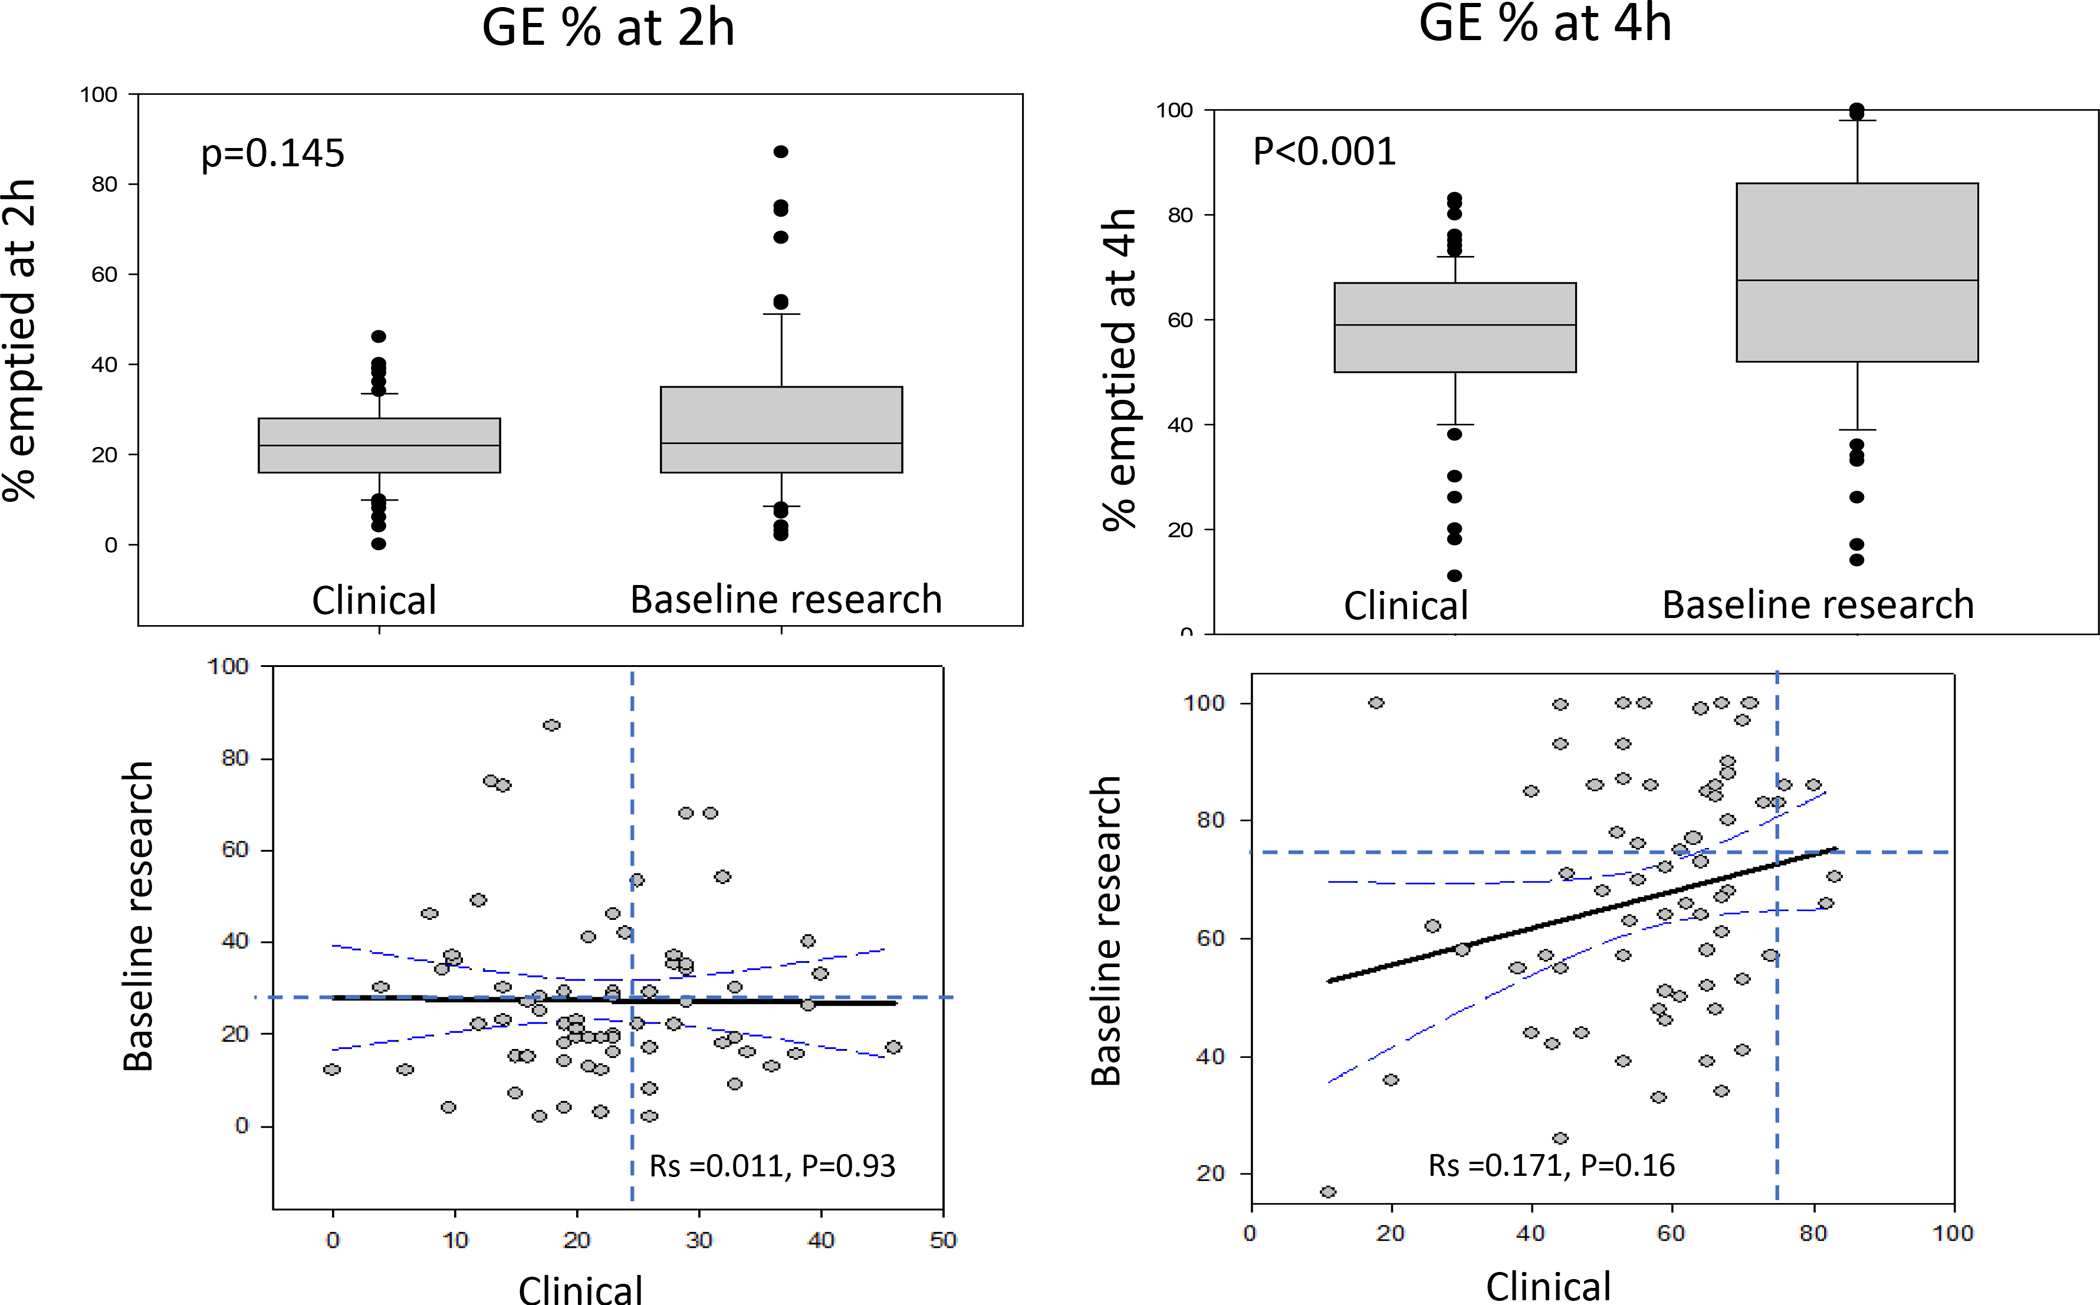
Comparison of earlier clinical diagnostic gastric emptying (GE) test conducted a median 94 weeks prior to the baseline test performed at entry to a research trial. Note significant difference in GE% at 4 hours (upper panel) with greater GE% emptied at the second test and the faster GE in 24 of the 70 patients (lower panel, right) during the second test.
Figure 6 shows consistency in the difference in GE% at 4h over the interval in weeks between the two tests (clinical diagnostic vs. research). The consistency of the difference is best demonstrated in the time interval 0–200 weeks.
Figure 6.
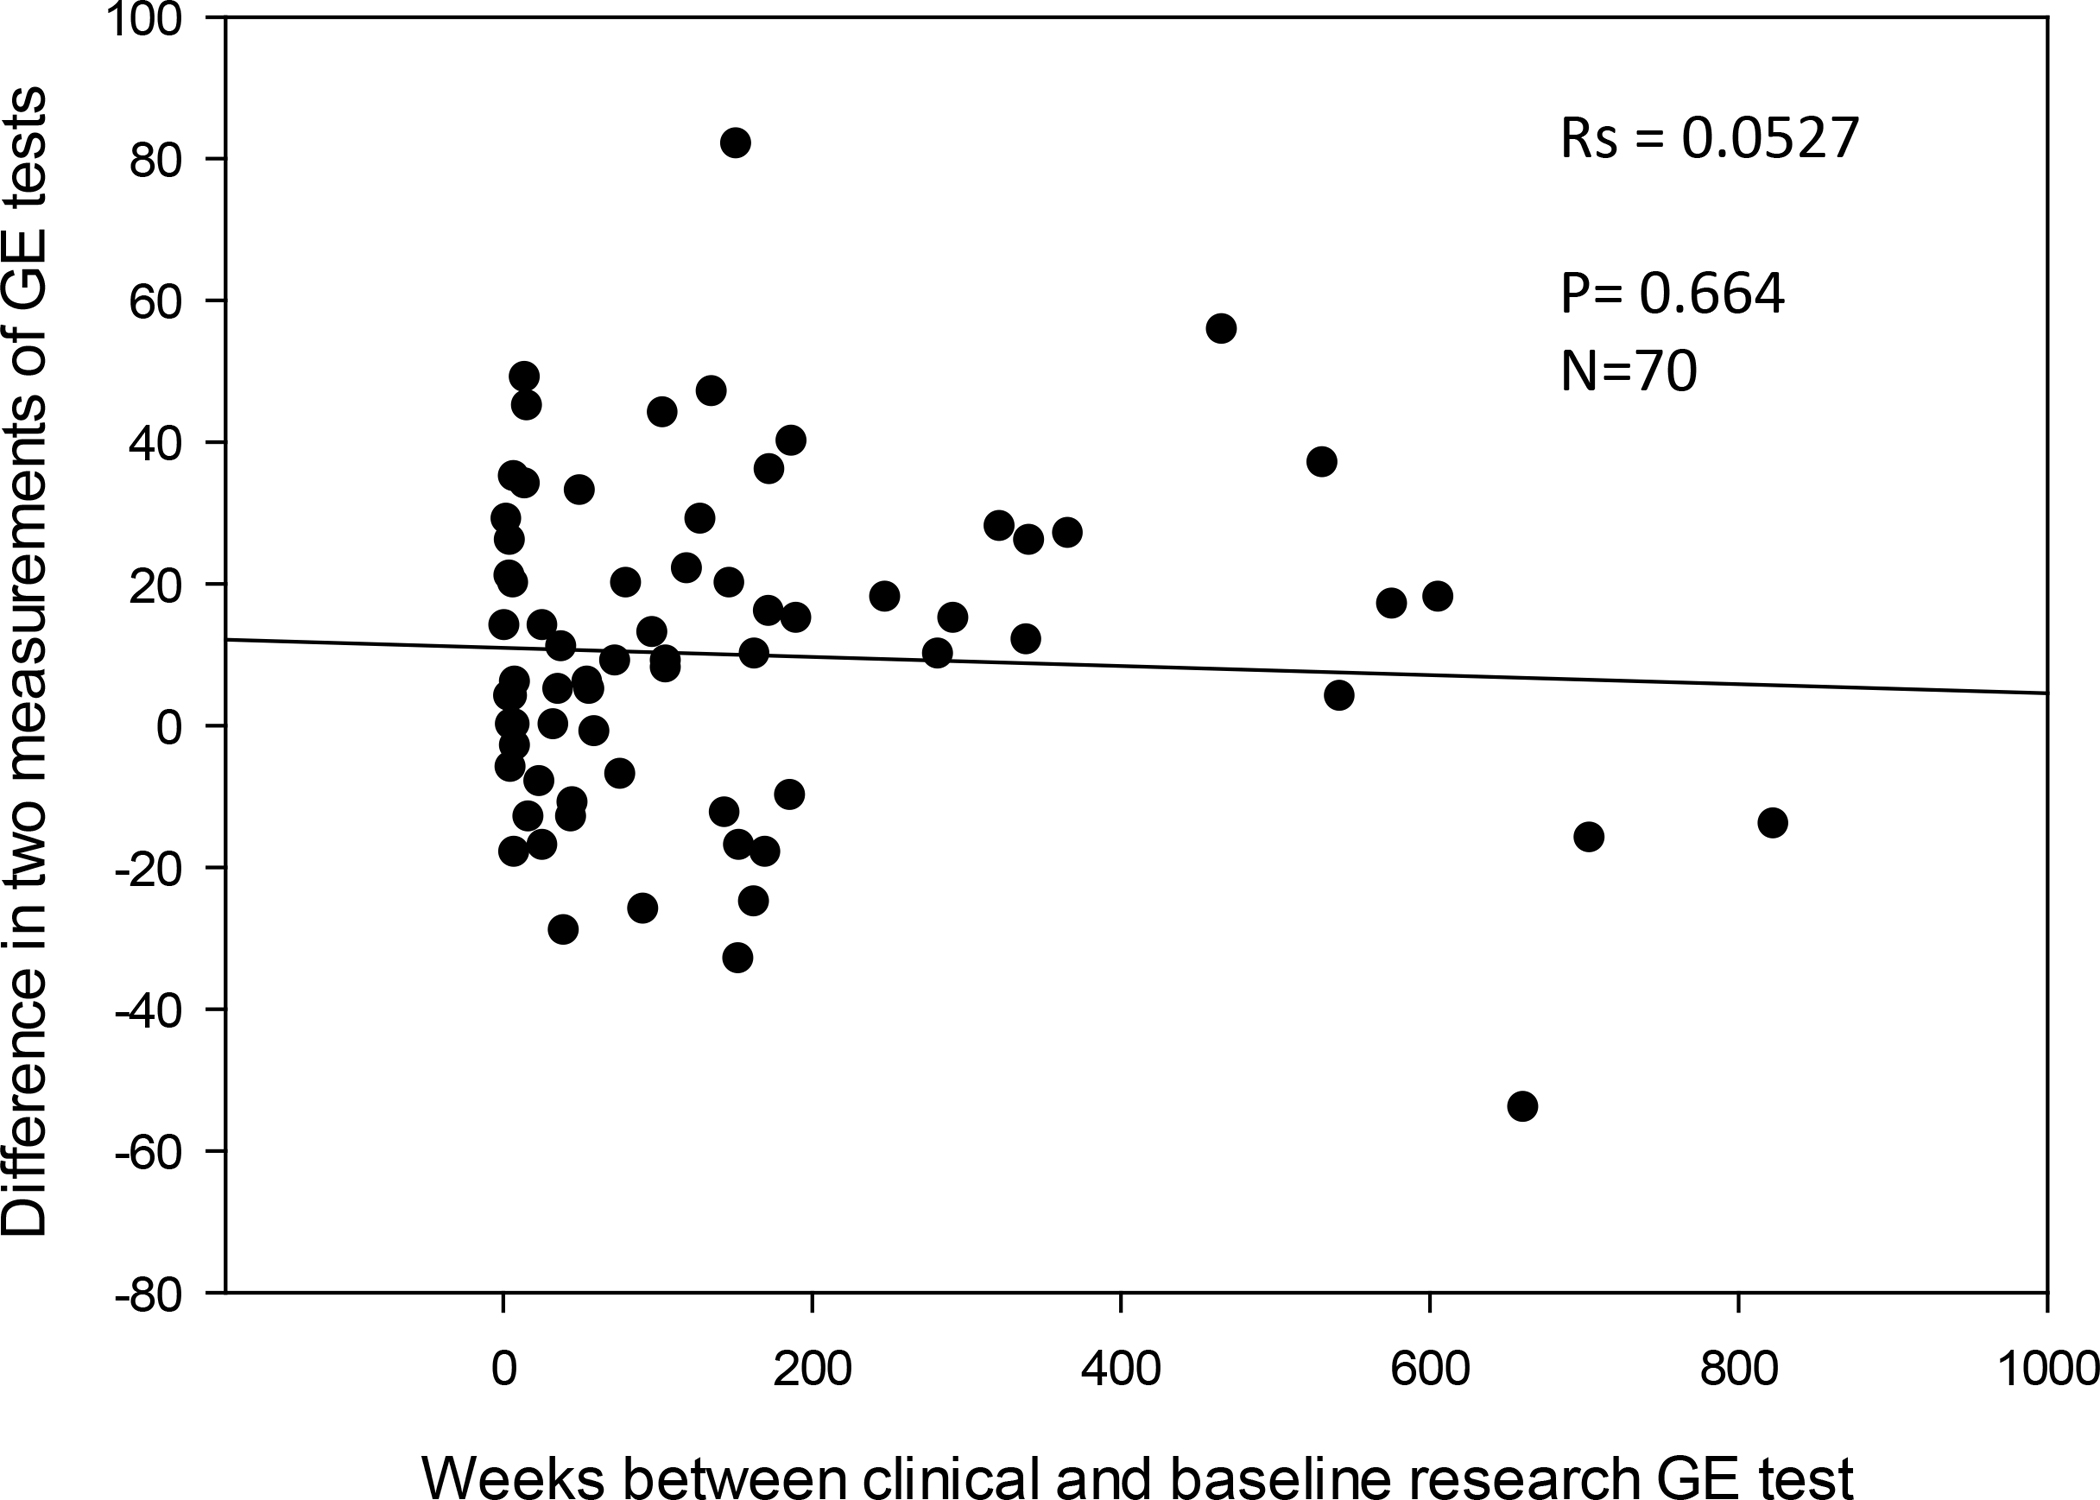
Plot showing difference in gastric emptying (GE) % at 4 hours based on interval in weeks between the two tests (clinical diagnostic vs. research). Note: The consistency in the difference is best demonstrated in the time interval 0–200 weeks.
DISCUSSION
Our data document the COVinter and COVintra in GE parameters in patients with symptoms consistent with gastroparesis or functional dyspepsia when using a 320kcal, 30% fat meal. The data also show that, in all groups studied, the percent variations were greater for GE% at 2h, and the parameter with the lowest COVinter and COVintra was GE% at 4h. Nevertheless, GE T1/2 showed better performance characteristics than GE% at 2h and, given the clinical significance of this parameter, it appears to be a useful assessment of GE. To amplify the significance of COVintra of 20.1% for GE% emptied at 4h in a patient with gastroparesis indicates that repeating the GE test in the same individual would be expected to vary by approximately 20.1% from the average measurement. For example, if the first result was 60% emptied at 4h, the repeat test result would be expected to be in the range 48 to 72% [both of which would still indicate delayed GE% at 4h (<75%)]. Applying the COVintra of 16.6% for GE% at 4h in a patient with functional dyspepsia whose GE% was at the group’s mean value of 86.1% emptied, the repeat test result would be expected to be in the range 72 to 100%, that is, the vast majority of GE% at 4h would again be in the normal range. Similarly, based on COVintra of 33.1% for GE T1/2 in patients with gastroparesis, if one assesses the impact on the group mean of 214.4 minutes, the repeat test result would be expected to be in the range 143.4 to 281 minutes, with the vast majority with slow GE T1/2 (≥175 minutes).
Indeed, another extremely valid observation is that, when assessed over 3 days or 4 weeks, these GE data (GE% at 4h and T1/2) are sufficiently consistent to be associated with the same diagnosis in about 85% of either delayed GE in gastroparesis or normal GE in functional dyspepsia patients selected based on previously documented normal GE. This contrasts with the report of approximately 40% of GE results swinging from delayed to normal or vice versa observed in the NIH Consortium study (18) that used the Egg Beaters® meal. This was one of the two observations led to the perception that gastroparesis and functional dyspepsia are interchangeable conditions in tertiary care practice. This assessment was confounded by the fact that patients were receiving tricyclic antidepressants, cannabinoids, anticholinergics, or opioids at entry to the study. Although they agreed to withhold these medications 72 hours before the GE tests, it is unclear whether the medications were “washed-out” from neural structures controlling GE, even though the plasma levels may be reduced in accordance with the medications’ half-times. It is therefore unclear whether these neuromodulators may have contributed, at least in part, to the intra-individual differences in GE measured with the Egg Beaters® meal. The second rationale for the “interchangeable” nature of gastroparesis and functional dyspepsia was based on the histopathological assessment of quantification of interstitial cells of Cajal and CD206 macrophages; however, this was shown to be insufficiently powered to conclude there were no differences between gastroparesis and functional dyspepsia.(26)
Overall, these data suggest that the standard meal used consisting of 320kcal and 30% fat is valid and exhibits performance characteristics in disease states that are analogous to those observed and previously published in 215 healthy female volunteers and 104 healthy male volunteers.(10) In those 319 healthy participants, the median GE T1/2 was 120min, the 5th percentile was 78.4min, the 95th percentile was 174.0min, and the COVinter and COVintra for GE T1/2 were 24.5% and 23.8% respectively.(10) Those COVs are similar to the ones observed in patients with gastroparesis in the current study, 33.1% and 31% respectively. Based on the data of the 319 healthy participants,(10) in which males and females were virtually identical, the percent emptied from the stomach of less than 75% at 4 hours (corresponding to the 5th percentile) is a valid criterion for identifying delayed GE, for both females and males. While it is expected that there are differences in GE between patients, the GE% at 4h with the lowest COVinter of 27.5% and COVintra of 20.1% suggests that this currently used criterion to identify normal GE >75% remains valid.
The comparison between the tests performed at the time of clinical diagnosis and participation in research trials provides useful insights on the range of GE over a median follow-up of 94 weeks. It demonstrates an overall consistent GE profile [as previously documented in extensive studies conducted in Adelaide, Australia showing consistency over time,(27–29)] and the amelioration of GE% at 4h in a subset of patients (24/70). This improvement in GE% at 4h may reflect either spontaneous variation or faster GE, possibly as a result of therapy or even spontaneous improvement in the GE delay. It is known, for example, that follow-up of presumed post-viral gastroparesis was associated with improved GE and complete or considerable symptom resolution over a mean follow-up of 32.3 months in 7 patients.(30)
There are limitations to our study including the short interval between the replicate tests of GE in the cohort of patients who had gastroparesis; however, the observations in the gastroparesis patients (n=21) and in the functional dyspepsia patients (n=18) studied 4 weeks apart and the observations in 70 patients at a median interval of 94 weeks provide reasonable sample sizes, relative to the only other two papers in the literature that evaluated 14 diabetic patients (16) and 60 patients with upper gastrointestinal symptoms.(17) A second limitation pertains to generalizability. Since several other medical centers use the low-fat Egg Beaters® meal preferentially for estimating GE, our data may not necessarily be generalizable to the anticipated performance of the GE test at other centers.
There are also potential confounders related to glycemic control, test meal composition and the potential effect of placebo in such studies. Study inclusion required confirmation that patients with diabetes did not have severely uncontrolled disease by hemoglobin A1c measurement (HbA1c >12%, as noted in Supplemental Table 1). In addition, fasting blood glucose was measured before the GE test in the research studies, with standard treatment algorithm-based administration of short-acting insulin for all studies involving diabetic patients in the Clinical Research Trials Unit (algorithm established by endocrinology division). Effect of hyperglycemia may be relevant for blood glusose >250mg/dL,(31, 32) though other studies suggest that higher fasting blood glucose levels are associated with faster GE, and in type 2 diabetes, 6 months of intensive therapy for the diabetes (with mean HbA1c decrease from 10.6% to 9%) did not result in significant change in mean GE T1/2 (from 92 min before to 92 min after improved glycemic control).(33) Since blood glucose measurements are not done routinely with the clinical GE measurements, hyperglycemia may be a confounder in the data obtained for the comparison of GE studies in the clinical lab and subsequently in the research labs. Nevertheless, the consistency of the COVintra illustrated in Figure 6 suggests that glycemic control was unlikely to be contributing to the COVintra. However, for the placebo-controlled research studies in patients with diabetes, it is unlikely that HbA1c would have differed significantly over 3 (felcisetrag trial) to 28 (CBD trial) days.
Potential confounders in the meal composition are addressed by selection of standard egg size, and use of skim (low, <1% fat) milk. Although it is acknowledged that lactase deficiency is extremely prevalent in different ethnicities, the effect of lactase deficiency on GE of solids is unproven, and incomplete hydrolysis of lactose results in accelerated emptying of liquids.(34) In addition, even patients with significant lactase deficiency have no symptoms as long as the lactose load ingested with a meal is not large at any one time.(35) It is relevant to note that the lactose content of 240mL of skim milk is 12–13g, which is well within the “safety” limits when ingested with a meal.(35) Another confounder is the potential that placebo may have neuroendocrine and biological effects (36) that could alter GE, and we chose to study COVintra in patients on placebo. In fact, the observed consistency of the results obtained at baseline and on placebo strengthens the claim of the reproducibility of the test meal and method proposed.
In summary, availability of an optimal GE measurement is necessary for clinical diagnosis as well as for categorizing patients for clinical trials. The standard 320kcal, 30% fat egg meal used in our study has a composition which is closer to a typical American meal than the Egg Beaters® alternative meal. More importantly, the data presented here validate the extensive utilization of this test in clinical practice for more than 30 years at our clinic as well as having provided the opportunity to appraise the efficacy of medications in proof-of-concept pharmacodynamic studies assessing the effects of agents such as the ghrelin receptor agonist, relamorelin,(19, 20) and the 5-HT4 receptor, felcisetrag.(21)
In conclusion, we believe that this unparalleled body of data should lead to further discussion by gastroenterology, motility, and nuclear medicine organizations to standardize a robust method to measure GE in clinical and research practice. This goal can be achieved by simply replacing the egg protein substitute with two real eggs and then obtaining images at least at baseline, as well as at 1, 2 and 4 hours after the meal. Modern programs available in gamma cameras are able to accurately estimate GE T1/2 using these simple parameters of GE.(37)
Supplementary Material
SUMMARY BOX.
What is already known about this subject?
Based on a published report on intra-individual variations in results of gastric emptying test using egg protein substitute, about 40% patients are re-classified from gastroparesis to functional dyspepsia and vice-versa.
What are the new findings?
Using a 320kcal, 30% fat real egg (standard size) meal, intra-individual variations are lower, especially percentage emptied at 4 hours, and 85% of patients are consistently diagnosed with gastroparesis (with slow gastric emptying) or functional dyspepsia with normal gastric emptying.
How might it affect clinical practice, research, or policy?
This study provides further validation that policymakers should consider, specifically, that the real egg meal should become the clinical and research standard for assessing gastric emptying in patients with suspected gastroparesis or functional dyspepsia with normal gastric emptying.
Acknowledgement:
The authors thank Mrs. Cindy Stanislav for secretarial assistance.
Funding:
M. Camilleri received funding for studies on gastroparesis and functional dyspepsia (data used in current project) from National Institutes of Health grant R01-DK122280. The data included in this manuscript were derived from studies conducted in the Mayo Clinic Clinical Research Trials Unit, supported in part (nursing, dietetic, physiology and immunochemistry lab components) by grant number UL1-TR002377 from the National Center for Advancing Translational Sciences (NCATS). Its contents are solely the responsibility of the authors and do not necessarily represent the official views of the NIH.
Footnotes
Disclosures: Michael Camilleri is an Associate Editor of Gut. Data in these studies were acquired in previously published reports on the effects of relamorelin and felcisetrag, which were performed with funding from Rhythm Pharmaceuticals and Takeda, respectively and studies of effects of cannabidiol.
Data transparency statement:
All relevant data are included in the paper and/or in the on-line Supplemental Materials. Only deidentified participant data are provided. Additional related documents will be available, if deemed appropriate, by request to the senior author with investigator support, after approval of a proposal, with a signed data access agreement. And if applicable:
Data will be available, consistent with data sharing NIH policy for studies supported by NIH (in this case, R01-DK122280).
REFERENCES
- 1.Stanghellini V, Tosetti C, Paternico A, et al. Risk indicators of delayed gastric emptying of solids in patients with functional dyspepsia. Gastroenterology 1996;110:1036–1042. [DOI] [PubMed] [Google Scholar]
- 2.Janssen P, Harris MS, Jones M, et al. The relation between symptom improvement and gastric emptying in the treatment of diabetic and idiopathic gastroparesis. Am J Gastroenterol 2013;108:1382–1391. [DOI] [PubMed] [Google Scholar]
- 3.Parkman HP, Yates K, Hasler WL, et al. Clinical features of idiopathic gastroparesis vary with sex, body mass, symptom onset, delay in gastric emptying, and gastroparesis severity. Gastroenterology 2011;140:101–115. [DOI] [PMC free article] [PubMed] [Google Scholar]
- 4.Vijayvargiya P, Jameie-Oskooei S, Camilleri M, et al. Association between delayed gastric emptying and upper gastrointestinal symptoms: a systematic review and meta-analysis. Gut 2019;68:804–813. [DOI] [PubMed] [Google Scholar]
- 5.Vijayvargiya P, Camilleri M, Chedid V, et al. Effects of promotility agents on gastric emptying and symptoms: a systematic review and meta-analysis. Gastroenterology 2019;156:1650–1660. [DOI] [PubMed] [Google Scholar]
- 6.Abell TL, Camilleri M, Donohoe K, et al. Consensus recommendations for gastric emptying scintigraphy: a joint report of the American Neurogastroenterology and Motility Society and the Society of Nuclear Medicine. Am J Gastroenterol 2008;103:753–763. [DOI] [PubMed] [Google Scholar]
- 7.Szarka LA, Camilleri M, Vella A, et al. A stable isotope breath test with a standard meal for abnormal gastric emptying of solids in the clinic and in research. Clin Gastroenterol Hepatol 2008;6:635–643 e631. [DOI] [PMC free article] [PubMed] [Google Scholar]
- 8.Cangemi DJ, Stephens L, Lacy BE. Misdiagnosis of gastroparesis is common: a retrospective review of patients referred to a tertiary gastroenterology practice. Clin Gastroenterol Hepatol. 2023. Feb 3;S1542-3565(23)00084-8. doi: 10.1016/j.cgh.2023.01.024. Online ahead of print. [DOI] [PubMed] [Google Scholar]
- 9.Cremonini F, Mullan BP, Camilleri M, et al. Performance characteristics of scintigraphic transit measurements for studies of experimental therapies. Aliment Pharmacol Ther 2002;16:1781–1790. [DOI] [PubMed] [Google Scholar]
- 10.Camilleri M, Iturrino J, Bharucha AE, et al. Performance characteristics of scintigraphic measurement of gastric emptying of solids in healthy participants. Neurogastroenterol Motil 2012;24:1076–e1562. [DOI] [PMC free article] [PubMed] [Google Scholar]
- 11.Tougas G, Eaker EY, Abell TL, et al. Assessment of gastric emptying using a low fat meal: Establishment of international control values. Am J Gastroenterol 2000;95:1456–1462. [DOI] [PubMed] [Google Scholar]
- 12.Parker HL, Tucker E, Hoad CL, et al. Development and validation of a large, modular test meal with liquid and solid components for assessment of gastric motor and sensory function by non-invasive imaging. Neurogastroenterol Motil 2016;28:554–68. [DOI] [PubMed] [Google Scholar]
- 13.Parker HL, Tucker E, Blackshaw E, et al. Clinical assessment of gastric emptying and sensory function utilizing gamma scintigraphy: establishment of reference intervals for the liquid and solid components of the Nottingham test meal in healthy subjects. Neurogastroenterol Motil 2017. Nov;29(11). doi: 10.1111/nmo.13122. Epub 2017 Jun 6. [DOI] [PubMed] [Google Scholar]
- 14.Hay PD, Corsetti M, Tucker E, et al. Tolerability, gastric emptying patterns, and symptoms during the Nottingham Test Meal in 330 secondary care non-diabetic dyspeptic patients. Neurogastroenterol Motil 2022;34:e14454. [DOI] [PMC free article] [PubMed] [Google Scholar]
- 15.Sachdeva P, Kantor S, Knight LC, et al. Use of a high caloric liquid meal as an alternative to a solid meal for gastric emptying scintigraphy. Dig Dis Sci 2013;58:2001–2006. [DOI] [PubMed] [Google Scholar]
- 16.Lartigue S, Bizais Y, Des Varannes SB, et al. Inter- and intrasubject variability of solid and liquid gastric emptying parameters. A scintigraphic study in healthy subjects and diabetic patients. Dig Dis Sci 1994;39:109–115. [DOI] [PubMed] [Google Scholar]
- 17.Desai A, O’Connor M, Neja B, et al. Reproducibility of gastric emptying assessed with scintigraphy in patients with upper GI symptoms. Neurogastroenterol Motil 2018;30:e13365. [DOI] [PMC free article] [PubMed] [Google Scholar]
- 18.Pasricha PJ, Grover M, Yates KP, et al. Functional dyspepsia and gastroparesis in tertiary care are interchangeable syndromes with common clinical and pathologic features. Gastroenterology 2021;160:2006–2017. [DOI] [PMC free article] [PubMed] [Google Scholar]
- 19.Shin A, Camilleri M, Busciglio I, et al. Randomized controlled phase Ib study of ghrelin agonist, RM-131, in type 2 diabetic women with delayed gastric emptying: pharmacokinetics and pharmacodynamics. Diabetes Care 2013;36:41–48. [DOI] [PMC free article] [PubMed] [Google Scholar]
- 20.Shin A, Camilleri M, Busciglio I, et al. The ghrelin agonist RM-131 accelerates gastric emptying of solids and reduces symptoms in patients with type 1 diabetes mellitus. Clin Gastroenterol Hepatol 2013;11:1453–1459.e1454. [DOI] [PMC free article] [PubMed] [Google Scholar]
- 21.Chedid V, Brandler J, Arndt K, et al. Randomised study: effects of the 5-HT4 receptor agonist felcisetrag vs placebo on gut transit in patients with gastroparesis. Aliment Pharmacol Ther 2021;53:1010–1020. [DOI] [PMC free article] [PubMed] [Google Scholar]
- 22.Atieh J*, Maselli D*, Breen-Lyles M, et al. (*joint 1st authors). Cannabidiol for functional dyspepsia with normal gastric emptying: a randomized, controlled trial. Am J Gastroenterol 2022;117:1296–1304. [DOI] [PubMed] [Google Scholar]
- 23.Zheng T, BouSaba J, Taylor A, et al. A randomized, controlled trial of efficacy and safety of cannabidiol in idiopathic and diabetic gastroparesis. Clin Gastroenterol Hepatol (2023, in press) [DOI] [PMC free article] [PubMed] [Google Scholar]
- 24.Camilleri M, Zinsmeister AR, Greydanus MP, et al. Towards a less costly but accurate test of gastric emptying and small bowel transit. Dig Dis Sci 1991;36:609–615. [DOI] [PubMed] [Google Scholar]
- 25.Bland JM, Altman DG. Statistical methods for assessing agreement between two methods of clinical measurement. Lancet 1986;1:307–310. [PubMed] [Google Scholar]
- 26.Camilleri M, Tack J. Is the quantification of interstitial cells of Cajal in gastric biopsy samples in patients with gastroparesis ready for prime time? Gastroenterology 2023;165:1–4. [DOI] [PMC free article] [PubMed] [Google Scholar]
- 27.Chang J, Russo A, Bound M, et al. A 25-year longitudinal evaluation of gastric emptying in diabetes. Diabetes Care 2012;35:2594–2596. [DOI] [PMC free article] [PubMed] [Google Scholar]
- 28.Jones KL, Russo A, Berry MK, et al. A longitudinal study of gastric emptying and upper gastrointestinal symptoms in patients with diabetes mellitus. Am J Med 2002;113:449–455. [DOI] [PubMed] [Google Scholar]
- 29.Watson LE, Phillips LK, Wu T, et al. Longitudinal evaluation of gastric emptying in type 2 diabetes. Diabetes Res Clin Pract 2019;154:27–34. [DOI] [PubMed] [Google Scholar]
- 30.Oh JJ, Kim CH. Gastroparesis after a presumed viral illness: clinical and laboratory features and natural history. Mayo Clin Proc 1990;65:636–642. [DOI] [PubMed] [Google Scholar]
- 31.Petrakis IE, Vrachassotakis N, Sciacca V, et al. Hyperglycaemia attenuates erythromycin-induced acceleration of solid-phase gastric emptying in idiopathic and diabetic gastroparesis. Scand J Gastroenterol 1999;34:396–403. [DOI] [PubMed] [Google Scholar]
- 32.Plummer MP, Jones KL, Cousins CE, et al. Hyperglycemia potentiates the slowing of gastric emptying induced by exogenous GLP-1. Diabetes Care 2015;38:1123–1129. [DOI] [PubMed] [Google Scholar]
- 33.Bharucha AE, Kudva Y, Basu A, et al. Relationship between glycemic control and gastric emptying in poorly controlled type 2 diabetes. Clin Gastroenterol Hepatol 2015;13:466–476, e1. [DOI] [PMC free article] [PubMed] [Google Scholar]
- 34.Troncon LE, de Oliveira, RB, Collares EF, Padovan W. Gastric emptying of lactose and glucose-galactose in patients with low intestinal lactase activity. Arg Gastroenterol 1983;20:8–12. [PubMed] [Google Scholar]
- 35.Levitt M, Wilt T, Shaukat A. Clinical implications of lactose malabsorption versus lactose intolerance. J Clin Gastroenterol 2013;47:471–480. [DOI] [PubMed] [Google Scholar]
- 36.Elsenbruch S, Enck P. Placebo effects and their determinants in gastrointestinal disorders. Nat Rev Gastroenterol Hepatol 2015;12:472–485. [DOI] [PubMed] [Google Scholar]
- 37.BouSaba J, Busciglio I, Burton D, et al. Comparison of gastric emptying T-half estimates using linear interpolation based on two, four, or nine data points. Neurogastroenterol Motil 2022;34:e14445. [DOI] [PubMed] [Google Scholar]
Associated Data
This section collects any data citations, data availability statements, or supplementary materials included in this article.
Supplementary Materials
Data Availability Statement
All relevant data are included in the paper and/or in the on-line Supplemental Materials. Only deidentified participant data are provided. Additional related documents will be available, if deemed appropriate, by request to the senior author with investigator support, after approval of a proposal, with a signed data access agreement. And if applicable:
Data will be available, consistent with data sharing NIH policy for studies supported by NIH (in this case, R01-DK122280).