

Abstract
Although tumor growth requires the mitochondrial electron transport chain (ETC), the relative contribution of Complex I (CI) and II (CII), the gatekeepers for initiating electron flow, remains unclear. Here, we report that loss of CII, but not CI, reduces melanoma tumor growth by increasing antigen presentation and T cell-mediated killing. This is driven by succinate-mediated transcriptional and epigenetic activation of major histocompatibility complex I-antigen processing and presentation (MHC-APP) genes independent of interferon signaling. Furthermore, knockout of MCJ, to promote electron entry preferentially via CI, provides proof-of-concept of ETC rewiring to achieve anti-tumor responses without side effects associated with an overall reduction in mitochondrial respiration in non-cancer cells. Our results may hold therapeutic potential for tumors that have reduced MHC-APP expression, a common mechanism of cancer immunoevasion.
The mitochondrial tricarboxylic acid (TCA) cycle and ETC provide metabolic plasticity required for cancer growth and progression (1, 2). The ETC comprises four multi-subunit complexes, complex I to complex IV (CI-CIV). CI (NADH dehydrogenase) and CII (succinate dehydrogenase, SDH) are the gatekeepers of electron flow by passing electrons from TCA-generated NADH and FADH2, respectively, to ubiquinone for delivery to CIII and finally to oxygen via CIV. Recycling of ubiquinone by CIII-CIV is required for tumor growth (3–5). In contrast, loss of function mutations in genes encoding CI and CII subunits are more tolerated and cancer cells can compensate for their loss via metabolic reprogramming (6–13). However, not much is known about the individual contributions of CI and CII in tumor growth and immunogenicity.
Reducing mitochondrial complex II activity enhances antitumor immune responses
To investigate the contributions of CI and CII to tumor growth and anti-tumor immune responses, we generated isogenic CI (sgNdufa1) or CII (sgSdha or sgSdhc) knockout YUMM1.7 (BrafV600E/Pten−/−/ Cdkn2a−/−) mouse melanoma cells (14) (Fig S1A) and implanted them into immune-competent mice. Knockout of CI or CII subunits reduced the respective complexes as expected but did not impact the abundance of other ETC complexes (Fig S1B). Loss of CI or CII also significantly reduced oxygen consumption, spare respiratory capacity, and cell proliferation (Fig S1C–E). However, CI knockout cells had significantly lower respiration and proliferation than CII knockout cells, consistent with CI being the major source of electrons to the ETC in YUMM1.7 cells. Knockout of CI increased NADH levels without affecting the CII substrate succinate, suggesting that CI knockout cells have intact CII-dependent respiration and succinate dehydrogenase activity (Fig S1F, G). Conversely, knockout of CII increased succinate without affecting NADH levels, indicating that CI respiration is intact in CII knockout cells (Fig S1F, G), but CII-dependent respiration and succinate dehydrogenase activity are absent. We next engrafted CI or CII knockout cells into syngeneic, wild-type C57BL/6 mice. Surprisingly, CI and CII knockout had remarkably differential effects on tumor growth. Despite proliferating slower in vitro than CII knockout (sgSdha) and control (sgSCR) cells, CI knockout (sgNdufa1) tumors did not show any growth defects in vivo, suggesting that CI is not required for YUMM1.7 tumor growth (Fig 1A, B). However, CII knockout tumors grew significantly slower than control and CI knockout tumors. Flow cytometry analysis of CII knockout tumors showed significantly increased immune cell (CD45+) infiltration, especially CD8+ T cells, relative to control and CI knockout tumors (Fig 1C, D). No significant change in the number of CD4+ T cells or the percentage of regulatory T (Treg) cells was observed (Fig S2A, B). Consistent with this, CD8+ T cells from CII knockout tumors produced more interferon-γ (INFγ+) and granzyme-B (GZMB+), suggesting significant tumor-killing effector function was responsible for the observed anti-tumor activity (Fig 1E). This was further confirmed by performing the same experiment in Rag1-deficient mice that do not have mature T cells or B cells, in which the anti-tumor phenotype of CII knockout was lost (Fig S2C, D). Since antigen presentation by MHC class-I (MHC-I) is a major determinant of T cell activation and killing, we next measured MHC-I expression on CI and CII deficient tumor cells. Indeed, we found significantly higher MHC-I expression on CII knockout tumor cells compared to CI knockout and control tumor cells in vivo (Fig 1F). Furthermore, ablation of antigen presentation by knocking out β2-microglobulin (MHC-I light chain, sgB2m) in CII knockout cells confirmed that tumor antigen presentation is required for the anti-tumor effect of CII depletion (Fig 1G, H; S2E). Consistent with these data, CIBERSORT correlation analysis of pan-cancer datasets showed a negative correlation between the expression of CII genes (SDHA, SDHB, SDHC, and SDHD) and a cytotoxic T cell gene signature across multiple cancer types (33/36 cancer types) (Fig S3A). Finally, low SDHC (CII subunit) expressing human breast and skin tumors also showed increased expression of CTL (Cytotoxic T Lymphocyte) marker genes (CD8A, CD8B, GZMA, GZMB, IFNG, and PFR1) (Fig S3B, C; Supplementary Table S1). Thus, we conclude that loss of CII, but not CI, results in a strong anti-tumor T cell response via increased antigen presentation.
Fig 1: Mitochondrial CII inhibition enhances anti-tumor immunity via increased MHC-I.

YUMM1.7-sgSCR (control) (n=8), sgSdha (CII knockout) (n=8) and sgNdufa1 (CI knockout) (n=7) cells (2 x10⁵) were subcutaneously injected into the flanks of C57BL/6 male mice and tumor growth was monitored for 20 days. A-D. Tumor growth curves. Tumor Volume versus time (days post-implantation) is plotted (A), Tumor Weight (in grams at day 20) (B), number of tumor-infiltrating CD45+ cells per gram tumor at day 20 (C), CD8+ T cells per gram tumor at day 20 (D) E. Percentage (%) of IFNγ+ and GZMB+ positive tumor-infiltrating CD8+ T cells in tumors at day 20. F. Tumor surface MHC-I expression on cells from panel A at day 20. G-H. Tumor growth curve (Tumor Volume versus time is plotted) (G) and tumor weight (in grams at day 20) (H) of tumors from sgSCR (control), sgSdha (CII knockout), sgSCR-sgB2m (control + 2 microglobulin knockout) and sgSdha-sgB2m (CII knockout + 2 microglobulin knockout) YUMM1.7 cells (2 x 10⁵) subcutaneously implanted in C57BL/6 mice (n=4).
Data points in each panel represent independent sample from two experiments. Data are presented in mean ± SEM. Statistical significance was determined by Kruskal-Wallis test with Dunn’s multiple comparisons for A to H.
Seemingly contrary to our findings, loss of CII function (i.e., SDH encoding subunit genes) can be tumorigenic in humans and succinate, which accumulates under these conditions, has been coined an “oncometabolite” (15, 16). Most of the oncogenic SDHx are germline and result in a subset of rare cancers like pheochromocytoma, paraganglioma and gastrointestinal stromal tumors (15). Thus, in these cases, CII deficiency and succinate accumulation would be present from the beginning and could promote early events in tumor initiation. Our results, however, show that depletion of CII reduces tumor growth by enhancing antigen presentation, thus the effect is not on tumor initiation, but on tumor growth due to immune system attack. It is also important to note that loss of CII in mouse models does not cause spontaneous tumor formation unless other oncogenic conditions are present (17–21). Additionally, inherited oncogenic CII mutations usually affect neuroendocrine tissues within specialized physiological environments and/or can promote unique tumor microenvironments that are conditionally tumorigenic in combination with CII inhibition and/or in combination with other oncogenic genetic alterations (18, 22–24). Finally, it is possible that the immune pressure we have uncovered that results from CII deficiency leads to immunoediting and promotes the selection of tumor clones with immunosuppressive properties that allow escape from immune detection and continued growth.
Mitochondrial succinate increases tumor antigen presentation independently of interferon signaling
Next, to better understand the anti-tumor response to CII deficiency, we explored the nature of the signal underlying the increased tumor cell antigen presentation. We first determined that depletion of CII increased cell surface expression of MHC-I in YUMM1.7 cells in vitro (Fig 2A). Notably, pharmacological inhibition of CII by 3-NPA, but not CI inhibition by rotenone, was sufficient to increase MHC-I expression in vitro in multiple murine cell lines (YUMM1.7, 4T1, B16-F10, YUMMER, MC38, and fibroblasts; Fig 2B; S4A, B). Interestingly, inhibition of CII, but not CI, increased the transcripts of several MHC-APP genes in YUMM1.7 cells (Fig 2C; S4C). Similar results were obtained with 3-NPA treated 4T1 cells (Fig S4D). Consistent with this, inhibition of CII in YUMM1.7 cells expressing ovalbumin (OVA), a model neoantigen, increased the presentation of the OVA-derived peptide SIINFEKL bound to MHC-I (H-2Kb), confirming enhanced antigen processing and presentation upon CII inhibition (Fig S4E). To identify the molecular mechanism by which mitochondrial CII inhibition drives the expression of nuclear MHC-APP genes, we performed gene expression profiling on CI and CII inhibitor-treated YUMM1.7 cells (Fig S5A; Supplementary Table S2, S3, S4). Interestingly, CII-inhibited cells showed significant enrichment of the interferon response pathway, including APP genes (Fig S5A; Supplementary Table S5, S6). Therefore, we tested whether CII inhibition induces MHC-I through autocrine interferon-mediated signaling by knocking out Ifngr1 or Stat1 in YUMM1.7 cells (Fig S5B). While IFN-induced MHC-I upregulation was eliminated in Ifngr1 and Stat1 knockout cells, CII inhibition still led to the induction of surface MHC-I and expression of APP genes in these cells (Fig S5B–F). Similarly, CII inhibition did not induce STAT1 phosphorylation at Y701, which would be expected from receptor-mediated activation of interferon signaling (Fig S5G). Next, we tested whether CII inhibition-induced MHC-APP genes required NLRC5 or IRF1, two known transcriptional activators of these genes. Interestingly, depletion of NLRC5, but not IRF1, attenuated CII inhibition-induced cell surface MHC-I and expression of MHC-APP genes (Fig 2D; S5H, I). Together these findings show that while interferon signaling is not required, there remains a partial dependence on NLRC5-mediated transcription to induce MHC-APP genes in response to CII inhibition.
Fig 2. Mitochondrial succinate drives MHC-I surface and gene expression upon inhibition of CII.

A. Cell surface MHC-I expression on sgSCR, sgSdha and sgSdhc YUMM1.7 cells (n=6). MHC-I expression is presented in fold change relative to sgSCR cells. A representative histogram is shown on the left. B. Cell surface MHC-I expression on YUMM1.7 (n=6) and 4T1 (n=6) cells treated with DMSO (vehicle control), rotenone (complex I inhibitor), 3-NPA (complex II inhibitor) for 48 hours. MHC-I expression is presented in fold change relative to DMSO treated cells. A representative histogram is shown on the left. C. qRT-PCR analysis of indicated representative MHC-APP genes in YUMM1.7 cells treated with DMSO, rotenone and 3-NPA for 48 hours. Where B2m is MHC-I light-chain; H2-d and H2-k1 represent MHC-I heavy-chain; Lmp2 and Lmp7 represent immunoproteasome subunits; Tap1, Tap2, Tapbp and Tapbpl represent antigen transporters and peptide loading complex in the endoplasmic reticulum, and Nlrc5, Irf1 and Stat1 are transcription factors. Expression levels are presented in fold change relative to DMSO treated cells. Each data point represents a technical replicate from one biological sample. Similar results were obtained with two independent biological replicates. D. Cell surface MHC-I expression on DMSO and 3-NPA treated sgNlrc5 (NLRC5 knockout; n=4) and sgIrf1 (IRF1 knockout; n=4) YUMM1.7 cells. MHC-I expression is presented in fold change relative to DMSO treated sgSCR (control) cells. E. Steady-state levels of metabolites in YUMM1.7 cells treated with DMSO, rotenone and 3-NPA for 48 hours. A red–blue color scale depicts the abundance of the metabolites (red: high, blue: low) (n=2 biologically independent experiments). F. Cell surface MHC-I expression on YUMM1.7 (n=3) and 4T1 (n=3) cells treated with mono-methyl succinate (a cell-permeable form of succinate) dissolved in phosphate buffer saline (PBS) for 48 hours. MHC-I expression is presented in fold change relative to vehicle (PBS) control cells. (G) Whole-cell succinate levels in YUMM1.7 cells cultured in the presence or absence of glutamine for 16 hours, followed by DMSO or 3-NPA treatment for 24 hours (n = 3). (H) Cell surface MHC-I expression on YUMM1.7 cells cultured in the presence or absence of glutamine for 16 hours followed by DMSO or 3-NPA treatment for 24 hours (n = 4). MHC-I expression is presented as fold change relative to DMSO-treated cells cultured in the presence of glutamine. (I) Cell surface MHC-I expression on sgSCR and sgSdhc (CII knockout) YUMM1.7 cells transfected with either siSCR or siOgdh for 72 hours (n = 3). MHC-I expression is presented as fold change relative to cells transfected with siSCR (sgSCR).
Data points in each panel represent an independent sample unless specified. Data are presented in mean ± SD. Statistical significance was determined using one-way ANOVA with Dunnett’s multiple comparisons test for A, B, D, F and G, two-way ANOVA with Dunnetťs multiple comparisons test for C, and two-way ANOVA with Sidak’s multiple comparisons test for H.
Since CII is succinate dehydrogenase and succinate influences nuclear gene expression (2), we investigated whether CII inhibition drives MHC-APP gene expression by promoting succinate accumulation. Four pieces of evidence suggest this is indeed the case. First, as predicted, CII-inhibited cells had high levels of succinate (Fig 2E; S6A). Second, treating wild type (i.e., CII-competent) YUMM1.7 cells with cell-permeable succinate is sufficient to increase both cell surface MHC-I and expression of MHC-APP genes (Fig 2F; S6B–D). Third, since glutamine is the primary source of succinate in CII-inhibited cells (7), glutamine starvation of YUMM1.7 cells significantly reduced the 3-NPA–induced succinate accumulation and concomitant expression of cell surface MHC-I and MHC-APP genes (Fig. 2G, H; S6E, F). Lastly, the knockdown of OGDH, a subunit of 2-oxoglutarate dehydrogenase, in CII knockout (sgSdhc) cells significantly reduced succinate levels and MHC-I expression (Fig. 2I; S6G–I). Consistent with this, an inverse correlation was identified between the expression of CII (especially SDHC) and MHC-APP encoding genes in the cancer cell line encyclopedia (CCLE) (Fig. S7A). Furthermore, analysis of human breast and skin cancer samples from tumor sequencing studies identified significant down-regulation of MHC-APP genes in samples with high SDHC expression (Fig. S7B, C; Supplementary Table S1). Therefore, CII inhibition elevates intracellular succinate that drives elevated transcription of MHC-APP genes and antigen presentation in both mouse and human cancer cells. Many cancer cells escape the immune system by downregulation MHC-APP expression or becoming unresponsive to the IFN that activates these genes (25). Thus, our results that mitochondrial CII inhibition can upregulate MHC-APP through succinate accumulation independently of IFN signaling have therapeutic implications.
Mitochondrial succinate increases MHC-APP gene transcription via inhibiting histone demethylases and modulating the tumor epigenetic landscape
Because intracellular αKG/succinate ratio is an important determinant of the enzymatic activity of 2-oxoglutarate-dependent dioxygenases (2-OGDDs), including ten-eleven translocation (TET) family members and lysine-specific demethylases (KDMs) (2, 26, 27), we asked whether inhibition of CII decreases αKG/succinate ratio and 2-OGDD activity. Inhibition of CII or addition of cell-permeable succinate to YUMM1.7 cells significantly reduced the intracellular αKG/succinate ratio and increased trimethylation of several key lysine residues of histone H3 that are often associated with transcription regulation (Fig S8A to D). Notably, cell-permeable αKG treatment of CII inhibited (3-NPA) cells increased the αKG/succinate ratio and reversed H3 trimethylation, cell surface MHC-I and expression of MHC-APP genes (Fig 3A–C; S8E, F), consistent with succinate-mediated inhibition of 2-OGDDs being a key downstream effect of CII inhibition. Since treatment of CII-inhibited YUMM1.7 cells with 5-azacytidine (DNA methyltransferase inhibitor) did not prevent the increase in MHC-I expression but rather increased it further (Fig S8G), we conclude that inhibition of TET DNA demethylase activity by succinate was likely not a major contributor to CII-inhibition-mediated MHC-APP expression.
Fig 3: Mitochondrial succinate regulates antigen presentation through changes in histone methylation.

A. αKG/Succinate ratio in YUMM1.7 cells treated with DMSO, 3-NPA and 3-NPA + αKG for 6 hours (n=4). B. Immunoblot analysis of indicated lysine trimethylation marks on histone 3 in YUMM1.7 cells treated with DMSO, 3-NPA and 3-NPA + αKG for 24 hours. Histone 3 and ACTIN are the loading controls. Numbers represents band density normalized to histone 3. Similar results were obtained with an independent experiment. C. Cell surface MHC-I expression on YUMM1.7 cells treated with DMSO, 3-NPA and 3-NPA + αKG for 48 hours (n=6). MHC-I expression is presented in fold change relative to DMSO treated cells. D. Genome-wide distribution profiles of H3K4me3 and H3K36me3 binding based on ChIP-seq reads in YUMM1.7 cells treated with DMSO, 3-NPA and 3-NPA + αKG for 24 hours. E. Heatmap representation of H3K4me3 enrichment intensity based on ChIP-seq reads in YUMM1.7 cells treated with DMSO, 3-NPA and 3-NPA + αKG for 24 hours. Signals within 3 kilobases around the transcription start site (TSS) are displayed in descending order for each cluster (i.e., gained, maintained, and lost in response to 3-NPA). F. Heatmap representation of H3K36me3 enrichment intensity based on ChIP-seq reads in YUMM1.7 cells treated with DMSO, 3-NPA and 3-NPA + αKG for 24 hours. Signals within 2 kilobases around the gene body (TSS to TES (transcription end site)) are displayed in descending order for each cluster (i.e., gained and maintained in response to 3-NPA treatment). G. Volcano plots showing differentially enriched genes for H3K4me3 (Top) and H3K36me3 (Bottom) modifications from ChIP-seq data comparing DMSO and 3-NPA treated YUMM1.7 cells (P < 0.0001 and fold change > 1.25). Peaks enriched for MHC-APP genes are depicted in blue. H. Bubble plot showing fold change of H3K4me3 enrichment on promoters of representative MHC-APP genes from ChIP-seq data set comparing DMSO and 3-NPA treated YUMM1.7 cells. Color gradient depicts the log10 (P-value). I. Genome browser tracks for H3K4me3 marks at Nlrc5, Psmb9, Tap1, Psmb8, and Tap2 loci in ChIP-seq. Boxes indicate significantly enriched peaks (P < 0.0001 and fold change > 1.25) at sites of interest.J. Genome browser track for H3K36me3 at Tap1 gene body in ChIP-seq. Box indicates significantly enriched peaks (P < 0.0001 and fold change > 1.25) at sites of interest.
Data points in each panel represent an independent sample. Data are presented in mean ± SD. Statistical significance was determined by One-way ANOVA with Dunnett’s multiple comparisons test for A and C.
The state of histone methylation is determined by the relative activities of KDMs and histone methyltransferases (Fig S9A). Succinate-mediated inhibition of KDMs shifts the balance towards increased histone methylation, therefore, we inhibited KDMs to determine if they are involved in CII/succinate-mediated increases in MHC-APP. We found that inhibition of the KDM5 family (H3K4me3 demethylases) by KDM5-C70 increased MHC-I expression comparable to CII inhibition, accompanied by increased levels of H3K4me3 in YUMM1.7 cells (Fig S9B, C). Next, we performed knockdown of the histone methyltransferases specific to H3K4me3 (KMT2A, KMT2B), H3K36me3 (SETD2), and H3K27me3 (EZH2) in CII knockout (sgSdhc) cells to restore the respective histone methylation (Fig S9D). While knockdown of these did not affect the IFNγ induced MHC-I, knockdown of KMT2A and SETD2 reversed CII depletion-induced expression of surface MHC-I and MHC-APP genes (Fig S9E–H). Thus, H3K4me3 and H3K36me3 are key marks that regulate antigen presentation in response to succinate accumulation.
To assess the impact of CII inhibition on global epigenetic reprogramming, we performed chromatin-immunoprecipitation sequencing (ChIP-seq) for H3K4me3 and H3K36me3 in YUMM1.7 cells treated with either 3-NPA, 3-NPA and αKG (to compete with succinate), or DMSO as the vehicle control. As expected, H3K4me3 and H3K36me3 signals exhibited genome-wide gains after CII inhibition in YUMM1.7 cells, which were notably reversed by αKG supplementation (Fig 3D; Supplementary Table S7–10). Specifically, cells treated with 3-NPA showed an increase in 8,098 peaks for H3K4me3 and 27,334 peaks for H3K36me3 compared to DMSO (Fig 3E, F). However, when αKG was added to the 3-NPA treated cells, the global trends were reversed with only 2,612 gained H3K4me3 peaks and 10,741 gained H3K36me3 peaks compared to DMSO. (Fig 3E, F). Interestingly, several MHC-APP genes were significantly enriched for H3K4me3 and H3K36me3 (Fig 3G, H; Supplementary Table S11, S12). For example, H3K4me3 levels were significantly increased in the promoter regions of Nlrc5, Psmb9, Tap1 and Psmb8 and this was markedly reversed by αKG treatment (Fig 3I). Similarly, the gene body of Tap1 showed a marked increase in H3K36me3, which was significantly rescued by αKG treatment (Fig 3J). Based on our transcription factor and epigenetic results, we propose a minimal model for how succinate activates MHC-APP transcription. That is, succinate accumulation downstream of CII inhibition alters the epigenetic landscape of the MHC-APP genes by suppressing KDM4 and KDM5 histone demethylase activity and increasing NLRC5 levels that cooperatively induce transcription of the MHC-APP genes. This, in turn, promotes more efficient tumor antigen presentation in YUMM1.7 melanoma cells. However, the regulation of MHC-APP genes is complex, thus the participation of other transcription factors and epigenetic modifiers in the response to succinate is also likely.
Increasing relative electron flow through mitochondrial complex I enhances tumor immunogenicity and TCR repertoire diversity
Previous studies have demonstrated the pro-inflammatory functions of succinate in macrophages and T cells (28–30). Our work also shows that accumulation of succinate within tumor cells is pro-inflammatory by increasing antigen presentation that activates T cell-mediated killing. However, systemic inhibition of CII is not a viable approach to increase tumor succinate levels because it could initiate de novo tumorigenesis, is neurotoxic, and very likely would have other adverse physiological effects in normal cells and tissues due to reduced mitochondrial ETC activity and ATP production (28, 31). However, conditions that rewire the ETC in favor of CI-driven electron flow over that from CII might reduce CII activity enough to allow succinate accumulation without significant reductions in overall ETC activity and ATP production. The formation of CI-containing supercomplexes (e.g., the respirasome) has been proposed to generate two different pools of ubiquinone that enhances CI to CIII electron flow and concomitantly decreases the contribution from CII to CIII (32, 33). Methylation-controlled J (MCJ) protein is an endogenous CI interacting protein in the inner mitochondrial membrane, knockout of which leads to increased CI activity over CII and formation of supercomplexes (34). Thus, we hypothesized that rewiring the ETC by knockout of MCJ would reduce CII activity without reducing overall ETC and ATP production and provide increased succinate for MHC-APP expression and enhanced anti-tumor immunity. Remarkably, knockout of MCJ (Mcj-KO) in YUMM1.7 cells increased CI-containing supercomplexes and CI+CIII activity with an associated decrease in CII+CIII activity, resulting in increased levels of intracellular succinate, antigen presentation and expression of MHC-APP genes (Fig 4AD–C; S10B, C). Similarly, YUMMER and B16-F10 Mcj-KO cells also had increased succinate and cell surface MHC-I and expression of MHC-APP genes (Fig S10D–F). Notably, ectopic expression of SDHA or knockdown of Ogdh in Mcj-KO YUMM1.7 cells reduced MHC-I expression, demonstrating the importance of succinate in driving MHC-I expression (Fig 4D; S11A–C). Furthermore, ChIP-qPCR analysis of promoters of representative MHC-APP genes in Mcj-KO cells confirmed the increased H3K4me3 enrichment (Fig S11D), similar to the direct CII inhibition. Next, we subcutaneously injected Mcj-KO YUMM1.7 cells into syngeneic C57BL/6 mice to test the effect of rewiring the ETC away from CII on tumor growth. Compared to control (sgSCR) YUMM1.7 tumors, Mcj-KO tumors grew substantially slower, maintained high levels of MHC-I, and contained greater numbers of CD45+ immune cells, especially CD8+ T cells (Fig 4E–I; S12A), thus mirroring the effects we observed in CII knockout YUMM1.7 cells in vivo. Similar results were observed in the more immunogenic YUMMER mouse melanoma tumor model (35) (Fig S12B–D). Further inspection of tumor-infiltrating CD8+ T cells showed that the cells from sgSCR control tumors expressed activation markers CD44 and CD69 as well as the TCF-1 transcription factor (which is important for memory T cells and their precursors, encoded by Tcf7 gene) whereas, CD8+ T cells in Mcj-KO tumors expressed greater amounts of PD-1, TIM3, CXCR6, TOX and effector molecules such as IFNγ and GZMB (Fig 4J; S12E). Furthermore, antibody-mediated depletion of CD8+ T cells restored the growth of Mcj-KO tumors, confirming the role of CD8+ T cells in tumor control (Fig 4K). These results show that the CD8+ TILs in the Mcj-KO tumors receive more antigenic signaling than control (sgSCR) tumors, which induces their differentiation into effector and exhausted cell states.
Fig 4: Knockout of the mitochondrial CI inhibitor MCJ rewires the ETC to increase tumor immunogenicity without reducing OXPHOS: a therapeutic proof-of-concept.
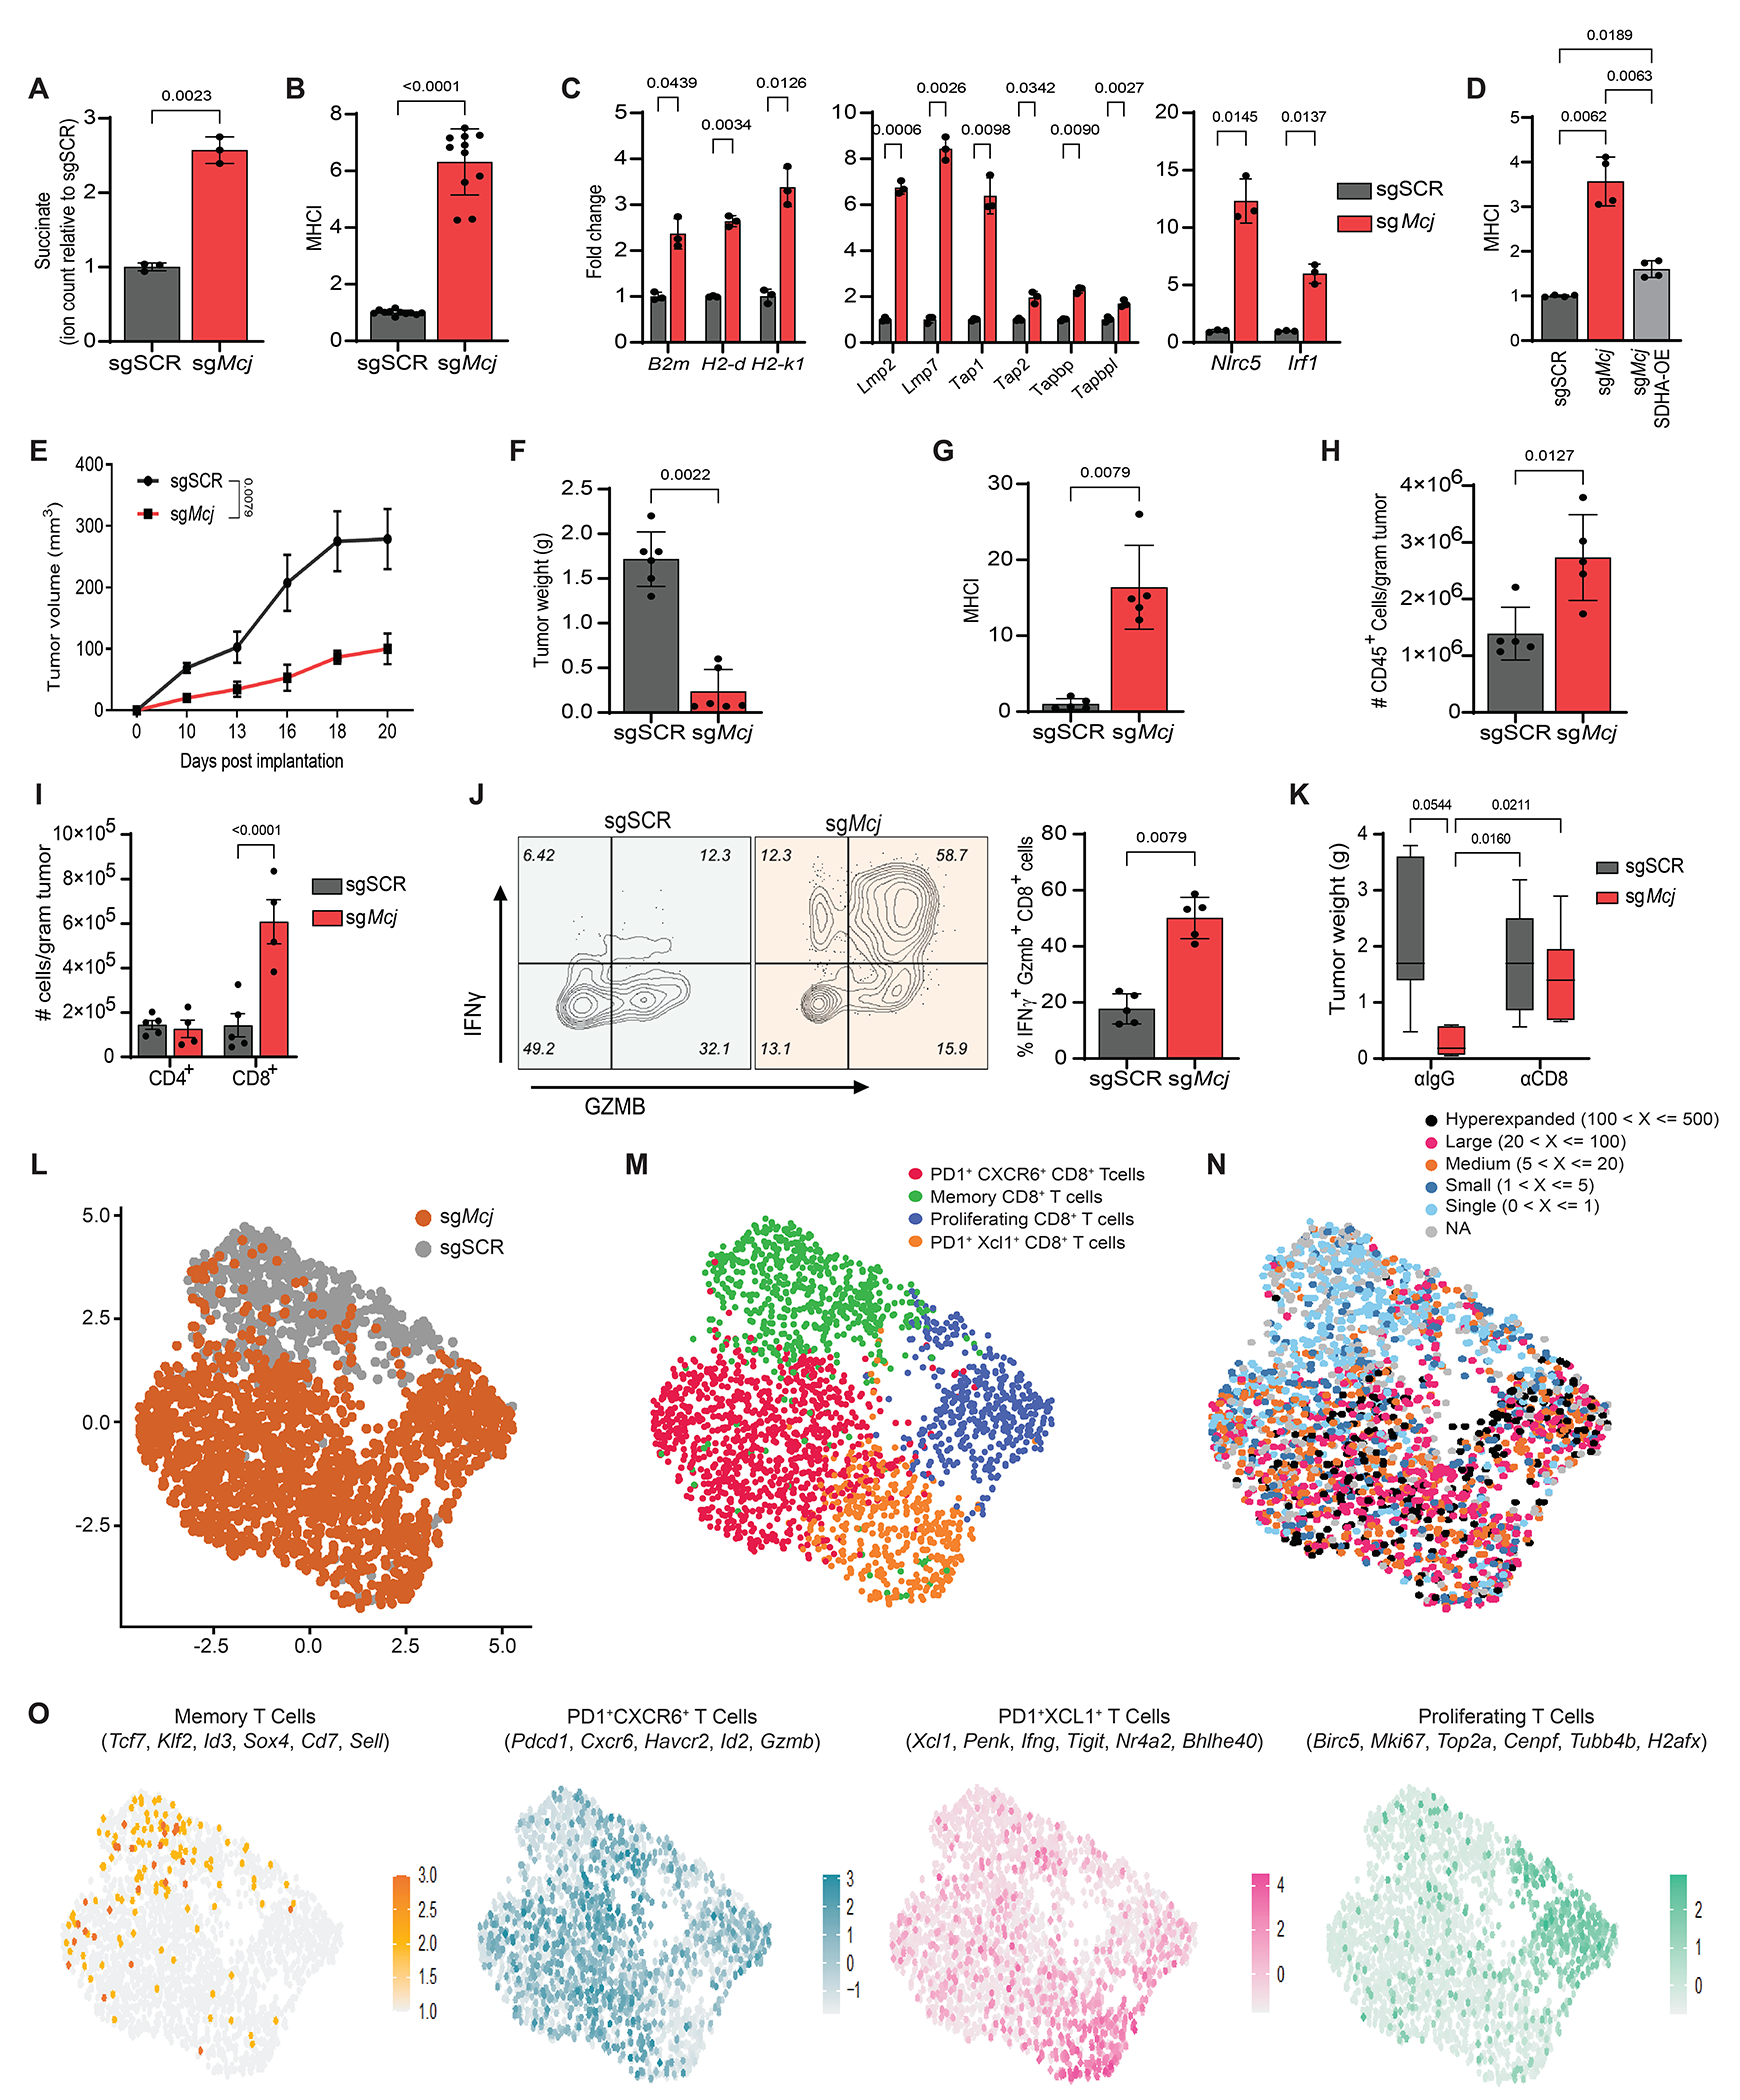
A. Relative succinate levels in sgSCR (control) and sgMcj (Mcj-knock-out) YUMM1.7 cells. Data are presented in fold change relative to sgSCR cells. B. Cell surface MHC-I expression on sgSCR and sgMcj YUMM1.7 cells (n=10). MHC-I expression is presented in fold change relative to sgSCR cells. C. qRT-PCR analysis of indicated representative MHC-APP genes in sgSCR and sgMcj YUMM1.7 cells. Expression levels are presented in fold change relative to sgSCR cells. Each data point represents a technical replicate of one biological sample. Similar results were obtained with an independent biological replicate. E-I. YUMM-sgSCR (n=5 mice) and sgMcj (n=5 mice) cells were subcutaneously injected in flanks of C57BL/6 male mice and monitored for tumor formation for 20 days. Tumor growth curves (Tumor volume vs time is plotted) (E), tumor weight at day 20 (in grams) (F), cell surface MHC-I expression relative to sgSCR tumor cells at day 20 (G), numbers of tumor-infiltrating CD45+ cells (per gram tumor) at day 20 (H), CD4+ and CD8+ T cells (per gram tumor) at day 20 (I). These data are representative of three independent experiments. J. Percentage (%) of IFNγ+ and GZMB+ positive tumor infiltrating CD8+ T cells in sgSCR and sgMcj YUMM1.7 tumors. K. Tumor weights in grams of sgSCR and sgMcj YUMM1.7 tumors from C57BL/6 mice treated with IgG isotype (αIgG) and anti-CD8 (αCD8) depleting antibodies for 21 days every second day. L. UMAP projection of 8274 CD8+ T cells from YUMM1.7-sgSCR and sgMcj tumors showing the formation of two clusters with the respective labels. Each dot corresponds to a single cell, color-coded by the sample type (grey-sgSCR, orange-sgMcj). M. UMAP projection from Seurat of CD8+ T cells into 4 distinct clusters according to differentiation and functional marker expression. Each dot represents a single cell, color-coded by the cluster type. N. UMAP projections showing average expression of functional signatures in CD8+ T cell clusters identified in panel M. The differentiation and functional markers defining the cluster are shown at the top. O. UMAP projection of CD8+ T cells overlaid with TCR clonal abundance. Each dot represents a single cell, color-coded by the number of TCR clones presents.
Data points in each panel represent an independent sample unless specified. Data are presented as mean ± SD for A to D and mean ± SEM for E to K. Statistical significance was determined by unpaired Welch t-test for A and B; two-way ANOVA with Dunnett’s multiple comparisons test for C, one-way ANOVA with Dunnett’s multiple comparisons test for D, unpaired Mann-Whitney test for E to H and J; two-way ANOVA with Sidak’s multiple comparisons test for I and two-way ANOVA with Tukey’s multiple comparisons test for K.
Next, we performed single cell transcriptomics coupled with single-cell TCR sequencing to profile the mRNA and TCRαβ repertoire of CD8+ T cells from YUMM1.7 Mcj-KO and sgSCR tumors. Interestingly, cells from Mcj-KO and sgSCR tumors clustered distinctively (Fig 4L; S13A). While the majority of the CD8+ T cells in sgSCR tumors clustered together and displayed signatures of memory CD8+ T cells (Tcf7, Klf2, Id3, Sox4, Sell, Cxcr3, Gzma, Gzmk, Cd69, Il7r) whereas the CD8+ T cells from Mcj-KO tumors clustered into PD1+ CXCR6+ CD8+ T cells (Pdcd1, Cxcr6, Havcr2, Id2, Gzmb, Cd38, Fasl), PD1+ XCL1+ CD8+ T cells (Xcl1, Penk, IFNγ, Tigit, Nr4a2, Bhlhe40, Csf2, Cc1, Prf1) and proliferating PD1+ CD8+ T cells (Birc5, Mki67, Top2a, Cenpf1, Tubb4b, H2afx, Pdcd1) confirming observations from FACS analysis (Fig 4M, N). Additionally, while the majority of CD8+ T cells from sgSCR controls had unique, single TCR clonotypes (clone size of 1) with high clonotype diversity as calculated by the Shannon, Chao, and ACE indexes (Fig S13B, C), CD8+ T cells from Mcj-KO consisted of hyper-expanded clones (>100 T cells with identical TCRα and β-chain) that expressed Pdcd1, Cxcr6, Gzmb and IFNγ genes (within the top 10 abundant clones) (Fig 4O; S13D, E). Interestingly, while only a few clones were present in both sgSCR and Mcj-KO tumors, most of the expanded clones in Mcj-KO tumors were unique (Fig S13F), pointing to increased expression of a broader set of tumor antigens due to increased MHC-I. Collectively, these results show that increasing intracellular tumor succinate and MHC-I (via Mcj-KO or direct CII inhibition) potentiates tumor cell immunogenicity and activation and infiltration of more tumor-reactive effector CD8+ T cells that suppresses tumor growth. Importantly, our results indicate that discrete rewiring of the ETC to moderately reduce CII activity or increase succinate in tumors not only improves T cell engagement by increasing MHC-I, but also enhances the selective expansion of protective T cell clones, which suggests that tumor MHC-I levels determine tolerogenic versus immunogenic set-points for tumor antigens. Hence, this ETC-rewiring approach might represent a one-two punch to convert “cold” tumors to “hot” and improve anti-tumor responses and immunotherapy.
Supplementary Material
Acknowledgments:
We thank members of Shadel, Kaech, and Hargreaves lab for helpful scientific discussions, reagents, and experimental support; Dr. K. Miller and V. Tripple for exceptional lab management and moral support; Dr. E. Stites for critical reading of the initial draft of manuscript, Dr. Q. Yan and Dr. X. Cheng for helpful scientific insight and discussions; Dr. C. O’Connor and the staff at the Salk Flow Cytometry Core Facility (funded by NIH-NCI CCSG: P30 014195 and Shared Instrumentation Grant S10-OD023689); C. Fine and V. Ngyuen at the UCSD/Sanford Consortium-Human Embryonic Stem Cell Core for cell sorting and FACS analysis; the Salk Waitt Advanced Biophotonics Core Facility (funding by NIH-NCI CCSG: P30 014195 and the Waitt Foundation); Y. Hang from the Salk Razavi Newman Integrative Genomics and Bioinformatics Core Facility (funding by NIH-NCI CCSG: P30 014195, and the Helmsley Trust); and the Salk NGS Core Facility (funded by NIH-NCI CCSG: P30 014195, the Chapman Foundation and the Helmsley Charitable Trust). Schematics were generated using Biorender (https://www.biorender.com/).
Funding:
This study was supported by NIH grants R01 CA216101 to G.S.S. and S.M.K., R01 CA228211 to G.S.S. and D.C.H., R35CA242379 to M.G.V.H., and R21 AI151562 to S.M.K. K.C.M. and D.C. were each supported by a Salkexcellerators postdoctoral fellowship. S.K.V. was supported by CRI and National Cancer Center-postdoctoral fellowship. S.K.V. and D.C. were each supported by NOMIS center postdoctoral fellowship. K.L.N. was supported by the National Science Foundation (DGE-1122374) and NIH grants (F31CA271787 and T32GM007287). A.G.S. was supported by NIA grant (F31AG062099). P.B.E.-M. was supported by a research fellowship from Fundación Alfonso Martín Escudero (Spain). N.T. was supported by a postdoctoral fellowship from the Salk Paul F. Glenn Center for Biology of Aging Research. GM was supported by the Conrad Prebys Foundation. G.S.S. holds the Audrey Geisel endowed Chair of Biomedical Science and S.M.K. holds the NOMIS endowed chair and D.C.H. holds the Richard A. Heyman and Anne E. Diagle Endowed Developmental Chair. G.S.S and the Salk core facilities are also supported by the San Diego Nathan Shock Center NIH P30AG068635.
Competing interests:
G.S.S. is on the scientific advisory board and has equity in Mitotherapeutix. S.M.K. is on the scientific advisory boards and has equity in EvolveImmune Therapeutics, Simcha Therapeutics, Affini-T Therapeutics, Arvinas, and Pfizer. M.G.V.H. is on the scientific advisory board in Agios Pharmaceuticals, iTeos Therapeutics, Sage Therapeutics, Pretzel Therapeutics, Lime Therapeutics, Doria Ventures, and Auron Therapeutics. M. R. is a co-founder and a member of the scientific advisory board of Mitotherapeutix LLC. M.B. receives funding for unrelated research activities from AstraZeneca. M. R. is inventor on the patent application 14/413,927 and 15/805,534 submitted by University of Vermont that covers the use of Method and compositions for metabolic regulation. M. R. is inventor on the patent application 15/551,995 submitted by University of Vermont that covers the use of MCJ agonists and uses thereof. M. R. is inventor on the patent application 15/743,096 submitted by University of Vermont that covers the use of Method and compositions to treat drug-induced diseases and conditions. M. R. is inventor on the patent application 62/979,833 submitted by University of Vermont and Mitotherapeutix that covers the use of Compositions and methods for inhibiting expression of methylation-controlled J-Protein (MCJ). The remaining authors declare no competing interests.
Data and Material availability:
Sequencing data (Bulk RNA-seq, scRNA-seq and ChIP-seq) generated in this study are available at the Gene Expression Omnibus (GEO) under accession code GSE198348 and GSE235311. CCLE RNA-seq data can be found through the link https://portals.broadinstitute.org/ccle. Codes used to analyze the human tumor RNA-seq data are deposited to zenodo (https://doi.org/10.5281/zenodo.8191267). All the data are available in the main text or supplementary materials. Other materials generated in this manuscript are available from the corresponding authors upon reasonable request and, when applicable, fulfilment of appropriate material transfer agreements.
References and Notes
- 1.DeBerardinis RJ, Chandel NS, Fundamentals of cancer metabolism. Sci Adv 2, e1600200 (2016). [DOI] [PMC free article] [PubMed] [Google Scholar]
- 2.Martinez-Reyes I, Chandel NS, Mitochondrial TCA cycle metabolites control physiology and disease. Nat Commun 11, 102 (2020). [DOI] [PMC free article] [PubMed] [Google Scholar]
- 3.Martinez-Reyes I et al. , Mitochondrial ubiquinol oxidation is necessary for tumour growth. Nature 585, 288–292 (2020). [DOI] [PMC free article] [PubMed] [Google Scholar]
- 4.Dong LF et al. , Horizontal transfer of whole mitochondria restores tumorigenic potential in mitochondrial DNA-deficient cancer cells. Elife 6, (2017). [DOI] [PMC free article] [PubMed] [Google Scholar]
- 5.Tan AS et al. , Mitochondrial genome acquisition restores respiratory function and tumorigenic potential of cancer cells without mitochondrial DNA. Cell Metab 21, 81–94 (2015). [DOI] [PubMed] [Google Scholar]
- 6.Kim M, Mahmood M, Reznik E, Gammage PA, Mitochondrial DNA is a major source of driver mutations in cancer. Trends Cancer 8, 1046–1059 (2022). [DOI] [PMC free article] [PubMed] [Google Scholar]
- 7.Lussey-Lepoutre C et al. , Loss of succinate dehydrogenase activity results in dependency on pyruvate carboxylation for cellular anabolism. Nat Commun 6, 8784 (2015). [DOI] [PMC free article] [PubMed] [Google Scholar]
- 8.Aggarwal RK et al. , Functional succinate dehydrogenase deficiency is a common adverse feature of clear cell renal cancer. Proc Natl Acad Sci U S A 118, (2021). [DOI] [PMC free article] [PubMed] [Google Scholar]
- 9.Gopal RK et al. , Early loss of mitochondrial complex I and rewiring of glutathione metabolism in renal oncocytoma. Proc Natl Acad Sci U S A 115, E6283–E6290 (2018). [DOI] [PMC free article] [PubMed] [Google Scholar]
- 10.Lorendeau D et al. , Dual loss of succinate dehydrogenase (SDH) and complex I activity is necessary to recapitulate the metabolic phenotype of SDH mutant tumors. Metab Eng 43, 187–197 (2017). [DOI] [PubMed] [Google Scholar]
- 11.Gorelick AN et al. , Respiratory complex and tissue lineage drive recurrent mutations in tumour mtDNA. Nat Metab 3, 558–570 (2021). [DOI] [PMC free article] [PubMed] [Google Scholar]
- 12.Hart ML et al. , Mitochondrial redox adaptations enable alternative aspartate synthesis in SDH-deficient cells. Elife 12, (2023). [DOI] [PMC free article] [PubMed] [Google Scholar]
- 13.Birsoy K et al. , An essential role of the mitochondrial electron transport chain in cell proliferation is to enable aspartate synthesis. Cell 162, 540–551 (2015). [DOI] [PMC free article] [PubMed] [Google Scholar]
- 14.Meeth K, Wang JX, Micevic G, Damsky W, Bosenberg MW, The YUMM lines: a series of congenic mouse melanoma cell lines with defined genetic alterations. Pigment Cell Melanoma Res 29, 590–597 (2016). [DOI] [PMC free article] [PubMed] [Google Scholar]
- 15.MacFarlane J et al. , A review of the tumour spectrum of germline succinate dehydrogenase gene mutations: Beyond phaeochromocytoma and paraganglioma. Clin Endocrinol (Oxf) 93, 528–538 (2020). [DOI] [PubMed] [Google Scholar]
- 16.Murphy MP, Chouchani ET, Why succinate? Physiological regulation by a mitochondrial coenzyme Q sentinel. Nat Chem Biol 18, 461–469 (2022). [DOI] [PMC free article] [PubMed] [Google Scholar]
- 17.Al Khazal F et al. , Unexpected obesity, rather than tumorigenesis, in a conditional mouse model of mitochondrial complex II deficiency. FASEB J 35, e21227 (2021). [DOI] [PMC free article] [PubMed] [Google Scholar]
- 18.Armstrong N et al. , SDHB knockout and succinate accumulation are insufficient for tumorigenesis but dual SDHB/NF1 loss yields SDHx-like pheochromocytomas. Cell Rep 38, 110453 (2022). [DOI] [PMC free article] [PubMed] [Google Scholar]
- 19.Bayley JP et al. , Sdhd and SDHD/H19 knockout mice do not develop paraganglioma or pheochromocytoma. PLoS One 4, e7987 (2009). [DOI] [PMC free article] [PubMed] [Google Scholar]
- 20.Lepoutre-Lussey C et al. , From Nf1 to Sdhb knockout: Successes and failures in the quest for animal models of pheochromocytoma. Mol Cell Endocrinol 421, 40–48 (2016). [DOI] [PubMed] [Google Scholar]
- 21.Piruat JI, Pintado CO, Ortega-Saenz P, Roche M, Lopez-Barneo J, The mitochondrial SDHD gene is required for early embryogenesis, and its partial deficiency results in persistent carotid body glomus cell activation with full responsiveness to hypoxia. Mol Cell Biol 24, 10933–10940 (2004). [DOI] [PMC free article] [PubMed] [Google Scholar]
- 22.Dannenberg H et al. , Losses of chromosomes 1p and 3q are early genetic events in the development of sporadic pheochromocytomas. Am J Pathol 157, 353–359 (2000). [DOI] [PMC free article] [PubMed] [Google Scholar]
- 23.Edstrom E et al. , Comparative genomic hybridization reveals frequent losses of chromosomes 1p and 3q in pheochromocytomas and abdominal paragangliomas, suggesting a common genetic etiology. Am J Pathol 156, 651–659 (2000). [DOI] [PMC free article] [PubMed] [Google Scholar]
- 24.Fishbein L et al. , Comprehensive molecular characterization of pheochromocytoma and paraganglioma. Cancer Cell 31, 181–193 (2017). [DOI] [PMC free article] [PubMed] [Google Scholar]
- 25.Dhatchinamoorthy K, Colbert JD, Rock KL, Cancer immune evasion through loss of MHC Class I antigen presentation. Front Immunol 12, 636568 (2021). [DOI] [PMC free article] [PubMed] [Google Scholar]
- 26.Losman JA, Koivunen P, Kaelin WG Jr., 2-Oxoglutarate-dependent dioxygenases in cancer. Nat Rev Cancer 20, 710–726 (2020). [DOI] [PubMed] [Google Scholar]
- 27.Xiao M et al. , Inhibition of alpha-KG-dependent histone and DNA demethylases by fumarate and succinate that are accumulated in mutations of FH and SDH tumor suppressors. Genes Dev 26, 1326–1338 (2012). [DOI] [PMC free article] [PubMed] [Google Scholar]
- 28.Chen X et al. , Succinate dehydrogenase/complex II is critical for metabolic and epigenetic regulation of T cell proliferation and inflammation. Sci Immunol 7, eabm8161 (2022). [DOI] [PMC free article] [PubMed] [Google Scholar]
- 29.Elia I et al. , Tumor cells dictate anti-tumor immune responses by altering pyruvate utilization and succinate signaling in CD8(+) T cells. Cell Metab 34, 1137–1150 e1136 (2022). [DOI] [PMC free article] [PubMed] [Google Scholar]
- 30.Tannahill GM et al. , Succinate is an inflammatory signal that induces IL-1beta through HIF-1alpha. Nature 496, 238–242 (2013). [DOI] [PMC free article] [PubMed] [Google Scholar]
- 31.Ludolph AC, He F, Spencer PS, Hammerstad J, Sabri M, 3-Nitropropionic acid-exogenous animal neurotoxin and possible human striatal toxin. Can J Neurol Sci 18, 492–498 (1991). [DOI] [PubMed] [Google Scholar]
- 32.Calvo E et al. , Functional role of respiratory supercomplexes in mice: SCAF1 relevance and segmentation of the Q(pool). Sci Adv 6, eaba7509 (2020). [DOI] [PMC free article] [PubMed] [Google Scholar]
- 33.Lapuente-Brun E et al. , Supercomplex assembly determines electron flux in the mitochondrial electron transport chain. Science 340, 1567–1570 (2013). [DOI] [PubMed] [Google Scholar]
- 34.Hatle KM et al. , MCJ/DnaJC15, an endogenous mitochondrial repressor of the respiratory chain that controls metabolic alterations. Mol Cell Biol 33, 2302–2314 (2013). [DOI] [PMC free article] [PubMed] [Google Scholar]
- 35.Wang J et al. , UV-induced somatic mutations elicit a functional T cell response in the YUMMER1.7 mouse melanoma model. Pigment Cell Melanoma Res 30, 428–435 (2017). [DOI] [PMC free article] [PubMed] [Google Scholar]
- 36.Heinz S et al. , Simple combinations of lineage-determining transcription factors prime cis-regulatory elements required for macrophage and B cell identities. Mol Cell 38, 576–589 (2010). [DOI] [PMC free article] [PubMed] [Google Scholar]
- 37.Blighe at al K., EnhancedVolcano: Publication-ready volcano plots with enhanced colouring and labeling. https://github.com/kevinblighe/EnhancedVolcano. (2018) [Google Scholar]
- 38.Nuevo-Tapioles C et al. , Coordinate beta-adrenergic inhibition of mitochondrial activity and angiogenesis arrest tumor growth. Nat Commun 11, 3606 (2020). [DOI] [PMC free article] [PubMed] [Google Scholar]
- 39.Esparza-Molto PB et al. , Generation of mitochondrial reactive oxygen species is controlled by ATPase inhibitory factor 1 and regulates cognition. PLoS Biol 19, e3001252 (2021). [DOI] [PMC free article] [PubMed] [Google Scholar]
- 40.Barrientos F Fontanesi, F. Diaz, Evaluation of the mitochondrial respiratory chain and oxidative phosphorylation system using polarography and spectrophotometric enzyme assays. Curr Protoc Hum Genet Chapter 19, Unit19 13 (2009). [DOI] [PMC free article] [PubMed] [Google Scholar]
- 41.Wang S et al. , UCSCXenaShiny: an R/CRAN package for interactive analysis of UCSC Xena data. Bioinformatics 38, 527–529 (2022). [DOI] [PMC free article] [PubMed] [Google Scholar]
- 42.Newman M et al. , Robust enumeration of cell subsets from tissue expression profiles. Nat Methods 12, 453–457 (2015). [DOI] [PMC free article] [PubMed] [Google Scholar]
- 43.Doench JG et al. , Optimized sgRNA design to maximize activity and minimize off-target effects of CRISPR-Cas9. Nat Biotechnol 34, 184–191 (2016). [DOI] [PMC free article] [PubMed] [Google Scholar]
- 44.He et al. , Dynamic GATA4 enhancers shape the chromatin landscape central to heart development and disease. Nat Commun 5, 4907 (2014). [DOI] [PMC free article] [PubMed] [Google Scholar]
- 45.Zingg D et al. , The Histone Methyltransferase Ezh2 Controls Mechanisms of Adaptive Resistance to Tumor Immunotherapy. Cell Rep 20, 854–867 (2017). [DOI] [PubMed] [Google Scholar]
Associated Data
This section collects any data citations, data availability statements, or supplementary materials included in this article.
Supplementary Materials
Data Availability Statement
Sequencing data (Bulk RNA-seq, scRNA-seq and ChIP-seq) generated in this study are available at the Gene Expression Omnibus (GEO) under accession code GSE198348 and GSE235311. CCLE RNA-seq data can be found through the link https://portals.broadinstitute.org/ccle. Codes used to analyze the human tumor RNA-seq data are deposited to zenodo (https://doi.org/10.5281/zenodo.8191267). All the data are available in the main text or supplementary materials. Other materials generated in this manuscript are available from the corresponding authors upon reasonable request and, when applicable, fulfilment of appropriate material transfer agreements.