

Summary
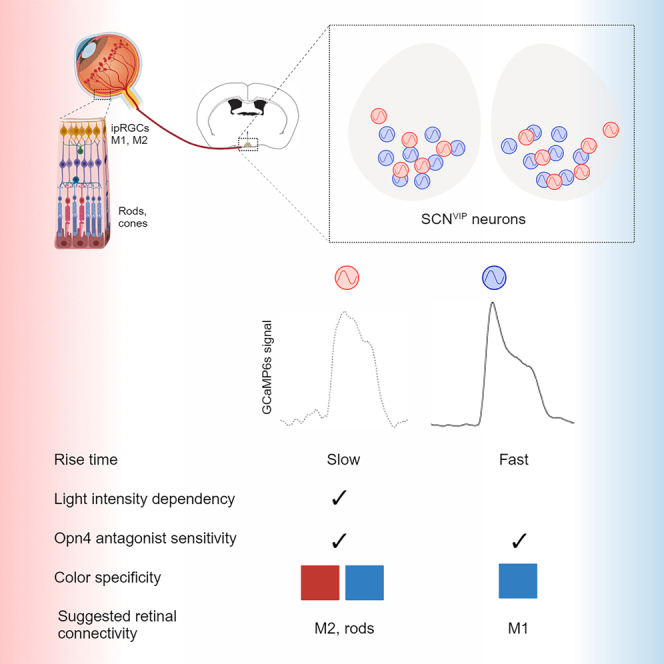
The circadian rhythm pacemaker, the suprachiasmatic nucleus (SCN), mediates light entrainment via vasoactive intestinal peptide (VIP) neurons (SCNVIP). Yet, how these neurons uniquely respond and connect to intrinsically photosensitive retinal ganglion cells (ipRGCs) expressing melanopsin (Opn4) has not been determined functionally in freely behaving animals. To address this, we first used monosynaptic tracing from SCNVIP neurons in mice and identified two SCNVIP subpopulations. Second, we recorded calcium changes in response to ambient light, at both bulk and single-cell levels, and found two unique activity patterns in response to high- and low-intensity blue light. The activity patterns of both subpopulations could be manipulated by application of an Opn4 antagonist. These results suggest that the two SCNVIP subpopulations connect to two types of Opn4-expressing ipRGCs, likely M1 and M2, but only one is responsive to red light. These findings have important implications for our basic understanding of non–image-forming circadian light processing.
Subject areas: Biological sciences, Neuroscience, Behavioral neuroscience
Graphical abstract
Highlights
-
•
Monosynaptic tracing from SCNVIP neurons reveals two subpopulations
-
•
Calcium changes show two patterns of immediate responses to light
-
•
Manipulating light intensity and color support the presence of two subpopulations
-
•
The sensitivity to Opn4 antagonist hints to SCNVIP connectivity with M1 and M2 ipRGCs
Biological sciences; Neuroscience; Behavioral neuroscience
Introduction
The hypothalamic suprachiasmatic nucleus (SCN) is a key structure in non–image-forming (NIF) light processing and circadian behavior. A specific cell population, SCN vasoactive intestinal peptide (VIP)-expressing neurons (SCNVIP), has been shown to be a primary contributor to SCN light response.1,2 Neuronal activity measurements using a calcium-sensitive fluorescent sensor (GCaMP) in a Cre-dependent manner using in vivo bulk recording, known as fiber photometry (FP), show that SCNVIP neurons are active during the day3 and essential for circadian regulation, in addition to mediating the rapid response to light solely during the dark phase, as measured by FP or a neuronal activity marker such as c-Fos.4,5
Recent studies suggest that SCNVIP neurons can be divided, either genetically or functionally, into two subpopulations. Based on single-cell mRNA sequencing data, SCNVIP neurons can be genetically separated further into two major neuropeptidergic subpopulations, Vip+/Grp+ and Vip+/Nms+, with a relatively low percentage of rhythmic genes in the Vip+/Grp+ subgroup compared to the Vip+/Nms+ subgroup.6,7 Functionally, it was shown that SCNVIP neurons could be separated into two subpopulations based on patterns of activity, either tonic or phasic.8,9 It is unknown, however, whether the two cell populations differ functionally in light information processing.
The primary sensory mediators conveying information about light to the SCN are the retinal opsins. The mouse retina contains two types of photoreceptive cells: rods and cones. Rods express the photopigment Rhodopsin. Mouse cones express M- and S-opsins, which mediate color vision, but lack the homolog of human L-opsin. Both rods and cones project indirectly to retinal ganglion cells (RGCs) via a complex circuit involving bipolar, horizontal, and amacrine cells.10 About twenty years ago, it was discovered that a small subpopulation (1–3%) of RGCs are intrinsically photosensitive, therefore termed ipRGCs. The ipRGCs express the Opn4 gene, encoding melanopsin,11 which has a unique role as a photo-inducer of circadian phase shifting in response to blue light12 and is required for NIF responses.13 IpRGCs form the retinohypothalamic tract and project directly to the SCN mainly through the M1 subpopulation,14,15 and to other brain nuclei involved in circadian photo-entrainment.16,17,18,19,20,21 Together, opsin-expressing retinal cells are responsible for the photo-entrainment of circadian rhythms, mainly through ipRGC projections to the SCN.
However, over the years, it has become clear that ipRGCs cannot be the sole retinal input to SCN activity and circadian behavior. First, it was demonstrated by Güler et al. that ipRGCs transmit photic input transduced by rods and cones.22 Second, melanopsin is highly sensitive to blue light, with an absorption peak at 480 nm, but it was found that red light (>600 nm) affects circadian rhythm and sleep-wake behavior23,24 with various effects on behavior and physiology in mice and rats, including altered sleep architecture and locomotor activity.23,25 Third, in mice expressing the human red cone L-opsin, it was shown that SCN responses are sensitive to ambient light conditions.26 In addition, using circadian and neuronal activity markers, such as Per2 and c-Fos, SCN neuronal activity was shown to be sensitive to a relatively wide spectrum in mice27,28 and hamsters.29 Lastly, in freely moving mice expressing only cones, SCN electrophysiology showed that UV light is more effective than green light for photo-entrainment and that the SCN exhibits slower decay times for UV light.30 Together, this evidence emphasizes that color and intensity perception in the SCN can be indicative of retinal photoreceptors’ sensitivity, beyond ipRGCs.
To understand this connectivity of SCNVIP neurons, and the functional separation of subpopulations, we explored light-responsive inputs to the SCN. First, we used monosynaptic tracing to identify two types of connectivity to SCNVIP neurons. We then used bulk calcium imaging (fiber photometry, FP) and one-photon single-cell mini-endoscopic imaging of GCaMP6s activity to test SCNVIP responsiveness to different light spectral and intensity conditions in vivo. We identified two subpopulations of SCNVIP neurons with distinct response profiles. Finally, by pharmacological manipulation of Opn4 we confirmed that both SCNVIP subpopulations are connected to ipRGCs.
Results
Monosynaptic tracing from SCNVIP neurons to the retina suggests two subpopulations with distinct connectivity
In order to address the functional properties of SCNVIP neurons in response to light, we first aimed to learn their unique connectivity to the retina. We used an experimental design that allowed us to follow monosynaptic inputs to SCNVIP neurons; i.e., direct injection of an adeno-associated virus (AAV) to deliver a split version of the EnvA receptor protein TVA (experimental group, Exp), or eGFP (control, Ctrl), followed by EnvA-ΔG Rabies virus injection to deliver mCherry to the SCN of VIP-Cre mice (Figure 1A). This approach labels SCNVIP with eGFP, and, in the experimental group, monosynaptically connected neurons with mCherry. Verifying the expression of the starting population in the SCN (Figures 1B, S1A and S1B), we observed brain-wide expression, as was reported recently,6 including in the paraventricular nucleus of the thalamus (PVT) and the medial preoptic area (MPA) (Figure S1C–S1E). We identified 187 ± 4 (mean ± SEM) Opn4+ cells on average (nmice = 7) in the RGC layer using immunohistochemistry. Based on TVA-mCherry expression, we identified two subpopulations that project to SCNVIP neurons: one that expresses mCherry and is labeled by the Opn4 antibody and one that expresses mCherry only. In the experimental group, we found 60 ± 4 mCherry+ cells (nmice = 4, mean ± SEM). Only a subset of Opn4-ab labeled cells in the retina was co-labeled by mCherry from SCNVIP neurons (3.5 ± 1%). Among RGCs identified as projecting to SCNVIP neurons (i.e., those that expressed mCherry), a subset of 14 ± 2% was co-labeled with Opn4-ab (Figure 1D). No mCherry expression was found in the control group (nmice = 3, Figure S1B). These results suggest that SCNVIP neurons can be divided into two functional subpopulations based on retinal connectivity.
Figure 1.

Monosynaptic tracing from SCNVIP neurons to the retina supports the existence of two subpopulations
(A) Experimental design: VIP-Cre mice were injected with AAV1 expressing Cre-dependent split-VTA with eGFP (exp, n = 3) or AAV9 expressing Cre-dependent eGFP only (ctrl, n = 3), followed by EnvA-ΔG Rabies expressing mCherry.
(B) Example of expression of the two viruses in the SCN. VIP neurons express eGFP (green), indicating split-VTA expression, and monosynaptic neurons express mCherry (white).
(C) Example of a flattened retina, stained with Opn4-ab (red) and expressing Rabies-mCherry (white).
(D) Percentages of cells in the retina which were (left) mCherry+ and labeled by Opn4-ab (black), and (right) labeled by Opn4-ab and mCherry+ (red, ‘boxplot’ presentation, MATLAB).
(E) Example of ipRGCs labeled with Opn4-ab that do not express mCherry.
(F) Example of mCherry-expressing RGCs that do not show Opn4-ab labeling.
(G) Example of Opn4-ab-labeled RGCs (ipRGCs) expressing mCherry and projecting to SCNVIP neurons. Brn-3c staining was used to identify the RGC layer. See also Figure S1.
Responses of SCNVIP neurons to short light intervals are wavelength-dependent
Next, we hypothesized that the different retinal connectivity of SCNVIP neurons could give rise to unique responsiveness to light spectral properties and intensities. To test this, we recorded GCaMP6s signal from freely behaving VIP x Ai162(GCaMP6s) mice implanted with optical fibers (400 μm diameter) positioned above the SCN, using a FP setup31,32 (Figures 2Ai). Fiber location was visualized using a 3D histology method we designed for deep targets such as the SCN31 (Figures 2Aii). We applied short intervals of ambient light (15 s) during the dark phase (ZT15 ± 1.5), separated by 30 s intervals of dark to allow response relaxation, while recording GCaMP6s activity in freely behaving mice for a total of six trials. Light was introduced in a random order of seven different wavelengths: 395, 438, 473, 513, 560, 586, and 650 nm, corresponding to violet, blue, cyan, teal, green, orange, and red light, respectively, covering the major contributions of different opsins (Figures 2Aiii). Applying an equal number of photons at each wavelength (1.55 ± 0.05E15 photons/cm2/s, measured at the fiber tip, 3.4 ± 1E14 photons/cm2/s at the cage bottom), we observed that SCNVIP calcium responses differed in their amplitude (Figures 1B–1D), showing maximal response at 438 nm (blue, z-scored dF/F = 5.1 ± 0.9) and reduced responses toward red wavelengths (z-scored dF/F = 0.3 ± 0.1 at 650 nm). As a side note, the amplitude of the FP signal depends on the location of the fiber relative to the fluorescent target33 and we found that the responses to red light, while low in amplitude in this specific experiment, were higher compared to the control (VIP x Ai140(GFP)) when the fiber was closer to the target cells (Figure S2). The responses to different wavelengths showed characteristic changes in peak amplitude from first to second repeats (Figure 2E, left) and second to third repeats (right, shown as a function of wavelength, as defined in (b)), with a decrease in amplitude specifically in response to 438 nm (ΔP 1-2, p = 0.054, and p = 0.016 when excluding one outlier, Kruskal-Wallis Test). Comparing the spectral sensitivity we observed by FP (Figure 2F) to those known for mouse opsins (Figure 2G) showed that SCNVIP activity cannot be explained solely by Opn434 and M-opsin (expressed in cones35), suggesting input from additional opsins, potentially Rhodopsin for red-shifted sensitivity,36,37 and S-opsin (expressed in cones) for blue-shifted sensitivity.38 In summary, measuring the spectral response of calcium signals from SCNVIP neurons showed broad spectral sensitivity, wider than the sensitivity of individual opsins, which peaks 40 nm away from the highest sensitivity of Opn4, hinting that mouse Rhodopsin, Opn4, M-opsin, and S-opsin all contribute to the ensemble activity of SCNVIP neurons.
Figure 2.

SCNVIP neurons’ GCaMP6s responses to 15 s of light are wavelength-dependent
(A) The fiber photometry experimental setup. (i) VIP-Cre x Ai162(GCaMP6s) mice implanted with two 400 μm optical implants at a 13° angle. (ii) LiGS histology to visualize fiber placement. (iii) Top: light exposure patterns. Left: top view of cage as blue light is introduced. Right: spectral specifications of the light exposures.
(B) Examples of individual responses to 15 s of light at the indicated wavelengths (n = 6, 4 females, 2 males).
(C) Averaged responses (6 repeats, z-scored, thick lines) and SEM (thin lines). Yellow bars represent light exposure times.
(D) Normalized z-scored dF/F responses.
(E) The change in peak amplitude from the first to second repeat (left) and second to third repeat (right), as a function of wavelength, as defined in (B).
(F) Comparison between the integrated responses to the seven wavelengths. Light intensities were matched to have an equal number of 1.55E15 photons at the fiber tip.
(G) SCNVIP FP responses overlaid with opsin sensitivity spectra: S-opsin, Opn4, M-opsin and Rhodopsin. See also Figure S2.
SCNVIP neurons show an intensity dependence in their blue and red light response profiles
Inspired by previous work showing that spectral responses in the SCN can indicate retinal connectivity,30,37,39 we tested whether light intensities at two wavelengths, blue (438 nm) and red (650 nm), resulted in distinct functional neuronal activity. We used an ambient light exposure of 15 s at several intensities, from 1.76E13 to 1.40E15 photons/cm2/s, depending on the wavelength of light, including vivarium white and red light, for comparison (Figures 3A–3D, see detailed response profiles in Figure S3). Overall, responses to 650 nm light were lower in amplitude and not detectable at intensities at or lower than 1.82E14 photons/cm2/s (Figure 3C). Responses to blue light were easily detectable over the applied range (Figure 3D). Comparing the averaged response profiles (Figure 3E1, 3E2) showed that high-intensity light induced a unique response profile, i.e., a fast initial rise at stimulus onset, decreasing by 50–60% within 10–20 s and then sustaining for the duration of the light exposure. The correlation of the temporal profiles of the responses to 438 nm light decreased, with correlation coefficients (CCs) reducing from 1 to 0.92, indicating loss of the unique response profile with decreasing intensity. We observed a more substantial decline in correlation in the responses to red light. Over a small range of intensities (6.32E14 to 1.95E14 photons/cm2/s), the CC values decreased from 1 to 0.63, as the “high-intensity” response profile flattened (Figure 3E3). Ambient white room light at 4.49E14 photons/cm2/s caused the maximal amplitude of dF/F peak values (dF/F = 10 a.u.). Blue light (438 nm) induced relatively high median dF/F peak values (6.9 a.u.), which were non-linearly correlated to the light intensity (increasing from 3.1 to 6.9 a.u. in response to 1.76E13 and 4.27E14 photons/cm2/s, respectively), as was found by Walmsley and colleagues.39 Overall, the responses to 650 nm light were low-amplitude, between 0.4 and 1.3 (dF/F, a.u.) (Figure 3F1). The light intensity also affected the rise time in response to both 650 nm and 438 nm stimuli (Figure 3F2). Turning off the light induced an exponential decay, with decay times unaffected by stimulus wavelength or intensity (Figure 3F3).
Figure 3.

SCNVIP neurons show an intensity dependency in their blue and red light response profiles
(A and B) Averaged light response to (a) ambient vivarium white light (n = 9, 6 females, 3 males) and (b) ambient vivarium red light (z-scored, n = 8, 5 females, 3 males).
(C and D) Averaged light response to different intensities of (c) 650 nm red light, 6.32E14 to 1.82E14 photons/cm2/s and (d) 438 nm blue light, 1.4E15 to 1.76E13 photons/cm2/s (n = 4, 1 females, 3 males).
(E) Normalized response profiles to (e1) white light (black), vivarium red light (dark red), and 650 nm red light at different intensities (red) and (e2) 438 nm blue light at different intensities (blue: > 1E14 and black: < 1E14 photons/cm2/s). The normalized response to the 650 nm light exposure at 1.82E14 photons/cm2/s was at noise level and is not displayed. (e3) Matrix of correlation coefficients (CCs) between response profiles.
(F) Detected parameters across intensities and light sources. Black: white room light; dark red: red room light; blue: 438 nm light source; and red: 650 nm light source. All values represent median±SEM. (f1) Maximum amplitude of non z-scored dF/F. (f2) Rise time, defined as the time from the beginning of the light exposure to the peak response. (f3) Decay time after turning the light off.
(G) Examples of dF/F responses to white light, 438 nm blue light, and 650 nm red light, six repeats each.
(H) The change in peak amplitude from the (h1) first to second repeat and (h2) second to third repeat. All responses are averaged over six repeats (except (g)). See vivarium white and red light spectra in Figure S3.
In addition to the averaged response, we found that repeated stimuli (over the six repeats) induced two non-identical temporal responses. Examples of responses to white, blue (438 nm), and red (650 nm) light are presented (Figure 3G). By quantifying the change in peak responses in the first three repeats, we observed that the second response had a lower amplitude than the first (ΔP1-2 < 1). This phenomenon occurred when the mice were exposed to white room light, as well as when they were exposed to blue (438 nm) light at intensities higher than 1.3E14 photons/cm2/s, and was not observed at lower intensities or 650 nm light exposure (Figure 3h1). This property disappeared after the second light exposure (ΔP2-3 ≈ 1, Figure 3h2). These results show that SCNVIP neurons are sensitive to both wavelength and intensity and emphasize that the neurons differ in their immediate responses to 650 nm vs. 438 nm light. Combining these results with our previous spectral comparison (Figure 2G) strengthens the assumption that these multiphasic responses could indicate multiple pathways contributing to SCNVIP neurons' activity at the presence of light.
Opn4 antagonist changes the transient response of SCNVIP neurons to blue but not red light
We hypothesized that blue light contributes to SCNVIP responses mainly through melanopsin-expressing ipRGCs via the retinohypothalamic tract, whereas red light exerts its effects through a red-shifted opsin. To test this idea, we used a pharmacologic approach, a unique opportunity afforded by our in vivo recording. This approach bypasses the need for transgenic mice, which could have developmental compensations. We performed calcium recording from SCNVIP neurons while the mice were in the dark phase, exposed to 15 s of ambient blue (438 nm) or red (650 nm) light, before and 20 min after intraperitoneal (i.p.) administration of sulfonamide AA92593 (1-(4-methoxy-3-methyl-benzenesulfonyl)-piperidine), a melanopsin antagonist40 (Figure 4A, nmice = 6). Following AA92593 administration, exposure to blue light resulted in SCNVIP neuronal responses which were flattened relative to their double-humped profile before Opn4 antagonist administration (Figure 4 B-C i-iii). The responses to blue light were similar before and after administering the solvent (DMSO) alone (Figure S4). By contrast, the temporal responses to red light were not affected by AA92593 (Figure 4C iv-vi). Comparing the quantified parameters of the responses revealed that the mean width of the response peaks significantly increased following AA92593 application (Figure 4D). As we saw before, responses to 650 nm red light and 438 nm blue light were significantly different, based on the mean area under the curve (AUC) and rise-time (Figures 4E and 4F). Overall, these results show that while SCNVIP neuronal activity is sensitive to both blue and red light, an Opn4 antagonist alters SCNVIP GCaMP response profiles to blue light but not to red light, supporting the idea that SCNVIP receives input from both Opn4-expressing cells as well as non-Opn4 cells, which mediate the response to red light.
Figure 4.

Opn4 antagonist changes the transient profile of SCNVIP neurons’ GCaMP6s responses to blue light but not to red light
(A) Experimental design.
(B) Individual responses to ambient blue light, before and 20 min after AA92593 application (colored lines: individual repeats, black line: mean).
(C) Averaged z-scored dF/F response to blue light (i) before and (ii) after application of AA92593 (n = 6, 4 females, 2 males), as well as averaged z-scored dF/F responses to red light (iv) before and (v) after application of AA92593 (thick lines: average over 6 repeats, colored background: SEM) (iii) and (vi) Averaged responses.
(D–G) Comparisons between dF/F parameters. (d) Mean peak width. (e) Mean area under the curve (AUC). (F) Rise time. (G) Exponential decay constant. Additional details and parameter comparisons are shown in Figure S4. Data is shown in MATLAB “boxplot” presentation, showing sample median and the 25th (bottom) and 75th (top) percentiles of the sample. Nonparametric Kruskal-Wallis test, followed by Bonferroni correction (∗p < 0.05, ∗∗p < 0.01). See also Figure S4.
Single-cell calcium responses to light reveal at least two SCNVIP subpopulations
To test whether individual SCNVIP neurons could be separated into at least two subpopulations with distinct response profiles, we used a mini-endoscope41 to image single-cell calcium signals in SCNVIP neurons in response to 15 s of ambient white room light (ZT15 ± 1.5, Figures 5A–5C; ncells = 120; nmice = 7). Non-parametric numerical clustering of the response profiles separated the SCNVIP neurons into three subpopulations (k-means clustering, Figures 5D and 5E). The first two (clusters #1 and #2, ncells = 51 and ncells = 36, respectively) differed in their mean AUC, and both showed higher AUC and amplitude than cluster #3. The responses contributing to cluster #3 (ncells = 31) were noisy, some were inhibitory, and all were characterized by low amplitude and AUC (28 ± 8 a.u., median±SEM) and by a relatively slow rise time (5.8 ± 0.5 s). Comparing the classification with two vs. three clusters, we found that three clusters resulted in a cleaner classification, but the PCA plots do not strongly suggest that cluster #3 is a unique cell population (Figure S5). Instead, based on the large distribution of the rise times, and the low ratio between the response intensities at 5 and 15 s, we think it represents mainly noise (Figure 5G). At the single-cell level, while the averaged ΔP1-2 (as defined in Figure 2B) was lower in cluster #1 vs. #2, it was not significantly different, nor was ΔP2-3. More importantly, the responses in cluster #1 had a slower rise time on average than in cluster #2 (6.8 ± 0.2 s vs. 4.4 ± 0.3 s, respectively) (Figure 5F), a key parameter we identified above that distinguishes unique light responses (Figure 3F). We identified a small bias between sexes, with 43% and 56% clusters #1 and #2, respectively, in males and 67% and 33% in females (see details in Table S2). We also applied a Gaussian clustering approach (3 clusters), which revealed similar results, showing increased amplitude and faster rise time of cluster #2 compared to cluster #1 (Figure S5). Therefore, we concluded that the single-cell responses of the two clusters are highly correlated with the two FP response profiles we observed at different intensities and with Opn4 antagonist manipulation. We next aimed to reveal how each subpopulation responds to different light conditions.
Figure 5.

Single-cell calcium responses to light with a one-photon miniscope reveal at least two SCNVIP subpopulations
(A) Experimental setup.
(B) Example of identified cells.
(C) Responses of 120 individual cells to 15 s of ambient white room light, repeated six times. Top: mean of all cells. Bottom: heatmap of z-scored dF/F (n = 7, 6 females, 1 male).
(D) Cell population distributions of three clusters, defined by k-means clustering. For comparison, we also applied Gaussian clustering (Figure S5).
(E) Averaged temporal pattern of the three clusters shown in (D) (thick lines: average over 6 repeats, colored background: SEM).
(F and G) Parameters of the response profiles for each cluster. Nonparametric Kruskal-Wallis test, followed by Bonferroni correction (#p < 0.0005, all clusters, ∗∗∗p < 0.005, ∗∗p < 0.01, ‘boxplot’ MATLAB presentation next to full data displayed as asterisks). See also Figure S5.
Single-cell calcium responses to different light intensities support two SCNVIP subpopulations with intrinsic response profiles
Following our identification of SCNVIP subpopulations at the single-cell level, we next tested the consistency of their responses across varying stimulus conditions. Since various intensities of blue light (438 nm) all produced a detectable signal by both bulk FP and single-cell recording in our previous experiments, we used the same light exposure paradigm and recorded SCNVIP neuronal responses to blue light at three different intensities, 1.4E15, 1.3E14, and 1.7E13 photons/cm2/s, as well as to white room light for comparison. We recorded 56 neurons in total (Figure 6A, four light conditions, nmice = 4). We then applied the same clustering approach as in the previous experiment (Figure 5) to each light condition, limiting the classification to two clusters due to the smaller number of cells. Representative normalized mean responses of the two clusters in two light conditions are presented in Figure 6B. To understand if the cell response properties are unique to each cell or change with intensity, we compared the cell identification in each cluster across the four light conditions. We found that 70% of the neurons (39/56) kept their cluster identification in all different light conditions. Comparing the clustering of the high-intensity light responses, white and blue, we found that only three neurons changed their cluster identity. This observation affirms the power of the clustering analysis and indicates that blue light is sufficient to induce responses similar to those induced by white room light (Figure 6C). Representative traces from three cells, two that preserved cluster identity (one from each cluster), and one that changed identity, are shown in Figure 6D (see also Figure S6). As these examples show, the amplitude was the response property that differed the most between conditions. We next tested whether other response properties also changed by analyzing the response profiles across the entire dataset, focusing on amplitude, rise time, and decay time. We observed that cells in both clusters showed a significant decrease in mean AUC when blue light intensity was reduced from 1.4E15 to 1.7E13 photons/cm2/s, which recovered when white light was applied. Cluster #1, characterized by the relatively flat response profile, was more sensitive to light intensity (Figure 6E, light gray). Rise times also changed and were significantly longer for blue light (7.2 ± 0.5 s, mean ± SEM) than white light (4.8 ± 0.4 s), with a negligible effect of blue light intensity. Cluster #1 showed a trend of slower rise times compared to cluster #2 across light conditions, but the differences between the two clusters were insignificant (Figure 6F). Decay times did not change between light applications and were consistent with the previous dataset (∼0.5 s−1, Figure 6G). These results show that different intensities of blue light mainly altered response amplitude while the overall architecture of the responses was preserved. Finally, we compared the response to red light at the single-cell level, revealing that the two clusters differ in their response to red light, with cluster #1 not responsive to red light, and both clusters responsive to blue light (Figure S6). Overall, these results support the hypothesis that the response profiles are intrinsic properties of the cells, and could indicate connectivity to rods and ipRGCs.
Figure 6.

Single-cell calcium responses to light at different intensities and Opn4 antagonist support two SCNVIP subpopulations, both affected by Opn4 antagonist
(A–G) Responses of 56 individual cells to 15 s of blue light (438 nm) at intensities of 1.4E15, 1.3E14, and 1.7E13 photons/cm2/s and to ambient white room light, repeated six times. (A) Heatmaps of individually z-scored dF/F (n = 4, 1 female, 3 males). (B) Clustering results, showing two conditions, 1.4E15 and 1.3E14 photons/cm2/s. (C) Comparison of individual cells’ cluster identity across intensity changes. Green: cells that preserved cluster identity; gray: cells that changed cluster. (D) Responses of three representative cells. Top and middle: cells which retained cluster classification across conditions, from clusters #1 and #2, respectively. Bottom: a cell whose classification switched between conditions. (E-G) Quantification of response profiles over sessions (left to right) and clusters (dark and light gray). (E) Mean AUC. (F) Mean rise time. (G) Decay time.
(H–N) Responses of 56 individual cells to 15 s of blue light (438 nm) at an intensity of 4.3E14, repeated six times, before and 20 min after AA92593 application. (h) Heatmaps of individually z-scored dF/F (n = 4, 2 females, 2 males). (I) Averaged cell response, before (orange, solid line), and after (purple, dashed line) AA92593 application. (J) Individual cell responses sorted by k-means cluster, before (orange, solid line), and after (purple, dashed line) AA92593 application. (K) Averaged cell responses sorted by k-means cluster. (L–N) Quantification of response profile parameters: (L) mean AUC, (M) mean rise time, and (N) decay time. In (B), (D), (I–K): thick lines: average over 6 repeats, colored background: SEM. In (E–G), (L–N): The bars and lines represent mean ± SEM. Statistics within clusters (orange, red) and between clusters (black): Nonparametric Kruskal-Wallis test, followed by Bonferroni correction (∗p < 0.05, ∗∗p < 0.01, ∗∗∗p < 0.005, #p < 0.0005). See also Figure S6.
Opn4 antagonist application changes the single-cell response profiles of both SCNVIP clusters
Finally, we wanted to test whether the clusters we identified differ in their response to the Opn4 antagonist AA92593, at the single-cell level. We recorded SCNVIP neuronal responses to blue light at 4.3E14 photons/cm2/s, before and 20 min after AA92593 application, from 84 neurons (Figure 6H, nmice = 4). At the averaged population level, the overall responses before and after AA92593 application (Figure 6I) were similar to what we observed by bulk FP, affirming those results (Figure 4). However, single cells responded differently to the drug (examples shown in Figure 6J). To better understand this, we applied k-means clustering, revealing two clusters (Figures 6K and 6A third cluster was excluded as noise) separated by the same features, such as AUC and rise-time (Figure 6L), as we found previously. Testing the effect of AA92593 on each of the clusters revealed that none of the parameters changed significantly. These results clarify that both RGC subpopulations connected to SCNVIP neurons express Opn4, even though only one was robustly labeled by Opn4-ab.
Discussion
In this work, we test the idea that SCNVIP neurons, previously reported to comprise two subpopulations, can also be separated based on their response to light, indicating a possible role of the retina and underlying neural connectivity in modulating SCNVIP functional activity. Monosynaptic tracing from SCNVIP neurons to the retina supports the existence of two subpopulations, one clearly labeled as ipRGCs, and one not, as presented above. To further investigate this separation, we used an in vivo approach in which mice were exposed to repeated 15-s rounds of ambient light at the beginning of the dark phase (ZT15 ± 1.5) under various light and pharmacological conditions. At the same time, we recorded changes in calcium responses using GCaMP6s at both bulk and single-cell levels. By spectral analysis of SCNVIP neurons’ bulk GCaMP6s responses to these short light exposures, we found that SCNVIP neurons show an intensity-dependent response to both blue and red light, and an Opn4 antagonist specifically affected blue light responses, indicating two distinct functional response profiles. Indeed, single-cell calcium responses to light revealed the existence of at least two SCNVIP subpopulations, supported by their responses to different intensities of blue light. We found that both clusters are sensitive to light intensity but differ in their overall AUC. In addition, we found that the Opn4 antagonist AA92593 significantly changes the averaged response profiles, but this significance is lost when the clusters are separated, hinting at an effect on both subpopulations. Based on these results, we conclude that light inputs through the retina modulate two response profiles of SCNVIP neural activity, reflecting distinct underlying retina-SCN connectivity, likely through ipRGC types M1 and M2.42,43
Based on GCaMP6s in vivo imaging and quantification, we characterized two SCNVIP light response profiles–one relatively flat and highly sensitive to light intensity, and the other bimodal, with a faster rise time, which were also identified at the single-cell level. What could explain the distinction of these responses in spectral and intensity dependence, Opn4 dependence, and light adaptation? We suggest that the two clusters represent distinct SCNVIP subpopulations. Our results show that cluster #2 has a relatively fast rise time and a dominant response to blue light. This fast-rising response profile is missing when Opn4 antagonist is present. The response profile of cluster #1 has a higher dependency on the light intensity, slower rise time, and also appears in response to red light. At the single-cell level, Opn4 antagonist has an effect on the aggregate of both clusters. In addition, Opn4 antagonist does not change the response to red light, at least at the level of bulk recording. These observations, together with our monosynaptic tracing results, lead us to suggest that cells of cluster #1 are connected to ipRGCs that are not stained well by Opn4-ab, possibly type M2, and cluster #2 cells are connected to Opn4-ab-labeled ipRGCs, likely type M1, which are also highly sensitive to blue light, the peak sensitivity of Opn4 (see also.42,43 Supporting this idea, Beier et al. showed that the SCN receives nearly exclusive input from ipRGCs,44 which we can now trace specifically to SCNVIP neurons.
Several electrophysiology studies support the existence of subpopulations in the light-sensitive neurons in the SCN, including SCNVIP neurons, as demonstrated here and in previous work.4,6 First, Drouyer et al. demonstrated two subpopulations that differ in their kinetics.37 Interestingly, they observed an intensity-dependent initial fast transient, which disappeared when light intensity was reduced from 2E14 to 2E12 photons/cm2/s. These findings align with our observations of intensity-dependent response to blue light and the change in the response profile, in both bulk and single-cell imaging (Figures 3 and 6). The two profiles are consistent with typical rod- and cone-driven retinal mechanisms and intensity-dependent dynamics,17 where rods are responsible for slow kinetics and low intensities. Additional support for two types of retinal connectivity comes from the work of Walmsley et al., which divided the light-responsive neurons in the SCN based on color and irradiance sensitivity.39 Although our work differs in experimental design (they replaced the mouse cone with a human long-wavelength-sensitive cone), we found similar temporal profiles of the responses to light. Lastly, SCN activity in slices from the diurnal rodent Rhabdomys pumilio shows two profiles in response to dim and bright light.45 While electrophysiology recordings lack cell-type specificity, the similarity in the response profiles supports the existence of two SCNVIP subpopulations.
An alternative explanation for the two profiles could be pupil adaptation, which would explain the difference in response to subsequent applications of high but not low-intensity blue light. In addition, genetic manipulations of Opn4 expression have been shown to prevent full pupil constriction at high intensities,22,46 and the AA92593 Opn4 antagonist we used here caused a delay in pupil diameter reduction on a timescale of 5–30 s,40 which may be due to Opn4 expression in the mouse iris sphincter muscle.47 However, pupil constriction does not explain the presence of two functional clusters at the single-cell level. Therefore, we think this pathway has a minor contribution to the neuronal response.
The response to red light indicates contributions to SCNVIP neuronal activity from other light receptors, such as Rhodopsin (see also43,48). In particular, our observation that the FP responses to red light and low-intensity blue light have slower rise times supports the conclusion that the response to red light (and possibly blue light) is mediated by a photoreceptor other than melanopsin. This concurs with previous findings that Opn4 is not involved in locomotor activity responses to dim, 20 lux, light,49 and that rods and cones are both involved in dim light processing (see also48). In addition, in vivo SCN electrophysiology in freely moving mice has demonstrated that cone opsins contribute to circadian regulation.30 The response to red light at 650 nm should raise a concern about the usage of red light in vivarium, particularly in circadian and sleep related experiments.
Our recordings of GCaMP signals of SCNVIP neurons in response to light, also done previously by us and others using FP,4,6,31 highlight the relative advantages and disadvantages of bulk and single-cell calcium imaging. FP is relatively easy to perform and robust, while single-cell imaging from the SCN has become feasible only recently.50,51 Acquiring high-quality data is challenging because the SCN is a small (400 μm ML, 700 μm AP) and deep (5.5mm) target that suffers from high levels of motion artifacts. Performing both analyses, as we do here, allows comparison of the results to achieve a better understanding. For example, we can see that the rise-time dependency on the blue light intensity (FP, Figure 3) is mainly due to an increased contribution of cluster #2 rather than to a change in individual cells’ response profile (single-cell, Figures 5E and 5F).
Sensitivity to light properties is fundamental for the critical role of the SCN in mediating naturally relevant information, such as day vs. night, the specific time of day, such as twilight vs. midday,39 as well as seasonal information.52 In addition to keeping the daily rhythm, the SCN’s ability to relay information about various light properties is essential for hormonal modulations53 and immune responses.54 Therefore, understanding the mechanism that connects light properties to the SCN and beyond is highly important for better detecting and treating circadian-related ailments. We find that SCNVIP neuronal response profiles to light reflect at least two subpopulations. In the future, it will be of great interest to examine how this relates to other genetic and functional subpopulation definitions,6,7,8 increasing our understanding of how retinal connectivity and sensitivity affect the SCN in particular, and circadian behavior in general.
Limitations of the study
One difficulty in calcium imaging is understanding the cellular source of the calcium signal. Calcium flux is required for circadian rhythm generation in mammalian pacemaker neurons,55 and it has been noted that the intracellular circadian calcium rhythm in the SCN has a dual origin: light-induced Ca+ flux and action potentials.56 Thus, the signal we measured here may be a combined response of GCaMP to Ca+ increase. However, extracellular electrophysiology of SCN neurons from anesthetized mice showed an immediate increase in firing rates in response to high intensities of light,26,57 suggesting that the immediate response of GCaMP follows the increased firing rates. In addition, similar response profiles appear in other NIF nuclei, the pretectal olivary nuclei (PON).58
STAR★Methods
Key resources table
| REAGENT or RESOURCE | SOURCE | IDENTIFIER |
|---|---|---|
| Antibodies | ||
| GFP (Chicken) | Aves | GFP-1020, RRID AB_1608076 |
| Opn4 (Rb) | Advanced Targeting Solutions | AB-N39 RRID AB_1608076 |
| Anti-mCherry antibody (Ch) | abcam | ab205402 RRIDAB_2722769 |
| Anti-Brn-3c/BRN3C/POU4F3 Antibody (QQ8) (ms) | Santa Cruz Biotechnology | sc-81980 RRIDAB_2167543 |
| Alexa Fluor 488 AffiniPure F(ab’)2 Fragment Donkey Anti-Chicken IgY (IgG) (H+L) | Jackson Immune | 703-545-155 RRIDAB_2340375 |
| Donkey anti-Mouse IgG (H+L) Highly Cross-Adsorbed Secondary Antibody, Alexa Fluor Plus 488 | ThermoFisher | A32766 RRIDAB_2762823 |
| Alexa Fluor® 594 AffiniPure Donkey Anti-Chicken IgY (IgG) (H+L) | Jackson Immune | 703-585-155 RRIDAB_2340377 |
| Alexa Fluor® 647 AffiniPure Fab Fragment Donkey Anti-Rabbit IgG (H+L) | Jackson Immune | 711-607-003 RRIDAB_2340626 |
| Bacterial and virus strains | ||
| pAAV-synP-FLEX-splitTVA-EGFP-B19G | Addgene | 52473-AAV1 |
| EnvA G-Deleted Rabies-mCherry | Salk | 32636 |
| Chemicals, peptides, and recombinant proteins | ||
| Normal Donkey Serum | Jackson Immune | 017-000-121 |
| Dimethyl sulfoxide | Fisher | D128-4 |
| Heparin | Sigma-aldrich | H3393-100KU |
| Triton X 100 | Sigma-aldrich | 93443-100ML |
| TWEEN 20 | Sigma-aldrich | 3005 |
| Glycine | Sigma-aldrich | G7126-100G |
| D-Fructose | Sigma-aldrich | F0127-1KG |
| α-Thioglycerol | Sigma-aldrich | M1753-100ML |
| Experimental models: Organisms/strains | ||
| VIP-IRES-Cre x C57Bl/6N | Jackson Laboratory Stock Charles River |
010908 C57BL/6NCrl |
| VIP-Cre x Ai162 (GCaMP6s) | Jackson Laboratory Stock | 010908, 031562 |
| VIP-Cre x Ai140 (GFP) | Jackson Laboratory Stock | 010908, 30220 |
| Oligonucleotides | ||
| mRNA probes | Molecular Technologies (non-profit, Caltech) | See Table S3 |
| Software and algorithms | ||
| Adobe Illustrator, 24.0.2 (64-bit) | Adobe | https://www.adobe.com/products/illustrator.html |
| Synapse | Tucker-Davis Technologies (TDT) | Synapse Software - Tucker-Davis Technologies (tdt.com) |
| IDAS and IDPS | Inscopix Inc. | https://www.inscopix.com/ |
| DORIC NEUROSCIENCE STUDIO | Doric Lenses | Home – Doric Lenses Inc. |
| Matlab R2020b, R2018a | MathWorks Inc. | https://www.mathworks.com/products/matlab.html |
| Imaris 9.2.0 and 10.0.1 | Oxford Instruments | https://imaris.oxinst.com/ |
| Zen (LSM 880, 2.3 lite) | Zeiss Microscopy | https://www.zeiss.com |
| BioRender | BioRender | https://biorender.com/ |
| Spectrometer UBS2000+ | Ocean Insight | https://www.oceaninsight.com/ |
| Python 3.6.2, version 1.21.1 | https://www.python.org/downloads/release/python-362/ | |
| Custom code to analyze and generate figures | This paper | https://doi.org/10.5072/zenodo.1234595 |
| Other | ||
| Optical fiber, 400 μm diameter, 7 mm long | Doric Lenses | MFC_400/430-0.48_7mm_ZF1.25_FLT |
| Mono Fiberoptic Patch cable | Doric Lenses | MFC_400/430_0.48_2m_FC_ZF1.25_FL |
| GRIN lens, 500 μm diameter, 8.4 mm long | Inscopix | 1050-004600 |
| Custom ferrule for holding GRIN lens | Kientec Systems | FZI-LC-L2.5-520 |
| Opn4 antagonist | Millipore Sigma | 509267 |
Resource availability
Lead contact
Further information and requests for resources and reagents should be directed to and will be fulfilled by the lead contact, Anat Kahan (anat.kahan@mail.huji.ac.il).
Materials availability
All sequences of RNA probes used in this study are provided in Table S3. Reagents can be provided as listed in the key resources table.
Experimental model and study participant details
Animal husbandry and experimental procedures involving animal subjects were conducted in compliance with the Guide for the Care and Use of Laboratory Animals of the National Institutes of Health and approved by the Institutional Animal Care and Use Committee (IACUC) and by the Office of Laboratory Animal Resources at California Institute of Technology under IACUC protocol 1739.
Mice
Mice used in this work include VIP-IRES-Cre (Jackson Laboratory Stock, JAX, 010908), crossed to C57BL/6N (Charles River, C57BL/6NCrl), VIP-IRES-Cre crossed to Ai162 (GCaMP6s reporter line, JAX, 031562), and VIP-IRES-Cre crossed to Ai140 (GFP reporter line, JAX, 30220). For the VIP x GCaMP6s cross, a doxycycline diet was used to suppress GCaMP expression, starting with the breeding pair, until two to four weeks before surgery. Animals were group-housed (two to four per group) for SCNVIP FP experiments or singly housed for one-photon experiments in a vivarium, on a 12-hour light/dark cycle with ad libitum access to food and water. Mice were excluded from the entire experiment if there was no dynamic photometry signal or no one-photon signal three or six weeks after surgery, respectively. For FP, we used males and females, aged three to four months at the time of the first surgery, and used up to an age of ten month old. For monosynaptic tracing, we used males and females, two to three months at the time of the first surgery.
Method details
Surgery
Optical fiber and GRIN lens implants were made in mice anesthetized with isoflurane (5% induction, 1–1.5% maintenance) and placed in a stereotaxic frame (942, David Kopf Instruments, CA, USA). An incision was made to expose the skull, including bregma, lambda, and the target sites. Stereotaxic coordinates were measured from bregma and were based on The Mouse Brain Atlas.59,60 A craniotomy hole was drilled above the target. Two optical fibers with a cut length of 7 mm and diameter of 400 μm (MFC_400/430-0.48_7mm_ZF1.25_FLT ,NA=0.48, Doric lenses, Quebec, QC, Canada) or two GRIN lenses, 8.4 mm long, 500 μm diameter (1050-004600 Inscopix, Inc) were used. To firmly mount the GRIN lens to a stereotaxic holder (SCH_1.25, Doric Lenses), a custom-made ferrule (2.5mm long, FZI-LC-L2.5-520, Kientec Systems) was glued to the GRIN lens with a small drop of superglue. Two fibers were implanted to improve the probability of successful targeting of the SCN. The optical fibers were inserted (AP: -0.22/0.26 for females, -0.26/0.32 for males, ML 1.19, DV -5.6 μm from brain surface, at 13 degrees). A thin layer of Metabond (Parkell, C&B Metabond) was applied to the skull surface to secure the fibers. In addition, a thick layer of black dental cement (JET denture repair powder and liquid) was applied to secure the fiber implant for FP recording. The neuronal responses were measured from the fiber side, which had the most significant signal.
Viral monosynaptic tracing was performed similarly to optical fiber implants. Instead of an optical fiber implant, an AAV1-synP-FLEX-splitTVA-EGFP-B19G virus (2.4E13VG/ml, 2 X 300 nl each side, at AP 0.23 ML 1.19 DV -5.75 and 5.55 μm from brain surface, at 13 degrees) was injected at a rate of ∼80 nl/min using a blunt 33-gauge microinjection needle in a 10 μl microsyringe (NanoFil, World Precision Instruments, WPI) by an UltraMicroPump (UMP3-4, WPI), controlled by a pump controller (Micro4, WPI). Three weeks after AAV1 injection, EnvA G-Deleted Rabies-mCherry virus was injected to the same location (1E9 TU/ml, 50-100 nl total). Mice were sacrificed a week after EnvA virus injection.
All mice were given 1 mg/kg sustained-release buprenorphine and 5 mg/kg ketoprofen s.c. intraoperatively and received 30 mg/kg ibuprofen in their home cage water for at least five days postoperatively for pain. Mice were allowed a minimum of 14 days for surgical recovery before participation in behavioral studies.
Fiber photometry recording
FP is a method for measuring population calcium-dependent fluorescence from genetically defined cell types in deep brain structures using a single optical fiber for excitation and emission in freely moving mice. A detailed description of the system can be found elsewhere.32 Briefly, our system employed a 490 nm LED for fluorophore excitation (M490F1, Thorlabs; filtered with FF02-472/30-25, Semrock) and a 405 nm LED for isosbestic excitation (M405F1, Thorlabs; filtered with FF01-400/40-25, Semrock), which were modulated at 211 Hz and 531 Hz, respectively. Two systems were used for recording, both controlled by a real-time processor (System 1: RX8-2; System 2: RZ5P, operated with Synapse software, Tucker-Davis Technologies, TDT), and delivered to the implanted optical fiber via a 0.48 NA, 400 μm diameter mono-fiber optic patch cable (MFP_400/430/LWMJ-0.48_2m_FC-ZF1.25, Doric Lenses). The emission signal from isosbestic excitation, which has previously been shown to be calcium-independent for GCaMP sensors,61,62 was used as a reference signal to account for motion artifacts and photo-bleaching. Emitted light was collected via the patch cable, collimated, filtered after passing through a focusing lens (System 1: MF525-39 filter, Thorlabs, 62–561 focusing lens, Edmunds Optics; System 2: Mini Cube FMC6, Doric Lenses), and detected by a femtowatt photoreceiver (Model 2151, Newport). Photoreceiver signals were demodulated into GCaMP and control (isosbestic) signals, digitized (sampling rates: System 1: 382 Hz; System 2: 6 Hz), and low-pass filtered at 25 Hz using a second-order Butterworth filter with zero phase distortion. A least-squares linear fit was applied to align the 405 nm signal with the 490 nm signal. Then, the fitted 405 nm signal was subtracted from the 490 nm channel and then divided by the fitted 405 nm signal to calculate dF/F values.
Single-cell imaging
Single-cell imaging was performed using nVista 3.0 (Inscopix, Inc.), at 10 or 20 Hz. LED intensity and gain were determined for each mouse individually, based on cell visibility under white light.
Behavioral assays
FP Light-exposure experiments
Mice were kept in their home cage and, at the beginning of the dark phase (ZT15±1.5), were exposed to 15 seconds of ambient white room light six times, with 30 seconds of dark separating each exposure. For light detection, a light sensor based on a GL5528 photoresistor was built with an Arduino Uno.63 TTL pulses were sent to a TDT processor when resistance was low, indicating dark (the exact value was defined by the light conditions in the specific behavioral room and by the sensor). From the TTL input, the exact timings of the light exposures were extracted and averaged.
A spectral light source (SPECTRAX light engine, Lumencore Inc.) was used to introduce different wavelengths, with the following filters (width in parentheses): 395nm (23), 438 nm (24), 473 nm (10), 513 nm (17), 560 nm (25), 586 nm (20) and 650 nm (13). Each color was introduced for 15 seconds, with 30 seconds of dark separating each exposure, using an optical cord above the cage. The light engine was controlled with an eight-channel pulse generator (OTPG_8, Doric Lences Inc., operated with Doric Neuroscience Studio software). During the recording session, each color was introduced six times, randomly ordered. Light intensities ranged from 47.4 to 78 mW, with an equal number of photons (1.55E15 photons/cm2/sec, at the fiber tip, 3.4±1E14 photons /cm2/sec at the cage bottom, see Table S1). The light optical cord tip was placed 12 inches above the cage bottom. In this experiment, mice were placed in a rat cage, with a cylinder placed in the middle (10-inch diameter), to ensure even distribution of light in the mouse-accessible area. Six mice were tested, two males and four females.
Light intensities were measured in ‘lux’ units with the Light Meter smartphone app (‘My mobile Tools Dev’). Light flux units (photons/cm2/sec) were extracted with a Thorlabs S120C photodiode Power Sensor, which measures mW. The energy units were divided by the sensor dimensions, 0.94 cm2. Unit conversion from mW/cm2 to photons/cm2/sec was done using: , where is the Planck constant, c is the speed of light, and is the light wavelength. For example, white and red light intensities measured on the floor where the cages were located were ∼150 and ∼30 lux, respectively, corresponding to 4.49E14 and 2.53E13 photons/cm2/sec, respectively.
After the control response to light was taken, either using FP or at single-cell resolution (for blue and/or red light), an Opn4 antagonist, AA92593, was injected (i.p.) 30 mg/kg in DMSO, using a volume of up to 10 mg/kg. For FP control, at least two days after, the experiment was repeated with DMSO only, to exclude responses to DMSO.
Tissue collection and processing
Unless indicated otherwise, tissue was collected for processing at ZT10±1 h.
Light-guided sectioning (LiGS) tissue preparation
Tissue processing was done using LiGS 3D histology.31 After perfusion (20 ml 1× PBS followed by 20 ml 4% PFA), the implant was kept intact; the skin was gently removed without holding the implant, and the lower jaw was cut off. The remaining skull, including both brain and implant, was placed in 4% PFA for two days and washed in PBS. For cryo-protection, samples were then placed in 15% and 30% sucrose solutions, consecutively. For coupling, samples were placed in disposable embedding molds (22×22 mm, 70182, EMS) with OCT (Tissue-Tek Compound, Sakura Finetek) and were frozen in an ethanol/dry-ice bath (−78°C). Brains were maintained in an upright orientation such that the outer surface of the optical device faced upwards, unless the implant was angled. In those cases, the brain was positioned such that the optical implant was perpendicular to the cube during freezing. It is important to ensure that OCT does not cover the outer side of the optical fiber. If it does, the OCT can be removed gently with a razor. A 5-mm LED (Chanzon, yellow) was placed directly above the optical device and secured with additional OCT. To give the brain–OCT cube a flat surface, a larger embedding mold (22×40 mm, 70184, EMS) was filled with OCT while the brain (and coupled LED) was placed upside down. This created a large, stable OCT cube that included the sample and the coupled LED. The sample was then cut on one side to expose the LED wires and stored at −80°C until further processed.
LiGS cryo-sectioning
Brains in OCT were placed in a cryostat and sliced from the bottom in 50–100μm steps with the LED turned on. To ensure a repeatable light intensity, we used a power supply (DG1022, RIGOL) set to 2.1 V. We used the profile of the light spread to define the sectioning end-point. We used manual observation of the tissue: after the scattered light becomes sharp, sectioning continues in small steps (20–50 μm) until a shaded area is seen in the fiber location when the LED is turned off. After sectioning, samples were left at room temperature (RT), allowing the OCT to melt gradually. Then, samples were gently placed in a tube and washed with 1× PBS solution.
LiGS staining and clearing
LiGS IHC
After sectioning, brains were put in 4% PFA for one to three hours for additional fixation and washed with 1 × PBS solution. The staining protocol was adapted from the iDisco protocol,64 without the pretreatment step. Briefly, the samples were incubated for two days at 37°C in Permeabilization solution, followed by two days in Blocking solution at 37°C. Next, the sample was incubated with primary antibody at 1:200 dilution for 5–7 days in PTwH/5%DMSO/3%donkey serum at 37°C. After washing at room temperature (RT) until the next day, samples were incubated in secondary antibody in PTwH/3% donkey serum at 37°C for 5–7 days. Lastly, samples were washed with PTwH at RT until the next day.
Clearing
After staining, samples were cleared using the SeeDB clearing method,65 using an increased gradient of fructose solution (4% to 100%), followed by SeeBD final solution, all added with 0.5% α-thioglycerol.
Sample mounting
We used iSpacer (0.5, 1.0, 3.0, 7.0 mm, IS011, IS013, IS014, SunJin lab), combining different heights to contain the sample in full. A 22×30 glass microscope coverslip (16004-344, VWR) was first placed on one side. The flat side of the sliced brain was placed on the coverslip from the inside of the iSpacer block, and the rest of the block filled with SeeBD solution. 1 ml pipette tips were cut into ∼1 cm pieces to stabilize the sample in the iSpacer block. Finally, a second 22×30 glass microscope coverslip was placed on the other side. This approach allows imaging with an air objective from both sides, if needed.
Monosynaptic tracing tissue preparation
Mice were deeply anesthetized one week after rabies injection and perfused with phosphate-buffered saline (PBS) followed by 4% paraformaldehyde (PFA). Eyecups and brains were removed. Retinas were isolated and fixed overnight (15 minutes with 4% PFA, followed by 1×PBS wash). The retina was placed on filter paper (Whatman, Cytiva 1004055) and flattened by drying, wetting, and making four relaxing cuts for the whole mounting, then placed on a nitrocellulose membrane (Millipore Sigma, HABG04700). On a shaker, the retinas were incubated with primary antibodies in 5% normal donkey serum, 0.5% Triton X-100, in 1×PBS solution for 3-4 days at 4°C. Primary antibodies used were anti-Brn-3c (mouse), anti-mCherry (chicken), and anti-Opn4 (rabbit) (all at 1:250). Next, retinas were washed (1×PBS three times x 1 hour) and incubated with secondary antibodies overnight at 4°C on a shaker. Secondary antibodies used were donkey anti-chicken 594 nm, donkey anti-mouse 488 nm, and donkey anti-rabbit 647nm (all 1:250). The secondary solution was filtered three times with a 0.22μl filter (Millex-GP, Millipore Sigma, SLGP033RS). Finally, the retina was washed for 1 hr 3 times at 4°C shaking with PBS, flattened on a slide, thoroughly dried, covered with mounting solution, covered-slipped and imaged. n=4 (2 females, 2 males) control, n=4 (2 females, 2 males) experimental. Mice were excluded if there was no expression of the viruses in the SCN.
mRNA detection
mRNA detection was performed by Jang, M. J et al.66 After perfusion and fixation with 4% PFA in 1× RNase-free PBS, brain tissue was washed 3 times with 1× PBS and sliced with 100 μm thickness using a vibratome. Tissue was pre-hybridized in hybridization buffer at 37°C for 1 hour (see recipe for hybridization buffer below).
Hybridization buffer recipe
| Final conc. | Amount (in 50 ml) | |
|---|---|---|
| Dextran sulfate | 10% (w/v) | 5 g |
| Formamide | 10% (v/v) | 5 ml |
| SSC | 2x | 5 ml (20x stock) |
| Ultrapure H2O | Up to 50 ml |
After one hour incubation, hybridization buffer was supplemented with oligos/probes for vip transcripts, added at 2nM each (see probes list at the end of this section). Brain tissue was incubated overnight at 37°C in this hybridization buffer with probes. The next day, brain tissue was stringently washed two times for 30 minutes each at 37°C with wash buffer (see recipe below).
Wash buffer recipe
| Final conc. | Amount (in 50 ml) | |
|---|---|---|
| Formamide | 30% (v/v) | 15 ml |
| SSC | 2x | 5 ml (20x stock) |
| Ultrapure H2O | Up to 50 ml |
Next, the tissue was incubated in amplification buffer at room temperature for 1 h (see recipe below).
| Amplification buffer recipe: | Final conc. | Amount (in 50 ml) |
|---|---|---|
| Formamide | 10% (v/v) | 5 ml |
| SSC | 2x | 5 ml (20x stock) |
| Ultrapure H2O | Up to 50 ml |
During this incubation, fluorescent hairpins were snap-cooled by heating each hairpin (HP) at 95°C for 90 seconds and allowing to cool in the dark for ∼30 minutes. Next, amplification buffer was added to each hairpin to 60 nM. Brain tissue was incubated at room temperature overnight in this amplification buffer with hairpins. The next day, the tissue was washed two times, 30 minutes each, with SSC buffer supplemented with 0.1 μg/ml DAPI. Next, the tissue was mounted on glass slides with ProLong Diamond Antifade and imaged.
VIP probes
Gene ID: 22353; https://www.ncbi.nlm.nih.gov/gene/22353. 546 nm HP (HP ID: 4). See Table S3 for probes sequences.
Immunofluorescence imaging
Immunofluorescence images were obtained with a Zeiss 880 confocal microscope. Images were analyzed in ImageJ, Matlab, and/or Imaris (Bitplane 9.8.0 or 10.0.1). Cell identification in the retina was performed with the “Spots” function in Imaris (9.8.0), with a diameter of 15 μm, for each channel separately. In addition, the “Statistics” toolbox of Imaris was used to identify overlapping populations (<15 μm).
For LiGS, imaging was performed with a Zeiss 880 confocal microscope, z-stacks with 3.3 μm steps were taken, and analyzed with a custom written Matlab script to find the distance between the optical fiber tip and the center of the SCNVIP cell population.
Quantification and statistical analysis
Fiber photometry
dF/F was first aligned using the 405 nm channel, as described before.3,67 Where z-scored data is presented, we used: (where ‘mad’ is the median absolute deviation, and is the background signal, before the light exposure). Z-score was not used when amplitude was compared. The peak area was calculated by integrating dF/F from 4 seconds after light-on, for 10 seconds (for 15 second light exposure recording), or from light-on to light-off (for 10 minute light exposure recording) and subtracting the dark baseline activity (10 seconds or 5 minutes, respectively). The event rate was calculated using the peak finder algorithm (“findpeaks” using “Annotate,” Matlab), with a threshold of one standard deviation above the mean value in the baseline period.
To quantify the response intensity vs. the distance between the target (SCN) and the fiber tip (Figure S2), we first defined the response intensity as the width x prominence (“findpeaks”, Matlab, as above). Then, to define the distance between the fiber tip and the SCN, we manually defined the coordinates of the fiber tip and the maximal intensity of the closest SCN, and calculated the vector length. Lastly, we applied an exponential decay fit, based on a simplification of the fiber collection model.33
To quantify response profile differences, we calculated correlation coefficients (CCs) to compare the overall response shape and, more specifically, calculated the rise time (time from the beginning of the light exposure to the peak response), decay constant (based on exponential fit to the GCaMP signal over 10 seconds after the light is turned off), and peak intensity.
Matlab’s “boxplot” presentation was used to visualize summary statistics. The line in the middle of each box is the sample median. The bottom and top of each box are the 25th and 75th percentiles of the sample, respectively.
Single-cell imaging
Data was analyzed using IDP (Inscopix Inc). Videos were taken at 20 or 10Hz and were first reduced to 5 Hz, followed by special filtering (default), motion correction, dF/F calculation, and manual cell identification. Single-cell traces were exported as .csv files and further analyzed with Matlab and Python as follows:
Matlab analysis included identification of time to peak, exponential decay fits, AUC, peaks ratio at 5 seconds vs. 15 seconds after light exposure onset, max amplitude and peak analysis, such as width and amplitude. These parameters were calculated for each light exposure separately, followed by averaging the six repeats, except ΔP1-2 and ΔP2-3, which are based on individual peak comparisons (identified using ‘max’ function in Matlab).
K-means clustering of calcium transients
We used an unsupervised approach to classify the dF/F calcium traces to assess differences in underlying neuronal responses to light. We first used principal component analysis for dimensionality reduction using the PCA implementation from Python’s sklearn package (sklearn.decomposition.PCA). Based on the PCA plot, we used the first 12 principal components as these captured the greatest amount of variance in the data. We next used a k-means clustering approach to group the resulting features into n groups over 200 iterations of the algorithm to minimize distortion, n being the number of clusters defined for the analysis. For the k-means clustering, we employed Python’s scipy package, and initialized the algorithm by randomly selecting points in the data. We also used a Gaussian mixture model on the same 12 principal components to group the traces into 3 clusters. For Gaussian mixture modeling, we used Python’s scikit-learn package.
Acknowledgments
We thank the Gradinaru Lab for helpful discussions; Dr. Yu Li Ni, Dr. Zeynep Turan, and Martin Tran for their technical assistance with retinal extraction and processing; Dr. Corinne Beier and Prof. Erik Herzog for the helpful discussions; and Prof. Andrew Steele, Prof. Daniel Wagenaar, Ariane Helou and Catherine Oikonomou for the helpful discussions and manuscript review. Figures created with BioRender.com. This work was funded by the Heritage Medical Research Institute, the Vallee Foundation and the Center for Molecular and Cellular Neuroscience in the Tianqiao and Chrissy Chen Institute for Neuroscience at Caltech (to V.G.). A.K. is supported by a Caltech Division of Biology and Biological Engineering postdoctoral fellowship. P.K. is supported by the Swiss National Science Foundation, grants P2EZP3_181896 and P500PB_203063.
Author contributions
Conceptualization, A.K. and V.G.; Methodology, A.K., Software, A.K., A.W., and P.K.; Investigation, A.K., K.M., and S.D.; Writing – Original Draft, A.K.; Writing – Review and Editing, A.K., K.M., S.D., and V.G.; Visualization A.K.; Funding Acquisition, V.G.; Supervision, A.K. and V.G.
Declaration of interests
The authors declare no competing interests.
Inclusion and diversity
We support inclusive, diverse, and equitable conduct of research.
Published: September 9, 2023
Footnotes
Supplemental information can be found online at https://doi.org/10.1016/j.isci.2023.107865.
Contributor Information
Anat Kahan, Email: anat.kahan@mail.huji.ac.il.
Viviana Gradinaru, Email: viviana@caltech.edu.
Supplemental information
Data and code availability
-
•
Microscopy, FP and single-cell data reported in this paper will be shared by the lead contact upon request.
-
•
All original code has been deposited at GitHub and is publicly available as of the date of publication. DOIs are listed in the key resources table.
-
•
Any additional information required to reanalyze the data reported in this paper is available from the lead contact upon request.
References
- 1.Vosko A., van Diepen H.C., Kuljis D., Chiu A.M., Heyer D., Terra H., Carpenter E., Michel S., Meijer J.H., Colwell C.S. Role of vasoactive intestinal peptide in the light input to the circadian system. Eur. J. Neurosci. 2015;42:1839–1848. doi: 10.1111/ejn.12919. [DOI] [PMC free article] [PubMed] [Google Scholar]
- 2.Kuhlman S.J., Silver R., Le Sauter J., Bult-Ito A., McMahon D.G. Phase Resetting Light Pulses Induce Per1 and Persistent Spike Activity in a Subpopulation of Biological Clock Neurons. J. Neurosci. 2003;23:1441–1450. doi: 10.1523/jneurosci.23-04-01441.2003. [DOI] [PMC free article] [PubMed] [Google Scholar]
- 3.Kahan A., Coughlin G.M., Borsos M., Brunton B.W., Gradinaru V. Dysregulated mammalian estrus cycle rescued by timed activation of VIP neurons in the circadian pacemaker and late afternoon light exposure. bioRxiv. 2023 doi: 10.1101/2023.01.14.524075. 2023.2001.2014.524075. [DOI] [Google Scholar]
- 4.Jones J.R., Simon T., Lones L., Herzog E.D. SCN VIP neurons are essential for normal light-mediated resetting of the circadian system. J. Neurosci. 2018;38:7986–7995. doi: 10.1523/jneurosci.1322-18.2018. [DOI] [PMC free article] [PubMed] [Google Scholar]
- 5.Romijn H.J., Sluiter A.A., Pool C.W., Wortel J., Buijs R.M. Differences in colocalization between Fos and PHI, GRP, VIP and VP in neurons of the rat suprachiasmatic nucleus after a light stimulus during the phase delay versus the phase advance period of the night. J. Comp. Neurol. 1996;372:1–8. doi: 10.1002/(SICI)1096-9861(19960812)372:1<1::AID-CNE1>3.0.CO;2-7. [DOI] [PubMed] [Google Scholar]
- 6.Todd W.D., Venner A., Anaclet C., Broadhurst R.Y., De Luca R., Bandaru S.S., Issokson L., Hablitz L.M., Cravetchi O., Arrigoni E., et al. Suprachiasmatic VIP neurons are required for normal circadian rhythmicity and comprised of molecularly distinct subpopulations. Nat. Commun. 2020;11:4410. doi: 10.1038/s41467-020-17197-2. [DOI] [PMC free article] [PubMed] [Google Scholar]
- 7.Wen S., Ma D., Zhao M., Xie L., Wu Q., Gou L., Zhu C., Fan Y., Wang H., Yan J. Spatiotemporal single-cell analysis of gene expression in the mouse suprachiasmatic nucleus. Nat. Neurosci. 2020;23:456–467. doi: 10.1038/s41593-020-0586-x. [DOI] [PubMed] [Google Scholar]
- 8.Mazuski C., Abel J.H., Chen S.P., Hermanstyne T.O., Jones J.R., Simon T., Doyle F.J., III, Herzog E.D. Entrainment of Circadian Rhythms Depends on Firing Rates and Neuropeptide Release of VIP SCN Neurons. Neuron. 2018;99:555–563.e5. doi: 10.1016/j.neuron.2018.06.029. [DOI] [PMC free article] [PubMed] [Google Scholar]
- 9.Kwon J., Jang M.W., Lee C.J. Retina-attached slice recording reveals light-triggered tonic GABA signaling in suprachiasmatic nucleus. Mol. Brain. 2021;14:171. doi: 10.1186/s13041-021-00881-9. [DOI] [PMC free article] [PubMed] [Google Scholar]
- 10.Chalupa, L.M., and Williams, R.W. (2008). Eye, retina, and visual system of the mouse.
- 11.Provencio I., Warthen D.M. Melanopsin, the photopigment of intrinsically photosensitive retinal ganglion cells. WIREs. Membr. Transp. Signal. 2012;1:228–237. doi: 10.1002/wmts.29. [DOI] [Google Scholar]
- 12.Panda S., Sato T.K., Castrucci A.M., Rollag M.D., DeGrip W.J., Hogenesch J.B., Provencio I., Kay S.A. Melanopsin (Opn4) Requirement for Normal Light-Induced Circadian Phase Shifting. Science. 2002;298:2213–2216. doi: 10.1126/science.1076848. [DOI] [PubMed] [Google Scholar]
- 13.Panda S., Provencio I., Tu D.C., Pires S.S., Rollag M.D., Castrucci A.M., Pletcher M.T., Sato T.K., Wiltshire T., Andahazy M., et al. Melanopsin Is Required for Non-Image-Forming Photic Responses in Blind Mice. Science. 2003;301:525–527. doi: 10.1126/science.1086179. [DOI] [PubMed] [Google Scholar]
- 14.Lucas R.J., Peirson S.N., Berson D.M., Brown T.M., Cooper H.M., Czeisler C.A., Figueiro M.G., Gamlin P.D., Lockley S.W., O’Hagan J.B., et al. Measuring and using light in the melanopsin age. Trends Neurosci. 2014;37:1–9. doi: 10.1016/j.tins.2013.10.004. [DOI] [PMC free article] [PubMed] [Google Scholar]
- 15.Fernandez D.C., Chang Y.-T., Hattar S., Chen S.-K. Architecture of retinal projections to the central circadian pacemaker. Proc. Natl. Acad. Sci. USA. 2016;113:6047–6052. doi: 10.1073/pnas.1523629113. [DOI] [PMC free article] [PubMed] [Google Scholar]
- 16.Newman L.A., Walker M.T., Brown R.L., Cronin T.W., Robinson P.R. Melanopsin Forms a Functional Short-Wavelength Photopigment. Biochemistry. 2003;42:12734–12738. doi: 10.1021/bi035418z. [DOI] [PubMed] [Google Scholar]
- 17.Berson D.M., Dunn F.A., Takao M. Phototransduction by Retinal Ganglion Cells That Set the Circadian Clock. Science. 2002;295:1070–1073. doi: 10.1126/science.1067262. [DOI] [PubMed] [Google Scholar]
- 18.Lupi D., Oster H., Thompson S., Foster R.G. The acute light-induction of sleep is mediated by OPN4-based photoreception. Nat. Neurosci. 2008;11:1068–1073. doi: 10.1038/nn.2179. [DOI] [PubMed] [Google Scholar]
- 19.Altimus C.M., Güler A.D., Villa K.L., McNeill D.S., LeGates T.A., Hattar S. Rods-cones and melanopsin detect light and dark to modulate sleep independent of image formation. Proc. Natl. Acad. Sci. USA. 2008;105:19998–20003. doi: 10.1073/pnas.0808312105. [DOI] [PMC free article] [PubMed] [Google Scholar]
- 20.Tsai J.W., Hannibal J., Hagiwara G., Colas D., Ruppert E., Ruby N.F., Heller H.C., Franken P., Bourgin P. Melanopsin as a Sleep Modulator: Circadian Gating of the Direct Effects of Light on Sleep and Altered Sleep Homeostasis in Opn4−/− Mice. PLoS Biol. 2009;7 doi: 10.1371/journal.pbio.1000125. [DOI] [PMC free article] [PubMed] [Google Scholar]
- 21.Hattar S., Liao H.-W., Takao M., Berson D.M., Yau K.-W. Melanopsin-Containing Retinal Ganglion Cells: Architecture, Projections, and Intrinsic Photosensitivity. Science. 2002;295:1065–1070. doi: 10.1126/science.1069609. [DOI] [PMC free article] [PubMed] [Google Scholar]
- 22.Güler A.D., Ecker J.L., Lall G.S., Haq S., Altimus C.M., Liao H.-W., Barnard A.R., Cahill H., Badea T.C., Zhao H., et al. Melanopsin cells are the principal conduits for rod–cone input to non-image-forming vision. Nature. 2008;453:102–105. doi: 10.1038/nature06829. [DOI] [PMC free article] [PubMed] [Google Scholar]
- 23.Zhang Z., Wang H.-J., Wang D.-R., Qu W.-M., Huang Z.-L. Red light at intensities above 10 lx alters sleep–wake behavior in mice. Light Sci. Appl. 2017;6:e16231. doi: 10.1038/lsa.2016.231. [DOI] [PMC free article] [PubMed] [Google Scholar]
- 24.Niklaus S., Albertini S., Schnitzer T.K., Denk N. Challenging a Myth and Misconception: Red-Light Vision in Rats. Animals. 2020;10:422. doi: 10.3390/ani10030422. [DOI] [PMC free article] [PubMed] [Google Scholar]
- 25.Alves-Simoes M., Coleman G., Canal M.M. Effects of type of light on mouse circadian behaviour and stress levels. Lab. Anim. 2016;50:21–29. doi: 10.1177/0023677215588052. [DOI] [PubMed] [Google Scholar]
- 26.Dobb R., Martial F., Elijah D., Storchi R., Brown T.M., Lucas R.J. The impact of temporal modulations in irradiance under light adapted conditions on the mouse suprachiasmatic nuclei (SCN) Sci. Rep. 2017;7 doi: 10.1038/s41598-017-11184-2. [DOI] [PMC free article] [PubMed] [Google Scholar]
- 27.Gladanac B., Jonkman J., Shapiro C.M., Brown T.J., Ralph M.R., Casper R.F., Rahman S.A. Removing Short Wavelengths From Polychromatic White Light Attenuates Circadian Phase Resetting in Rats. Front. Neurosci. 2019;13:954. doi: 10.3389/fnins.2019.00954. [DOI] [PMC free article] [PubMed] [Google Scholar]
- 28.Pilorz V., Tam S.K.E., Hughes S., Pothecary C.A., Jagannath A., Hankins M.W., Bannerman D.M., Lightman S.L., Vyazovskiy V.V., Nolan P.M., et al. Melanopsin Regulates Both Sleep-Promoting and Arousal-Promoting Responses to Light. PLoS Biol. 2016;14 doi: 10.1371/journal.pbio.1002482. [DOI] [PMC free article] [PubMed] [Google Scholar]
- 29.Bedrosian T.A., Vaughn C.A., Galan A., Daye G., Weil Z.M., Nelson R.J. Nocturnal Light Exposure Impairs Affective Responses in a Wavelength-Dependent Manner. J. Neurosci. 2013;33:13081–13087. doi: 10.1523/jneurosci.5734-12.2013. [DOI] [PMC free article] [PubMed] [Google Scholar]
- 30.van Diepen H.C., Schoonderwoerd R.A., Ramkisoensing A., Janse J.A.M., Hattar S., Meijer J.H. Distinct contribution of cone photoreceptor subtypes to the mammalian biological clock. Proc. Natl. Acad. Sci. USA. 2021;118 doi: 10.1073/pnas.2024500118. [DOI] [PMC free article] [PubMed] [Google Scholar]
- 31.Kahan A., Greenbaum A., Jang M.J., Robinson J.E., Cho J.R., Chen X., Kassraian P., Wagenaar D.A., Gradinaru V. Light-guided sectioning for precise in situ localization and tissue interface analysis for brain-implanted optical fibers and GRIN lenses. Cell Rep. 2021;36:109744. doi: 10.1016/j.celrep.2021.109744. [DOI] [PMC free article] [PubMed] [Google Scholar]
- 32.Cho J.R., Treweek J.B., Robinson J.E., Xiao C., Bremner L.R., Greenbaum A., Gradinaru V. Dorsal Raphe Dopamine Neurons Modulate Arousal and Promote Wakefulness by Salient Stimuli. Neuron. 2017;94:1205–1219.e8. doi: 10.1016/j.neuron.2017.05.020. [DOI] [PubMed] [Google Scholar]
- 33.Yona G., Meitav N., Kahn I., Shoham S. Realistic Numerical and Analytical Modeling of Light Scattering in Brain Tissue for Optogenetic Applications. eneuro. 2016;3 doi: 10.1523/eneuro.0059-15.2015. ENEURO.0059-0015.2015. [DOI] [PMC free article] [PubMed] [Google Scholar]
- 34.Qiu X., Kumbalasiri T., Carlson S.M., Wong K.Y., Krishna V., Provencio I., Berson D.M. Induction of photosensitivity by heterologous expression of melanopsin. Nature. 2005;433:745–749. doi: 10.1038/nature03345. [DOI] [PubMed] [Google Scholar]
- 35.Sun H., Macke J.P., Nathans J. Mechanisms of spectral tuning in the mouse green cone pigment. Proc. Natl. Acad. Sci. USA. 1997;94:8860–8865. doi: 10.1073/pnas.94.16.8860. [DOI] [PMC free article] [PubMed] [Google Scholar]
- 36.Imai H., Kefalov V., Sakurai K., Chisaka O., Ueda Y., Onishi A., Morizumi T., Fu Y., Ichikawa K., Nakatani K., et al. Molecular Properties of Rhodopsin and Rod Function. J. Biol. Chem. 2007;282:6677–6684. doi: 10.1074/jbc.M610086200. [DOI] [PMC free article] [PubMed] [Google Scholar]
- 37.Drouyer E., Rieux C., Hut R.A., Cooper H.M. Responses of Suprachiasmatic Nucleus Neurons to Light and Dark Adaptation: Relative Contributions of Melanopsin and Rod–Cone Inputs. J. Neurosci. 2007;27:9623–9631. doi: 10.1523/jneurosci.1391-07.2007. [DOI] [PMC free article] [PubMed] [Google Scholar]
- 38.Franke K., Maia Chagas A., Zhao Z., Zimmermann M.J., Bartel P., Qiu Y., Szatko K.P., Baden T., Euler T. An arbitrary-spectrum spatial visual stimulator for vision research. Elife. 2019;8 doi: 10.7554/eLife.48779. [DOI] [PMC free article] [PubMed] [Google Scholar]
- 39.Walmsley L., Hanna L., Mouland J., Martial F., West A., Smedley A.R., Bechtold D.A., Webb A.R., Lucas R.J., Brown T.M. Colour As a Signal for Entraining the Mammalian Circadian Clock. PLoS Biol. 2015;13 doi: 10.1371/journal.pbio.1002127. [DOI] [PMC free article] [PubMed] [Google Scholar]
- 40.Jones K.A., Hatori M., Mure L.S., Bramley J.R., Artymyshyn R., Hong S.P., Marzabadi M., Zhong H., Sprouse J., Zhu Q., et al. Small-molecule antagonists of melanopsin-mediated phototransduction. Nat. Chem. Biol. 2013;9:630–635. doi: 10.1038/nchembio.1333. [DOI] [PMC free article] [PubMed] [Google Scholar]
- 41.Ziv Y., Burns L.D., Cocker E.D., Hamel E.O., Ghosh K.K., Kitch L.J., El Gamal A., Schnitzer M.J. Long-term dynamics of CA1 hippocampal place codes. Nat. Neurosci. 2013;16:264–266. doi: 10.1038/nn.3329. [DOI] [PMC free article] [PubMed] [Google Scholar]
- 42.Aranda M.L., Schmidt T.M. Diversity of intrinsically photosensitive retinal ganglion cells: circuits and functions. Cell. Mol. Life Sci. 2021;78:889–907. doi: 10.1007/s00018-020-03641-5. [DOI] [PMC free article] [PubMed] [Google Scholar]
- 43.Zhao X., Stafford B.K., Godin A.L., King W.M., Wong K.Y. Photoresponse diversity among the five types of intrinsically photosensitive retinal ganglion cells. J. Physiol. 2014;592:1619–1636. doi: 10.1113/jphysiol.2013.262782. [DOI] [PMC free article] [PubMed] [Google Scholar]
- 44.Beier C., Zhang Z., Yurgel M., Hattar S. Projections of ipRGCs and conventional RGCs to retinorecipient brain nuclei. J. Comp. Neurol. 2021;529:1863–1875. doi: 10.1002/cne.25061. [DOI] [PMC free article] [PubMed] [Google Scholar]
- 45.Bano-Otalora B., Martial F., Harding C., Bechtold D.A., Allen A.E., Brown T.M., Belle M.D.C., Lucas R.J. Bright daytime light enhances circadian amplitude in a diurnal mammal. Proc. Natl. Acad. Sci. USA. 2021;118 doi: 10.1073/pnas.2100094118. [DOI] [PMC free article] [PubMed] [Google Scholar]
- 46.Jagannath A., Hughes S., Abdelgany A., Pothecary C.A., Di Pretoro S., Pires S.S., Vachtsevanos A., Pilorz V., Brown L.A., Hossbach M., et al. Isoforms of Melanopsin Mediate Different Behavioral Responses to Light. Curr. Biol. 2015;25:2430–2434. doi: 10.1016/j.cub.2015.07.071. [DOI] [PMC free article] [PubMed] [Google Scholar]
- 47.Wang Q., Yue W.W.S., Jiang Z., Xue T., Kang S.H., Bergles D.E., Mikoshiba K., Offermanns S., Yau K.-W. Synergistic Signaling by Light and Acetylcholine in Mouse Iris Sphincter Muscle. Curr. Biol. 2017;27:1791–1800.e5. doi: 10.1016/j.cub.2017.05.022. [DOI] [PMC free article] [PubMed] [Google Scholar]
- 48.Lee S.K., Sonoda T., Schmidt T.M. M1 Intrinsically Photosensitive Retinal Ganglion Cells Integrate Rod and Melanopsin Inputs to Signal in Low Light. Cell Rep. 2019;29:3349–3355.e2. doi: 10.1016/j.celrep.2019.11.024. [DOI] [PMC free article] [PubMed] [Google Scholar]
- 49.Tam S.K.E., Brown L.A., Wilson T.S., Tir S., Fisk A.S., Pothecary C.A., van der Vinne V., Foster R.G., Vyazovskiy V.V., Bannerman D.M., et al. Dim light in the evening causes coordinated realignment of circadian rhythms, sleep, and short-term memory. Proc. Natl. Acad. Sci. USA. 2021;118 doi: 10.1073/pnas.2101591118. [DOI] [PMC free article] [PubMed] [Google Scholar]
- 50.Stowie A., Qiao Z., Buonfiglio D.D.C., Beckner D.M., Ehlen J.C., Benveniste M., Davidson A.J. Arginine-vasopressin-expressing neurons in the murine suprachiasmatic nucleus exhibit a circadian rhythm in network coherence in vivo. Proc. Natl. Acad. Sci. USA. 2023;120 doi: 10.1073/pnas.2209329120. [DOI] [PMC free article] [PubMed] [Google Scholar]
- 51.El Cheikh Hussein L., Fontanaud P., Mollard P., Bonnefont X. Nested calcium dynamics support daily cell unity and diversity in the suprachiasmatic nuclei of free-behaving mice. PNAS Nexus. 2022;1:pgac112. doi: 10.1093/pnasnexus/pgac112. [DOI] [PMC free article] [PubMed] [Google Scholar]
- 52.VanderLeest H.T., Houben T., Michel S., Deboer T., Albus H., Vansteensel M.J., Block G.D., Meijer J.H. Seasonal encoding by the circadian pacemaker of the SCN. Curr. Biol. 2007;17:468–473. doi: 10.1016/j.cub.2007.01.048. [DOI] [PubMed] [Google Scholar]
- 53.Gamble K.L., Berry R., Frank S.J., Young M.E. Circadian clock control of endocrine factors. Nat. Rev. Endocrinol. 2014;10:466–475. doi: 10.1038/nrendo.2014.78. [DOI] [PMC free article] [PubMed] [Google Scholar]
- 54.Scheiermann C., Kunisaki Y., Frenette P.S. Circadian control of the immune system. Nat. Rev. Immunol. 2013;13:190–198. doi: 10.1038/nri3386. [DOI] [PMC free article] [PubMed] [Google Scholar]
- 55.Lundkvist G.B., Kwak Y., Davis E.K., Tei H., Block G.D. A calcium flux is required for circadian rhythm generation in mammalian pacemaker neurons. J. Neurosci. 2005;25:7682–7686. doi: 10.1523/jneurosci.2211-05.2005. [DOI] [PMC free article] [PubMed] [Google Scholar]
- 56.Enoki R., Ono D., Kuroda S., Honma S., Honma K.-i. Dual origins of the intracellular circadian calcium rhythm in the suprachiasmatic nucleus. Sci. Rep. 2017;7 doi: 10.1038/srep41733. [DOI] [PMC free article] [PubMed] [Google Scholar]
- 57.Walmsley L., Brown T.M. Eye-specific visual processing in the mouse suprachiasmatic nuclei. J. Physiol. 2015;593:1731–1743. doi: 10.1113/jphysiol.2014.288225. [DOI] [PMC free article] [PubMed] [Google Scholar]
- 58.Hayter E.A., Brown T.M. Additive contributions of melanopsin and both cone types provide broadband sensitivity to mouse pupil control. BMC Biol. 2018;16:83. doi: 10.1186/s12915-018-0552-1. [DOI] [PMC free article] [PubMed] [Google Scholar]
- 59.Cetin A., Komai S., Eliava M., Seeburg P.H., Osten P. Stereotaxic gene delivery in the rodent brain. Nat. Protoc. 2006;1:3166–3173. doi: 10.1038/nprot.2006.450. [DOI] [PubMed] [Google Scholar]
- 60.Paxinos G., Franklin K.B.J. Harvard; 2004. The Mouse Brain in Stereotaxic Coordinates. [Google Scholar]
- 61.Lerner T.N., Shilyansky C., Davidson T.J., Evans K.E., Beier K.T., Zalocusky K.A., Crow A.K., Malenka R.C., Luo L., Tomer R., Deisseroth K. Intact-Brain Analyses Reveal Distinct Information Carried by SNc Dopamine Subcircuits. Cell. 2015;162:635–647. doi: 10.1016/j.cell.2015.07.014. [DOI] [PMC free article] [PubMed] [Google Scholar]
- 62.Kim C.K., Yang S.J., Pichamoorthy N., Young N.P., Kauvar I., Jennings J.H., Lerner T.N., Berndt A., Lee S.Y., Ramakrishnan C., et al. Simultaneous fast measurement of circuit dynamics at multiple sites across the mammalian brain. Nat. Methods. 2016;13:325–328. doi: 10.1038/nmeth.3770. [DOI] [PMC free article] [PubMed] [Google Scholar]
- 63.Gus Arduino Light Sensor using a Photoresistor https://pimylifeup.com/arduino-light-sensor/.
- 64.Renier N., Wu Z., Simon D.J., Yang J., Ariel P., Tessier-Lavigne M. iDISCO: A Simple, Rapid Method to Immunolabel Large Tissue Samples for Volume Imaging. Cell. 2014;159:896–910. doi: 10.1016/j.cell.2014.10.010. [DOI] [PubMed] [Google Scholar]
- 65.Ke M.-T., Fujimoto S., Imai T. SeeDB: a simple and morphology-preserving optical clearing agent for neuronal circuit reconstruction. Nat. Neurosci. 2013;16:1154–1161. doi: 10.1038/nn.3447. [DOI] [PubMed] [Google Scholar]
- 66.Jang, M.J., Coughlin, G.M., Jackson, C.R., Chen, X., Chuapoco, M.R., Vendemiatti, J.L., Wang, A.Z., and Gradinaru, V. (2023). Spatial transcriptomics for profiling the tropism of viral vectors in tissues. Nat. Biotechnol. 41, 1272–1286. 10.1038/s41587-022-01648-w. [DOI] [PMC free article] [PubMed]
- 67.Cho J.R., Chen X., Kahan A., Robinson J.E., Wagenaar D.A., Gradinaru V. Dorsal raphe dopamine neurons signal motivational salience dependent on internal state, expectation, and behavioral context. J. Neurosci. 2021;41:2645–2655. doi: 10.1523/jneurosci.2690-20.2021. JN-RM-2690-2620. [DOI] [PMC free article] [PubMed] [Google Scholar]
Associated Data
This section collects any data citations, data availability statements, or supplementary materials included in this article.
Supplementary Materials
Data Availability Statement
-
•
Microscopy, FP and single-cell data reported in this paper will be shared by the lead contact upon request.
-
•
All original code has been deposited at GitHub and is publicly available as of the date of publication. DOIs are listed in the key resources table.
-
•
Any additional information required to reanalyze the data reported in this paper is available from the lead contact upon request.