

Abstract
Background:
The aim was to analyze changes in normal functional parameters of gait analysis by aging, sex, and body mass index (BMI).
Methods:
A cross-sectional study with a consecutive sample of asymptomatic subjects was performed between 2014 and 2020. Primary outcomes were time and force parameters (contact time and center of force [CoF] time), in the heel, midfoot, and metatarsal areas, measured using an in-office force platform.
Results:
A total of 156 subjects (312 feet) were included, including 67% of women with a mean age of 47 years. The mean of total contact time was similar in males and females (P = .695) and across BMI (P = .413). Contact time did not show differences by region (P = .648 heel, P = .286 midfoot, and P = .690 metatarsal). CoF time in the heel and metatarsal areas did not change between males and females (P = .288 and P = .879, respectively); meanwhile, it was different in midfoot (P = .002). Maximum force showed a reduction between sexes in the heel (P = .039) but did not in the midfoot and metatarsal areas. By age, differences were detected in the heel and metatarsal areas in females (P = .002 and P = .001) and the metatarsal area in males (P = .001). According to the age groups, total contact time increased in females (P = .001) but not in males (P = .018), and no differences were detected between foot areas. In females, CoF time did not change either foot areas or age groups. In males, CoF time values increased in the midfoot area in the older group (P = .001).
Conclusion:
Time variables did not change by foot region, independent of age, sex, and BMI. Heel maximum force decreased in females, probably linked to adaptive phenomena by aging. The midfoot remains stable, and acts as an undamaged “bridge.” These parameters could be interpreted as normal in asymptomatic subjects.
Level of Evidence:
Level III, diagnostic and prognostic.
Keywords: gait analysis, maximum force, contact time, asymptomatic patients, center of force, force platform, ground reaction force, foot functional parameters
Introduction
The most commonly used complementary studies for foot evaluation (radiography, computed tomography, magnetic resonance imaging, static footprints, etc.) are static, although the foot is one of the most dynamic structures of the human body.6,18,19 Weightbearing computed tomography (CT) is among the major advances. 23
Gait studies have primarily been conducted in biomechanics laboratories, benefiting from ideal conditions such as ample physical space, multiple 3D capture cameras, and kinematics analysis.4,12,16 They still continue to be used, such as cadaveric study, 9 and results of the first metatarsophalangeal arthroplasty. 14
Time-linked and force parameters can be captured with a small force platform, with proven validity and reliability, in a reduced space. Unfortunately, it is not common practice in the orthopaedist’s office.11,20,22
Grundy et al 7 analyzed force and time parameters in the rearfoot, midfoot, and forefoot. Jameson et al 13 provided measurements in young and adolescents. Hillstrom et al 11 reported functional analysis related to foot morphologic types. Mootanah et al 20 observed that gait parameters were modified by anthropometric and foot structure differences and agreed on the need for new data in healthy people.
Few reports analyzed force and time values concerning age and sex, in asymptomatic patients. Kernozek observed a less propulsive gait pattern and reduced velocity in older people. 15 Hessert and Scott compared young and elderly groups. The latter watched flatter feet in older.10,26 Consistently, Morag and Cavanagh 21 linked aging to foot arch drop.
However, there are still controversies. A recent systematic review consistently reported heterogeneity in definitions and normal values. 25
Our hypothesis is that there would be an increase in total foot contact time with aging possibly linked to a decrease in peak force at the heel level, caused by a loss of strength of muscles involved in the first 20% of the stance phase, 1 slowing of the center of force in the midfoot region, and delaying the arrival at the forefoot, losing propulsion in both sexes. A higher body mass index (BMI) could modify this situation. This study aimed to describe the results of force and time parameters during the stance phase of gait in asymptomatic subjects, exploring differences related to agestratified by groups, sex, and BMI using an in-office force platform.
Methods
Design, Setting, and Participants
A retrospective cross-sectional study was performed that included asymptomatic subjects, and volunteers, who were measured with a force platform between 2014 and 2020, in the author's office, in the Autonomous City of Buenos Aires, Argentina.
Data were collected in a prospective registry with a consecutive sample of subjects. Inclusion criteria were asymptomatic subjects who voluntarily consented to undergo a gait study, regardless of the morphologic foot type. The subjects came through the web page, interested in knowing what their footprint was like and whether the gait study would help them to buy better running shoes or whether they needed to wear orthoses; others were companions of patients with pathology and also friends of the sports club. No radiographs were requested.
Exclusion criteria were fracture or surgery in the lower limbs in the last 6 months, rheumatoid arthritis, and/or neurologic diseases and asymptomatic contralateral side in patients with pathology in one foot.
Data Collection
A force platform (TekScan MatScan (Boston, MA, USA) 5 mm thick and an area of 46 cm by 37 cm with 2288 sensors (1.4 sensors/cm2) with 440 Hz transmission speed was used for the measurements. The force platform only captures the stance phase of gait, allowing the analysis of the ground reaction force (GRF) and the center of force (CoF) trajectory, similar to that used in the Framingham study. 8 Force values were normalized as a percentage of the body weight (%BW). 26
For data capture, each individual performed a 2-step baseline protocol that proved to be reproducible in other studies. 2 Five steps of the left foot and 5 of the right foot were measured.14,29 Data collection was performed by 2 assistants, repeating the study from the beginning when it was inadequate or erroneous.
Study Outcomes
Primary outcomes were defined as variables related to time and force, using the 3 Box software (TekScan MatScan), considering 3 areas of the foot—heel, midfoot, and metatarsal, discarding values at the toe level.7,13
The following variables were collected:
• Total contact time (second) (TCT): the time elapsed from the first contact of the foot on the ground to the last contact of the same foot (represents the stance phase of gait).
• Center of force excursion index (CoFEI %): This measures the concavity or medial-lateral deviation of the center of force (CoF) trajectory relative to the width of the foot. Values are positive. 8
• Heel contact time (% total contact): the time elapsed from the first contact to the last contact in the heel area.
• Heel maximum force (%BW): the normalized maximum force load as a percentage of body weight during contact time in the heel area.
• Heel CoF time (% total contact): the time elapsed from the first contact of the force on the heel until it reaches the anterior limit of the Heel Box.
• Midfoot contact time (% total contact): the time elapsed (in percentage) from the first contact to the last contact in the midfoot box, located between the anterior limit of the heel box and the posterior limit of the metatarsal box.
• Midfoot maximum force (%BW): the normalized maximum force load as a percentage of body weight during contact time in the midfoot area, defined between the anterior limit of the heel box and the posterior limit of the metatarsal box.
• Midfoot CoF time (% total contact): the time elapsed by the force from the anterior limit of the heel box until the posterior limit of the metatarsal box.
• Metatarsal contact time (% total contact): the time elapsed from the first contact to the last contact in the metatarsal area.
• Metatarsal maximum force (%BW): the normalized maximum force load as a percentage of body weight during contact time in the metatarsal area.
• Metatarsal COF time (% total contact): the time elapsed by the force from the posterior to the anterior limit of the metatarsal box.
Ethical Considerations
All participants signed the informed consent of confidentiality in order to use data for analysis and publication. Ethics approval was obtained from the institutional review board.
Bias
The biases of the present project are selection bias (reduced by the consecutive sample) and information bias related to a single-day measurement.
Sample Size
An a priori power calculation was performed for the primary outcomes (stance time, midfoot maximum force, heel maximum force, and metatarsal maximum force) using Stata (StataCorp LLC, College Station, TX). The following assumptions were made: (1) power ≥ 0.80; (2) α = 0.05 as a significance level; (3) 2-tailed tests; and (4) the minimum clinically important differences were deemed for each goal. According to this information, 84 feet were needed in the worst scenario.
Statistical Analysis
Categorical data were reported with descriptive statistics. The mean and SD or median and interquartile range (IQR) were calculated for numerical variables and percentage and absolute frequency for categorical variables. Quantile regression was determined for stance time and age. To explore sex differences, t-tests were used for comparisons, with a P value <.05 defined as statistical significance. To explore age differences, multiple χ2 with additional Bonferroni correction for multiple hypotheses (6 categories by decades) were used, with a P value <.001 defined as statistical significance. All analyses were performed using Stata, version 18.0.
Results
A total of 312 feet corresponding to 156 asymptomatic subjects were included, with functional measurements recorded with a force platform. Ages ranged from 20 to 82 years, mean of 47.4 years (SD 16.1), and BMI between 16.9 and 30.9. Females represented 67.3% of the sample.
Table 1 describes the clinical variables regarding baseline characteristics and comparisons according to sex. The mean BMI was higher in males (24.74 vs. 22.56; P = .01), whereas females showed a higher mean age (50.00 vs. 43.11) (P = .0003).
Table 1.
Baseline Characteristics and Comparison of Force and Time Variables Between Sexes in 3 Regions of the Foot (Heel, Midfoot, and Metatarsal) in 156 Asymptomatic Patients. a
| All (n = 312) |
Men (n = 102) |
Women (n = 210) |
P Value | |
|---|---|---|---|---|
| Demographic characteristics | ||||
| Age, y | 47.4 (16.1) | 43.11 (15.21) | 50.00 (15.70) | .0003 |
| Body mass index | 23.27 (2.83) | 24.74 (2.31) | 22.56 (2.79) | .0001 |
| Force and time variables in the heel, midfoot, and metatarsal area | ||||
| Stance time, s | 0.78 (0.08) | 0,78 (0.07) | 0.78 (0.09) | .6959 |
| CoFEI, % | 16.60 (7.16) | 20.07 (7.90) | 14.91 (6.11) | .0001 |
| Heel contact time, % | 63.28 (6.27) | 63.04 (6.74) | 63.39 (6.04) | .6480 |
| Heel maximum force, %BW | 69.34 (8.39) | 70.75 (7.65) | 68.66 (8.66) | .0390 |
| Heel maximum force, kg | 45.08 (9.67) | 53.78 (8.56) | 40.86 (7.00) | .0001 |
| Heel CoF time, % | 20.02 (4.50) | 20.41 (4.64) | 19.83 (4.44) | .2885 |
| Midfoot contact time, % | 66.72 (5.66) | 67.21 (4.82) | 66.48 (6.02) | .2865 |
| Midfoot maximum force, %BW | 15.86 (8.19) | 15.30 (7.29) | 16.13 (8.59) | .4024 |
| Midfoot maximum force, kg | 10.63 (6.68) | 11.60 (5.54) | 10.16 (7.13) | .0740 |
| Midfoot CoF time, % | 25.99 (5.58) | 24.64 (5.25) | 26.64 (5.63) | .0029 |
| Metatarsal contact time, % | 92.62 (3.64) | 92.50 (3.99) | 92.68 (3.47) | .6902 |
| Metatarsal maximum force, %BW | 87.50 (9.57) | 86.50 (9.77) | 88.00 (9.45) | .1946 |
| Metatarsal maximum force, kg | 56.83 (11.64) | 65.74 (10.72) | 52.50 (9.40) | .0001 |
| Metatarsal CoF time, % | 46.25 (5.96) | 46.17 (6.00) | 46.28 (5.96) | .8797 |
Abbreviations: BW, Body Weight; CoF, center of force; CoFEI, center of force excursion index.
Values are mean (SD). Boldface indicates statistical significance (P < .05).
Gender Comparisons
Stance time and CoF excursion index
The mean total contact time in seconds did not differ between males and females: 0.78 seconds (SD 0.07) and 0.78 seconds (SD 0.09), respectively (P = .6959). However, a significant difference (P = .0001) was observed in relation to the mean CoF excursion index (CoFEI): 20.07% (SD 7.9) in men and 14.91% (SD 6.11) in women.
Heel
No differences were observed in heel contact time between the sexes (P = .6480) (Figure 1A). Also, no differences were observed between the sexes in heel CoF time (P = .2885) (Figure 1B). However, a difference (P = .0390) was observed in the mean normalized maximum force: 70.7% (SD 7.65) for males and 68.7% (SD 8.6) for females (Figure 2A). Absolute values of heel maximum force were 53.78 kg (SD 8.5) in males and 40.86 kg (SD 7.00) in females (P = .0001) (Figure 2B).
Figure 1.

Time variables comparing males and females: (A) contact time in percentage by foot regions, no differences were observed in the heel (P = .6480), midfoot (P = .2865), and metatarsal area (P = .6902). (B) Center of force time (in %) by foot regions. No differences were observed in the heel (P = .2885) and metatarsal area (P = .8797). Midfoot (P = .0029) = 24.64% (5.25) in males and 26.64% (5.63) in females in the total sample.
Figure 2.

Force variables comparing males and females: (A) Maximum force by foot regions normalized in percentage of the bodyweight in the heel (P = .0390), midfoot (P = .4024), and metatarsal regions (P = .1946). (B) Maximum force by foot regions in absolute values expressed in kilograms: heel (P = .0001), midfoot (P = .0740), and metatarsal region (P = .0001).
Midfoot
No differences were observed in Midfoot Contact time between the sexes (P = .2865) (Figure 1A). However, the Midfoot CoF time was higher in females than males (26.6% [SD 5.63] and 24.6% [SD 5.25], respectively; P = .0029) (Figure 1B).
The normalized maximum force was similar in both sexes (P = .4024) (Figure 2A). In absolute values of midfoot maximum force, no differences were observed between the sexes (P = .0740) (Figure 2B).
Metatarsal
No differences were observed in metatarsal contact time between sexes (P = .6902) (Figure 1A), neither differences in relation to metatarsal CoF time (P = .8797) (Figure 1B) nor in normalized metatarsal maximum force (P = .1946) (Figure 2A). Absolute values of metatarsal maximum force were 65.74 kg (SD 10.72) in males and 52.50 kg (SD 9.40) in females (P = .0001) (Figure 2B).
Age-Related Comparisons
Based on 6 age groups, the findings were explored in males and females (Tables 2 and 3, respectively).
Table 2.
Foot Functional Parameters (FFP) in Males Stratified by Age (n = 102). a
| Age 20-29 y | Age 30-39 y | Age 40-49 y | Age 50-59 y | Age 60-69 y | Age >70 y | ||
|---|---|---|---|---|---|---|---|
| n=26 | n=20 | n= 18 | n=22 | n=10 | n=6 | P Value | |
| Body mass index | 24.17 (2.21) | 25.85 (1.90) | 24.37 (1.68) | 25.56 (2.74) | 24.28 (2.29) | 22.34 (1.41) |
.0043 |
| Stance time, s | 0.77 (0.07) | 0.75 (0.06) | 0.79 (0.08) | 0.81 (0.05) | 0.83 (0.04) | 0.80 (0.06) | .0183 |
| CoFEI, % | 22.26 (8.51) | 20.95 (5.14) | 24.38 (7.72) | 15.45 (7.03) | 12.70 (5.20) | 24.00 (4.73) | .0001 |
| Heel contact time, % | 61.11 (8.22) | 61.50 (5.96) | 63.22 (4.94) | 62.77 (6.45) | 68.40 (1.34) | 68.16 (8.03) | .0197 |
| Heel maximum force (%BW) | 72.65 (6.85) | 68.35 (6.64) | 70.61 (7.79) | 69.72 (7.71) | 72.10 (11.41) | 72.83 (5.74) | .4355 |
| Heel CoF time, % | 20.15 (6.03) | 20.65 (5.19) | 21.33 (3.06) | 20.90 (4.08) | 19.70 (2.11) | 17.33 (4.84) | .5628 |
| Midfoot contact time, % | 66.69 (5.05) | 67.95 (4.71) | 65.44 (5.23) | 67.18 (4.79) | 68.30 (3.12) | 70.66 (4.21) | .2397 |
| Midfoot maximum force (%BW) | 16.84 (7.77) | 18.95 (7.65) | 12.16 (6.59) | 14.77 (6.80) | 12.50 (5.70) | 12.50 (4.76) | .0311 |
| Midfoot CoF time, % | 24.15 (5.24) | 23.90 (4.87) | 23.55 (4.09) | 23.09 (4.77) | 28.80 (3.67) | 31.33 (6.88) | .0010 |
| Metatarsal contact time, % | 92.92 (4.81) | 92.95 (2.81) | 92.77 (3.22) | 90.22 (4.49) | 92.90 (1.96) | 96.16 (2.92) | .0208 |
| Metatarsal maximum force (%BW) | 91.53 (7.74) | 86.30 (8.69) | 88.72 (9.99) | 83.63 (6.64) | 74.00 (11.02) | 90.00 (9.31) | .0001 |
| Metatarsal CoF time, % | 47.46 (7.04) | 45.85 (5.52) | 47.11 (6.06) | 45.86 (3.97) | 42.60 (5.66) | 46.00 (8.67) | .3849 |
Abbreviations: BW, Body Weight; CoF, center of force; CoFEI, center of force excursion index.
Values are mean (SD). Boldface indicates statistical significance (P < .05).
Table 3.
Foot Functional Parameters (FFP) in Females Stratified by Age (n = 210). a
| Age 20-29 y | Age 30-39 y | Age 40-49 y | Age 50-59 y | Age 60-69 y | Age 70-79 y | ||
|---|---|---|---|---|---|---|---|
| n=26 | n=38 | n=26 | n=48 | n=50 | n=22 | P Value | |
| Body mass index | 20.78 (2.18) |
22.72 (3.12) |
22.08 (3.16) |
22.31 (2.35) |
23.94 (2.73) |
22.35 (2.02) |
.0001 |
| Stance time, s | 0.72 (0.58) |
0.70 (0.07) |
0.79 (0.09) |
0.79 (0.08) |
0.84 (0.08) |
0.82 (0.06) |
.0001 |
| CoFEI, % | 12.15 (5.18) |
16.84 (4.75) |
16.50 (7.04) |
13.16 (4.81) |
15.74 (6.88) |
14.95 (7.15) |
.0069 |
| Heel contact time, % | 65.38 (5.08) |
63.39 (6.99) |
64.92 (4.48) |
62.75 (4.74) |
61.92 (6.45) |
64.00 (7.77) |
.1426 |
| Heel maximum force (%BW) | 74.00 (6.88) |
69.02 (8.15) |
69.65 (9.00) |
69.25 (7.76) |
65.46 (9.29) |
66.59 (8.55) |
.0018 |
| Heel CoF time, % | 21.53 (4.09) |
19.65 (4.43) |
19.00 (4.35) |
20.75 (4.99) |
18.96 (3.68) |
19.09 (4.77) |
.0922 |
| Midfoot contact time, % | 66.46 (7.11) |
66.63 (7.23) |
68.42 (4.75) |
66.81 (4.88) |
65.94 (5.41) |
64.50 (7.10) |
.3441 |
| Midfoot maximum force (%BW) | 12.50 (7.35) |
15.68 (6.60) |
17.96 (9.63) |
17.10 (8.83) |
17.26 (9.39) |
14.36 (8.58) |
.1376 |
| Midfoot CoF time, % | 26.00 (6.01) |
26.73 (6.66) |
27.69 (4.18) |
25.87 (6.13) |
26.32 (4.50) |
28.45 (5.91) |
.4724 |
| Metatarsal contact time, % | 91.57 (3.33) |
92.23 (3.15) |
92.23 (4.17) |
92.39 (3.89) |
93.62 (2.91) |
93.81 (2.97) |
.0725 |
| Metatarsal maximum force (%BW) | 82.34 (12.85) |
85.36 (11.15) |
91.03 (8.31) |
87.89 (8.11) |
89.96 (7.20) |
91.40 (6.15) |
.0010 |
| Metatarsal CoF time, % | 43.53 (6.43) |
46.52 (6.65) |
46.15 (4.96) |
45.66 (5.52) |
48.08 (5.56) |
46.54 (6.23) |
.0562 |
Abbreviations: BW, Body Weight; CoF, center of force; CoFEI, center of force excursion index.
Values are mean (SD). Boldface indicates statistical significance (P < .05).
Stance Time
As shown in Table 2, the mean of total contact time in males presented a progressive not significant increase (P = .0183), whereas in females the difference was significant in the age category 40-49 years compared to 30-39 years (P = .0001) (Table 3). Figure 3 represents the percentile Q50 of Stance Time values, using a generalized linear regression model.
Figure 3.

Stance time quantile regression by age, stratified in (A) males and (B) females. Generalized linear regression model, the percentile Q50 corresponds to a stance time value of 0.78 seconds at 30 years of age and 0.80 seconds at 60 years of age in men, and in women, 0.72 seconds and 0.81 seconds respectively.
Comparisons by Gender and Age
Stance time
Tables 4 and 5 refer to the normal values of total contact time in seconds, according to sex and age. The values corresponding to Q1, Q25, Q50, Q75 and Q99 are shown.
Table 4.
Stance Time Values (in Seconds) by Quantiles (Q1, Q25, Q50, Q75, and Q99) in Females.
| Age | Q1 | Q25 | Q50 | Q75 | Q99 | |
|---|---|---|---|---|---|---|
| 1 | 21.00 | 0.54 | 0.65 | 0.70 | 0.75 | 0.89 |
| 2 | 22.00 | 0.54 | 0.65 | 0.70 | 0.76 | 0.90 |
| 3 | 23.00 | 0.54 | 0.65 | 0.71 | 0.76 | 0.90 |
| 4 | 24.00 | 0.54 | 0.66 | 0.71 | 0.76 | 0.90 |
| 5 | 25.00 | 0.55 | 0.66 | 0.71 | 0.76 | 0.90 |
| 6 | 26.00 | 0.55 | 0.66 | 0.71 | 0.77 | 0.91 |
| 7 | 27.00 | 0.55 | 0.67 | 0.72 | 0.77 | 0.91 |
| 8 | 28.00 | 0.56 | 0.67 | 0.72 | 0.77 | 0.91 |
| 9 | 29.00 | 0.56 | 0.67 | 0.72 | 0.77 | 0.91 |
| 10 | 30.00 | 0.56 | 0.67 | 0.72 | 0.78 | 0.92 |
| 11 | 31.00 | 0.56 | 0.68 | 0.73 | 0.78 | 0.92 |
| 12 | 32.00 | 0.57 | 0.68 | 0.73 | 0.78 | 0.92 |
| 13 | 33.00 | 0.57 | 0.68 | 0.73 | 0.79 | 0.93 |
| 14 | 34.00 | 0.57 | 0.69 | 0.74 | 0.79 | 0.93 |
| 15 | 35.00 | 0.57 | 0.69 | 0.74 | 0.79 | 0.93 |
| 16 | 36.00 | 0.58 | 0.69 | 0.74 | 0.79 | 0.94 |
| 17 | 37.00 | 0.58 | 0.69 | 0.74 | 0.80 | 0.94 |
| 18 | 38.00 | 0.58 | 0.70 | 0.75 | 0.80 | 0.94 |
| 19 | 39.00 | 0.59 | 0.70 | 0.75 | 0.80 | 0.94 |
| 20 | 40.00 | 0.59 | 0.70 | 0.75 | 0.81 | 0.95 |
| 21 | 41.00 | 0.59 | 0.71 | 0.76 | 0.81 | 0.95 |
| 22 | 42.00 | 0.59 | 0.71 | 0.76 | 0.81 | 0.95 |
| 23 | 43.00 | 0.60 | 0.71 | 0.76 | 0.82 | 0.96 |
| 24 | 44.00 | 0.60 | 0.71 | 0.77 | 0.82 | 0.96 |
| 25 | 45.00 | 0.60 | 0.72 | 0.77 | 0.82 | 0.96 |
| 26 | 46.00 | 0.61 | 0.72 | 0.77 | 0.82 | 0.97 |
| 27 | 47.00 | 0.61 | 0.72 | 0.77 | 0.83 | 0.97 |
| 28 | 48.00 | 0.61 | 0.73 | 0.78 | 0.83 | 0.97 |
| 29 | 49.00 | 0.61 | 0.73 | 0.78 | 0.83 | 0.97 |
| 30 | 50.00 | 0.62 | 0.73 | 0.78 | 0.84 | 0.98 |
| 31 | 51.00 | 0.62 | 0.74 | 0.79 | 0.84 | 0.98 |
| 32 | 52.00 | 0.62 | 0.74 | 0.79 | 0.84 | 0.98 |
| 33 | 53.00 | 0.63 | 0.74 | 0.79 | 0.85 | 0.99 |
| 34 | 54.00 | 0.63 | 0.74 | 0.80 | 0.85 | 0.99 |
| 35 | 55.00 | 0.63 | 0.75 | 0.80 | 0.85 | 0.99 |
| 36 | 56.00 | 0.63 | 0.75 | 0.80 | 0.86 | 1.00 |
| 37 | 57.00 | 0.64 | 0.75 | 0.80 | 0.86 | 1.00 |
| 38 | 58.00 | 0.64 | 0.76 | 0.81 | 0.86 | 1.00 |
| 39 | 59.00 | 0.64 | 0.76 | 0.81 | 0.86 | 1.01 |
| 40 | 60.00 | 0.65 | 0.76 | 0.81 | 0.87 | 1.01 |
| 41 | 61.00 | 0.65 | 0.77 | 0.82 | 0.87 | 1.01 |
| 42 | 62.00 | 0.65 | 0.77 | 0.82 | 0.87 | 1.02 |
| 43 | 63.00 | 0.66 | 0.77 | 0.82 | 0.88 | 1.02 |
| 44 | 64.00 | 0.66 | 0.78 | 0.83 | 0.88 | 1.02 |
| 45 | 65.00 | 0.66 | 0.78 | 0.83 | 0.88 | 1.03 |
| 46 | 66.00 | 0.66 | 0.78 | 0.83 | 0.89 | 1.03 |
| 47 | 67.00 | 0.67 | 0.79 | 0.84 | 0.89 | 1.03 |
| 48 | 68.00 | 0.67 | 0.79 | 0.84 | 0.89 | 1.04 |
| 49 | 69.00 | 0.67 | 0.79 | 0.84 | 0.90 | 1.04 |
| 50 | 70.00 | 0.68 | 0.79 | 0.85 | 0.90 | 1.04 |
| 51 | 71.00 | 0.68 | 0.80 | 0.85 | 0.90 | 1.05 |
| 52 | 72.00 | 0.68 | 0.80 | 0.85 | 0.91 | 1.05 |
| 53 | 73.00 | 0.69 | 0.80 | 0.86 | 0.91 | 1.05 |
| 54 | 74.00 | 0.69 | 0.81 | 0.86 | 0.91 | 1.06 |
| 55 | 75.00 | 0.69 | 0.81 | 0.86 | 0.92 | 1.06 |
| 56 | 76.00 | 0.70 | 0.81 | 0.87 | 0.92 | 1.06 |
Table 5.
Stance Time Values (in Seconds) by Quantiles (Q1, Q25, Q50, Q75, and Q99) in Males.
| Age | Q1 | Q25 | Q50 | Q75 | Q99 | |
|---|---|---|---|---|---|---|
| 1 | 18.00 | 0.60 | 0.72 | 0.77 | 0.83 | 0.98 |
| 2 | 19.00 | 0.60 | 0.72 | 0.77 | 0.83 | 0.98 |
| 3 | 20.00 | 0.60 | 0.72 | 0.77 | 0.83 | 0.98 |
| 4 | 21.00 | 0.60 | 0.72 | 0.77 | 0.83 | 0.98 |
| 5 | 22.00 | 0.60 | 0.72 | 0.77 | 0.83 | 0.98 |
| 6 | 23.00 | 0.60 | 0.72 | 0.78 | 0.83 | 0.98 |
| 7 | 24.00 | 0.61 | 0.72 | 0.78 | 0.83 | 0.98 |
| 8 | 25.00 | 0.61 | 0.73 | 0.78 | 0.83 | 0.98 |
| 9 | 26.00 | 0.61 | 0.73 | 0.78 | 0.83 | 0.98 |
| 10 | 27.00 | 0.61 | 0.73 | 0.78 | 0.83 | 0.97 |
| 11 | 28.00 | 0.61 | 0.73 | 0.78 | 0.83 | 0.97 |
| 12 | 29.00 | 0.61 | 0.73 | 0.78 | 0.83 | 0.97 |
| 13 | 30.00 | 0.62 | 0.73 | 0.78 | 0.83 | 0.97 |
| 14 | 31.00 | 0.62 | 0.73 | 0.78 | 0.83 | 0.97 |
| 15 | 32.00 | 0.62 | 0.73 | 0.78 | 0.83 | 0.97 |
| 16 | 33.00 | 0.62 | 0.73 | 0.78 | 0.84 | 0.97 |
| 17 | 34.00 | 0.62 | 0.73 | 0.78 | 0.84 | 0.97 |
| 18 | 35.00 | 0.62 | 0.74 | 0.78 | 0.84 | 0.97 |
| 19 | 36.00 | 0.63 | 0.74 | 0.79 | 0.84 | 0.97 |
| 20 | 37.00 | 0.63 | 0.74 | 0.79 | 0.84 | 0.97 |
| 21 | 38.00 | 0.63 | 0.74 | 0.79 | 0.84 | 0.97 |
| 22 | 39.00 | 0.63 | 0.74 | 0.79 | 0.84 | 0.97 |
| 23 | 40.00 | 0.63 | 0.74 | 0.79 | 0.84 | 0.97 |
| 24 | 41.00 | 0.63 | 0.74 | 0.79 | 0.84 | 0.97 |
| 25 | 42.00 | 0.64 | 0.74 | 0.79 | 0.84 | 0.97 |
| 26 | 43.00 | 0.64 | 0.74 | 0.79 | 0.84 | 0.97 |
| 27 | 44.00 | 0.64 | 0.74 | 0.79 | 0.84 | 0.97 |
| 28 | 45.00 | 0.64 | 0.75 | 0.79 | 0.84 | 0.97 |
| 29 | 46.00 | 0.64 | 0.75 | 0.79 | 0.84 | 0.97 |
| 30 | 47.00 | 0.64 | 0.75 | 0.79 | 0.84 | 0.97 |
| 31 | 48.00 | 0.64 | 0.75 | 0.79 | 0.84 | 0.97 |
| 32 | 49.00 | 0.65 | 0.75 | 0.80 | 0.84 | 0.97 |
| 33 | 50.00 | 0.65 | 0.75 | 0.80 | 0.84 | 0.97 |
| 34 | 51.00 | 0.65 | 0.75 | 0.80 | 0.84 | 0.96 |
| 35 | 52.00 | 0.65 | 0.75 | 0.80 | 0.84 | 0.96 |
| 36 | 53.00 | 0.65 | 0.75 | 0.80 | 0.84 | 0.96 |
| 37 | 54.00 | 0.65 | 0.76 | 0.80 | 0.84 | 0.96 |
| 38 | 55.00 | 0.66 | 0.76 | 0.80 | 0.85 | 0.96 |
| 39 | 56.00 | 0.66 | 0.76 | 0.80 | 0.85 | 0.96 |
| 40 | 57.00 | 0.66 | 0.76 | 0.80 | 0.85 | 0.96 |
| 41 | 58.00 | 0.66 | 0.76 | 0.80 | 0.85 | 0.96 |
| 42 | 59.00 | 0.66 | 0.76 | 0.80 | 0.85 | 0.96 |
| 43 | 60.00 | 0.66 | 0.76 | 0.80 | 0.85 | 0.96 |
| 44 | 61.00 | 0.67 | 0.76 | 0.80 | 0.85 | 0.96 |
| 45 | 62.00 | 0.67 | 0.76 | 0.81 | 0.85 | 0.96 |
| 46 | 63.00 | 0.67 | 0.76 | 0.81 | 0.85 | 0.96 |
| 47 | 64.00 | 0.67 | 0.77 | 0.81 | 0.85 | 0.96 |
| 48 | 65.00 | 0.67 | 0.77 | 0.81 | 0.85 | 0.96 |
| 49 | 66.00 | 0.67 | 0.77 | 0.81 | 0.85 | 0.96 |
| 50 | 67.00 | 0.67 | 0.77 | 0.81 | 0.85 | 0.96 |
| 51 | 68.00 | 0.68 | 0.77 | 0.81 | 0.85 | 0.96 |
| 52 | 69.00 | 0.68 | 0.77 | 0.81 | 0.85 | 0.96 |
| 53 | 70.00 | 0.68 | 0.77 | 0.81 | 0.85 | 0.96 |
| 54 | 71.00 | 0.68 | 0.77 | 0.81 | 0.85 | 0.96 |
| 55 | 72.00 | 0.68 | 0.77 | 0.81 | 0.85 | 0.96 |
| 56 | 73.00 | 0.68 | 0.77 | 0.81 | 0.85 | 0.96 |
| 57 | 74.00 | 0.68 | 0.78 | 0.81 | 0.85 | 0.96 |
| 58 | 75.00 | 0.69 | 0.78 | 0.82 | 0.86 | 0.96 |
| 59 | 76.00 | 0.69 | 0.78 | 0.82 | 0.86 | 0.96 |
| 60 | 77.00 | 0.69 | 0.78 | 0.82 | 0.86 | 0.96 |
| 61 | 78.00 | 0.69 | 0.78 | 0.82 | 0.86 | 0.96 |
| 62 | 79.00 | 0.69 | 0.78 | 0.82 | 0.86 | 0.96 |
| 63 | 80.00 | 0.69 | 0.78 | 0.82 | 0.86 | 0.96 |
| 64 | 81.00 | 0.70 | 0.78 | 0.82 | 0.86 | 0.96 |
| 65 | 82.00 | 0.70 | 0.78 | 0.82 | 0.86 | 0.96 |
Heel
Related to heel contact time, no differences were observed between age groups, neither males (P = .0197) nor females (P = .1426) (Figure 4A). No differences were observed in heel CoF time for males (P = .5628) or females (P = .0922) (Figure 5A). The normalized heel maximum force in males did not show differences between age groups (P = .4355); at the same time, in females, a decrease was observed from a mean of 74% to 65% respectively (P = .001) between 20 and 29 years, compared with 60-69 years (Figure 6A) (Tables 2 and 3).
Figure 4.

Contact time in percentage in the entire sample. The x-axis is age (in years), and the y-axis is the value in percentage (%). Stratified by areas: (A) heel, (B) midfoot, and (C) metatarsal.
Figure 5.

Center of force (CoF) time in the entire sample. The x-axis is age (in years), and the y-axis is the value in percentage (%). Stratified by areas: (A) heel, (B) midfoot, and (C) metatarsal.
Figure 6.

Maximum force normalized in % of the body weight across the entire sample. The x-axis is age (in years), and the y-axis is the value in percentage (%BW). Stratified by areas: heel (A), midfoot (B), and metatarsal (C).
Midfoot
No differences were observed in midfoot contact time comparing the 6 age groups either for males (P = .2397) or females (P = .3441) (Figure 4B).
The midfoot CoF time showed an increase in relation to the age groups in males (P = .0010), from a mean of 23% to 29% comparing the 50-59 years age group to the 60-69 years age group, whereas in females, no differences were observed (P = .4724) (Figure 5B).
For the normalized midfoot maximum force, no differences were observed between age groups for both males (P = .0311) and females (P = .1376) (Figure 6B) (Tables 2 and 3).
Metatarsal
No differences were observed in metatarsal contact time comparing the 6 age groups, neither for males (P = .0208) nor females (P = .0725) (Figure 4C). There were also no differences between age groups for metatarsal CoF time either in males (P = .3849) or females (P = .0562) (Figure 5C).
In normalized metatarsal maximum force, differences were observed concerning age variability. In females (P = .0010), an increase from a mean of 82% to 91% in the 20-29 years age group compared to the 70-79 years (P = .001) was observed, whereas in males (P = .0001), the difference is reflected by a decrease from a mean of 92% to 84% comparing the 20-29 years group to 50-59 years (P = .0001) (Figure 6C) (Tables 2 and 3).
Comparisons by BMI
Stance time
The mean total contact time did not differ across the range of BMI values: from 16.9% to 30.9% in the total sample (P = .413) (Figure 7).
Figure 7.
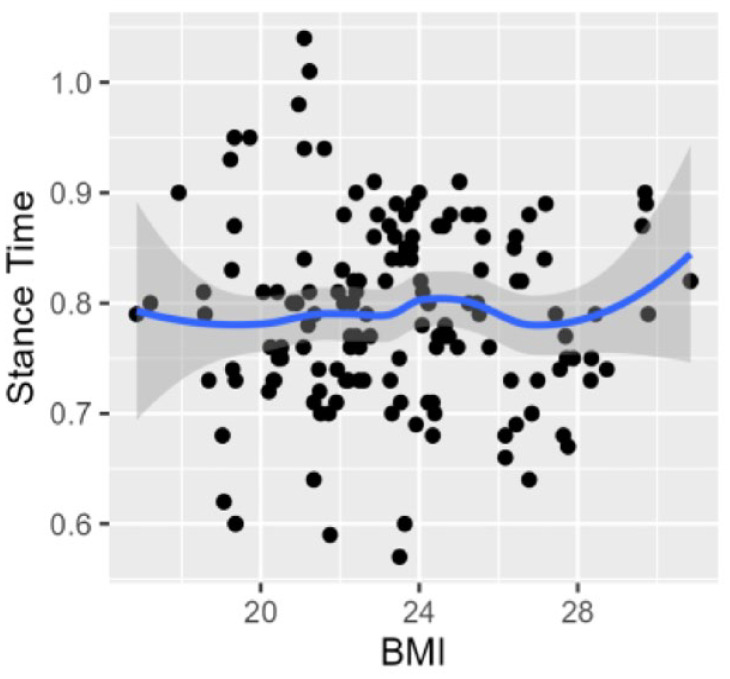
Stance time (total contact time in seconds) values by the body mass index (range 16.9%-30.9%) in the total sample.
Discussion
The mean TCT values were identical in asymptomatic subjects comparing males and females (0.78 seconds), and division by age groups showed an increase with age for both sexes, representing a slower walking speed.
The TCT increase was reported in older patients, although including foot pathologies. 26 A 1995 study observed a longer TCT in the elderly linked to reduced propulsion. 15 However, there are controversies regarding the results. No changes in TCT were observed comparing young and old people, although the small sample could underpower the results. 10 No differences in TCT were found when foot types were compared. 11
In the present sample, surprisingly no changes were observed in TCT related to the entire range of BMI values (16.9%-30.9%) (Figure 7).
Regarding the force trajectory (CoFEI), our findings could be linked to foot types, gender, and age, as well as individual variation related to musculoskeletal factors, soft tissues, stiffness or flexibility, etc., which exceeded the objective of the present study.8,20
Contact Time and CoF Time by Region
High interobserver reliability was reported for contact and CoF time values, by regions and total foot. 5
In the present sample, contact and CoF time by regions (heel, midfoot, and metatarsal) did not change in the different age groups, sex, and BMI. These findings imply that there could be a stable and reproducible gait time pattern for asymptomatic subjects in this geographic region. This consistency was not previously reported stratified by age groups and could be helpful to compare with pathologic conditions or for analyzing the results of the interventions. Similar results were reported among children and adolescents as well. 13
The heel CoF time (about 20% of TCT) is related to the power of the stabilizing muscles (gluteus maximum, vastus medialis, and lateralis), the sustainability of the body during gait, and foot dorsiflexor muscles after the initial contact phase.1,3,11
The metatarsal CoF time value (close to 46%) will depend on the ability of the center of force to reach the metatarsal area and the propulsive force generated mainly by the foot plantarflexors.1,3 Both values (heel and metatarsal CoF time) are mainly related to muscle strength and could be useful for detecting pathologic conditions or muscle weakness. Also, they could be predictors of instability and fall risk, especially in older people.12,15 Moreover, the CoF time values could be modified in lower limb length discrepancy. 22
The midfoot CoF time value was higher in females (24.6% vs 26.6% M/F) and there was a tendency to increase by aging without significance in both sexes although the older groups in males may be underpowered. An intact midfoot acts like a “suspension bridge” where forces transit toward the metatarsal region. 3 The importance of the entire structure was previously reported.28,30,31
However, the results on arch height are controversial. A decrease in the internal arch height and thus a change in the CoF time value was observed over the years. 21 Similar results were reported in older patients including hallux valgus patients. 26 Those results differ from other authors 10 and the present study, where no differences between young and old subjects were observed in the midfoot contact and CoF time values. Differences according to foot type were also reported. 20 A detailed description of biomechanical changes in normal and flat feet was published in 2003. 28
Maximum Force by Region
The normalized heel maximum force represents the strength of the stabilizing muscles after the initial contact during the stance face. In females, a reduction was observed comparing age groups (from 74% to 65%), which could be related to a loss of muscle strength. 1
The midfoot maximum force remained stable (average 15%) regardless of sex, age, and BMI, in both sexes over the age groups (Figure 6B). This consistency is probably linked to a preserved foot structure and muscle sustainability. Similar results were reported, although with a small sample size. 10
The metatarsal maximum force represents the strength of plantar flexors, mainly the triceps surae, which provide support and propulsion at the end of the stance face. 17 No differences were observed between the sexes. However, related to age groups, inverse results were observed with a decrease in males (91%-84%) and an increase in females (82%-91%). This could be explained as an adaptive phenomenon, and the sample size was underpowered in the last 2 groups of men.
Several limitations of this study must be recognized. First, it is a single-center study, which undermines external validity in other populations with different characteristics. Second, the age subgroups were not homogeneous, with a small number of subjects aged ≥75 years because of the difficulty in finding asymptomatic elderly patients. Third, the measurement instrument (force platform) is limited to capturing ground reaction force, leaving out kinematics, electromyography, radiologic studies, and gait velocity.24,27
Nevertheless, it has great strengths such as the number of subjects included in the sample, the balanced ratio between men and women, and the feasibility and simplicity of measurements, performed in a specialist’s outpatient clinic without ionizing radiation.
Undoubtedly, future studies will be necessary to compare morphologic foot types with radiography and force trajectory (CoFEI), pathologic conditions, and foot subregions.
Conclusion
The total contact time increases over time, significantly in women, with a trend in men.
Contact time and CoF time did not change by foot region independent of age, sex, and BMI. Meanwhile, the heel maximum force decreased (mainly in females), probably linked to adaptive phenomena by aging and anthropomorphic differences.
Midfoot values remained stable with aging. It could be explained by a healthy foot (structure, muscles, and joint functionality). The midfoot area acts as an intact “bridge” where forces are transferred to the metatarsal area during the stance phase of gait.
The clinical utility of this information was to obtain results in asymptomatic subjects performed in a specialist’s outpatient clinic, using a force platform, without ionizing radiation, and could be interpreted as normal values.
Supplemental Material
Supplemental material, sj-pdf-1-fao-10.1177_24730114231198524 for Age, Gender, Body Mass Index, and Foot Loading During Gait by Jorge Luis Alberto Castellini, María Florencia Grande Ratti and Débora Mirta Chan in Foot & Ankle Orthopaedics
Acknowledgments
We would like to thank Susana Gomez and Celeste Otazúa for their collaboration in capturing and processing data. Also, we would like to thank all volunteer participants in the study.
Footnotes
Ethical Approval: Ethical approval for this study was obtained from the institutional review board (IRB00010193/5063).
The author(s) declared no potential conflicts of interest with respect to the research, authorship, and/or publication of this article. ICMJE forms for all authors are available online.
Funding: The author(s) received no financial support for the research, authorship, and/or publication of this article.
ORCID iD: Jorge Luis Alberto Castellini, MD,  https://orcid.org/0000-0002-5665-480X
References
- 1. Anderson FC, Pandy MG. Individual muscle contributions to support in normal walking. Gait Posture. 2003;17(2):159-169. [DOI] [PubMed] [Google Scholar]
- 2. Bus SA, de Lange A. A comparison of the 1-step, 2-step, and 3-step protocols for obtaining barefoot plantar pressure data in the diabetic neuropathic foot. Clin Biomech (Bristol, Avon). 2005;20(9):892-899. doi: 10.1016/j.clinbiomech.2005.05.004 [DOI] [PubMed] [Google Scholar]
- 3. Castellini JL. Parametros biomecanicos de la funcion del pie medidos en el consultorio del especialista en Ortopedia y Traumatologia [Biomechanical parameters of foot function measured in an orthopedic and traumatology specialist’s office]. Rev Asoc Argent Ortop Argent. 2022;87(6):756-764. [Google Scholar]
- 4. Chiu MC, Wang MJ. The effect of gait speed and gender on perceived exertion, muscle activity, joint motion of lower extremity, ground reaction forces and heart rate during normal walking. Gait Posture. 2007;25(3):385-392. doi: 10.1016/j.gaitpost.2006.05.008 [DOI] [PubMed] [Google Scholar]
- 5. Cornwall MW, McPoil TG. Velocity of the center of pressure during walking. J Am Podiatr Med Assoc. 2000;90(7):334-338. doi: 10.7547/87507315-90-7-334 [DOI] [PubMed] [Google Scholar]
- 6. Elftman H. Dynamic structure of the human foot. Artif Limbs. 1969;13(1):49-58. [PubMed] [Google Scholar]
- 7. Grundy M, Tosh PA, McLeish RD, Smidt L. An investigation of the centers of pressure under the foot while walking. J Bone Joint Surg Br. 1975;57(1):98-103. [PubMed] [Google Scholar]
- 8. Hagedorn TJ, Dufour AB, Golightly YM, et al. Factors affecting center of pressure in older adults: the Framingham Foot Study. J Foot Ankle Res. 2013;6(1):18. doi: 10.1186/1757-1146-6-18 [DOI] [PMC free article] [PubMed] [Google Scholar]
- 9. Henry JK, Hoffman J, Kim J, et al. The foot and ankle kinematics of a simulated progressive collapsing foot deformity during stance phase: a cadaveric study. Foot Ankle Int. 2022;43(12):1577-1586. doi: 10.1177/10711007221126736 [DOI] [PubMed] [Google Scholar]
- 10. Hessert MJ, Vyas M, Leach J, Hu K, Lipsitz LA, Novak V. Foot pressure distribution during walking in young and old adults. BMC Geriatr. 2005;5:8. doi: 10.1186/1471-2318-5-8 [DOI] [PMC free article] [PubMed] [Google Scholar]
- 11. Hillstrom HJ, Song J, Kraszewski AP, et al. Foot type biomechanics part 1: Structure and function of the asymptomatic foot. Gait Posture. 2013;37(3):445-451. doi: 10.1016/j.gaitpost.2012.09.007 [DOI] [PMC free article] [PubMed] [Google Scholar]
- 12. Huang SC, Lu TW, Chen HL, Wang TM, Chou LS. Age and height effects on the center of mass and center of pressure inclination angles during obstacle-crossing. Med Eng Phys. 2008;30(8):968-975. doi: 10.1016/j.medengphy.2007.12.005 [DOI] [PubMed] [Google Scholar]
- 13. Jameson G, Anderson J, Davis R, Davids J, Christopher L. A comparison of methods for using center of pressure progression in the classification of foot deformity. Gait Posture. 2006;24:583-584. [Google Scholar]
- 14. Jorsboe PH, Speedtsberg MB, Kallemose T, Bencke J, Penny JO. Plantar forces mid-term after hemiarthroplasty with HemiCAP for hallux rigidus. Foot Ankle Surg. 2020;26(4):432-438. doi: 10.1016/j.fas.2019.05.012 [DOI] [PubMed] [Google Scholar]
- 15. Kernozek TW, LaMott EE. Comparisons of plantar pressures between the elderly and young adults. Gait Posture. 1995;3(3):143-148. [Google Scholar]
- 16. Kitaoka HB, Crevoisier XM, Hansen D, Katajarvi B, Harbst K, Kaufman KR. Foot and ankle kinematics and ground reaction forces during ambulation. Foot Ankle Int. 2006;27(10):808-813. doi: 10.1177/107110070602701010 [DOI] [PubMed] [Google Scholar]
- 17. Liu MQ, Anderson FC, Schwartz MH, Delp SL. Muscle contributions to support and progression over a range of walking speeds. J Biomech. 2008;41(15):3243-3252. doi: 10.1016/j.jbiomech.2008.07.031 [DOI] [PMC free article] [PubMed] [Google Scholar]
- 18. Mayich DJ, Novak A, Vena D, Daniels TR, Brodsky JW. Gait analysis in orthopedic foot and ankle surgery—topical review, part 1: Principles and uses of gait analysis. Foot Ankle Int. 2014;35(1):80-90. doi: 10.1177/1071100713508394 [DOI] [PubMed] [Google Scholar]
- 19. Menz HB. Alternative techniques for the clinical assessment of foot pronation. J Am Podiatr Med Assoc. 1998;88(3):119-129. doi: 10.7547/87507315-88-3-119 [DOI] [PubMed] [Google Scholar]
- 20. Mootanah R, Song J, Lenhoff MW, et al. Foot type biomechanics part 2: Are structure and anthropometrics related to function? Gait Posture. 2013;37(3):452-456. doi: 10.1016/j.gaitpost.2012.09.008 [DOI] [PMC free article] [PubMed] [Google Scholar]
- 21. Morag E, Cavanagh PR. Structural and functional predictors of regional peak pressures under the foot during walking. J Biomech. 1999;32(4):359-370. doi: 10.1016/s0021-9290(98)00188-2 [DOI] [PubMed] [Google Scholar]
- 22. O’Toole GC, Makwana NK, Lunn J, Harty J, Stephens MM. The effect of leg length discrepancy on foot loading patterns and contact times. Foot Ankle Int. 2003;24(3):256-259. doi: 10.1177/107110070302400310 [DOI] [PubMed] [Google Scholar]
- 23. Richter M, Lintz F, de Cesar Netto C, Barg A, Burssens A. Results of more than 11,000 scans with weightbearing CT—impact on costs, radiation exposure, and procedure time. Foot Ankle Surg. 2020;26(5):518-522. doi: 10.1016/j.fas.2019.05.019 [DOI] [PubMed] [Google Scholar]
- 24. Roislien J, Skare O, Gustavsen M, Broch NL, Rennie L, Opheim A. Simultaneous estimation of effects of gender, age and walking speed on kinematic gait data. Gait Posture. 2009;30(4):441-445. doi: 10.1016/j.gaitpost.2009.07.002 [DOI] [PubMed] [Google Scholar]
- 25. Rosemberg DL, Gustafson JA, Bordignon G, Bohl DD, Leporace G, Metsavaht L. Biokinetic evaluation of hallux valgus during gait: a systematic review. Foot Ankle Int. 2023;44(8):763-777. doi: 10.1177/10711007231166667 [DOI] [PubMed] [Google Scholar]
- 26. Scott G, Menz HB, Newcombe L. Age-related differences in foot structure and function. Gait Posture. 2007;26(1):68-75. [DOI] [PubMed] [Google Scholar]
- 27. Siegel KL, Kepple TM, O’Connell PG, Gerber LH, Stanhope SJ. A technique to evaluate foot function during the stance phase of gait. Foot Ankle Int. 1995;16(12):764-770. doi: 10.1177/107110079501601205 [DOI] [PubMed] [Google Scholar]
- 28. Van Boerum DH, Sangeorzan BJ. Biomechanics and pathophysiology of flat foot. Foot Ankle Clin. 2003;8(3):419-430. [DOI] [PubMed] [Google Scholar]
- 29. van der Leeden M, Dekker JH, Siemonsma PC, Lek-Westerhof SS, Steultjens MP. Reproducibility of plantar pressure measurements in patients with chronic arthritis: a comparison of one-step, two-step, and three-step protocols and an estimate of the number of measurements required. Foot Ankle Int. 2004;25(10):739-744. doi: 10.1177/107110070402501008 [DOI] [PubMed] [Google Scholar]
- 30. Welte L, Kelly LA, Lichtwark GA, Rainbow MJ. Influence of the windlass mechanism on arch-spring mechanics during dynamic foot arch deformation. J R Soc Interface. 2018;15(145):20180270. doi: 10.1098/rsif.2018.0270 [DOI] [PMC free article] [PubMed] [Google Scholar]
- 31. Winter DA, Patla AE, Frank JS, Walt SE. Biomechanical walking pattern changes in the fit and healthy elderly. Phys Ther. 1990;70(6):340-347. doi: 10.1093/ptj/70.6.340 [DOI] [PubMed] [Google Scholar]
Associated Data
This section collects any data citations, data availability statements, or supplementary materials included in this article.
Supplementary Materials
Supplemental material, sj-pdf-1-fao-10.1177_24730114231198524 for Age, Gender, Body Mass Index, and Foot Loading During Gait by Jorge Luis Alberto Castellini, María Florencia Grande Ratti and Débora Mirta Chan in Foot & Ankle Orthopaedics